Notebookcheck Logo

Intel Iris Plus Graphics 655

Intel Iris Plus Graphics 655

英特尔Iris Plus图形655(GT3e)是2017年9月发布的处理器集成显卡。作为英特尔Iris Graphics 650(Kaby Lake)的继承者,Iris Plus Graphics 655用于28瓦Coffee Lake-U型号。最大的区别是128 MB的双倍eDRAM缓存。与Iris Graphics 650相比,不应有任何明显变化。

所谓的Kaby Lake GPU的GT3e版本仍然有48个执行单元(EU),根据型号的不同,它可以达到1200 MHz(之前是1100 MHz)。除了eDRAM缓存之外,Iris 655还可以通过处理器接口访问系统内存(2x 64位DDR3L-2133 / DDR4-2400)。

与15瓦型号的Iris Plus 640相比,Iris 655仅具有略高的最大时钟频率以及几乎两倍的TDP,从而可以更好地利用Turbo Boost的潜力。

性能

Iris Plus Graphics 655的确切性能取决于CPU型号,因为最大时钟以及L3缓存的大小可能略有不同。系统内存(DDR3 / DDR4)也会影响性能。

最快的芯片是Core i7-8559U等高频率Core i7型号。根据游戏的不同,Iris Plus 655可能与专用的GeForce 930M或GeForce 940MX相媲美,可以在低至中等设置的现代游戏中流传的运行游戏。

功能

重新设计的视频引擎现在完全支持H.265 / HEVC视频的硬件解码。然而,与Skylake相反,Kaby Lake现在还可以解码具有10位色深的H.265 / HEVC Main 10以及Google的VP9编解码器。可通过DP 1.2 / eDP 1.3(最高3840 x 2160 @ 60 Hz)输出视频,而旧的1.4a标准也支持HDMI。可以通过DisplayPort转换器添加HDMI 2.0输出。GPU可以同时驱动多达三个显示器。

能耗

Iris Plus Graphics 655用于28瓦处理器,因此适用于中小型笔记本电脑。

Gen. 9.5 Series

Iris Plus Graphics 655 48 @ 0.3 - 1.2 GHz
Iris Plus Graphics 650 48 @ 0.3 - 1.1 GHz64/128 Bit
Iris Plus Graphics 645 48 @ 0.3 - 1.15 GHz
Iris Plus Graphics 640 48 @ 0.3 - 1.05 GHz64/128 Bit
UHD Graphics 630 24 @ 0.3 - 1.15 GHz64/128 Bit
UHD Graphics P630 24 @ 0.3 - 1.2 GHz64/128 Bit
HD Graphics 630 24 @ 0.3 - 1.15 GHz64/128 Bit
HD Graphics P630 24 64/128 Bit
UHD Graphics 620 24 @ 0.3 - 1.15 GHz
HD Graphics 620 24 @ 0.3 - 1.05 GHz64/128 Bit
UHD Graphics 617 24 @ 0.3 - 1.15 GHz64/128 Bit
UHD Graphics 615 24 @ 0.3 - 1 GHz64/128 Bit
HD Graphics 615 24 @ 0.3 - 1.05 GHz64/128 Bit
CodenameKaby Lake GT3e
ArchitectureGen. 9.5 Kaby Lake
Pipelines48 - unified
Core Speed300 - 1200 (Boost) MHz
Memory TypeDDR3/DDR4
Shared Memoryyes
APIDirectX 12_1, OpenGL 4.5
technology14 nm
FeaturesQuickSync
Date of Announcement01.09.2017
CPU in Iris Plus Graphics 655GPU Base SpeedGPU Boost / Turbo
Intel Core i7-8559U4 x 2700 MHz, 28 W300 MHz1200 MHz
Intel Core i5-8269U4 x 2600 MHz, 28 W300 MHz1100 MHz
Intel Core i5-8279U4 x 2400 MHz, 28 W300 MHz1150 MHz
min. - max.300 MHz1050 - 1200 MHz

Benchmarks

Performance Rating - 3DMark 11 + Fire Strike + Time Spy
0.9 pt (3%)
AMD Radeon HD 8180
0.06605 -93%
...
0.798 -12%
0.802 -11%
AMD FirePro W4170M
0.804 -11%
AMD Radeon HD 8850M
0.84 -7%
0.859 -5%
AMD Radeon R8 M365DX
0.866 -4%
Intel Iris Pro Graphics 580
0.867 -4%
AMD Radeon R7 M275DX
0.88 -3%
0.888 -2%
Intel Iris Plus Graphics 655
0.903
0.909 1%
0.91 1%
NVIDIA Maxwell GPU Surface Book
0.945 5%
NVIDIA GeForce GT 755M
0.959 6%
AMD FirePro W5130M
0.961 6%
Intel Iris Plus Graphics G4 (Ice Lake 48 EU)
0.968 7%
0.988 9%
Intel UHD Graphics Xe 750 32EUs (Rocket Lake)
0.991 10%
1.002 11%
...
21.1 2237%
max:
33.3 3588%
0%
100%
3DMark - 3DMark Time Spy Score
min: 348     avg: 647     median: 684 (2%)     max: 722 Points
3DMark - 3DMark Time Spy Graphics
min: 301     avg: 570     median: 604.5 (2%)     max: 633 Points
Intel UHD Graphics 605
113 -80%
...
452.3 -21%
AMD Radeon 610M
458.3 -20%
AMD Radeon R7 M445
471 -17%
493 -14%
Intel UHD Graphics Xe 750 32EUs (Rocket Lake)
539 -5%
550 -4%
AMD Radeon RX Vega 6 (Ryzen 2000/3000)
552 -3%
Intel Iris Plus Graphics 650
555 -3%
Intel Iris Graphics 550
558 -2%
Intel Iris Plus Graphics 655
570
577 1%
614 8%
NVIDIA Quadro M600M
631 11%
Intel Iris Plus Graphics G4 (Ice Lake 48 EU)
639 12%
650 14%
Intel UHD Graphics Xe 32EUs (Tiger Lake-H)
670 18%
AMD Radeon RX Vega 8 (Ryzen 2000/3000)
673 18%
AMD Radeon RX Vega 10
724 27%
733 29%
...
19434 3309%
max:
36485 6301%
0%
100%
3DMark - 3DMark Ice Storm Unlimited Graphics
min: 131607     avg: 139716     median: 137266 (16%)     max: 152727 Points
3DMark - 3DMark Ice Storm Extreme Graphics
min: 57033     avg: 72655     median: 71073 (9%)     max: 89859 Points
3DMark - 3DMark Cloud Gate Score
min: 6769     avg: 10798     median: 11622 (12%)     max: 13037 Points
3DMark - 3DMark Cloud Gate Graphics
min: 6498     avg: 13736     median: 14343 (4%)     max: 16698 Points
3DMark - 3DMark Fire Strike Standard Score
min: 852     avg: 1703     median: 1850 (3%)     max: 2040 Points
3DMark - 3DMark Fire Strike Standard Graphics
min: 920     avg: 1836     median: 1983 (2%)     max: 2260 Points
3DMark - 3DMark Ice Storm Graphics
min: 85405     avg: 107151     median: 110302 (13%)     max: 122594 Points
3DMark 11 - 3DM11 Performance Score
min: 1548     avg: 2942     median: 3180.5 (4%)     max: 3349 Points
3DMark 11 - 3DM11 Performance GPU
min: 1365     avg: 2707     median: 2894 (2%)     max: 3081 Points
171.8 -94%
...
NVIDIA GeForce GT 750M
2549 -6%
NVIDIA Maxwell GPU Surface Book
2577 -5%
2582 -5%
2595 -4%
2615 -3%
2658 -2%
AMD Radeon R6 M340DX
2681 -1%
2693 -1%
2702 0%
Intel Iris Plus Graphics 655
2707
2709 0%
2729 1%
Intel Iris Plus Graphics 650
2762 2%
Intel Iris Pro Graphics 6200
2766 2%
NVIDIA GeForce GT 755M
2801 3%
AMD Radeon R8 M365DX
2817 4%
2821 4%
2872 6%
NVIDIA Quadro M600M
2911 8%
...
59943 2114%
max:
106023 3817%
0%
100%
3DMark Vantage
3DM Vant. Perf. total +
3DMark Vantage - 3DM Vant. Perf. total
min: 12093     avg: 12287     median: 12287 (4%)     max: 12481 Points
3DM Vant. Perf. GPU no PhysX +
3DMark Vantage - 3DM Vant. Perf. GPU no PhysX
min: 10337     avg: 10514     median: 10513.5 (6%)     max: 10690 Points
ATI Radeon HD 3200
62 -99%
...
AMD Radeon RX Vega 10
9909 -6%
NVIDIA GeForce GTX 280M SLI
9947 -5%
10052 -4%
10067 -4%
AMD Radeon Pro WX 3100
10150 -3%
10211 -3%
10234 -3%
AMD Radeon 540X
10287 -2%
NVIDIA GeForce GTX 285M SLI
10511 0%
Intel Iris Plus Graphics 655
10514
AMD FirePro M5100
10561 0%
10701 2%
10755 2%
10861 3%
Intel UHD Graphics Xe 32EUs (Tiger Lake-H)
10953 4%
NVIDIA Quadro M600M
10958 4%
11019 5%
11047 5%
AMD Radeon RX Vega 9
11100 6%
...
132443 1160%
max:
170928 1526%
0%
100%
3DMark 05 - 3DMark 05 - Standard
22740 Points (25%)
Intel Graphics Media Accelerator (GMA) 500
133.4 -99%
...
21185 -7%
AMD Radeon R7 M445
21189 -7%
21266 -6%
21287 -6%
NVIDIA GeForce GT 745M
21505 -5%
NVIDIA GeForce GTX 285M SLI
21611 -5%
21991 -3%
22463 -1%
22649 0%
Intel Iris Plus Graphics 655
22740
NVIDIA GeForce GTX 950M
22798 0%
NVIDIA GeForce GTX 760M
22852 0%
23057 1%
23434 3%
23752 4%
AMD Radeon HD 8790M
23810 5%
23823 5%
24001 6%
24337 7%
...
61850 172%
max:
87172 283%
0%
100%
3DMark 06 3DMark 06 - Standard 1280x1024 +
3DMark 06
min: 17176     avg: 17885     median: 17885 (23%)     max: 18594 Points
Unigine Valley 1.0 - Unigine Valley 1.0 DX
8.2 fps (3%)
SPECviewperf 12
specvp12 sw-03 +
SPECviewperf 12 - specvp12 sw-03
28.2 fps (7%)
specvp12 snx-02 +
SPECviewperf 12 - specvp12 snx-02
2.1 fps (0%)
specvp12 showcase-01 +
SPECviewperf 12 - specvp12 showcase-01
10.3 fps (2%)
specvp12 mediacal-01 +
SPECviewperf 12 - specvp12 mediacal-01
4.6 fps (1%)
specvp12 maya-04 +
SPECviewperf 12 - specvp12 maya-04
20.4 fps (6%)
specvp12 energy-01 +
SPECviewperf 12 - specvp12 energy-01
0.3 fps (0%)
specvp12 creo-01 +
SPECviewperf 12 - specvp12 creo-01
14.9 fps (6%)
specvp12 catia-04 +
SPECviewperf 12 - specvp12 catia-04
18.8 fps (3%)
specvp12 3dsmax-05 +
SPECviewperf 12 - specvp12 3dsmax-05
18.1 fps (3%)
SPECviewperf 13 specvp13 sw-04 +
SPECviewperf 13 - specvp13 sw-04
34.6 fps (9%)
specvp13 snx-03 +
SPECviewperf 13 - specvp13 snx-03
3.8 fps (0%)
specvp13 showcase-02 +
SPECviewperf 13 - specvp13 showcase-02
10.3 fps (2%)
specvp13 medical-02 +
SPECviewperf 13 - specvp13 medical-02
3.8 fps (1%)
specvp13 maya-05 +
SPECviewperf 13 - specvp13 maya-05
25.9 fps (3%)
specvp13 energy-02 +
SPECviewperf 13 - specvp13 energy-02
1.1 fps (0%)
specvp13 creo-02 +
SPECviewperf 13 - specvp13 creo-02
19.6 fps (3%)
specvp13 catia-05 +
SPECviewperf 13 - specvp13 catia-05
26.4 fps (3%)
specvp13 3dsmax-06 +
SPECviewperf 13 - specvp13 3dsmax-06
18.2 fps (3%)
SPECviewperf 2020 specvp2020 solidworks-05 4k +
specvp2020 snx-04 4k +
specvp2020 medical-03 4k +
SPECviewperf 2020 - specvp2020 medical-03 4k
1.8 fps (2%)
specvp2020 maya-06 4k +
SPECviewperf 2020 - specvp2020 maya-06 4k
32.7 fps (5%)
specvp2020 energy-03 4k +
SPECviewperf 2020 - specvp2020 energy-03 4k
1.1 fps (0%)
specvp2020 creo-03 4k +
SPECviewperf 2020 - specvp2020 creo-03 4k
12.1 fps (6%)
specvp2020 catia-06 4k +
SPECviewperf 2020 - specvp2020 catia-06 4k
6.3 fps (4%)
specvp2020 3dsmax-07 4k +
SPECviewperf 2020 - specvp2020 3dsmax-07 4k
8.4 fps (3%)
Cinebench R10 Cinebench R10 Shading (32bit) +
Cinebench R10 - Cinebench R10 Shading (32bit)
min: 7836     avg: 9544     median: 10263 (7%)     max: 10533 points
Cinebench R11.5 Cinebench R11.5 OpenGL 64 Bit +
Cinebench R11.5 - Cinebench R11.5 OpenGL 64 Bit
min: 50.25     avg: 51.4     median: 51.6 (18%)     max: 52.2 fps
Cinebench R15
Cinebench R15 OpenGL 64 Bit +
Cinebench R15 - Cinebench R15 OpenGL 64 Bit
min: 33.91     avg: 67     median: 74 (4%)     max: 88 fps
Cinebench R15 OpenGL Ref. Match 64 Bit +
Cinebench R15 - Cinebench R15 OpenGL Ref. Match 64 Bit
min: 97.8     avg: 98.1     median: 97.8 (98%)     max: 99.3 %
GFXBench 3.1 - GFXBench Manhattan ES 3.1 Offscreen
min: 43.1     avg: 2387     median: 2387.1 (50%)     max: 4731 fps
GFXBench 3.0 - GFXBench 3.0 Manhattan Offscreen
199.6 fps (12%)
GFXBench (DX / GLBenchmark) 2.7
GFXBench T-Rex HD Offscreen C24Z16 +
GFXBench (DX / GLBenchmark) 2.7 - GFXBench T-Rex HD Offscreen C24Z16
min: 199.6     avg: 6375     median: 6375.3 (51%)     max: 12551 fps
LuxMark v2.0 64Bit - LuxMark v2.0 Room GPU
min: 359     avg: 419.5     median: 419.5 (2%)     max: 480 Samples/s
LuxMark v2.0 64Bit - LuxMark v2.0 Sala GPU
min: 882     avg: 1038     median: 1038 (2%)     max: 1194 Samples/s
ComputeMark v2.1 - ComputeMark v2.1 Result
min: 1584     avg: 1713     median: 1712.5 (2%)     max: 1841 points
Power Consumption - Furmark Stress Test Power Consumption - external Monitor *
min: 28.9     avg: 37.4     median: 39.2 (6%)     max: 42.4 Watt
0510152025303540455055Tooltip
Power Consumption - The Witcher 3 Power Consumption - external Monitor *
min: 35.3     avg: 40.6     median: 39.4 (6%)     max: 47.2 Watt
05101520253035404550Tooltip
Power Consumption - Witcher 3 Power Consumption *
min: 39.4     avg: 43.3     median: 43.3 (10%)     max: 47.2 Watt
0510152025303540Tooltip
Power Consumption - Witcher 3 ultra Power Efficiency
0.1 fps per Watt (14%)
Power Consumption - Witcher 3 ultra Power Efficiency - external Monitor
0.2 fps per Watt (13%)
Emissions Witcher 3 Fan Noise +
Emissions - Witcher 3 Fan Noise
min: 32.5     avg: 36.2     median: 37.2 (60%)     max: 39 dB(A)
Clock Speed - GPU Clock Witcher 3 ultra
998 MHz (39%)
- Range of benchmark values for this graphics card
- Average benchmark values for this graphics card
* Smaller numbers mean a higher performance

Game Benchmarks

The following benchmarks stem from our benchmarks of review laptops. The performance depends on the used graphics memory, clock rate, processor, system settings, drivers, and operating systems. So the results don't have to be representative for all laptops with this GPU. For detailed information on the benchmark results, click on the fps number.

F1 2021

F1 2021

2021
low 1280x720
44.6  fps    + Compare
med. 1920x1080
21.6  fps    + Compare
high 1920x1080
16.4  fps    + Compare
ultra 1920x1080
10.2  fps    + Compare
» With all tested laptops playable in detail settings low.
F1 2020

F1 2020

2020
low 1280x720
40.7  fps    + Compare
med. 1920x1080
19.1  fps    + Compare
high 1920x1080
14.5  fps    + Compare
ultra 1920x1080
9.6  fps    + Compare
» With all tested laptops playable in detail settings low.
low 1280x720
54.8  fps    + Compare
med. 1920x1080
17.3  fps    + Compare
high 1920x1080
11.6  fps    + Compare
» With all tested laptops playable in detail settings low.
low 1280x720
0 (!)  fps    + Compare
low 1280x720
29.1  fps    + Compare
med. 1920x1080
16.2  fps    + Compare
high 1920x1080
14.1  fps    + Compare
ultra 1920x1080
6.6  fps    + Compare
» The benchmarks indicate that the game is not playable in the tested settings.
high 1920x1080
59.8  fps    + Compare
4K 3840x2160
27.2  fps    + Compare
» With all tested laptops playable in detail settings high.
low 1280x720
15.8  fps    + Compare
» The benchmarks indicate that the game is not playable in the tested settings.
low 1280x720
0 (!)  fps    + Compare
GRID 2019

GRID 2019

2019
low 1280x720
36.3 (!)  fps    + Compare
med. 1920x1080
20.9 (!)  fps    + Compare
» With all tested laptops playable in detail settings low.
low 1280x720
0 (!)  fps    + Compare
FIFA 20

FIFA 20

2019
low 1280x720
92  fps    + Compare
med. 1920x1080
55.9  fps    + Compare
high 1920x1080
46.3  fps    + Compare
ultra 1920x1080
34.9  fps    + Compare
QHD 2560x1440
26.5  fps    + Compare
4K 3840x2160
13.6  fps    + Compare
» With all tested laptops playable in detail settings high.
low 1280x720
22.5 23.5 ~ 23 fps    + Compare
med. 1920x1080
10.2 10.4 ~ 10 fps    + Compare
high 1920x1080
6.4 6.7 ~ 7 fps    + Compare
» The benchmarks indicate that the game is not playable in the tested settings.
Additional Benchmarks
Very Low Overall Quality (DX11) 1920x1080
13
15.5
Control

Control

2019
low 1280x720
25.4 (!)  fps    + Compare
» The benchmarks indicate that the game is not playable in the tested settings.
F1 2019

F1 2019

2019
low 1280x720
51.2  fps    + Compare
med. 1920x1080
21.9  fps    + Compare
high 1920x1080
19.3  fps    + Compare
» With all tested laptops playable in detail settings low.
low 1280x720
56.7  fps    + Compare
med. 1920x1080
18.5  fps    + Compare
high 1920x1080
10.5  fps    + Compare
» With all tested laptops playable in detail settings low.
Rage 2

Rage 2

2019
low 1280x720
24.5  fps    + Compare
» The benchmarks indicate that the game is not playable in the tested settings.
Anno 1800

Anno 1800

2019
low 1280x720
30.2  fps    + Compare
» The benchmarks indicate that the game is not playable in the tested settings.
low 1280x720
35  fps    + Compare
» The benchmarks indicate that the game is not playable in the tested settings.
low 1280x720
64  fps    + Compare
med. 1920x1080
22.8  fps    + Compare
» With all tested laptops playable in detail settings low.
Anthem

Anthem

2019
low 1280x720
16.6  fps    + Compare
» The benchmarks indicate that the game is not playable in the tested settings.
low 1280x720
21 22 ~ 22 fps    + Compare + 📈 Graph
med. 1920x1080
11 11 ~ 11 fps    + Compare + 📈 Graph
high 1920x1080
10  fps    + Compare + 📈 Graph
ultra 1920x1080
9  fps    + Compare + 📈 Graph
» The benchmarks indicate that the game is not playable in the tested settings.
low 1280x720
18.3 20.1 ~ 19 fps    + Compare
med. 1920x1080
10.1  fps    + Compare
high 1920x1080
7.4  fps    + Compare
» The benchmarks indicate that the game is not playable in the tested settings.
low 1280x720
19.9  fps    + Compare
» The benchmarks indicate that the game is not playable in the tested settings.
low 1280x720
0 (!)  fps    + Compare
low 1280x720
13 18 ~ 16 fps    + Compare
» The benchmarks indicate that the game is not playable in the tested settings.
low 1280x720
25  fps    + Compare
med. 1920x1080
0 (!)  fps    + Compare
» The benchmarks indicate that the game is not playable in the tested settings.
FIFA 19

FIFA 19

2018
low 1280x720
82  fps    + Compare
med. 1920x1080
45.8  fps    + Compare
high 1920x1080
40.3  fps    + Compare
ultra 1920x1080
36.7  fps    + Compare
» With all tested laptops playable in detail settings ultra.
low 1280x720
19 20.5 22 23.5 ~ 21 fps    + Compare
med. 1920x1080
11 13 ~ 12 fps    + Compare
high 1920x1080
8 10.1 ~ 9 fps    + Compare
» The benchmarks indicate that the game is not playable in the tested settings.
Additional Benchmarks
Lowest Preset 1920x1080
14
16.6
Strange Brigade

Strange Brigade

2018
low 1280x720
41.4  fps    + Compare
med. 1920x1080
17.6  fps    + Compare
high 1920x1080
16.9  fps    + Compare
ultra 1920x1080
14.5  fps    + Compare
» With all tested laptops playable in detail settings low.
F1 2018

F1 2018

2018
low 1280x720
45  fps    + Compare
med. 1920x1080
23  fps    + Compare
high 1920x1080
17  fps    + Compare
ultra 1920x1080
12 12 ~ 12 fps    + Compare
» With all tested laptops playable in detail settings low.
low 1280x720
30.9  fps    + Compare
» The benchmarks indicate that the game is not playable in the tested settings.
Far Cry 5

Far Cry 5

2018
low 1280x720
20 22 23 ~ 22 fps    + Compare + 📈 Graph
med. 1920x1080
10 11 11 ~ 11 fps    + Compare + 📈 Graph
high 1920x1080
10  fps    + Compare + 📈 Graph
ultra 1920x1080
9  fps    + Compare + 📈 Graph
» The benchmarks indicate that the game is not playable in the tested settings.
Additional Benchmarks
Low Preset TAA 1920x1080
13
12
World of Tanks enCore

World of Tanks enCore

2018
low 1366x768
15.7 250 ~ 133 fps    + Compare
med. 1920x1080
40.3  fps    + Compare
» With all tested laptops playable in detail settings med..
low 1280x720
13.8 21.2 22.4 25.3 26.8 32.6 42.8 ~ 26 fps    + Compare
med. 1920x1080
9.8 15 15.3 18 18.4 23.3 29.5 ~ 18 fps    + Compare
high 1920x1080
8.6 12.3 13.4 15.9 16 19.8 25.1 ~ 16 fps    + Compare
» The benchmarks indicate that the game is not playable in the tested settings.
low 1280x720
9.1 14.7 15.6 16.6 16.9 17 17.3 18.1 ~ 16 fps    + Compare
med. 1920x1080
7.9 8.8 9.1 9.7 ~ 9 fps    + Compare
high 1920x1080
5.3 6 6.1 6.6 ~ 6 fps    + Compare
» The benchmarks indicate that the game is not playable in the tested settings.
Fortnite

Fortnite

2018
low 1280x720
51.5  fps    + Compare
med. 1920x1080
21.6  fps    + Compare
» With all tested laptops playable in detail settings low.
low 1280x720
13  fps    + Compare
» The benchmarks indicate that the game is not playable in the tested settings.
low 1280x720
30  fps    + Compare
med. 1920x1080
18  fps    + Compare
high 1920x1080
14  fps    + Compare
ultra 1920x1080
9  fps    + Compare
» The benchmarks indicate that the game is not playable in the tested settings.
low 1280x720
128  fps    + Compare
med. 1366x768
125  fps    + Compare
high 1920x1080
113  fps    + Compare
ultra 1920x1080
57.8  fps    + Compare
4K 3820x2160
34.4  fps    + Compare
» With all tested laptops playable in detail settings ultra.
low 1280x720
78 97 133.3 ~ 103 fps    + Compare
med. 1920x1080
40.6 46 59.1 ~ 49 fps    + Compare
high 1920x1080
32.7 36 38.8 ~ 36 fps    + Compare
» With most tested laptops playable in detail settings high.
Additional Benchmarks
Performance 1920x1080
92
60
low 1280x720
20.4 22.7 ~ 22 fps    + Compare
med. 1920x1080
10.2  fps    + Compare
» The benchmarks indicate that the game is not playable in the tested settings.
For Honor

For Honor

2017
low 1280x720
0 (!) 41.3 ~ 21 fps    + Compare
med. 1920x1080
16.1  fps    + Compare
» With all tested laptops playable in detail settings low.
low 1280x720
28.7  fps    + Compare
med. 1366x768
21.1  fps    + Compare
» The benchmarks indicate that the game is not playable in the tested settings.
Overwatch

Overwatch

2016
low 1280x720
91  fps    + Compare
med. 1366x768
68  fps    + Compare
high 1920x1080
29.9  fps    + Compare
ultra 1920x1080
18.2  fps    + Compare
» With all tested laptops playable in detail settings med..
low 1280x768
19.4  fps    + Compare
med. 1920x1080
11.3  fps    + Compare
high 1920x1080
10.5  fps    + Compare
» The benchmarks indicate that the game is not playable in the tested settings.
low 1280x720
34.2  fps    + Compare
med. 1366x768
21.2  fps    + Compare
» The benchmarks indicate that the game is not playable in the tested settings.
low 1024x768
25.9 39.2 ~ 33 fps    + Compare
med. 1366x768
17.6 22.3 ~ 20 fps    + Compare
high 1920x1080
10.8  fps    + Compare
ultra 1920x1080
8.9  fps    + Compare
» The benchmarks indicate that the game is not playable in the tested settings.
low 1024x768
75.8  fps    + Compare
med. 1366x768
0 (!)  fps    + Compare
» With all tested laptops playable in detail settings low.
low 1280x720
51.4 84 86.8 87.9 92.6 94.4 95 98 ~ 86 fps    + Compare
med. 1366x768
34.6 37.1 57 63 64 66 68 77.9 ~ 58 fps    + Compare
high 1920x1080
15.8 25.3 27.8 31.9 32.4 33.3 34.5 34.7 ~ 29 fps    + Compare
ultra 1920x1080
13.4 22.7 24.5 27.7 28.1 28.1 29.9 30.4 ~ 26 fps    + Compare
4K 3840x2160
11.6 12.2 ~ 12 fps    + Compare
» With most tested laptops playable in detail settings med..
low 1024x768
23.2 24.7 27.4 27.9 ~ 26 fps    + Compare + 📈 Graph
med. 1366x768
14.6 17.8 ~ 16 fps    + Compare
high 1920x1080
10.1 10.9 ~ 11 fps    + Compare
ultra 1920x1080
5.6 5.6 ~ 6 fps    + Compare + 📈 Graph
» The benchmarks indicate that the game is not playable in the tested settings.
Additional Benchmarks
Medium Graphics & Postprocessing 1920x1080
12.3
GTA V

GTA V

2015
low 1024x768
57 61 68 ~ 62 fps    + Compare
med. 1366x768
51.2 51.8 62.1 ~ 55 fps    + Compare
high 1920x1080
13.7 14.3 15.8 ~ 15 fps    + Compare
ultra 1920x1080
5.2 5.5 6.2 ~ 6 fps    + Compare
QHD 2560x1440
4.2  fps    + Compare
» With all tested laptops playable in detail settings med..
Additional Benchmarks
Normal/Off 4xAF 1920x1080
45.5
38.2
Lowest Settings possible 1920x1080
48.1
39.9
low 1280x720
78.4 116.6 ~ 98 fps    + Compare
med. 1366x768
54.3 64.8 ~ 60 fps    + Compare
high 1366x768
49.4 55 ~ 52 fps    + Compare
ultra 1920x1080
15.5 17 ~ 16 fps    + Compare
» With all tested laptops playable in detail settings high.
high 1366x768
93.7  fps    + Compare
ultra 1920x1080
49.6  fps    + Compare
4K 3820x2160
12.4  fps    + Compare
» With all tested laptops playable in detail settings ultra.
lowmed.highultraQHD4K
F1 202144.621.616.410.2
F1 202040.719.114.59.64
Gears Tactics54.817.311.6
Doom Eternal
Escape from Tarkov29.116.214.16.59
Hearthstone59.827.2
Red Dead Redemption 215.8
Call of Duty Modern Warfare 2019
GRID 201936.320.9
Ghost Recon Breakpoint
FIFA 209255.946.334.926.513.6
Borderlands 323107
Control25.4
F1 201951.221.919.3
Total War: Three Kingdoms56.718.510.5
Rage 224.5
Anno 180030.2
The Division 235
Dirt Rally 2.06422.8
Anthem16.6
Far Cry New Dawn2211109
Metro Exodus1910.17.41
Battlefield V19.9
Call of Duty Black Ops 4
Assassin´s Creed Odyssey16
Forza Horizon 425
FIFA 198245.840.336.7
Shadow of the Tomb Raider21129
Strange Brigade41.417.616.914.5
F1 201845231712
The Crew 230.9
Far Cry 52211109
World of Tanks enCore13340.3
X-Plane 11.11261816
Final Fantasy XV Benchmark1696
Fortnite51.521.6
Assassin´s Creed Origins13
Middle-earth: Shadow of War3018149
Team Fortress 212812511357.834.4
Rocket League1034936
Ghost Recon Wildlands2210.2
For Honor2116.1
Deus Ex Mankind Divided28.721.1
Overwatch916829.918.2
Ashes of the Singularity19.411.310.5
The Division34.221.2
Rise of the Tomb Raider332010.88.9
Rainbow Six Siege75.8
Dota 2 Reborn8658292612
The Witcher 32616116
GTA V62551564.17
BioShock Infinite98605216
Counter-Strike: GO93.749.612.4
< 30 fps
< 60 fps
< 120 fps
≥ 120 fps
21
15
9
2
26
6
2
1
22
5
2
14
4

2


4
1

For more games that might be playable and a list of all games and graphics cards visit our Gaming List

v1.26
log 26. 01:01:48

#0 no ids found in url (should be separated by "_") +0s ... 0s

#1 not redirecting to Ajax server +0s ... 0s

#2 did not recreate cache, as it is less than 5 days old! Created at Thu, 25 Apr 2024 05:40:10 +0200 +0.001s ... 0.001s

#3 no comparison url found in template nbc.compare_page_1 needed +0.099s ... 0.1s

#4 no comparison url found in template nbc.compare_page_1 needed +0s ... 0.1s

#5 no comparison url found in template nbc.compare_page_1 needed +0s ... 0.1s

#6 no comparison url found in template nbc.compare_page_1 needed +0s ... 0.1s

#7 no comparison url found in template nbc.compare_page_1 needed +0s ... 0.1s

#8 no comparison url found in template nbc.compare_page_1 needed +0s ... 0.1s

#9 no comparison url found in template nbc.compare_page_1 needed +0s ... 0.101s

#10 no comparison url found in template nbc.compare_page_1 needed +0s ... 0.101s

#11 no comparison url found in template nbc.compare_page_1 needed +0s ... 0.101s

#12 no comparison url found in template nbc.compare_page_1 needed +0s ... 0.101s

#13 no comparison url found in template nbc.compare_page_1 needed +0s ... 0.101s

#14 no comparison url found in template nbc.compare_page_1 needed +0s ... 0.102s

#15 composed specs +0s ... 0.102s

#16 did output specs +0s ... 0.102s

#17 start showIntegratedCPUs +0s ... 0.102s

#18 getting avg benchmarks for device 8828 +0.039s ... 0.141s

#19 got single benchmarks 8828 +0.039s ... 0.18s

#20 got avg benchmarks for devices +0s ... 0.18s

#21 min, max, avg, median took s +1.301s ... 1.481s

#22 before gaming benchmark output +0s ... 1.482s

#23 Got 248 rows for game benchmarks. +0.063s ... 1.544s

#24 composed SQL query for gamebenchmarks +0s ... 1.544s

#25 got data and put it in $dataArray +0.045s ... 1.589s

#26 benchmarks composed for output. +2.005s ... 3.594s

#27 no comparison url found in template nbc.compare_page_1 needed +0.005s ... 3.599s

#28 return log +0s ... 3.599s

Notebook reviews with Intel Iris Plus Graphics 655 graphics card

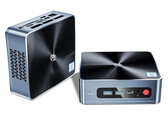
ACEMagician ACE-CK10-8259U

ACEMagician ACE-CK10-8259U迷你电脑评测--安静的办公电脑,最多可容纳三块固态硬盘的空间

ACEMagician ACE-CK10-8259U是一款基于原生4核处理器的小型办公电脑。然而,它的处理器仍然是Coffee Lake一代的一部分,这不一定会成为新设备的首选。尽管如此,制造商已经为这个模型提供了足够的性能潜力,供日常使用。我们将ACEMagician ACE-CK10-8259U进行了测试,这篇评论...
Intel Core i5-8259U | Intel Iris Plus Graphics 655 | | 449 g
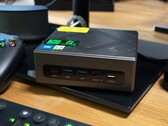
Geekom Mini IT8 SFF台式机上手

Geekom Mini IT8 SFF台式机上手

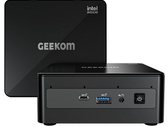
Geekom Mini IT8是一款紧凑型台式机。尽管它的体积很小,但由于其四核CPU和英特尔Iris Plus Graphics 655 iGPU,它拥有一些不错的动力。然而,它的旧芯片组限制了它的能力,特别是在游戏方面。 ...
Intel Core i5-8259U | Intel Iris Plus Graphics 655 | | 586 g
Beelink SEi8回顾。不常见的酷睿i3-8109U用于新的迷你电脑

Beelink SEi8回顾。不常见的酷睿i3-8109U用于新的迷你电脑

如果你想要比赛扬或Atom更快的东西,而又不需要为最新的Core i5或Core i7解决方案支付过高的费用,那么这款价格合理的Beelink SEi8可能符合要求。...
Intel Core i3-8109U | Intel Iris Plus Graphics 655 | | 346 g
Chuwi CoreBook X Pro笔记本电脑评论。廉价的120赫兹显示器

Chuwi CoreBook X Pro笔记本电脑评论。廉价的120赫兹显示器

CoreBook X Pro是你能找到的拥有120赫兹面板的最便宜的15.6英寸笔记本电脑。然而,问题是你将不得不面对系统主要方面的大幅削减。...
Intel Core i5-8259U | Intel Iris Plus Graphics 655 | 15.60" | 1.8 kg
Chuwi CoreBook X笔记本电脑评论。像华为MateBook,但更便宜

Chuwi CoreBook X笔记本电脑评论。像华为MateBook,但更便宜

对于那些想以预算价格最大化显示质量和色彩的人来说,CoreBook X是一个不错的解决方案。尽管如此,有一堆较小的细节是买家应该注意的。...
Intel Core i5-8259U | Intel Iris Plus Graphics 655 | 14.00" | 1.5 kg

Apple MacBook Pro 13 2019 i5 4TB3: Intel Core i5-8279U, 13.30", 1.4 kg
  Review » 苹果MacBook Pro 2019笔记本电脑评测:性能不错,但没有创新

Chuwi CoreBook X Pro: Intel Core i5-8259U, 15.60", 1.8 kg
  External Review » Chuwi CoreBook X Pro

Chuwi CoreBook X: Intel Core i5-8259U, 14.00", 1.5 kg
  External Review » Chuwi CoreBook X

LG Gram 15Z90N-V-AR53B: Intel Core i5-1035G7, 15.60", 1.1 kg
  External Review » LG Gram 15Z90N-V-AR53B

Apple MacBook Pro 13 2019 i5 4TB3: Intel Core i5-8279U, 13.30", 1.4 kg
  External Review » Apple MacBook Pro 13 2019 i5 4TB3

Apple MacBook Pro 13 2019-Z0WQ: unknown, 13.30", 1.4 kg
  External Review » Apple MacBook Pro 13 2019-Z0WQ

Apple MacBook Pro 13 2018 Touchbar i7: Intel Core i7-8559U, 13.30", 1.4 kg
  External Review » Apple MacBook Pro 13 2018 Touchbar i7

Apple MacBook Pro 13 2018 Touchbar i5: Intel Core i5-8259U, 13.30", 1.4 kg
  External Review » Apple MacBook Pro 13 2018 Touchbar i5

Please share our article, every link counts!

» Comparison of GPUs
Detailed list of all laptop GPUs sorted by class and performance.

» Benchmark List
Sort and restrict laptop GPUs based on performance in synthetic benchmarks.

» Notebook Gaming List
Playable games for each graphics card and their average FPS results.

Class 1

GeForce RTX 2080 Super Mobile

Class 2

M1 Max 32-Core GPU *
GeForce RTX 2070 Super Mobile
M1 Max 24-Core GPU *
Quadro RTX 5000 Max-Q
Radeon RX 5700M *
GeForce GTX 1080 Mobile
Quadro RTX 4000 (Laptop)
M1 Pro 16-Core GPU *
Radeon PRO W6600M *
GeForce RTX 2070 Super Max-Q
Quadro RTX 4000 Max-Q *
M1 Pro 14-Core GPU *
Quadro P5200
Quadro RTX 3000 Max-Q *
Quadro P4200
Quadro P5000 Max-Q *
GeForce GTX 980 (Laptop)
Quadro P4000
Quadro P4000 Max-Q
Quadro P3200
Radeon RX 580X (Laptop) *
Radeon RX 580 (Laptop)
Radeon Pro 5300M
Radeon RX 5300M
Quadro P3000 Max-Q *
Quadro T2000 Max-Q *
Radeon Pro WX 7100 *
Radeon RX 570X (Laptop) *
Radeon RX 570 (Laptop) *
Radeon RX 470 (Laptop) *
Quadro T1000 Max-Q *

Class 3

Vega M GH
Quadro M5000M
GeForce GTX 1050 Ti Mobile
Radeon 680M
Quadro P2000
Quadro P2000 Max-Q
Quadro M4000M
T500 Laptop GPU *
Radeon R9 M395X
GeForce GTX 1050 Ti Max-Q *
Radeon Pro Vega 16
WX Vega M GL
Radeon R9 M485X
Quadro M3000M
FirePro W7170M
Radeon R9 M395
GeForce GTX 1050 Max-Q *
Radeon 660M
Radeon Pro WX 4150 *
Radeon RX 560X (Laptop)
Radeon RX 560 (Laptop)
Radeon RX 460 (Laptop)
Quadro P1000
Radeon R9 M390
Xe MAX
Radeon Pro 560X
Radeon Pro 560
Radeon Pro 460
Radeon Pro WX 4130 *
GeForce GTX 960M
Quadro P620 *
Radeon RX 550X (Laptop)
Radeon Pro WX 3200 *
Radeon Pro 555X
Radeon Pro 555
Radeon Pro 455
Quadro P600
Quadro M2000M
Radeon RX 540X *
Radeon Pro WX 2100 *
Radeon Pro WX 3100 *
GeForce GTX 950M
Radeon Pro 450
Radeon 630
Radeon 540X *
Radeon R9 M385X
Quadro P520
Quadro M1000M
GeForce 945M
Quadro P500 *
Iris Plus Graphics G7 (Ice Lake 64 EU) *
Vega 10 *
Iris Pro Graphics 580
FirePro W5170M *
Radeon R9 M370X
Vega 9
FirePro W5130M
UHD Graphics Xe G4 48EUs *
UHD Graphics 32EUs
UHD Graphics Xe 32EUs (Tiger Lake-H) *
UHD Graphics 750
Vega 7
Radeon R7 M465
Iris Pro Graphics 6200
Vega 8
GeForce 940M
Iris Plus Graphics G4 (Ice Lake 48 EU)
Quadro M600M
FirePro W4190M
Radeon R9 M375
Radeon R7 M445
Iris Plus Graphics 650
Iris Graphics 550
Radeon 625
Vega 6 *
Iris Plus Graphics 640
Iris Graphics 540
UHD Graphics 24EUs (Alder Lake-N) *
Radeon R7 M360
GeForce 920M
Radeon 620
Radeon R7 M340
Radeon 610
Radeon 610M *
Vega 6 *
UHD Graphics G1 (Ice Lake 32 EU)
UHD Graphics Xe 16EUs (Tiger Lake-H) *
HD Graphics 530
Radeon R5 (Bristol Ridge)
Adreno 690 *
Adreno 685 *
Adreno 680 *
Radeon R5 M330
GeForce 910M
HD Graphics 520

Class 4

UHD Graphics 730
Radeon R5 M320 *
Radeon R5 M315 *
Radeon R5 M420 *
Vega 2 *
UHD Graphics 617
UHD Graphics 615
HD Graphics 515
UHD Graphics 610
HD Graphics 510
UHD Graphics 605
Radeon R4 (Stoney Ridge)
Radeon R2 (Stoney Ridge)
HD Graphics (Broadwell)
UHD Graphics 600
HD Graphics (Braswell)

Class 5

* Approximate position of the graphics adapter