Intel Core i7-1195G7

英特尔酷睿i7-1195G7是基于2021年推出的Tiger Lake-U Generation (UP4)的笔记本电脑和Ultra Book的能效四核SoC。 4个Willow Cove处理器内核(Hyper-Threading支持8个线程)。 基本时钟(最小)因设定的TDP而异,范围从1.3GHz(12瓦特TDP)到2.9GHz(28瓦特)。 单核涡轮增压最高可达5GHz(涡轮增压3.0)。 所有核心最高可达4.6GHz。 i7-1195G7是Tiger Lake UP3更新的一部分,是Tiger-Lake U系列中最快的CPU。
1195G7集成了英特尔Iris Xe显卡和96个EU,时钟为400~1400MHz。 GPU 和 CPU 可以同时使用 12 MB 的 L3 高速缓存。
此外,Tiger Lake SoCs还支持四个通道 PCIe4、AI硬件加速、Thunderbolt 4/USB 4和 Wi-Fi 6E部分集成到芯片中。
芯片在英特尔改进的 10nm+ 工艺(称为 SuperFin)中生产,与 TSMC 的 7nm 工艺(例如,Ryzen 4000 系列)相同。
UP3系列的动作范围为12~是28瓦特。 因此,处理器也适用于轻薄笔记本电脑。
Series | Intel Tiger Lake |
Codename | Tiger Lake UP3 |
Series: Tiger Lake Tiger Lake UP3 |
Clock Rate | 2900 - 5000 MHz |
Level 1 Cache | 320 KB |
Level 2 Cache | 5 MB |
Level 3 Cache | 12 MB |
Number of Cores / Threads | 4 / 8 |
Power Consumption (TDP = Thermal Design Power) | 28 Watt |
Manufacturing Technology | 10 nm |
Max. Temperature | 100 °C |
Socket | BGA1499 |
Features | DL Boost, GNA, Wi-Fi 6 (Gig+), Thunderbolt 4, DDR4-3200 / LPDDR4x-4266 |
GPU | Intel Iris Xe Graphics G7 96EUs (400 - 1400 MHz) |
64 Bit | 64 Bit support |
Architecture | x86 |
Announcement Date | 05/30/2021 |
Product Link (external) | Intel Tiger Lake i7-1195G7 |
Benchmarks
Performance Rating - CB R15 + R20 + 7-Zip + X265 + Blender + 3DM11 CPU
41.2 pt (46%)
...
Intel Core i5-1230U -3%
Intel Core i7-9750H -2%
Intel Core i3-1215U 1%
Intel Xeon E-2276M 2%
...
Cinebench R23 - Cinebench R23 Multi Core
min: 3142 avg: 5022 median: 5337 (9%) max: 6806 Points
CPU TDP ? | TDP 13 W | TDP 20 W | TDP 28 W | TDP 35 W | TDP 36 W | TDP 50 W |
---|
65% | 63% | 53% | 78% | 76% | 87% | 100% |
...
Intel Core i5-1035G1 -20%
Intel Core i7-8850H 14%
Intel Core i3-1215U 16%
...
Intel Core i9-13980HX 505%
Cinebench R23 - Cinebench R23 Single Core
min: 1290 avg: 1457 median: 1455 (64%) max: 1624 Points
CPU TDP ? | TDP 13 W | TDP 20 W | TDP 28 W | TDP 35 W | TDP 36 W | TDP 50 W |
---|
85% | 81% | 86% | 98% | 90% | 93% | 100% |
...
AMD Ryzen 5 6600HS 1%
AMD Ryzen 5 PRO 6650U 1%
AMD Ryzen 7 PRO 6860Z 1%
AMD Ryzen 9 5900HS 1%
AMD Ryzen 7 PRO 6850U 2%
...
Cinebench R20 - Cinebench R20 CPU (Single Core)
min: 498 avg: 563 median: 559 (64%) max: 620 Points
CPU TDP ? | TDP 13 W | TDP 20 W | TDP 28 W | TDP 35 W | TDP 36 W | TDP 50 W |
---|
85% | 88% | 87% | 100% | 91% | 91% | 100% |
...
AMD Ryzen 9 5900HS 2%
AMD Ryzen 5 PRO 6650U 2%
...
Cinebench R20 - Cinebench R20 CPU (Multi Core)
min: 1212 avg: 1907 median: 1932 (8%) max: 2590 Points
CPU TDP ? | TDP 13 W | TDP 20 W | TDP 28 W | TDP 35 W | TDP 36 W | TDP 50 W |
---|
65% | 64% | 54% | 78% | 73% | 90% | 100% |
...
Intel Core i7-8559U -11%
Intel Core i5-8279U -10%
Intel Core i7-7700HQ -7%
Intel Core i7-8705G -1%
Intel Core i5-1038NG7 5%
Intel Core i7-8809G 5%
Apple M1 7%
...
Intel Core i7-12800HX 349%
Cinebench R15 - Cinebench R15 CPU Multi 64 Bit
min: 574 avg: 853 median: 940 (10%) max: 999 Points
CPU TDP ? | TDP 13 W | TDP 20 W | TDP 28 W | TDP 35 W | TDP 36 W | TDP 50 W |
---|
95% | 65% | 66% | 83% | 99% | 100% | 99% |
...
Intel Core i7-8559U -6%
Intel Core i5-9400H -4%
Intel Core i3-1215U -2%
Intel Core i7-8809G 1%
Intel Core i5-1230U 4%
...
Intel Core i7-12800HX 297%
GPD Pocket 3: Ø570 (564.07-573.67)
GPD Pocket 3: Ø655 (525.83-745.35)
Gigabyte U4 UD: Ø650 (645.8-653.56)
Geekom Mini IT11-GM11i7T: Ø827 (819.47-831.07)
Asus ExpertBook B7 Flip B7402FEA Leistungsmodus: Ø834 (819.47-939.85)
Asus ExpertBook B7 Flip B7402FEA Flüstermodus: Ø525 (489.23-951.52)
Asus ExpertBook B7 Flip B7402FEA: Ø732 (673.83-985.19)
VAIO SX14 VJS144X0111K: Ø962 (846.99-994.46)
MSI Prestige 14 Evo A11MO-026US: Ø895 (871.69-999.4)
Cinebench R15 - Cinebench R15 CPU Single 64 Bit
min: 198 avg: 221.4 median: 222 (68%) max: 238 Points
CPU TDP ? | TDP 13 W | TDP 20 W | TDP 28 W | TDP 35 W | TDP 36 W | TDP 50 W |
---|
83% | 90% | 90% | 99% | 93% | 98% | 100% |
...
Intel Core i7-1260U 0%
AMD Ryzen 5 PRO 5675U 0%
Apple M2 1%
Intel Core i7-1270P 2%
Intel Core i7-1250U 2%
...
Cinebench R11.5 - Cinebench R11.5 CPU Multi 64 Bit
10.6 Points (15%)
...
Intel Core i7-8809G -11%
Intel Core i5-9400H -11%
Intel Core i5-1250P -8%
Intel Core i3-1215U 4%
Intel Xeon E-2176M 7%
...
Cinebench R11.5 - Cinebench R11.5 CPU Single 64 Bit
2.7 Points (9%)
...
AMD Ryzen 7 PRO 6850H -4%
Intel Core i5-1250P 1%
Intel Core i7-1270P 1%
AMD Ryzen 5 6600HS 1%
AMD Ryzen 5 PRO 6650U 3%
Intel Core i3-1215U 3%
...
Intel Core i7-12650H 1067%
Cinebench R10 - Cinebench R10 Rend. Multi (64bit)
40873 Points (29%)
...
Intel Core i7-9750H -2%
Intel Core i3-1215U -1%
Intel Core i9-8950HK 2%
Intel Core i9-9980HK 36%
...
Cinebench R10 - Cinebench R10 Rend. Single (64bit)
12384 Points (67%)
...
AMD Ryzen 9 PRO 6950HS -3%
AMD Ryzen 9 5900HS -3%
Intel Core i5-1230U -3%
Intel Core i9-12900HK 0%
Intel Core i3-1215U 3%
Intel Core i5-1245U 9%
Intel Core i7-1265U 12%
wPrime 2.10 - wPrime 2.0 1024m *
281.4 s (3%)
...
Intel Core i7-2920XM -2%
Intel Core i7-2860QM -1%
Intel Core i7-3630QM -1%
Intel Core i7-1065G7 0%
Intel Xeon E3-1535M v5 3%
Intel Core i7-4700MQ 4%
Intel Core i7-2760QM 5%
Intel Core i5-8365U 5%
Intel Core i7-3610QM 7%
Intel Core i7-3635QM 7%
Intel Core i7-8650U 7%
...
VIA C3-M C3-M-1200 2906%
wPrime 2.10 - wPrime 2.0 32m *
8.2 s (2%)
...
AMD Ryzen 7 PRO 6860Z -3%
Intel Core i7-1065G7 -3%
Intel Core i7-4800MQ -2%
AMD Ryzen 7 PRO 6850U -2%
Intel Core i9-8950HK -1%
Intel Core i7-2760QM 1%
AMD Ryzen 9 PRO 6950HS 3%
...
Transmeta Crusoe TM-5800 5985%
6334 points (37%)
...
AMD Ryzen 9 PRO 6950HS -6%
Intel Core i7-8809G -6%
Intel Core i5-1245U -3%
Intel Core i7-9750H 1%
Intel Core i9-8950HK 1%
Intel Core i7-11390H 4%
Intel Core i7-8559U 5%
...
7-Zip 18.03 - 7-Zip 18.03 Multli Thread 4 runs
min: 17053 avg: 23469 median: 24669 (15%) max: 26183 MIPS
CPU TDP ? | TDP 13 W | TDP 20 W | TDP 28 W | TDP 35 W | TDP 36 W | TDP 50 W |
---|
89% | 82% | 65% | 93% | 96% | 100% | 97% |
...
Intel Core i5-8279U -3%
Intel Core i5-1250P 5%
Intel Core i3-1215U 6%
Intel Core i7-8559U 12%
...
Intel Core i7-12800HX 228%
7-Zip 18.03 - 7-Zip 18.03 Single Thread 4 runs
min: 5059 avg: 5409 median: 5386 (64%) max: 5890 MIPS
CPU TDP ? | TDP 13 W | TDP 20 W | TDP 28 W | TDP 35 W | TDP 36 W | TDP 50 W |
---|
91% | 91% | 89% | 100% | 92% | 93% | 86% |
...
AMD Ryzen 5 6600HS -2%
AMD Ryzen 7 PRO 6850H -1%
AMD Ryzen 7 PRO 6850U 0%
Intel Core i9-9980HK 0%
Apple M1 1%
...
HWBOT x265 Benchmark v2.2 - HWBOT x265 4k Preset
min: 4.23 avg: 6.5 median: 6.6 (14%) max: 8.8 fps
CPU TDP ? | TDP 13 W | TDP 20 W | TDP 28 W | TDP 35 W | TDP 36 W | TDP 50 W |
---|
66% | 64% | 55% | 79% | 74% | 84% | 100% |
...
Intel Core i5-1038NG7 -7%
Intel Core i5-8279U -7%
Intel Core i7-7700HQ -5%
Intel Core i7-8706G -2%
Intel Core i5-1250P 5%
Intel Core i7-8809G 10%
...
Intel Core i7-12800HX 286%
Asus ExpertBook B7 Flip B7402FEA Flüstermodus: Ø5.4 (0.93-14.8)
GPD Pocket 3: Ø5.41 (0.86-11.6)
Gigabyte U4 UD: Ø6 (0.78-11.4)
Asus ExpertBook B7 Flip B7402FEA Dual-Channel: Ø6.86 (1.06-14.9)
Asus ExpertBook B7 Flip B7402FEA: Ø7.41 (0.93-14.7)
Geekom Mini IT11-GM11i7T: Ø7.16 (0.51-11.9)
Asus ExpertBook B7 Flip B7402FEA Leistungsmodus: Ø7.95 (0.91-14.6)
MSI Prestige 14 Evo A11MO-026US: Ø7.91 (1.09-15.1)
VAIO SX14 VJS144X0111K: Ø9.63 (1.12-18)
TrueCrypt - TrueCrypt Serpent
0.6 GB/s (0%)
...
AMD Ryzen 5 PRO 6650U -3%
Intel Core i7-11390H -1%
Intel Xeon E-2176M 8%
Intel Core i7-9750H 15%
Intel Core i7-8850H 16%
Intel Core i9-8950HK 17%
...
TrueCrypt - TrueCrypt Twofish
1 GB/s (0%)
...
AMD Ryzen 5 PRO 6650U -3%
Intel Core i7-11390H -1%
AMD Ryzen 7 PRO 6850H 2%
Intel Core i7-1270P 11%
Intel Xeon E-2176M 11%
...
TrueCrypt - TrueCrypt AES
6.4 GB/s (0%)
...
AMD Ryzen 5 PRO 6650U -14%
Intel Core i7-1270P -9%
AMD Ryzen 7 PRO 6850U 2%
Intel Core i7-11390H 5%
Intel Xeon E-2176M 7%
Intel Core i9-8950HK 13%
Intel Core i7-9750H 15%
...
Blender - Blender 3.3 Classroom CPU *
min: 1058 avg: 1105 median: 1105 (15%) max: 1152 Seconds
Intel Core i7-12800H -70%
...
Intel Core i7-1250U -24%
Intel Core i7-1265U -20%
Apple M1 -13%
Intel Core i5-1230U -7%
Intel Core i3-1215U 13%
Intel Core i5-8260U 27%
...
Blender - Blender 2.79 BMW27 CPU *
min: 473 avg: 691 median: 597.5 (4%) max: 1211 Seconds
CPU TDP ? | TDP 13 W | TDP 20 W | TDP 28 W | TDP 35 W | TDP 36 W | TDP 50 W |
---|
102% | 100% | 101% | 103% | 103% | 103% | 104% |
Intel Core i5-1038NG7 -99%
...
Apple M2 -7%
Intel Core i3-1215U -7%
Intel Core i7-8559U -4%
Intel Core i5-8350U 2%
AMD Ryzen 5 3580U 3%
AMD Ryzen 7 2700U 3%
Intel Core i5-8260U 5%
Intel Core i5-8259U 7%
...
AMD E1-2100 1937%
R Benchmark 2.5 - R Benchmark 2.5 *
min: 0.53 avg: 0.6 median: 0.6 (12%) max: 0.611 sec
CPU TDP ? | TDP 13 W | TDP 20 W | TDP 28 W | TDP 35 W | TDP 36 W | TDP 50 W |
---|
101% | 101% | 100% | 102% | 101% | 101% | 101% |
...
Intel Xeon W-10885M -1%
Intel Core i7-1270P 1%
Intel Xeon E-2276M 3%
...
AMD E1-2100 705%
3DMark 06 - CPU - 3DMark 06 - CPU
9989 Points (21%)
...
Intel Xeon E-2176M -10%
Intel Core i7-1065G7 -8%
Intel Core i7-1265U -6%
Intel Core i7-8850H -2%
Intel Core i7-9750H 7%
...
Super Pi mod 1.5 XS 1M - Super Pi mod 1.5 XS 1M *
6.7 s (1%)
AMD Ryzen 7 PRO 6850H -86%
Intel Core i7-11390H -1%
Intel Core i5-1230U 4%
AMD Ryzen 9 PRO 6950HS 7%
...
VIA C3-M C3-M-1200 6762%
Super Pi mod 1.5 XS 2M - Super Pi mod 1.5 XS 2M *
14.7 s (1%)
Intel Core i5-1230U 2%
Intel Core i3-1215U 8%
...
Intel Celeron Dual-Core T1400 15873%
Super Pi Mod 1.5 XS 32M - Super Pi mod 1.5 XS 32M *
354.2 s (2%)
...
Intel Core i7-11390H -1%
Intel Core i5-1230U 3%
AMD Ryzen 9 PRO 6950HS 3%
...
VIA C3-M C3-M-1200 6256%
3DMark 11 - 3DM11 Performance Physics
min: 6684 avg: 10304 median: 10438.5 (29%) max: 13153 Points
CPU TDP ? | TDP 13 W | TDP 20 W | TDP 35 W | TDP 36 W | TDP 50 W |
---|
65% | 78% | 58% | 84% | 93% | 100% |
...
Intel Xeon E3-1535M v5 -4%
Intel Xeon E3-1505M v6 -4%
Intel Core i7-4980HQ -4%
Intel Core i7-8809G 7%
...
Intel Core i7-12800HX 117%
3DMark - 3DMark Ice Storm Physics
min: 63087 avg: 67596 median: 67595.5 (43%) max: 72104 Points
CPU TDP 28 W | TDP 35 W |
---|
87% | 100% |
...
Intel Core i5-1245U -6%
Intel Core i9-9980HK -4%
Intel Core i9-12900HK 2%
AMD Ryzen 5 PRO 6650U 3%
AMD Ryzen 5 6600HS 8%
...
Intel Core i5-4300Y 130%
3DMark - 3DMark Ice Storm Extreme Physics
min: 64343 avg: 67940 median: 67939.5 (56%) max: 71536 Points
CPU TDP 28 W | TDP 35 W |
---|
90% | 100% |
...
Intel Core i7-1265U -6%
Intel Core i9-9980HK -5%
Intel Core i5-1245U -4%
AMD Ryzen 9 5980HS -4%
Intel Core i9-12900HK 1%
AMD Ryzen 9 5900HS 14%
...
3DMark - 3DMark Ice Storm Unlimited Physics
min: 65247 avg: 71962 median: 71962 (61%) max: 78677 Points
CPU TDP 28 W | TDP 35 W |
---|
83% | 100% |
...
Intel Core i5-1245U 4%
...
3DMark - 3DMark Cloud Gate Physics
min: 5428 avg: 8477 median: 8745 (22%) max: 10705 Points
CPU TDP ? | TDP 13 W | TDP 20 W | TDP 28 W | TDP 35 W | TDP 36 W | TDP 50 W |
---|
69% | 80% | 58% | 78% | 84% | 90% | 100% |
...
Intel Xeon E3-1535M v5 -8%
Intel Core i3-1215U -6%
Intel Xeon E3-1535M v6 -5%
Intel Xeon E-2176M -1%
Intel Core i7-8809G 0%
Intel Core i5-1230U 5%
Intel Core i5-1250P 7%
...
Intel Core i9-12950HX 169%
3DMark - 3DMark Fire Strike Standard Physics
min: 7982 avg: 12497 median: 13225 (24%) max: 15514 Points
CPU TDP ? | TDP 13 W | TDP 20 W | TDP 28 W | TDP 35 W | TDP 36 W | TDP 50 W |
---|
69% | 81% | 59% | 78% | 88% | 94% | 100% |
...
Intel Xeon E3-1535M v6 -7%
Intel Core i7-8809G -3%
Intel Xeon E-2176M 10%
...
Intel Core i7-12800HX 176%
3DMark - 3DMark Time Spy CPU
min: 2687 avg: 4165 median: 4266 (21%) max: 5913 Points
CPU TDP ? | TDP 13 W | TDP 20 W | TDP 28 W | TDP 35 W | TDP 36 W | TDP 50 W |
---|
59% | 70% | 50% | 76% | 69% | 83% | 100% |
...
Intel Core i3-1215U -10%
Intel Core i7-8706G -9%
Intel Core i7-7820HQ -6%
Intel Core i7-7700HQ -5%
Intel Xeon E3-1535M v6 2%
Intel Xeon E3-1505M v6 3%
...
Intel Core i7-12800HX 243%
Geekbench 5.4 - Geekbench 5.1 - 5.4 64 Bit Single-Core
min: 1519 avg: 1569 median: 1536 (66%) max: 1649 points
CPU TDP ? | TDP 13 W | TDP 28 W | TDP 35 W | TDP 36 W |
---|
93% | 96% | 100% | 93% | 99% |
...
AMD Ryzen 9 5980HS -2%
AMD Ryzen 9 PRO 6950HS -1%
Intel Core i7-1260U -1%
Intel Core i7-1270P 0%
Intel Core i3-1215U 0%
Intel Core i5-1230U 1%
Intel Core i7-11390H 3%
Intel Core i5-1250P 3%
...
Apple M2 Max 25%
Geekbench 5.4 - Geekbench 5.1 - 5.4 64 Bit Multi-Core
min: 4241 avg: 4940 median: 4734 (16%) max: 6349 points
CPU TDP ? | TDP 13 W | TDP 28 W | TDP 35 W | TDP 36 W |
---|
70% | 75% | 75% | 78% | 100% |
...
Intel Core i5-1038NG7 -8%
Intel Core i7-8850H -1%
Intel Core i9-8950HK 5%
Intel Xeon E-2186M 6%
...
Apple M2 Max 211%
Geekbench 5.0 - Geekbench 5.0 64 Bit Single-Core
min: 1575 avg: 1606 median: 1605.5 (7%) max: 1636 points
CPU TDP 28 W | TDP 36 W |
---|
100% | 96% |
...
Intel Core i5-1230U -5%
Intel Core i7-1250U -4%
Intel Core i7-1260U -3%
Intel Core i5-1250P -1%
Intel Core i5-1245U -1%
Intel Core i7-1265U 3%
Intel Core i7-12850HX 7%
Intel Core i7-12800HX 7%
...
Intel Core i9-12900HK 15%
Geekbench 5.0 - Geekbench 5.0 64 Bit Multi-Core
min: 4683 avg: 5066 median: 5066 (16%) max: 5449 points
CPU TDP 28 W | TDP 36 W |
---|
86% | 100% |
...
Intel Core i7-1065G7 -12%
Intel Core i7-8559U -12%
AMD Ryzen 5 PRO 5675U -12%
Intel Core i7-8850H -4%
Intel Core i7-9750H 10%
...
Geekbench 4.1 - 4.4 - Geekbench 4.1 - 4.4 64 Bit Single-Core
min: 6818 avg: 6894 median: 6894 (71%) max: 6970 points
CPU TDP 28 W | TDP 36 W |
---|
100% | 98% |
...
AMD Ryzen 9 5900HS -8%
Intel Core i3-1215U -1%
Intel Core i5-1245U 2%
Intel Core i5-1250P 3%
Intel Core i7-11390H 3%
Intel Core i7-1265U 9%
Intel Core i7-12650H 10%
Intel Core i9-12900HK 16%
...
Intel Core i9-13900HX 29%
Geekbench 4.1 - 4.4 - Geekbench 4.1 - 4.4 64 Bit Multi-Core
min: 18904 avg: 20630 median: 20629.5 (23%) max: 22355 points
CPU TDP 28 W | TDP 36 W |
---|
85% | 100% |
...
Intel Core i7-8559U -12%
AMD Ryzen 5 PRO 5675U -4%
Intel Xeon E-2176M 0%
...
Intel Core i9-13900HX 245%
Mozilla Kraken 1.1 - Kraken 1.1 Total Score *
min: 594 avg: 664 median: 612 (1%) max: 1047 ms
CPU TDP ? | TDP 13 W | TDP 20 W | TDP 28 W | TDP 35 W | TDP 36 W | TDP 50 W |
---|
100% | 100% | 100% | 100% | 100% | 100% | 100% |
...
AMD Ryzen 5 PRO 5675U 0%
Intel Core i5-1250P 11%
Intel Xeon W-10885M 11%
...
AMD A4-1250 4456%
Sunspider - Sunspider 1.0 Total Score *
118.3 ms (1%)
...
Intel Core i5-7360U -6%
Intel Core i5-6198DU -4%
Intel Core i7-4870HQ -3%
Intel Core M-5Y71 -2%
Intel Core i7-11390H -1%
Intel Core i3-7130U -1%
Intel Pentium Gold 4415U 1%
Intel Core i5-4258U 3%
Intel Core i5-3437U 3%
Intel Core i5-7200U 5%
Intel Core i3-6100U 6%
...
Octane V2 - Octane V2 Total Score
69945 Points (72%)
...
AMD Ryzen 9 5980HS -4%
AMD Ryzen 7 PRO 6850U 3%
AMD Ryzen 7 PRO 6860Z 5%
Apple M2 5%
Intel Core i7-1265U 8%
...
WebXPRT 3 - WebXPRT 3 Score
min: 195 avg: 255 median: 261 (66%) max: 271 Points
CPU TDP ? | TDP 13 W | TDP 20 W | TDP 28 W | TDP 35 W | TDP 36 W | TDP 50 W |
---|
96% | 93% | 96% | 96% | 86% | 100% | 98% |
...
Intel Core i5-1230U -3%
Intel Core i5-1250P 0%
Intel Core i3-1215U 0%
...
CrossMark - CrossMark Overall
min: 1341 avg: 1412 median: 1435 (55%) max: 1460 Points
CPU TDP 35 W | TDP 36 W |
---|
100% | 93% |
...
AMD Ryzen 9 PRO 6950HS -5%
Intel Core i5-1230U -5%
AMD Ryzen 7 PRO 6850U -2%
Intel Core i7-1250U -1%
AMD Ryzen 9 5900HS 0%
AMD Ryzen 5 PRO 6650U 0%
AMD Ryzen 7 PRO 6850H 5%
...
Power Consumption - Prime95 Power Consumption - external Monitor *
min: 15.6 avg: 40.8 median: 36.7 (6%) max: 65.9 Watt
CPU TDP 13 W | TDP 20 W | TDP 35 W | TDP 36 W | TDP 50 W |
---|
110% | 106% | 106% | 103% | 100% |
...
AMD Ryzen 7 PRO 6850U -7%
Intel Core i7-1260U -7%
Intel Core i7-7660U -2%
AMD Ryzen 5 3580U 1%
Intel Core i7-1265U 2%
AMD Ryzen 5 PRO 6650U 3%
Intel Core i5-7360U 3%
...
Intel Core i7-12800HX 335%
Gigabyte U4 UD: Ø15.6 (13.9-19.8)
GPD Pocket 3: Ø34 (31.5-39.8)
Asus ExpertBook B7 Flip B7402FEA: Ø36.7 (27.7-52.9)
MSI Prestige 14 Evo A11MO-026US: Ø51.6 (44.4-65.5)
VAIO SX14 VJS144X0111K: Ø65.9 (65-66)
Power Consumption - Cinebench R15 Multi Power Consumption - external Monitor *
min: 18.4 avg: 46 median: 49.3 (10%) max: 66 Watt
CPU TDP 13 W | TDP 20 W | TDP 35 W | TDP 36 W | TDP 50 W |
---|
111% | 107% | 104% | 101% | 100% |
...
Intel Core i5-8260U -5%
Intel Core i5-8259U -3%
Intel Core i5-1250P -1%
Intel Core i5-1230U -1%
Intel Core i3-1215U 4%
Intel Core i7-1265U 6%
AMD Ryzen 5 PRO 6650U 8%
...
Intel Core i9-12950HX 332%
Gigabyte U4 UD: Ø18.4 (8.46-53)
GPD Pocket 3: Ø36 (29.9-38.8)
Asus ExpertBook B7 Flip B7402FEA: Ø49.3 (39.5-60.3)
MSI Prestige 14 Evo A11MO-026US: Ø60.3 (49.1-65.6)
VAIO SX14 VJS144X0111K: Ø66 (65.7-66)
Power Consumption - Idle Power Consumption 150cd 1min *
min: 3.32 avg: 3.8 median: 3.8 (10%) max: 4.34 Watt
CPU TDP 35 W | TDP 36 W |
---|
103% | 100% |
Apple M2 -9%
Intel Celeron N4120 -6%
Intel Core i7-1265U 8%
AMD Ryzen 5 PRO 6650U 17%
AMD Ryzen 7 PRO 6850U 18%
...
Asus ExpertBook B7 Flip B7402FEA: Ø3.32 (2.83-5.24)
MSI Prestige 14 Evo A11MO-026US: Ø4.34 (3.21-7.27)
Power Consumption - Cinebench R15 Multi Power Efficiency - external Monitor
min: 15.1 avg: 21.6 median: 20 (23%) max: 35.5 Points per Watt
CPU TDP 13 W | TDP 20 W | TDP 35 W | TDP 36 W | TDP 50 W |
---|
100% | 58% | 56% | 47% | 43% |
...
Intel Celeron J4125 -2%
AMD Ryzen 5 6600HS -1%
...
- Range of benchmark values for this graphics card

- Average benchmark values for this graphics card
* Smaller numbers mean a higher performance
v1.22
log 21. 01:11:59
#0 no ids found in url (should be separated by "_") +0s ... 0s
#1 not redirecting to Ajax server +0s ... 0s
#2 did not recreate cache, as it is less than 5 days old! Created at Fri, 20 Jan 2023 08:57:08 +0100 +0.001s ... 0.001s
#3 no comparison url found in template nbc.compare_page_2 needed +0.007s ... 0.008s
#4 no comparison url found in template nbc.compare_page_2 needed +0s ... 0.008s
#5 no comparison url found in template nbc.compare_page_2 needed +0s ... 0.008s
#6 no comparison url found in template nbc.compare_page_2 needed +0s ... 0.009s
#7 no comparison url found in template nbc.compare_page_2 needed +0s ... 0.009s
#8 no comparison url found in template nbc.compare_page_2 needed +0s ... 0.009s
#9 no comparison url found in template nbc.compare_page_2 needed +0s ... 0.009s
#10 composed specs +0s ... 0.009s
#11 did output specs +0s ... 0.009s
#12 getting avg benchmarks for device 13181 +0.011s ... 0.02s
#13 got single benchmarks 13181 +0.036s ... 0.056s
#14 got avg benchmarks for devices +0s ... 0.056s
#15 min, max, avg, median took s +0.57s ... 0.626s
#16 no comparison url found in template nbc.compare_page_2 needed +0s ... 0.626s
#17 return log +0s ... 0.626s
Reviews for the Intel Core i7-1195G7 processor
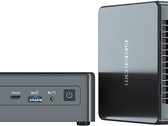
Geekom Mini IT11 SFF台式电脑上手。坚实的紧凑型Tiger Lake PC
Geekom Mini IT11是一款坚固的小尺寸台式机,有大量的端口和足够的CPU马力,适合一般的媒体工作。当iGPU满载时,它在热量管理方面有困难。最终,Mini IT11是一个物美价廉的选择。...
Intel Core i7-1195G7 | Intel Iris Xe Graphics G7 96EUs | | 565 g
华硕ExpertBook B7 Flip在审查中。具有5G调制解调器和长电池寿命的2合1笔记本电脑
ExpertBook提供了一个5G调制解调器,两个Thunderbolt 4端口,以及一个14英寸触摸屏(1920x1200像素),长宽比为16:10。触摸屏可以通过触摸输入和附带的华硕笔来使用。...
Intel Core i7-1195G7 | Intel Iris Xe Graphics G7 96EUs | 14.00" | 1.4 kg
Gigabyte U4 UD 笔记本电脑评测。轻量级,有很大的潜力,但有时会被浪费掉
一个速度高达5GHz的处理器与16GB的内存相结合,保证了良好的性能。阅读我们的评论,了解14英寸紧凑型技嘉U4 UD是否能满足这些期望,以及它在图形性能、电池寿命等方面的表现。...
Intel Core i7-1195G7 | Intel Iris Xe Graphics G7 96EUs | 14.00" | 958 g
GPD Pocket 3可转换UMPC回顾。比许多英特尔EVO笔记本电脑更快
8英寸的Pocket 3挤进了许多与全尺寸笔记本电脑相同的功能,包括第11代酷睿i7处理器、Wi-Fi 6E、PCIe4 NVMe SSD、Thunderbolt 4,并支持Windows 11甚至RS-232。我们只发现了几个明显的注意事项,我们希望未来的修订能够解决这些问题。...
Intel Core i7-1195G7 | Intel Iris Xe Graphics G7 96EUs | 8.00" | 730 g
2021年VAIO SX14回顾。2500美元的酷睿i7超极本
Vaio希望你为一台Windows电脑支付Apple 。虽然低端的酷睿i5配置对于你所得到的东西来说价格适中,但我们的高端酷睿i7配置并没有提供更多东西来证明其700美元的巨大附加费用。...
Intel Core i7-1195G7 | Intel Iris Xe Graphics G7 96EUs | 14.00" | 1.1 kgHP 14s-dq4001ns: Intel Iris Xe Graphics G7 96EUs, 14.00", 1.5 kg
External Review » HP 14s-dq4001ns
MSI Modern 14 B11SBU: Intel Iris Xe Graphics G7 96EUs, 14.00", 13 kg
External Review » MSI Modern 14 B11SBU
MSI Modern 14 B11MO-879XES: Intel Iris Xe Graphics G7 96EUs, 14.00", 1.3 kg
External Review » MSI Modern 14 B11MO-879XES
HP 15s-fq4086ns: Intel Iris Xe Graphics G7 96EUs, 15.60", 1.7 kg
External Review » HP 15s-fq4086ns
HP Pavilion x360 14-dy1034ns: Intel Iris Xe Graphics G7 96EUs, 14.00", 1.5 kg
External Review » HP Pavilion x360 14-dy1034ns
Asus ExpertBook B7 Flip B7402FEA: Intel Iris Xe Graphics G7 96EUs, 14.00", 1.4 kg
External Review » Asus ExpertBook B7 Flip B7402FEA
Acer TravelMate Vero TMV15-51-728C: Intel Iris Xe Graphics G7 96EUs, 15.60", 1.8 kg
External Review » Acer TravelMate Vero TMV15-51-728C
HP Pavilion x360 14-dy1004ns: Intel Iris Xe Graphics G7 96EUs, 14.00", 1.5 kg
External Review » HP Pavilion x360 14-dy1004ns
Huawei MateBook X Pro 2022: Intel Iris Xe Graphics G7 96EUs, 14.20", 1.4 kg
External Review » Huawei MateBook X Pro 2022
HP 15s-fq4005ns: Intel Iris Xe Graphics G7 96EUs, 15.60", 1.7 kg
External Review » HP 15s-fq4005ns
Lenovo Yoga 9 14ITL5-82BG009WUS: Intel Iris Xe Graphics G7 96EUs, 14.00", 1.4 kg
External Review » Lenovo Yoga 9 14ITL5-82BG009WUS
HP Spectre x360 14-ea1013TU: Intel Iris Xe Graphics G7 96EUs, 13.50", 1.3 kg
External Review » HP Spectre x360 14-ea1013TU
HP Envy x360 15m-es1023dx: Intel Iris Xe Graphics G7 96EUs, 15.60", 1.8 kg
External Review » HP Envy x360 15m-es1023dx
HP 15s-fq4006ns: Intel Iris Xe Graphics G7 96EUs, 15.60", 1.7 kg
External Review » HP 15s-fq4006ns
Gigabyte U4 UD: Intel Iris Xe Graphics G7 96EUs, 14.00", 1 kg
External Review » Gigabyte U4 UD
Asus ExpertBook B7 Flip B7402FEA-LA0413R: Intel Iris Xe Graphics G7 96EUs, 14.00", 1.5 kg
External Review » Asus ExpertBook B7 Flip B7402FEA-LA0413R
Acer Aspire Vero AV15-51-76PV: Intel Iris Xe Graphics G7 96EUs, 15.60", 1.8 kg
External Review » Acer Aspire Vero AV15-51-76PV
Acer Aspire Vero AV15-51-78SB: Intel Iris Xe Graphics G7 96EUs, 15.60", 1.8 kg
External Review » Acer Aspire Vero AV15-51-78SB
Acer Aspire Vero AV15-51-7555: Intel Iris Xe Graphics G7 96EUs, 15.60", 1.8 kg
External Review » Acer Aspire Vero AV15-51-7555
MSI Summit E16 Flip Evo A11UCT-028: NVIDIA GeForce RTX 3050 Laptop GPU, 16.00", 2 kg
External Review » MSI Summit E16 Flip Evo A11UCT-028
VAIO SX14 VJS144X0111K: Intel Iris Xe Graphics G7 96EUs, 14.00", 1.1 kg
External Review » VAIO SX14 VJS144X0111K
Acer Aspire Vero AV15-51-78SE: Intel Iris Xe Graphics G7 96EUs, 15.60", 1.8 kg
External Review » Acer Aspire Vero AV15-51-78SE
MSI Prestige 14 Evo A11MO-043: Intel Iris Xe Graphics G7 96EUs, 14.00", 1.3 kg
External Review » MSI Prestige 14 Evo A11MO-043
Please share our article, every link counts!
.170
Other CPUs of the series Tiger Lake
» Intel Core i9-11900KB
8x 3.3 GHz - 5.3 GHz
» Intel Core i7-11600H
6x 2.9 GHz - 4.6 GHz
» Intel Core i7-11390H
4x 3.4 GHz - 5 GHz
» Intel Core i3-1125G4
4x 2 GHz - 3.7 GHz
» Intel Core i3-1115G4
2x 3 GHz - 4.1 GHz
» Intel Celeron 6205
2x
Surrounding CPUs
+ Intel Core i7-11390H
4x 3.4 GHz - 5 GHz
+ Apple M1
8x 2.06 GHz - 3.22 GHz
- Intel Core i5-1250P
12x 1.2 GHz - 4.4 GHz
- Intel Core i5-1340P
12x 1.4 GHz - 4.6 GHz
- Intel Core i5-1345U
10x 1.2 GHz - 4.7 GHz
Klaus Hinum (Update: 2021-08-13)