


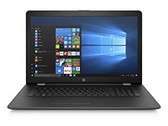
惠普 Pavilion 17z-ak000 (A9-9420, Radeon 530) 笔记本电脑简短评测
龟速。 在速度方面Stoney Ridge落后于主流不少。这台AMD平台设备可以帮助用户节省一些预算,不过它缓慢的响应也是用户需要付出的巨大代价。
AMD A9-9420, Radeon 530, 17.3", 2.6 kgRadeon 530,是2017年发布的、用于笔记本电脑的专用入门级显卡。根据AMD的说法,目前存在几种不同的版本,包括384/320着色单元和DDR3/GDDR5 64位显存。然而,它们不属于新的RX系列Polaris芯片之一,最有可能是采用与Radeon R7 M445 / M440 / M340 / M260 / 8650M / 8590M(384着色器单元,28 纳米 GCN)和M430 / M330 / M230(320个着色单元,28纳米 Sun GCN)相同的构架。AMD声称,Radeon 530的时钟频率可以达到1,024 MHz。
考虑到上面的情况,Radeon 530的游戏性能应该在Radeon R7 M440(320着色单元,DDR3),Radeon R7 M460(384着色单元,DDR3)和Radeon R7 M445(320着色单元,GDDR5)之间。(详情请查阅对应的游戏基准页面)。图形密集型游戏如《羞辱2》,《使命召唤:无限战争》或者《幽浮2》应该不能在这款显卡上顺利运行。而《守望先锋》,《Fifa 17》(配合一个高速的处理器)或《模拟农场17》等对显卡要求不高的游戏,则运行良好。但需要使用低到中等的细节设置。相关的详细的游戏基准,请访问前面带链接卡片的页面。基于不同规格,DDR3版本可能会比Radeon 520更慢,这是又320着色单元和GDDR5决定的。
Radeon 500 Series
| |||||||
| Architecture | GCN | ||||||
| Pipelines | 384 - unified | ||||||
| Core Speed | 1024 MHz | ||||||
| Memory Speed | 2250 MHz | ||||||
| Memory Bus Width | 64 Bit | ||||||
| Memory Type | DDR3, GDDR5 | ||||||
| Max. Amount of Memory | 2048 MB | ||||||
| Shared Memory | no | ||||||
| API | DirectX 12, Shader 5.0, OpenGL 4.5 | ||||||
| Man. Technology | 28 nm | ||||||
| Features | DirectX 12, Mantle, OpenGL, OpenCL 1.2, Vulkan | ||||||
| Date of Announcement | 21.03.2017 | ||||||
| Link to Manufacturer Page | www.amd.com | ||||||
The following benchmarks stem from our benchmarks of review laptops. The performance depends on the used graphics memory, clock rate, processor, system settings, drivers, and operating systems. So the results don't have to be representative for all laptops with this GPU. For detailed information on the benchmark results, click on the fps number.


For more games that might be playable and a list of all games and graphics cards visit our Gaming List
HP 15-bw082nd: AMD A10-9620P, 15.60", 1.9 kg
External Review » HP 15-bw082nd
HP 470 G7, i5-10210U, Radeon 530: Intel Core i5-10210U, 17.30", 2.4 kg
External Review » HP 470 G7, i5-10210U, Radeon 530
Dell Inspiron 13 5370-MRFG2: Intel Core i7-8550U, 13.30", 1.4 kg
External Review » Dell Inspiron 13 5370-MRFG2
HP 15-db0024ns: AMD A9-9425, 15.60", 1.8 kg
External Review » HP 15-db0024ns
Dell Inspiron 15 3576-9HRPY: Intel Core i5-8250U, 15.60", 2.3 kg
External Review » Dell Inspiron 15 3576-9HRPY
HP Pavilion x360 15-cr0004tx: Intel Core i7-8565U, 15.60", 2 kg
External Review » HP Pavilion x360 15-cr0004tx
Lenovo Ideapad 330-15IKB-81DE014NIN: Intel Core i5-8250U, 15.60", 2.2 kg
External Review » Lenovo Ideapad 330-15IKB-81DE014NIN
Dell Vostro 14 5471-5MPNF: Intel Core i7-8550U, 14.00", 1.7 kg
External Review » Dell Vostro 14 5471-5MPNF
Dell Inspiron 15 5570-37HG8: Intel Core i7-8550U, 15.60", 2.3 kg
External Review » Dell Inspiron 15 5570-37HG8
Dell Vostro 14 5471-48619955SLV: Intel Core i5-8250U, 14.00", 1.7 kg
External Review » Dell Vostro 14 5471-48619955SLV
HP 17-by0016ng: Intel Core i5-8250U, 17.30", 2.5 kg
External Review » HP 17-by0016ng
HP 15-bs116ns: Intel Core i7-8550U, 15.60", 2.1 kg
External Review » HP 15-bs116ns
Lenovo V330-15IKB-81AX00AQCK: Intel Core i5-8250U, 15.60", 2 kg
External Review » Lenovo V330-15IKB-81AX00AQCK
Dell Inspiron 15 5570-0302: Intel Core i5-8250U, 15.60", 2.1 kg
External Review » Dell Inspiron 15 5570-0302
Dell Inspiron 17 5770-0364: Intel Core i7-8550U, 17.30", 2.7 kg
External Review » Dell Inspiron 17 5770-0364
HP 17-BS100NS: Intel Core i5-8250U, 17.30", 2.6 kg
External Review » HP 17-BS100NS
Dell Inspiron 15 5570-5441: Intel Core i7-8550U, 15.60", 2.3 kg
External Review » Dell Inspiron 15 5570-5441
HP 17-bs191nd: Intel Core i5-8250U, 17.30", 2.5 kg
External Review » HP 17-bs191nd
HP 15-bs044ns: Intel Core i7-7500U, 15.60", 2.1 kg
External Review » HP 15-bs044ns
» Comparison of GPUs
Detailed list of all laptop GPUs sorted by class and performance.
» Benchmark List
Sort and restrict laptop GPUs based on performance in synthetic benchmarks.
» Notebook Gaming List
Playable games for each graphics card and their average FPS results.
* Approximate position of the graphics adapter
» Notebookcheck多媒体笔记本电脑Top 10排名
» Notebookcheck游戏笔记本电脑Top 10排名
» Notebookcheck低价办公/商务笔记本电脑Top 10排名
» Notebookcheck高端办公/商务笔记本电脑Top 10排名
» Notebookcheck工作站笔记本电脑Top 10排名
» Notebookcheck亚笔记本电脑Top 10排名
» Notebookcheck超级本产品Top 10排名
» Notebookcheck变形本产品Top 10排名
» Notebookcheck平板电脑Top 10排名
» Notebookcheck智能手机Top 10排名
» Notebookcheck评测过最出色的笔记本电脑屏幕
» Notebookcheck售价500欧元以下笔记本电脑Top 10排名
» Notebookcheck售价300欧元以下笔记本电脑Top 10排名