华为MateBook D 16 2022评测--多媒体笔记本电脑现在采用16:10格式,并配有数字键盘

新的MateBook D 16 2022得到了很大的更新,采用了全新的金属外壳,16:10显示屏,并首次采用了带有完整数字键盘的键盘。正如已经在MateBook 16s华为将AMD处理器改为新的Alder Lake一代的英特尔处理器。在价格方面,新的MateBook D 16从949欧元(约958美元)起,配备了 酷睿i5-12450H,16GB内存,以及512GB的大尺寸固态硬盘。然而,我们的测试设备配备了 酷睿i7-12700H和相同的其他设备已经花费1299欧元(约1311美元),所以华为对从酷睿i5升级到酷睿i7收取了350欧元(约353美元)的高额费用。
潜在的竞争对手比较
Rating | Date | Model | Weight | Height | Size | Resolution | Price |
|---|---|---|---|---|---|---|---|
| 83.6 % v7 (old) | 07 / 2022 | Huawei MateBook D 16 2022 i7-12700H, Iris Xe G7 96EUs | 1.7 kg | 18.4 mm | 16.00" | 1920x1200 | |
| 80.6 % v7 (old) | 11 / 2021 | Asus Vivobook 15 K513EQ i7-1165G7, GeForce MX350 | 1.6 kg | 17.9 mm | 15.60" | 1920x1080 | |
| 86 % v7 (old) | 08 / 2021 | Lenovo IdeaPad 5 Pro 16IHU6 i5-11300H, GeForce MX450 | 1.9 kg | 18.4 mm | 16.00" | 2560x1600 | |
| 86.7 % v7 (old) | 10 / 2021 | Dell Inspiron 16 Plus 7610 i7-11800H, GeForce RTX 3050 4GB Laptop GPU | 2 kg | 18.99 mm | 16.00" | 3072x1920 | |
| 86 % v7 (old) | 04 / 2021 | Huawei MateBook D 16-53011VFJ R5 4600H, Vega 6 | 1.7 kg | 18.4 mm | 16.10" | 1920x1080 |
案例和设备
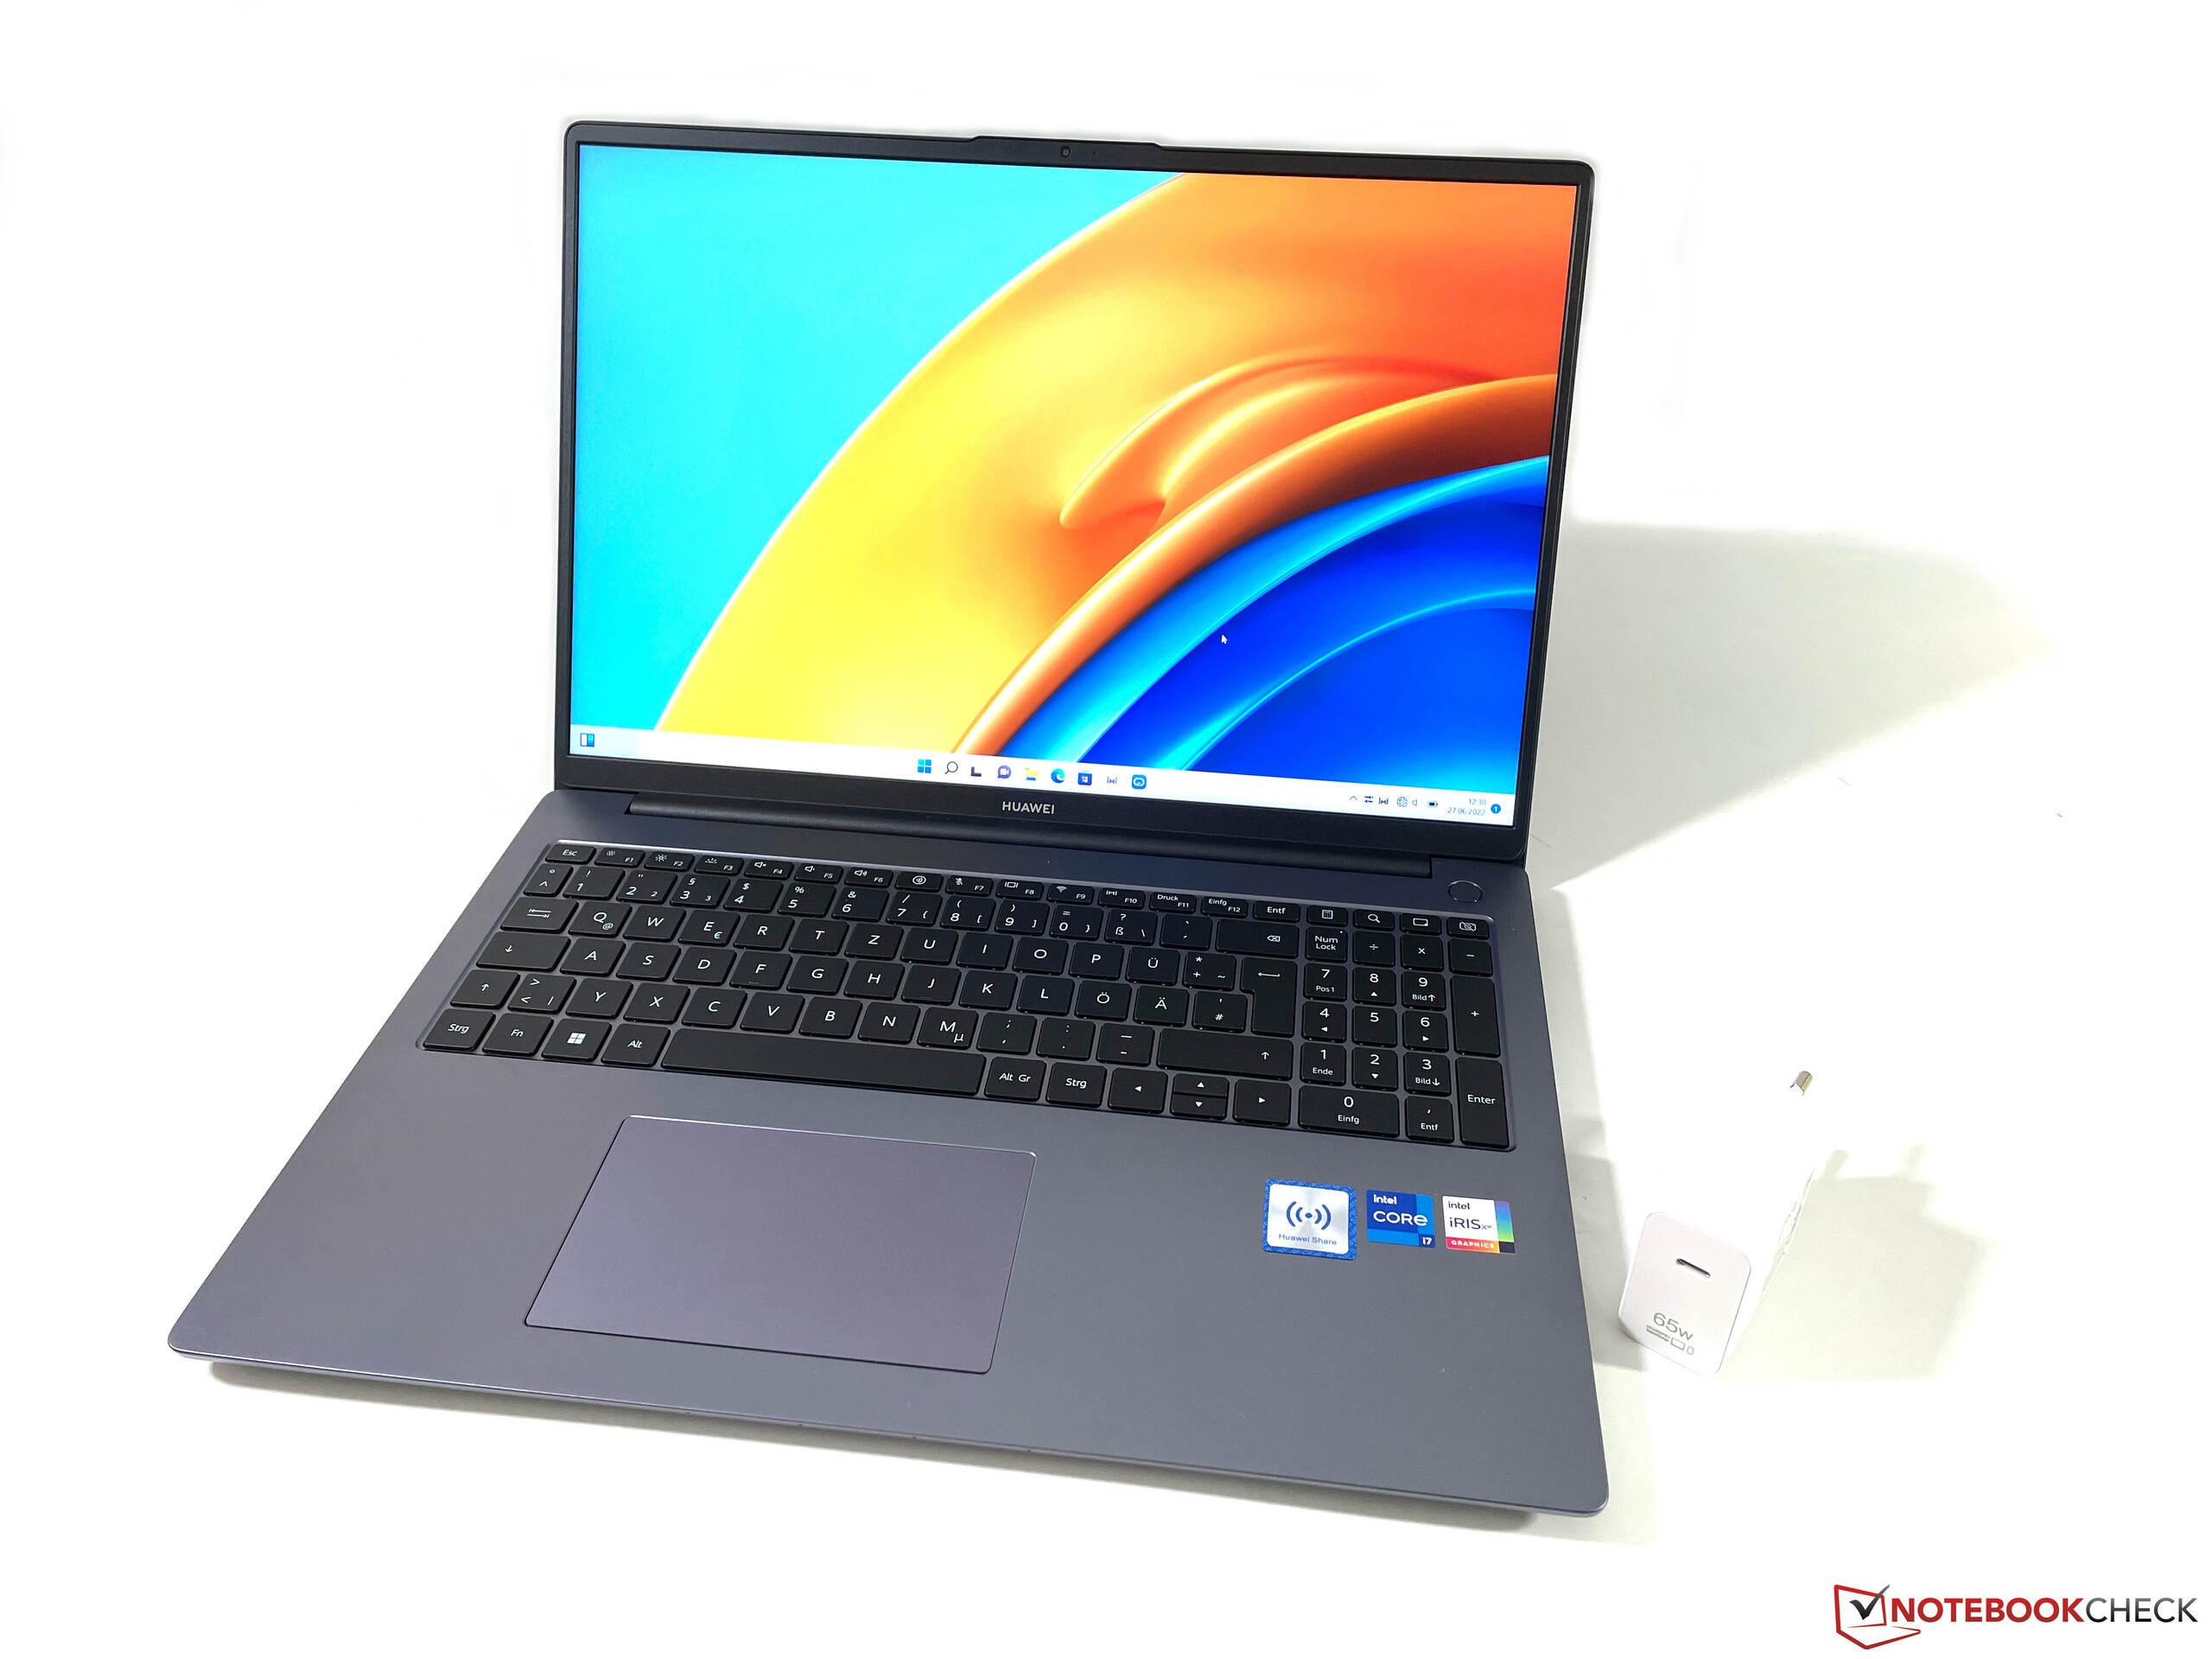
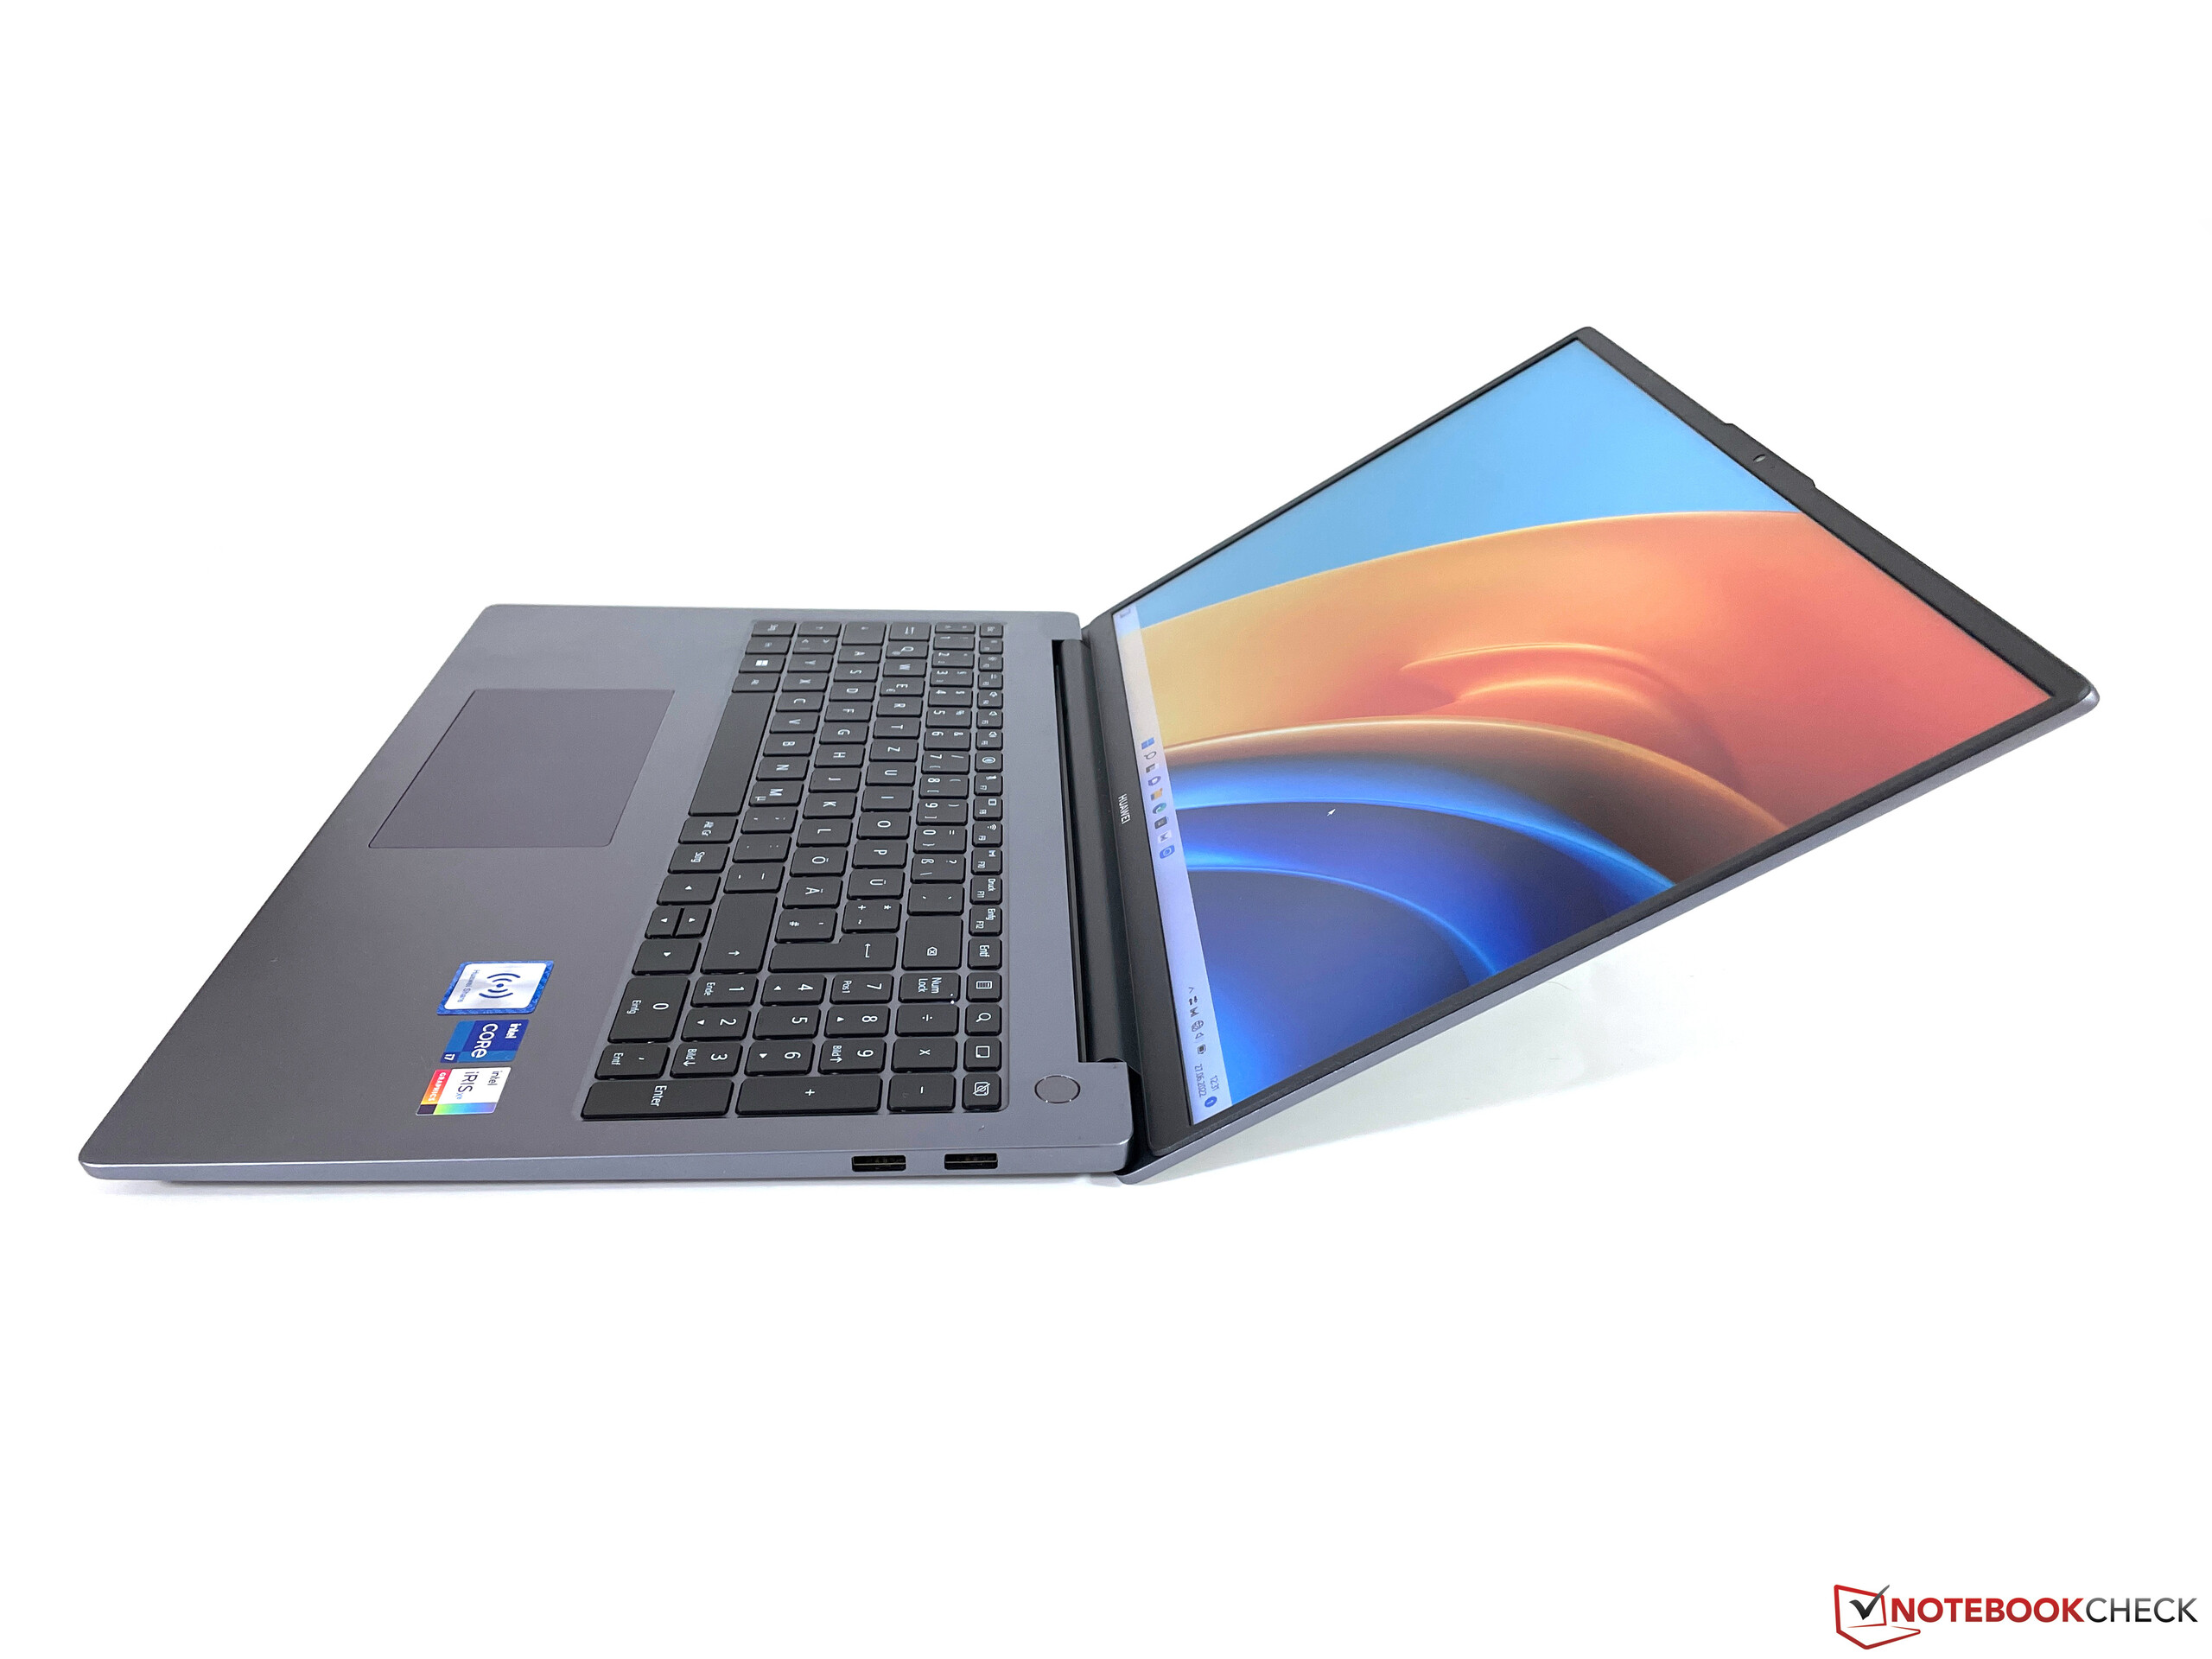
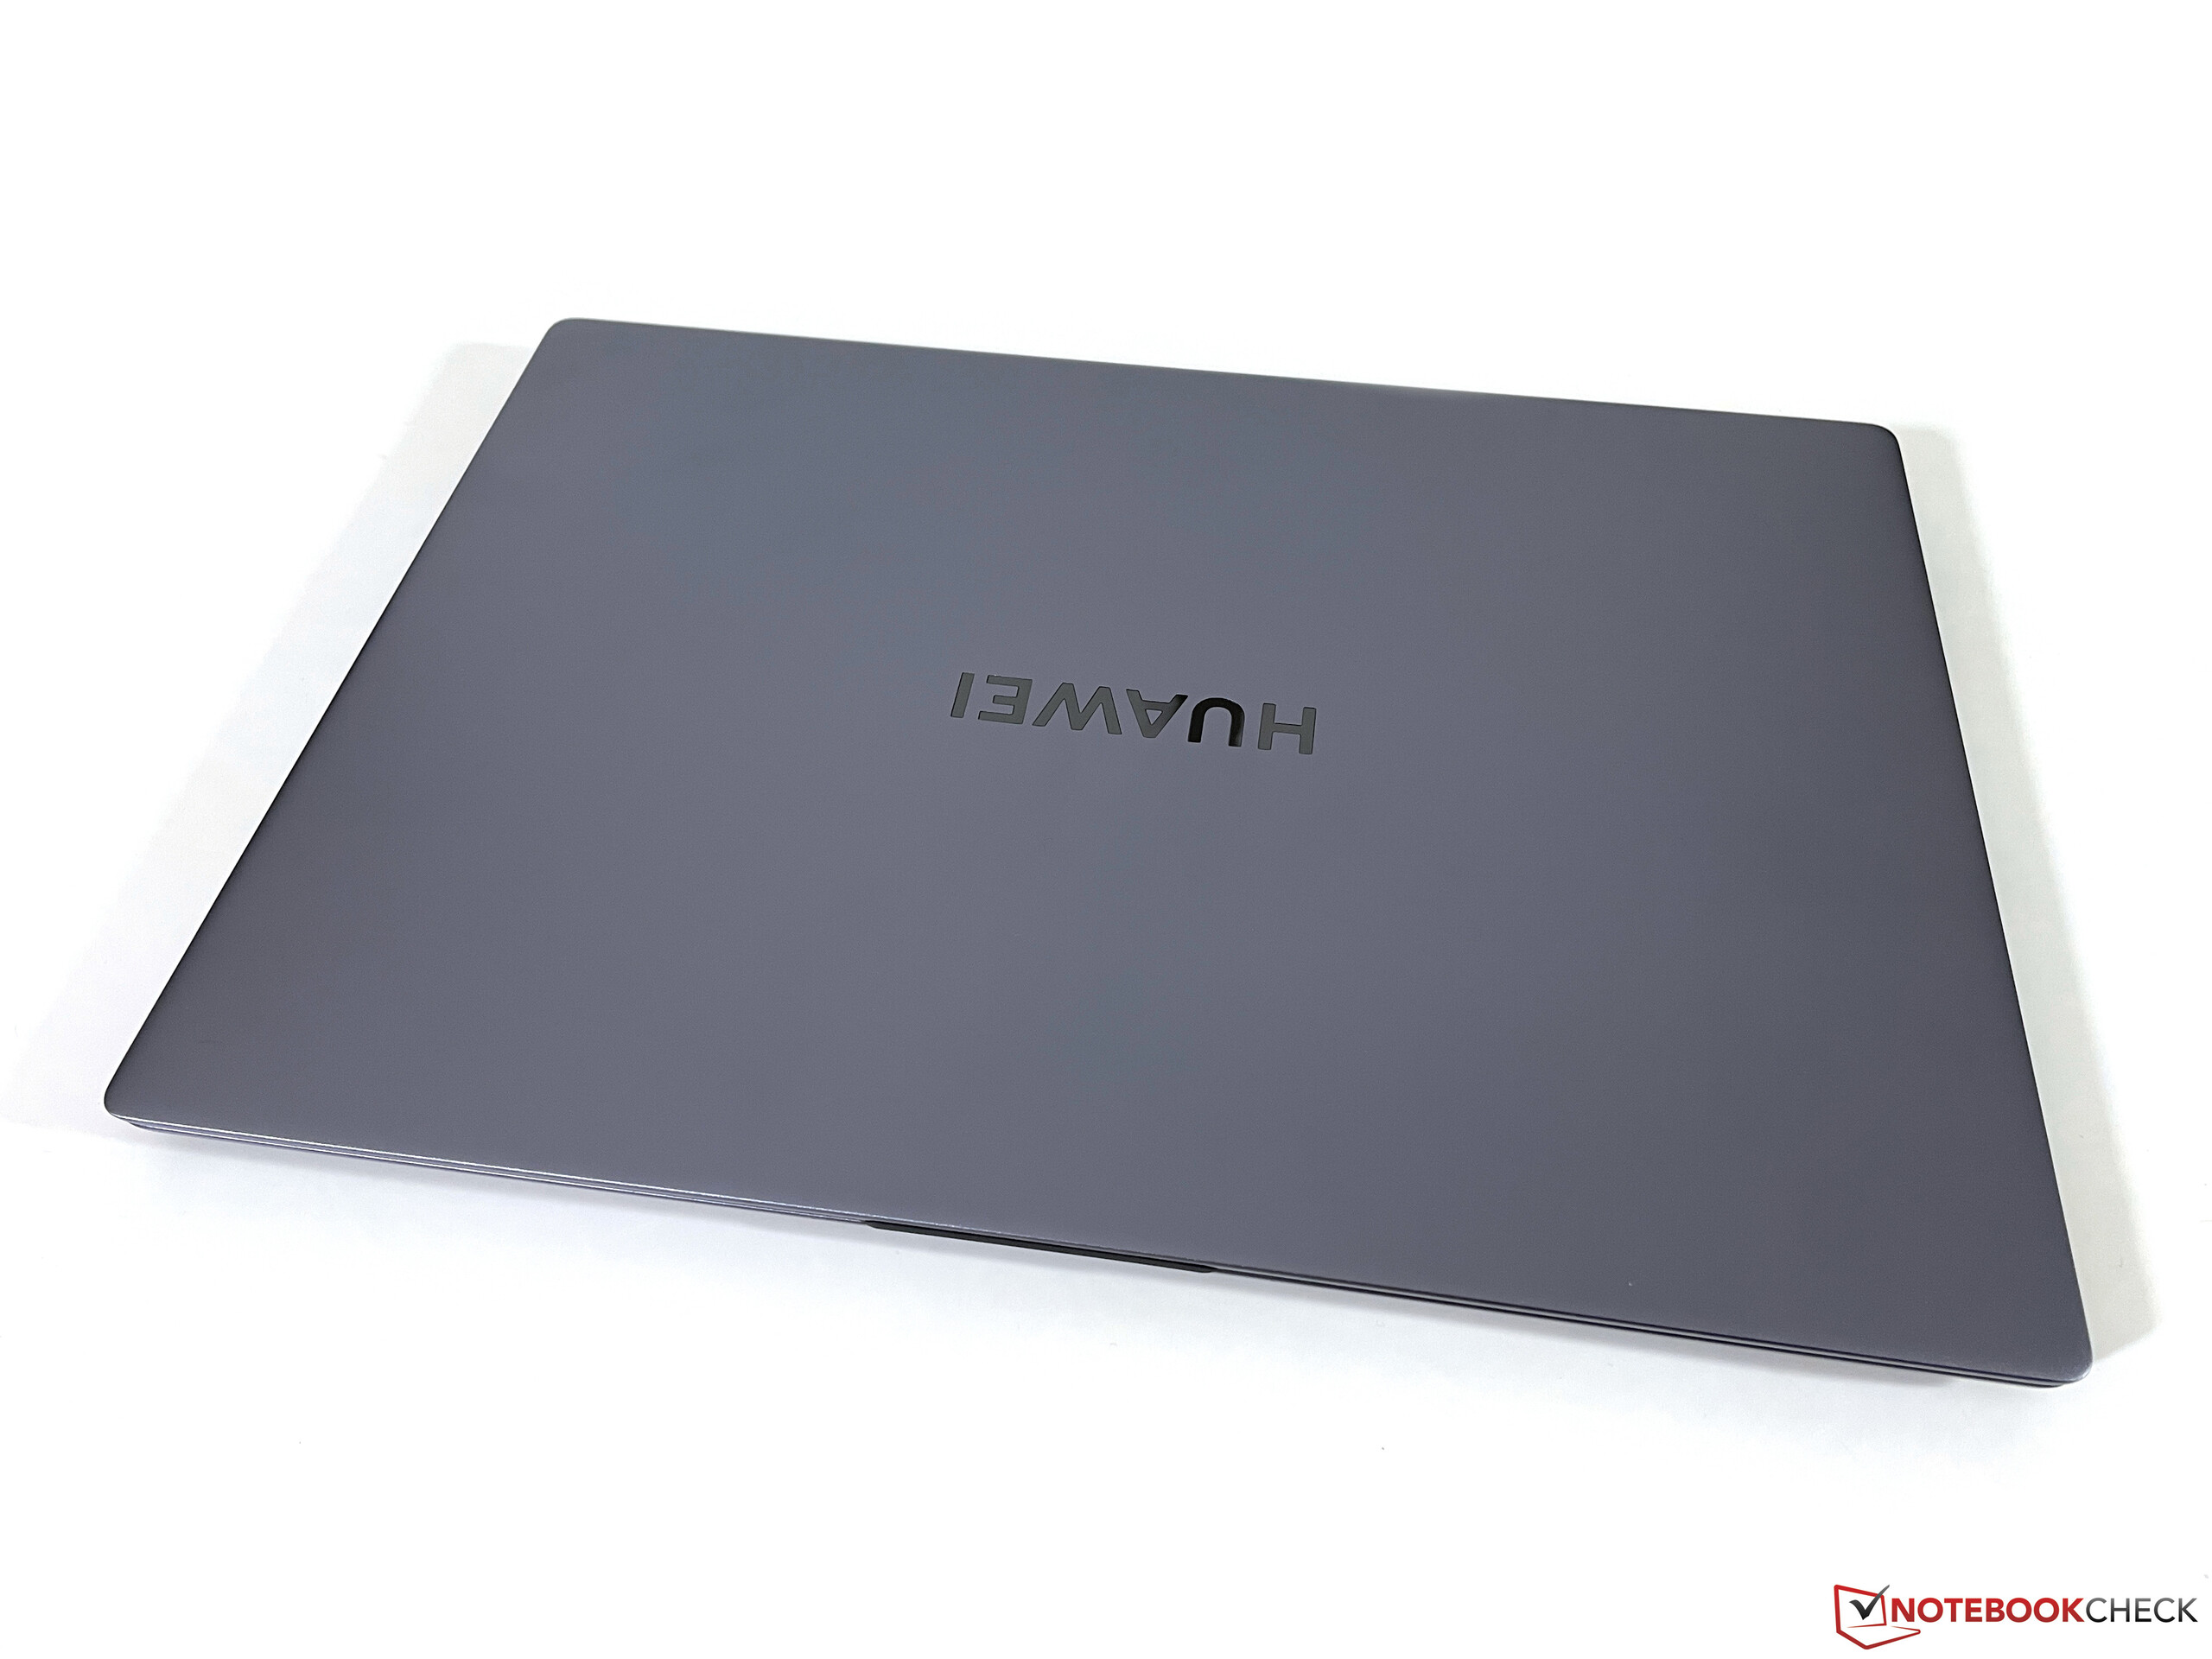
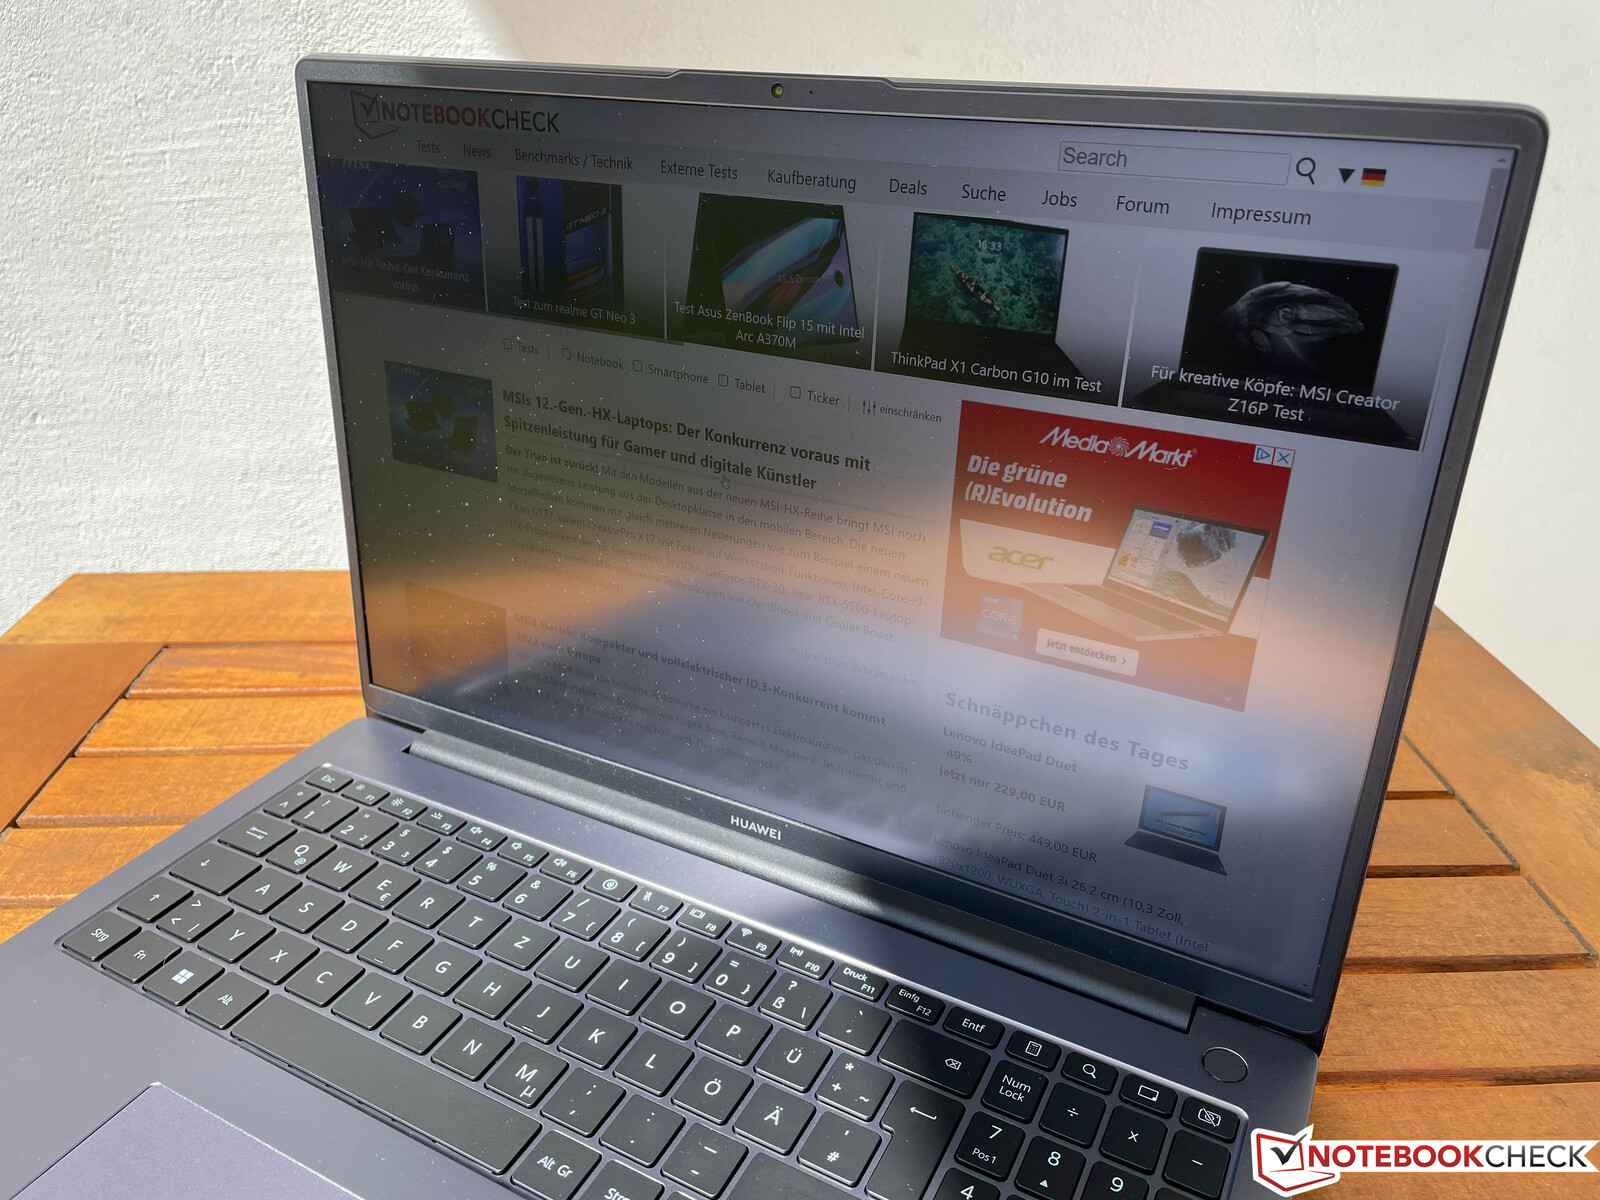
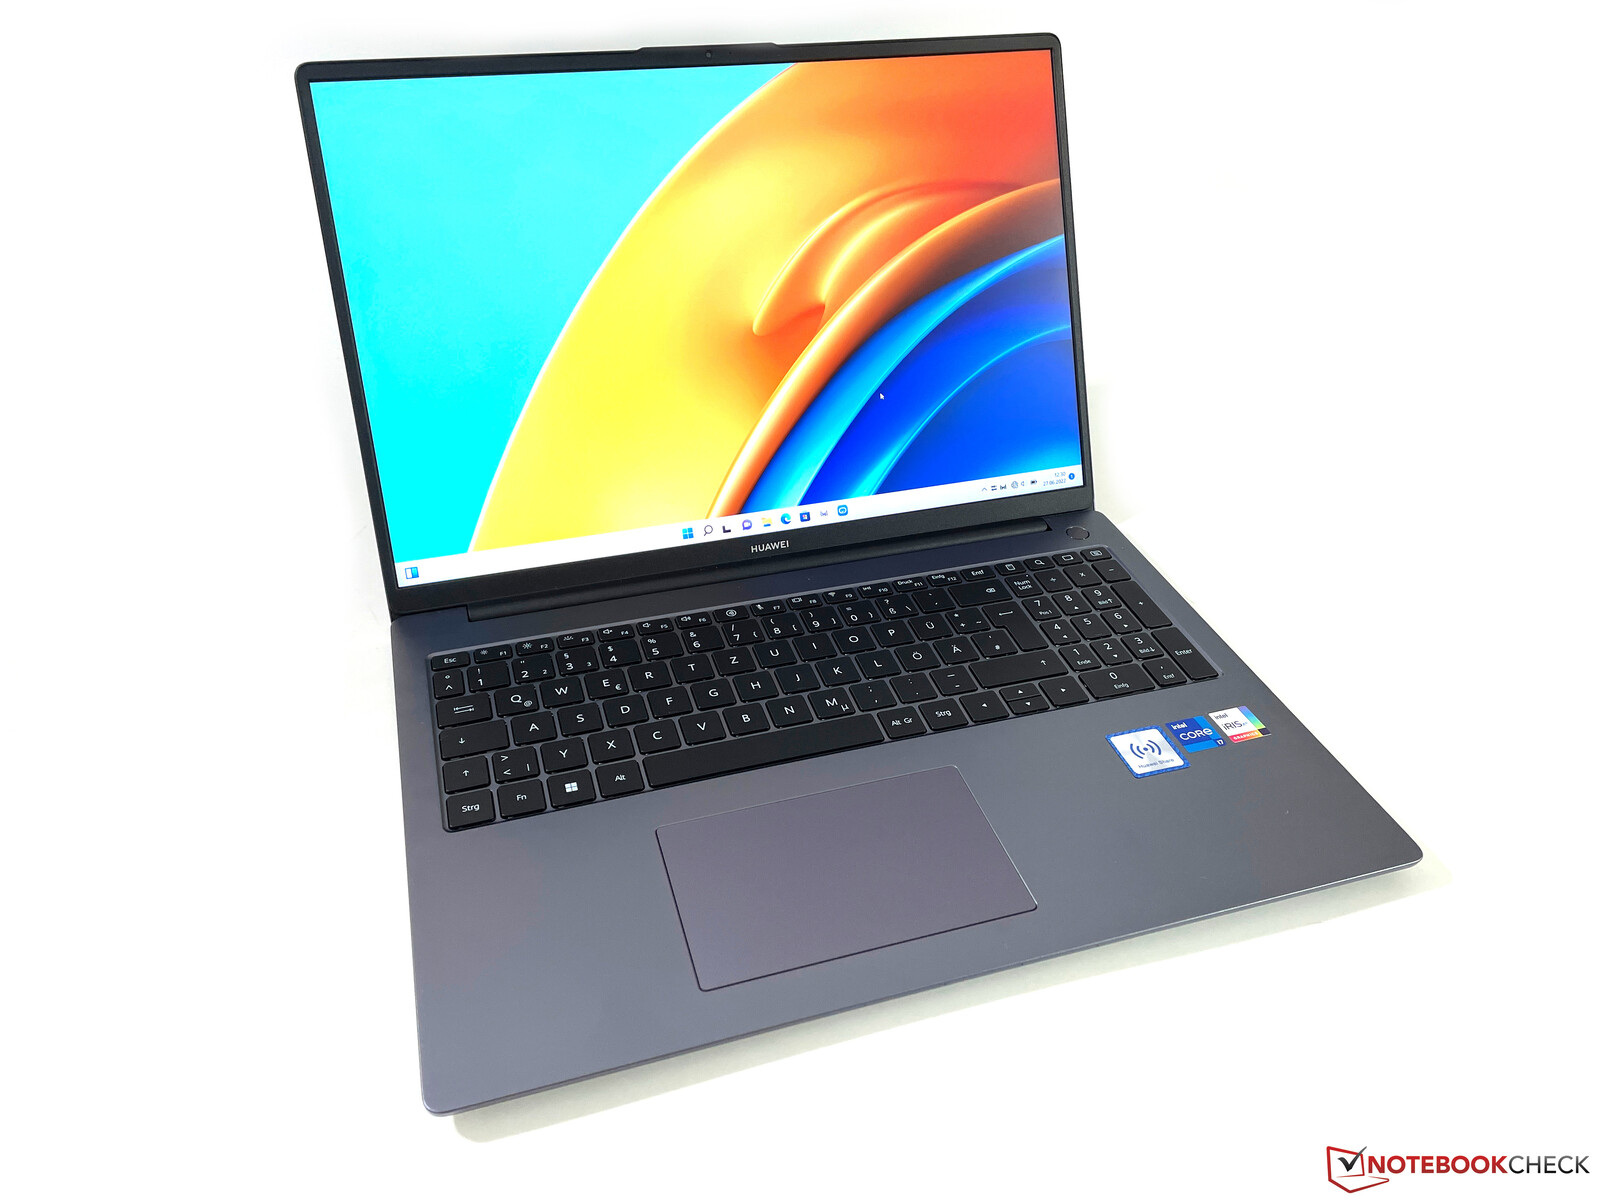
华为已经完全重新设计了新的MateBook D 16的外壳,现在主要沿用了MateBook 16s的设计。 MateBook 16s.就外观而言,这两款笔记本电脑几乎没有区别,除了因其不同的屏幕格式(MateBook 16s为3:2,MateBook D 16为16:10)而尺寸略有不同。这绝对是MateBook D 16的升级,我们没有找到很多抱怨的理由,无论是在做工方面,还是在外壳的稳定性方面。
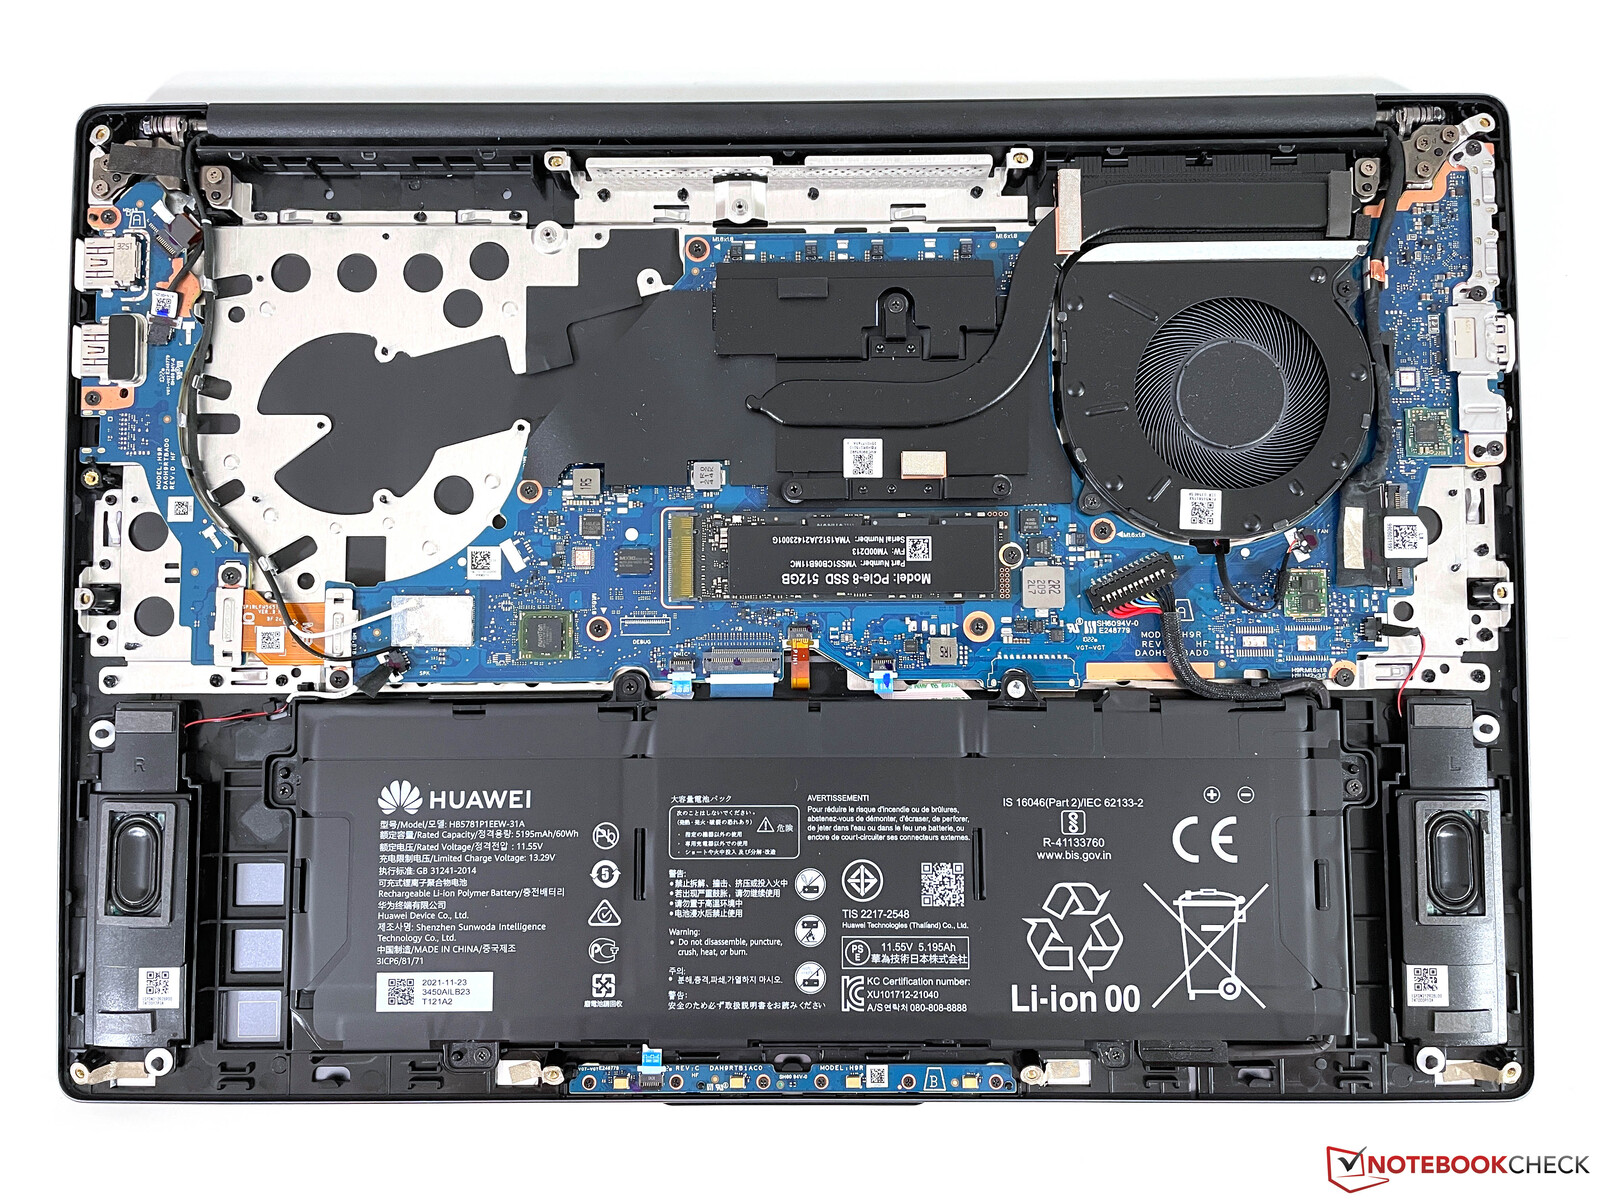
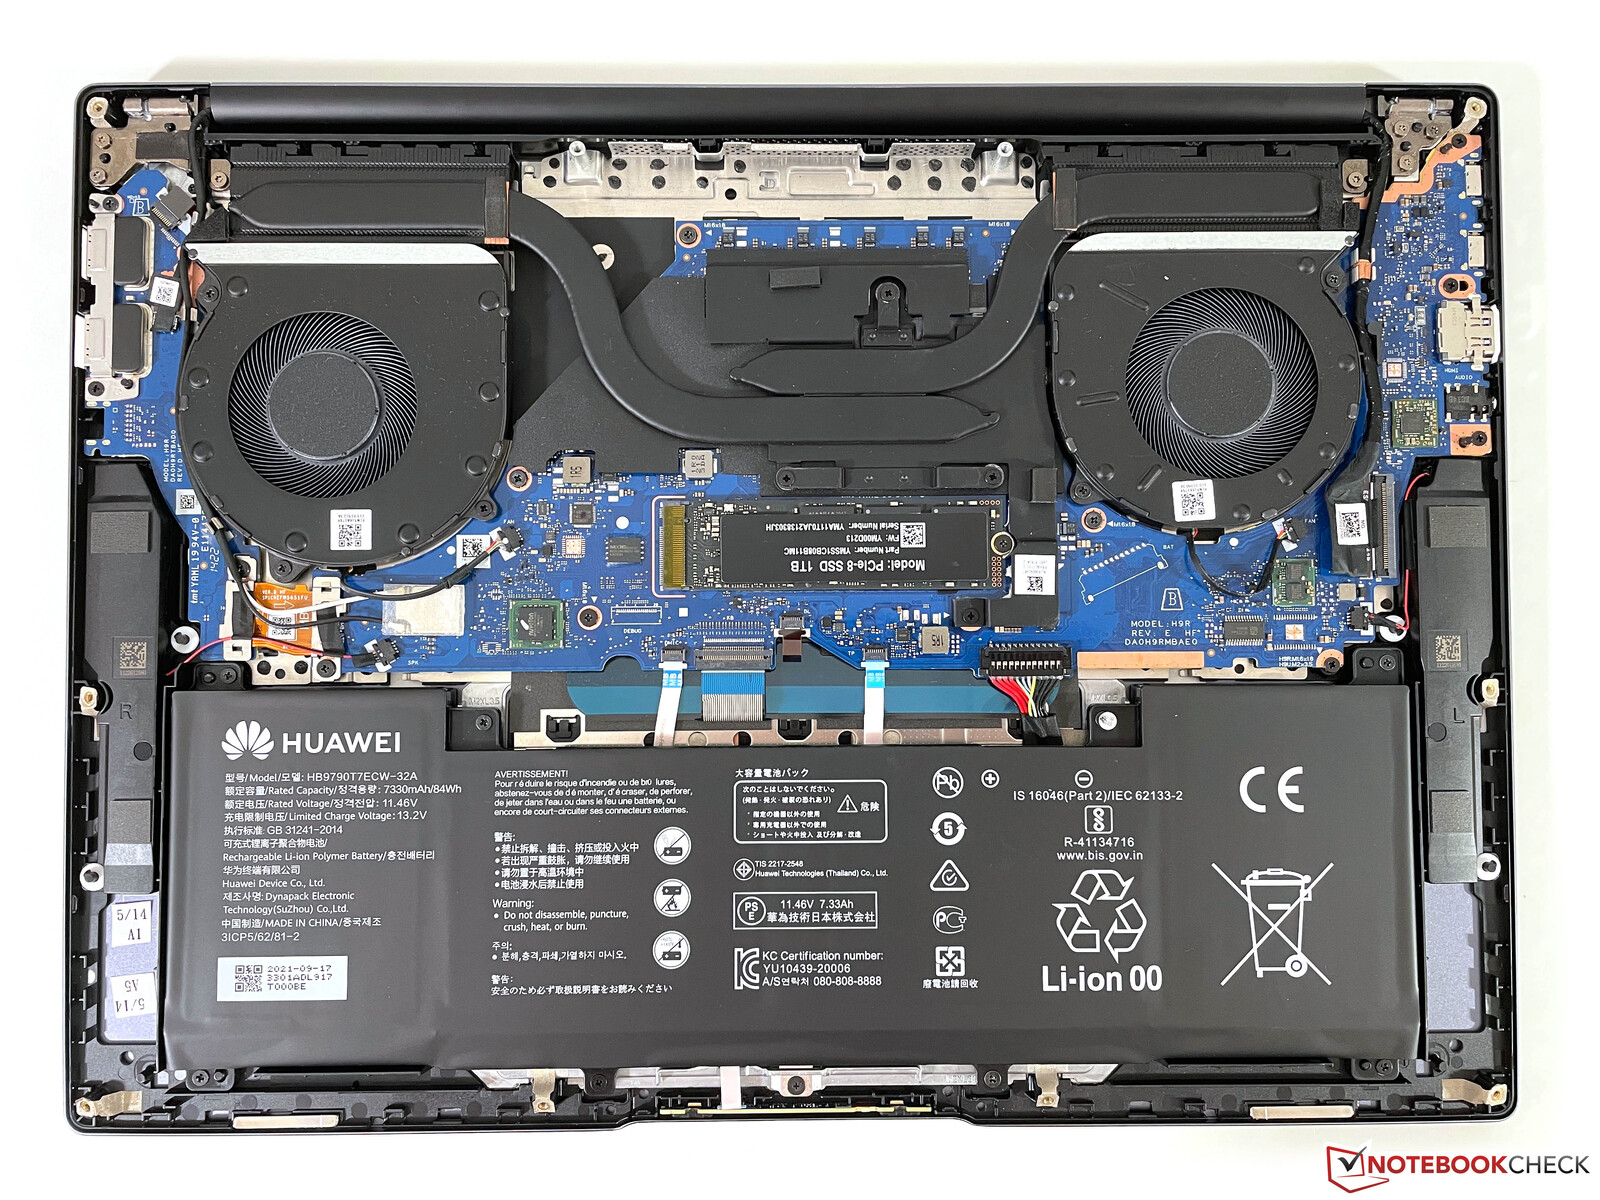
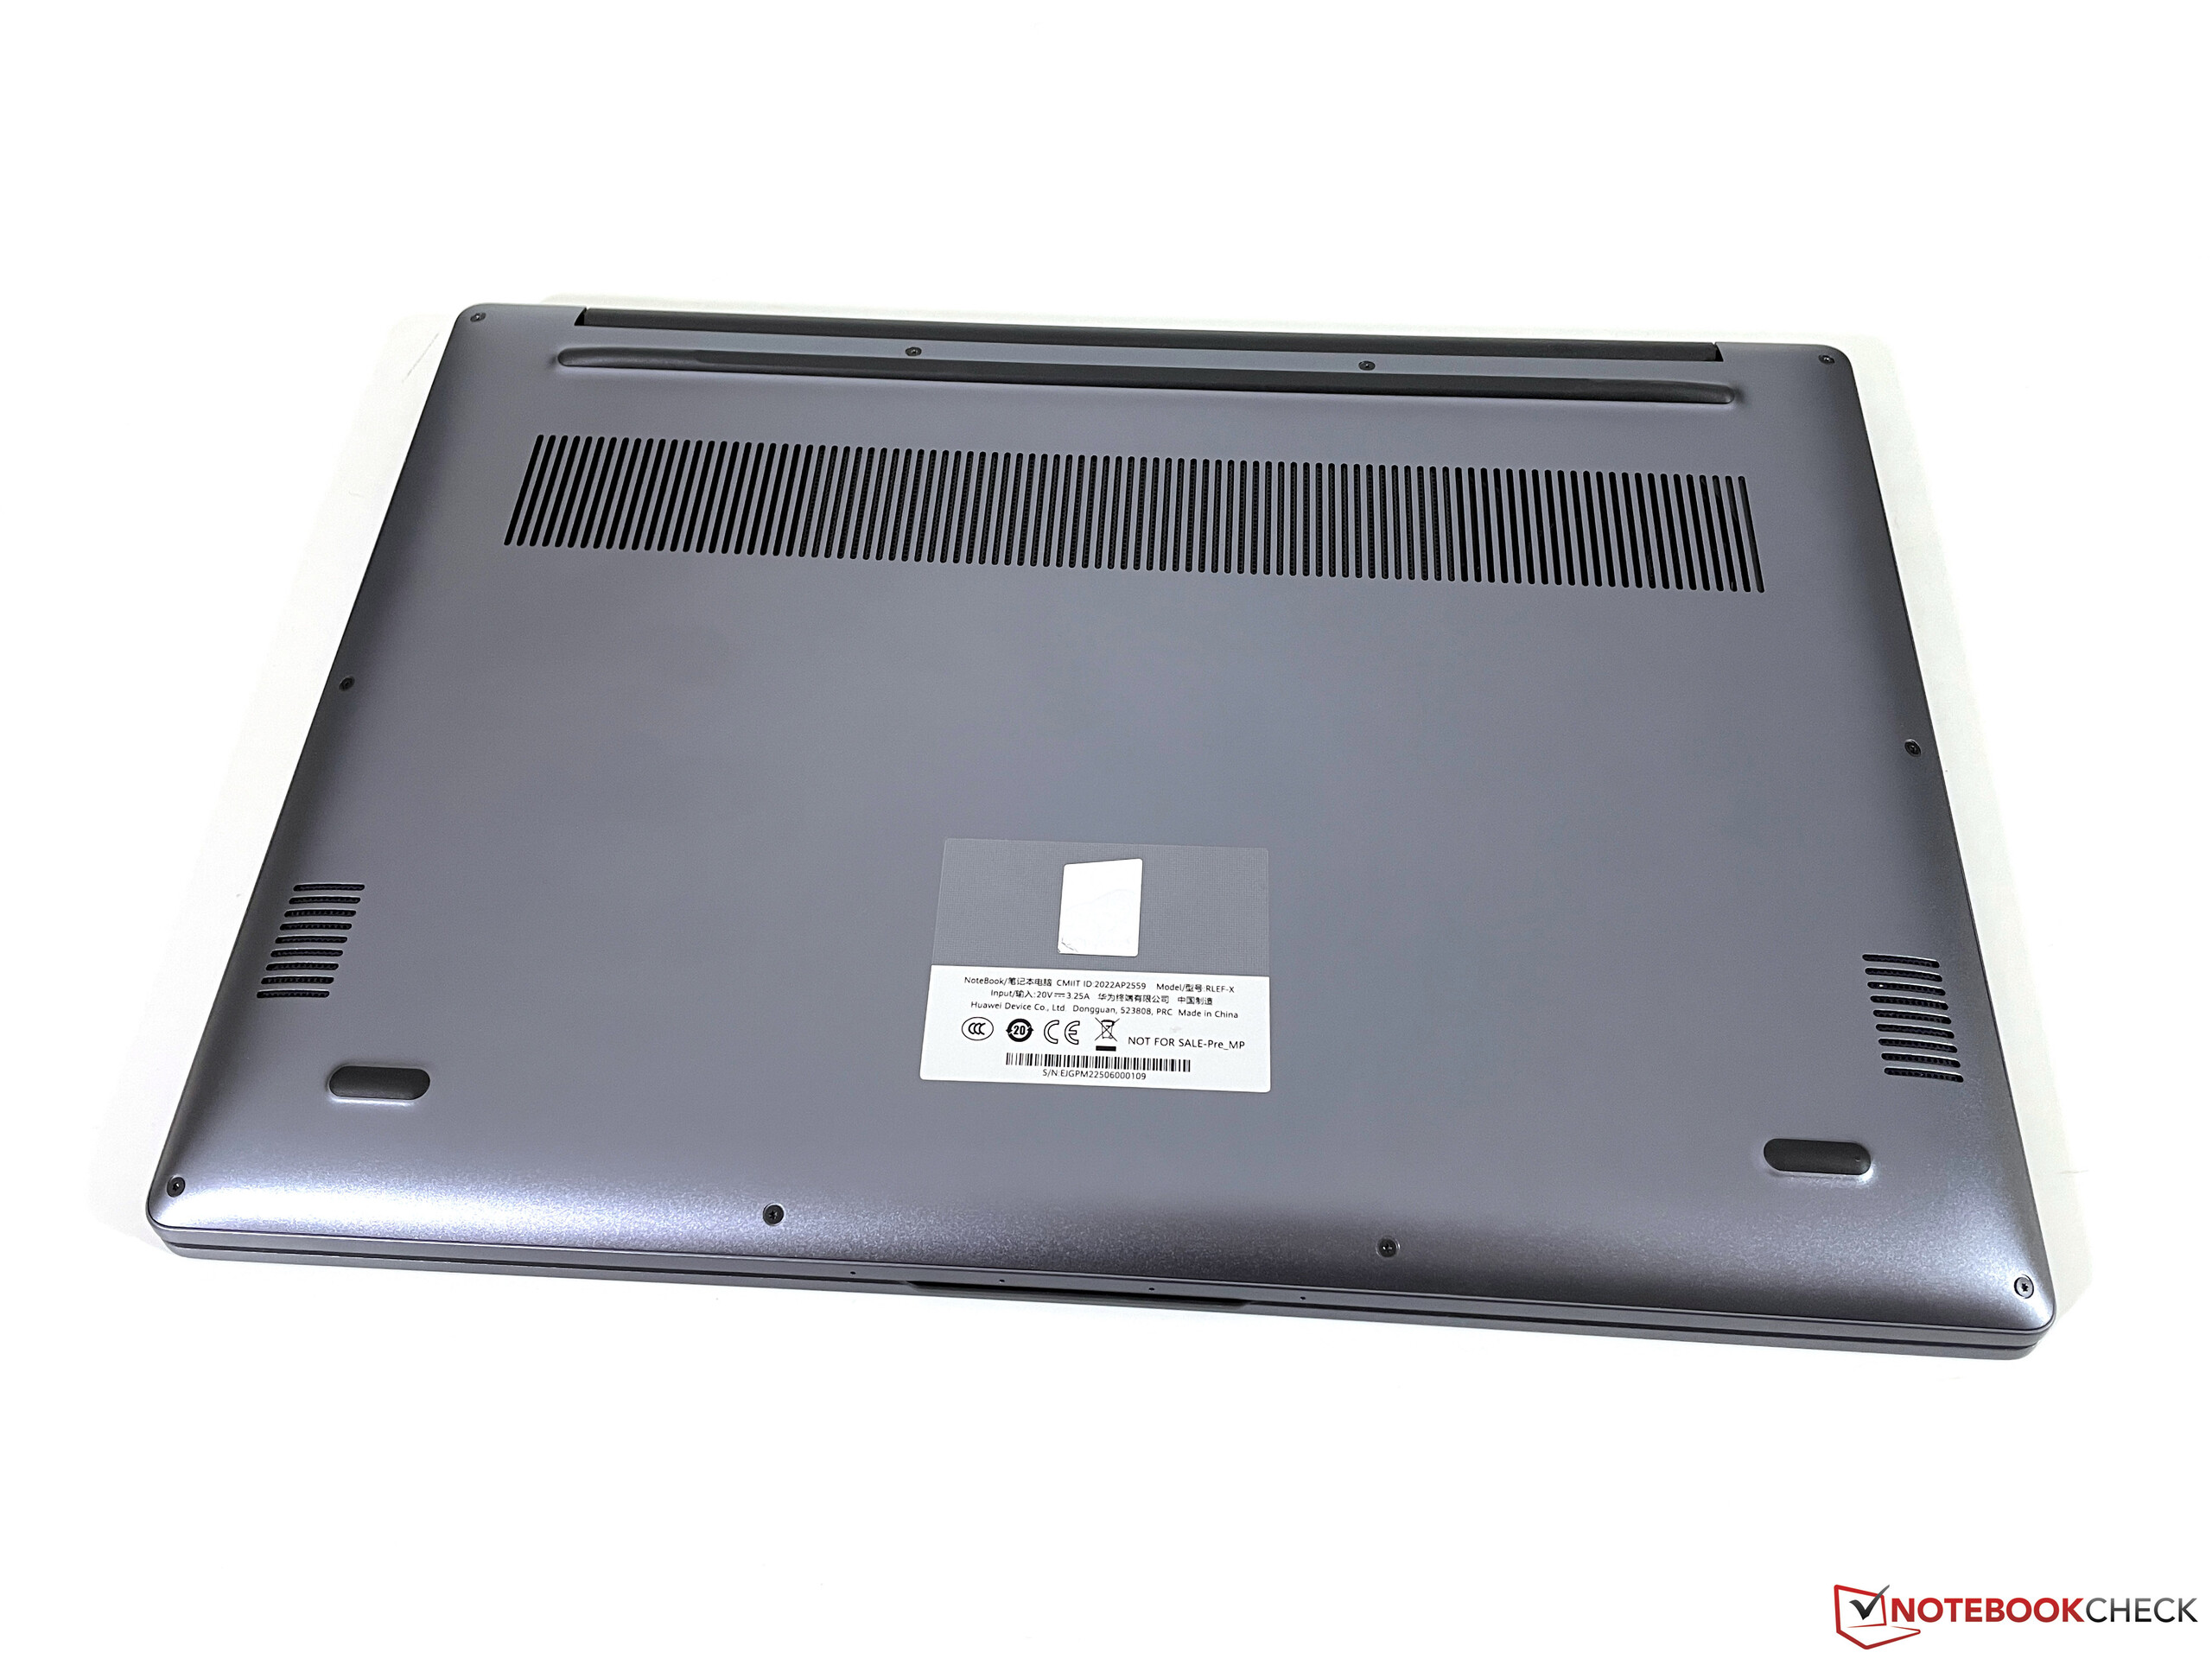
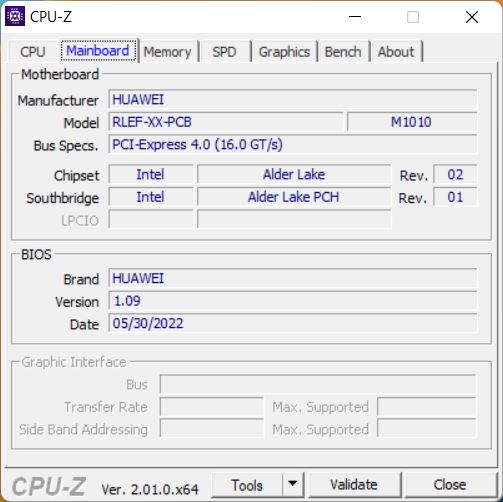
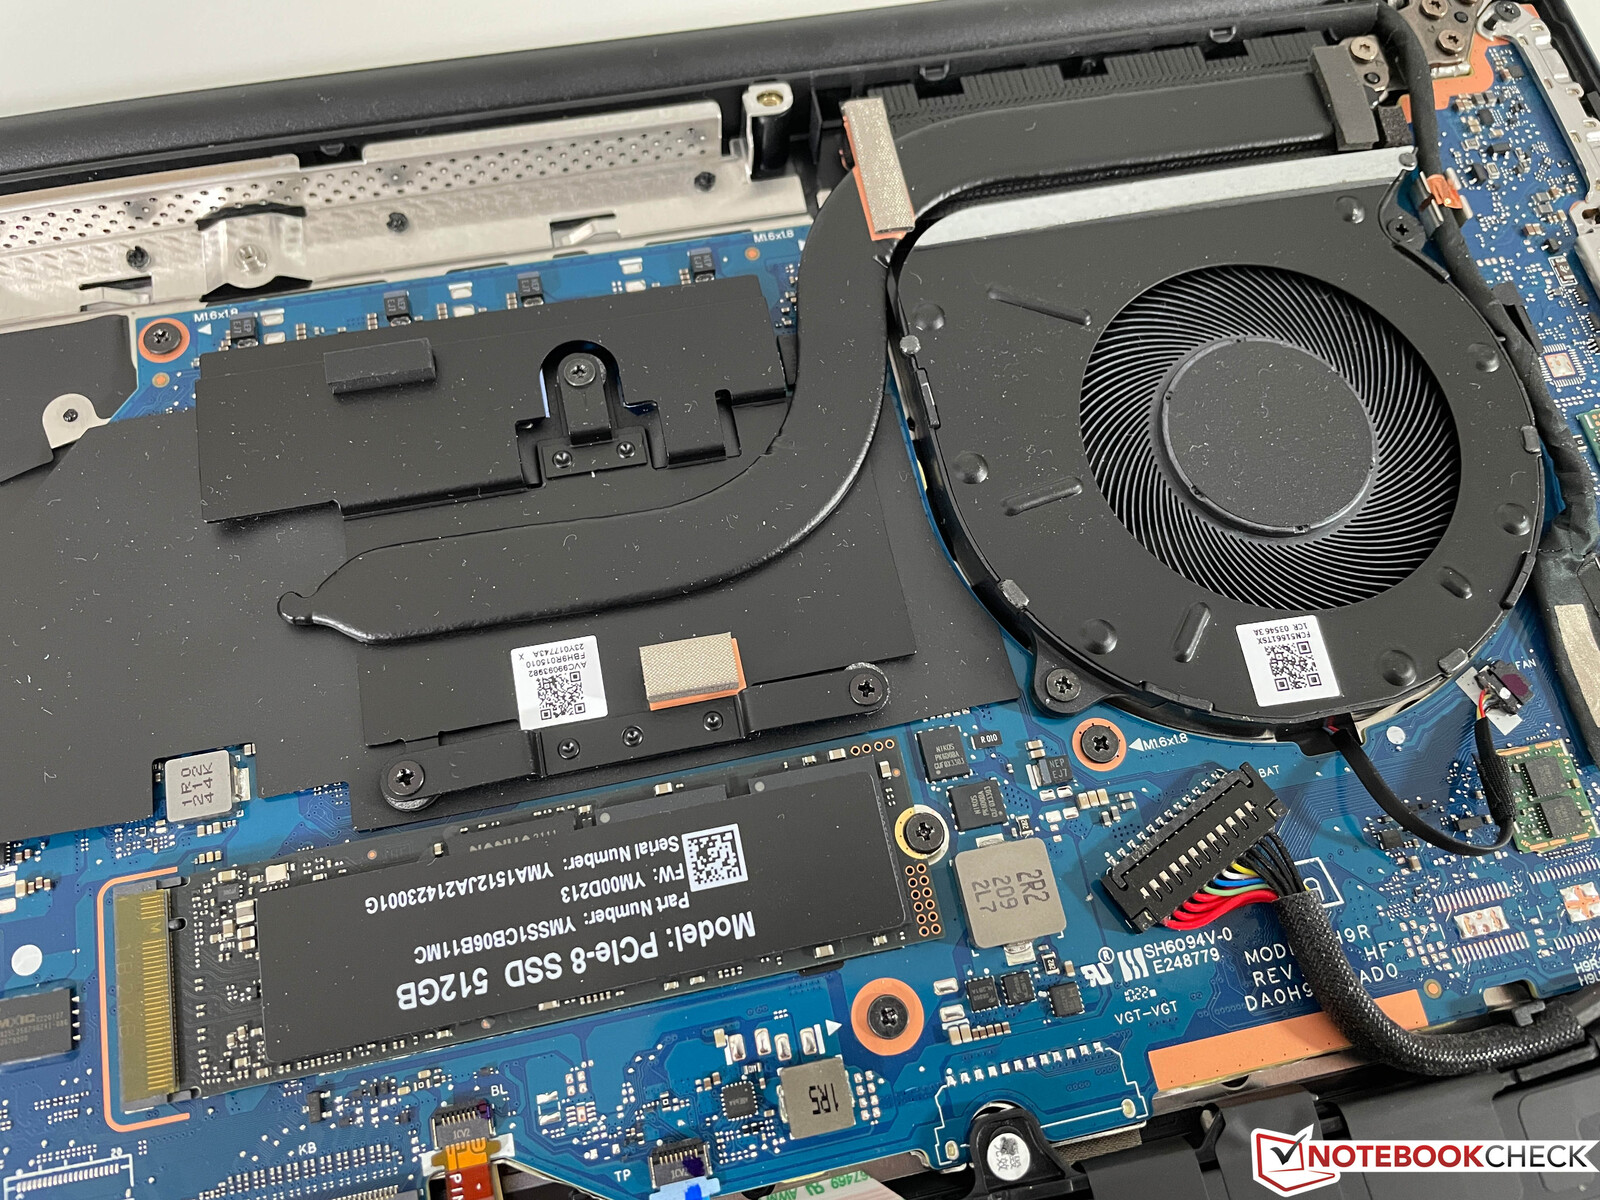
看一下机箱内部还可以看出,华为为两台设备使用了相同的主板。然而,尽管使用相同的处理器,MateBook D 16只收到一个风扇和一个热管。用户只能更换M.2固态硬盘,因为WLAN模块是焊接而成的。与前代产品相比,新的MateBook D 16的宽度和深度反而更小,但两款设备的整体尺寸相当相似。
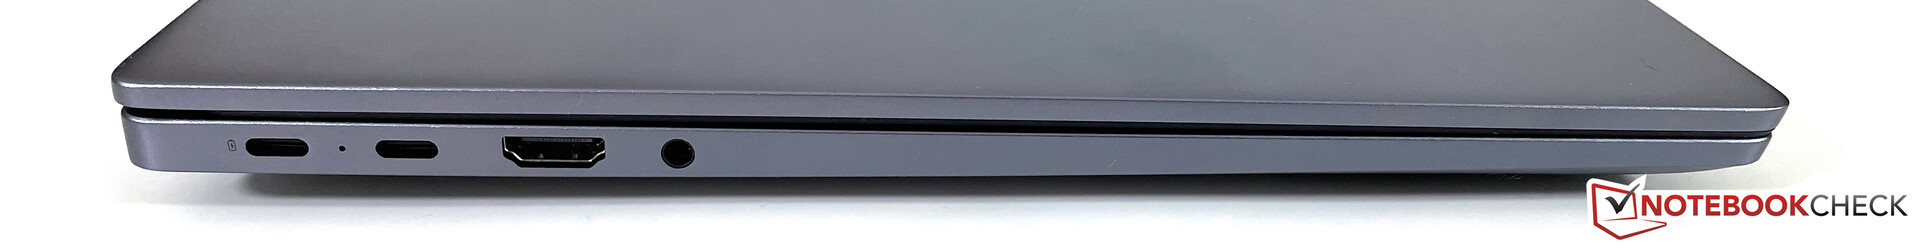
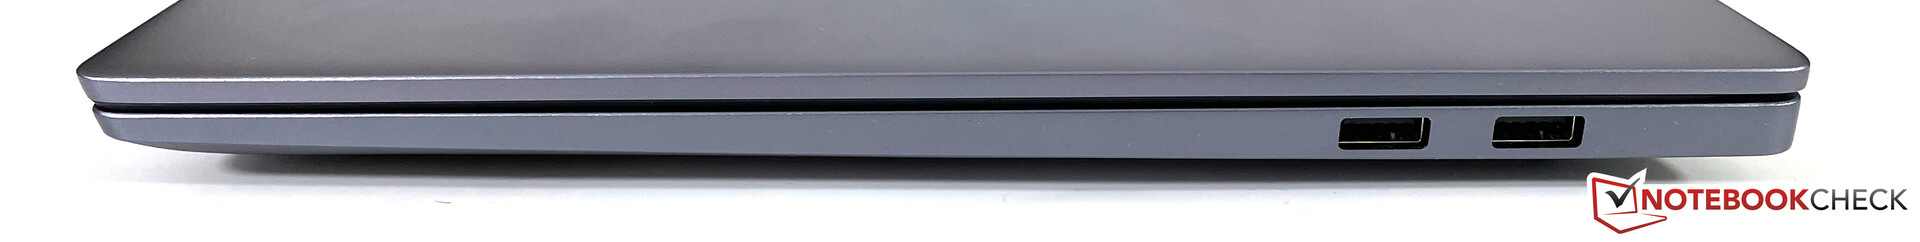
在连接和它们的数量方面,又与较大的 MateBook 16s但华为省去了Thunderbolt 4连接的许可费,而右侧的两个USB-A端口之一只支持旧的2.0标准。Wi-Fi模块也缺乏对最新的6-GHz网络的支持,但英特尔的AX201卡(Wi-Fi 6)仍然做得很好,你在实践中应该不会遇到任何限制。
新的1080p网络摄像头可以拍出体面的照片,并提供几个有趣的人工智能功能(背景过滤器、物体追踪、调整视角等)。在实践中,这在原则上效果很好,但在启动AI摄像头时,图像印象略显生硬。


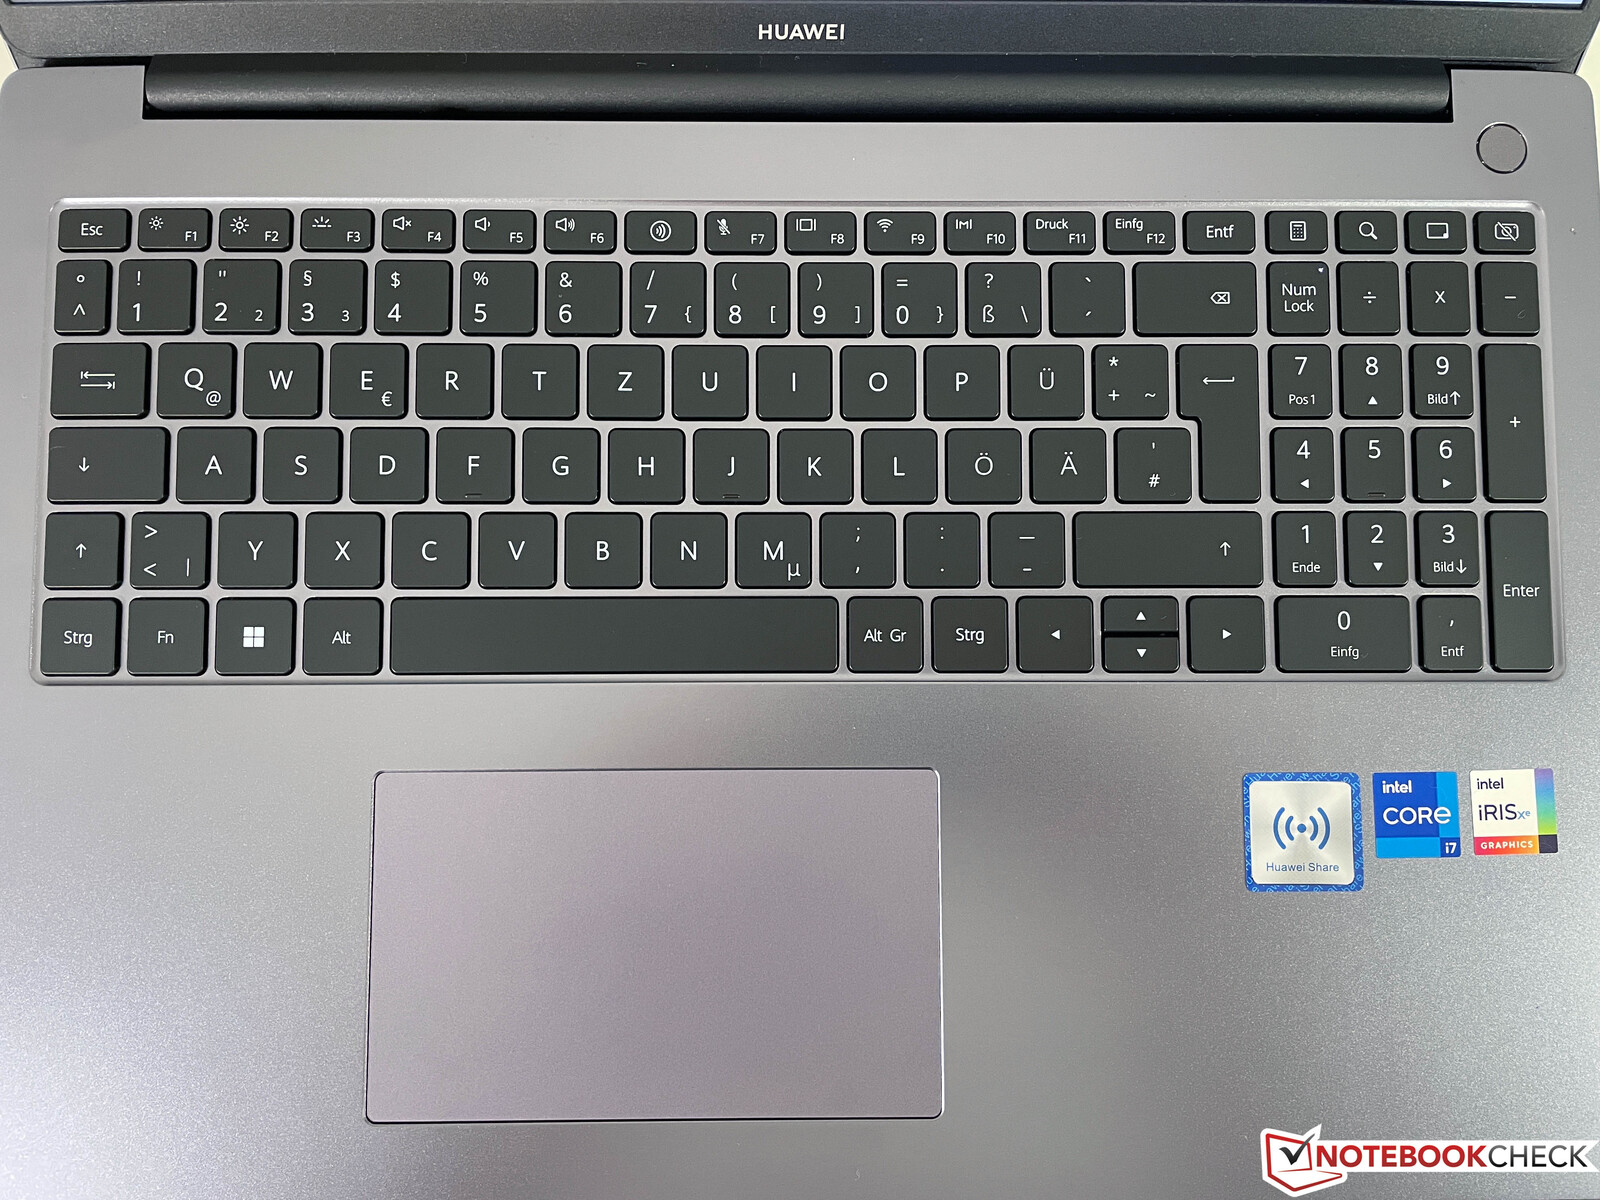
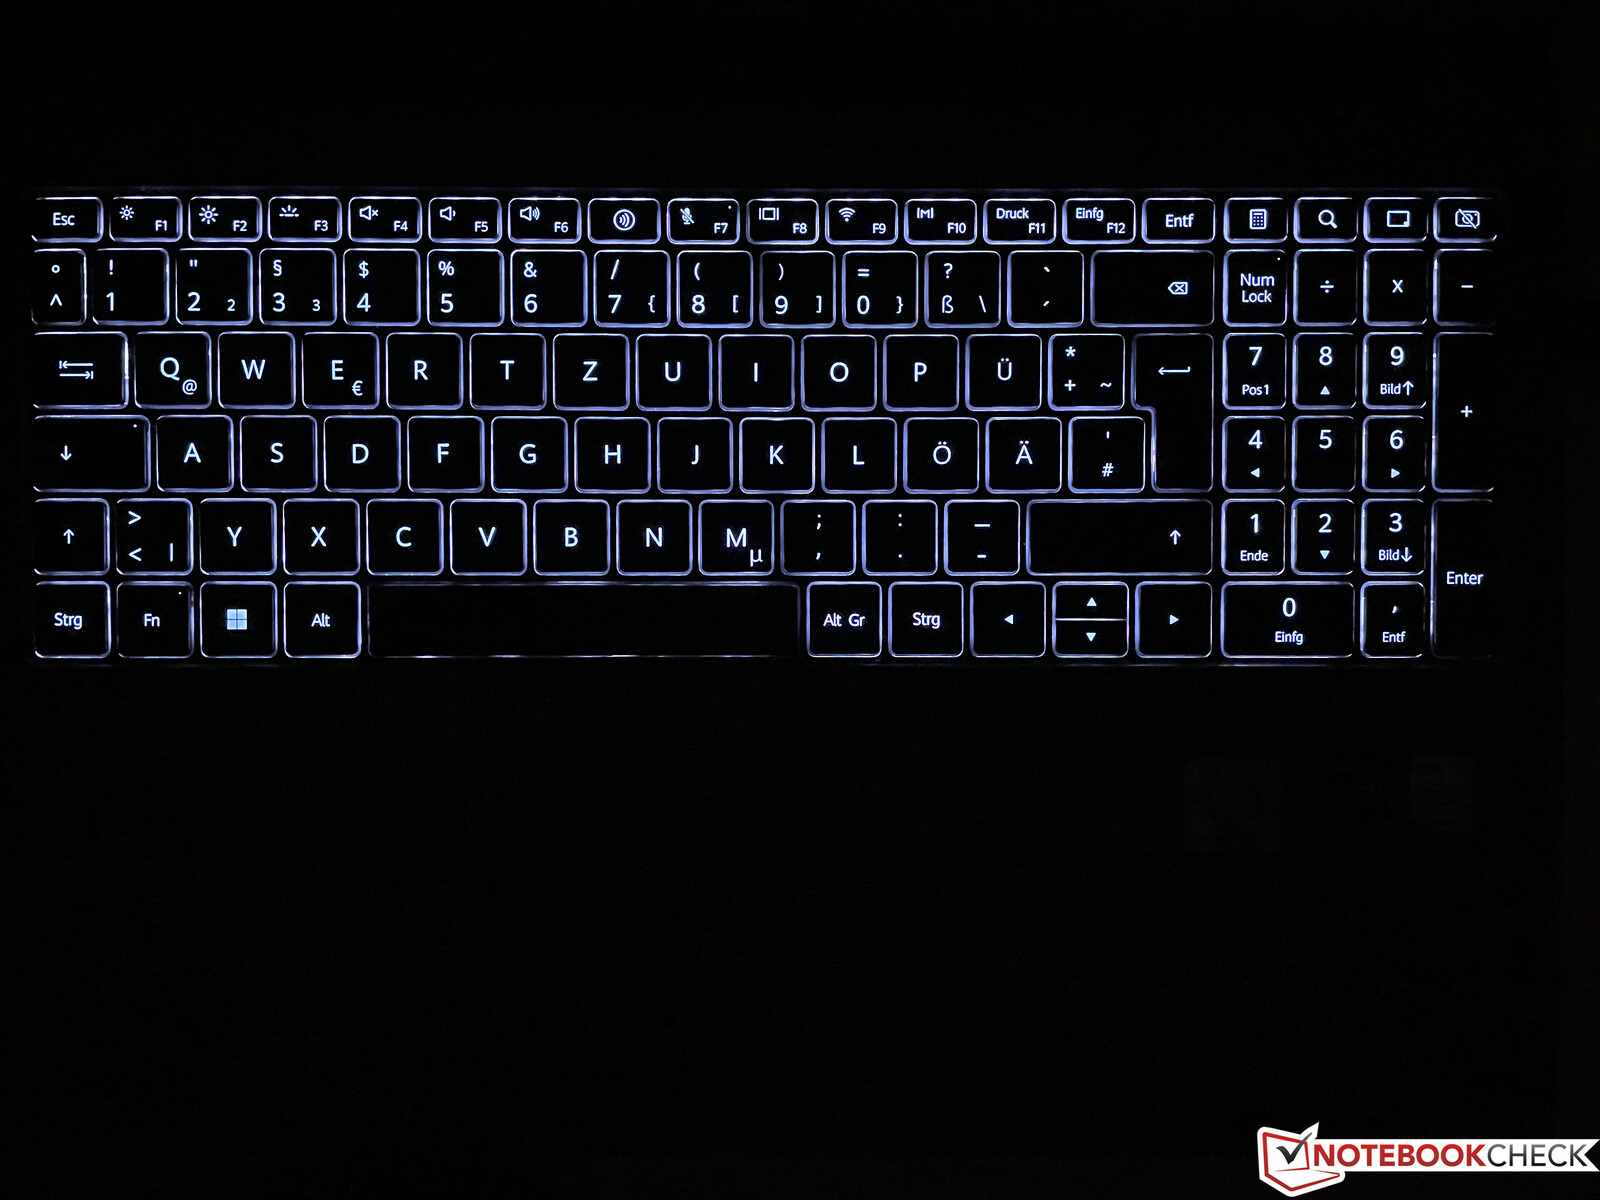
输入设备 - MateBook现在有了数字键盘
新款MateBook D 16是华为第一款配备专用数字键盘的笔记本电脑。正如已经在 MateBook 16s,按键行程从1.3毫米增加到1.5毫米,打字体验总体上非常好。我们甚至喜欢它比16s好一点,因为按键的声音略小。 反馈很精确,即使是较长的文本也可以毫无问题地打出来。 和以前一样,垂直方向键仍然较小。有一个白色的、两段式的键盘照明,但它不能通过传感器自动激活。电源按钮现在放在右上方,包含一个指纹传感器。
ClickPad稍微向左偏移,这在某些情况下可能需要一些时间来适应。键盘工作得非常好,我们在实践中没有遇到任何问题,但点击的声音仍然很响。
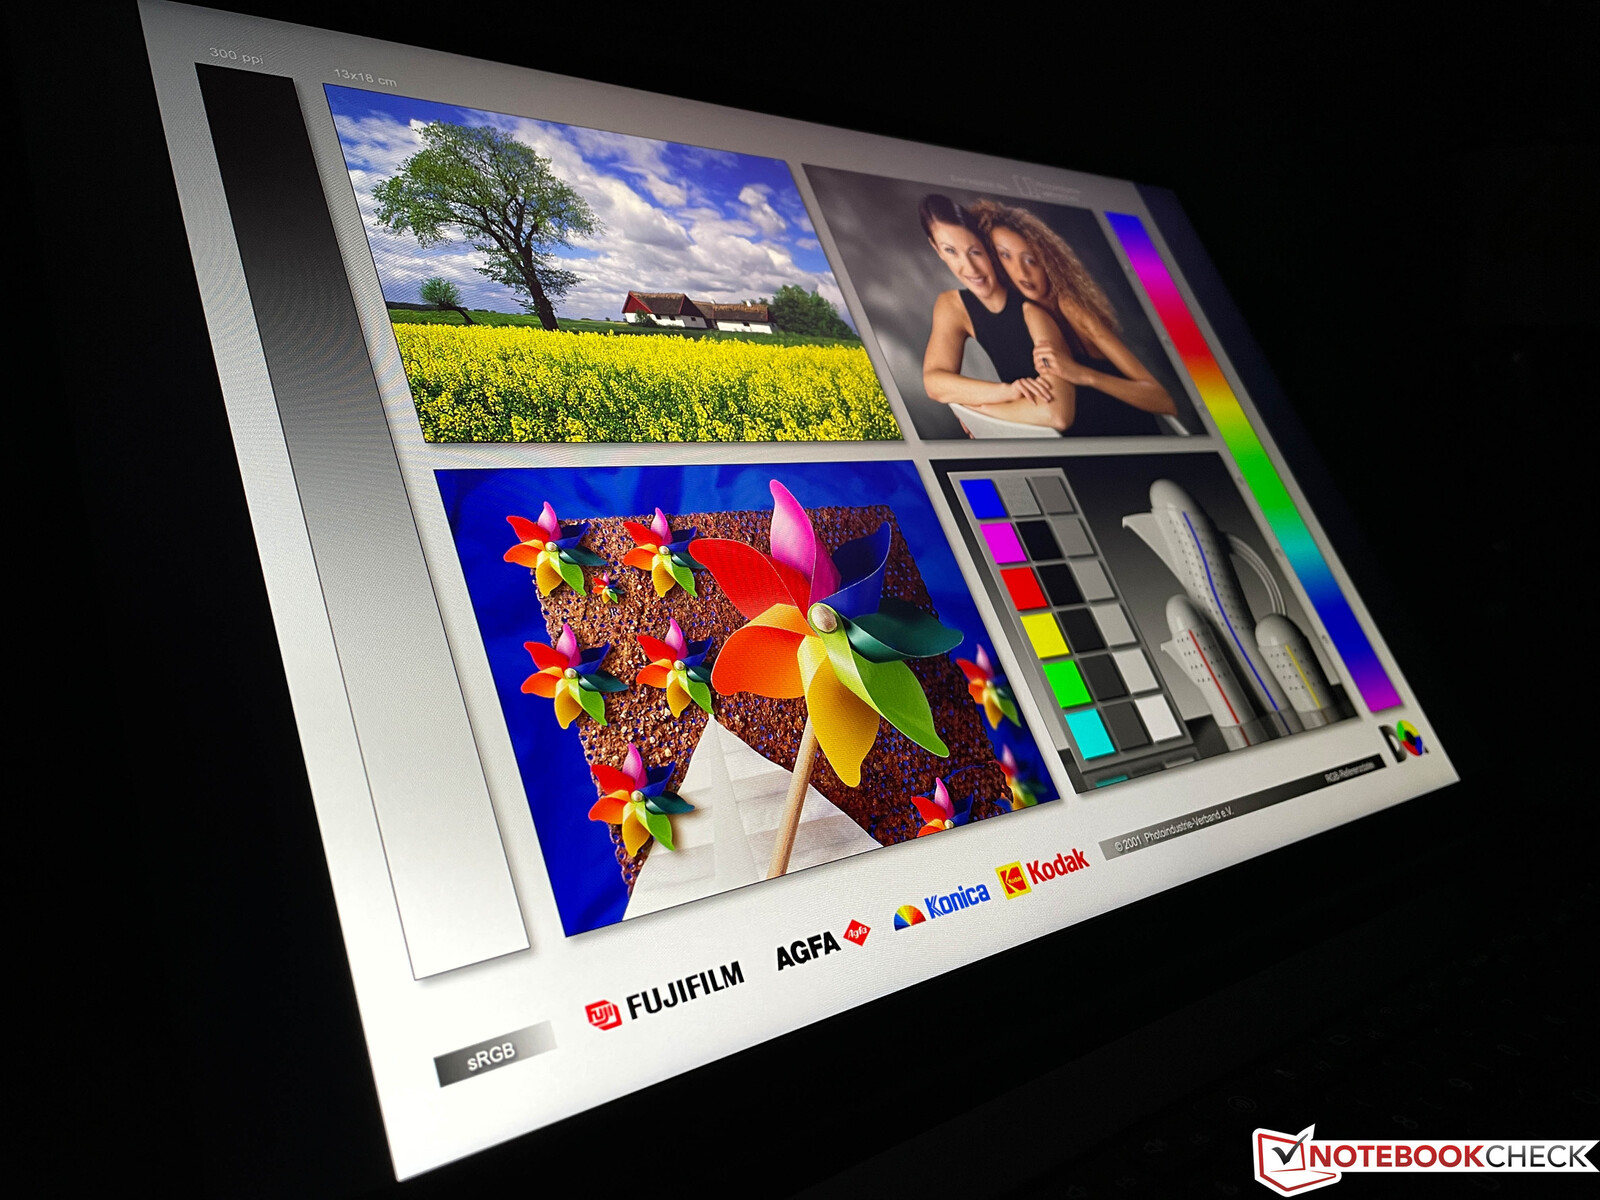
显示屏--华为现在使用16:10的面板
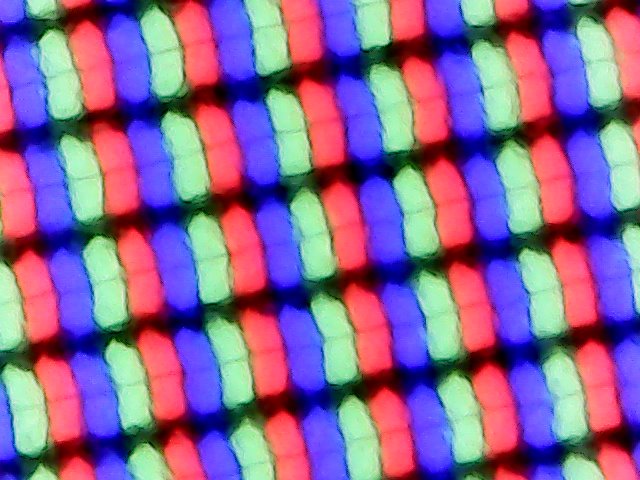
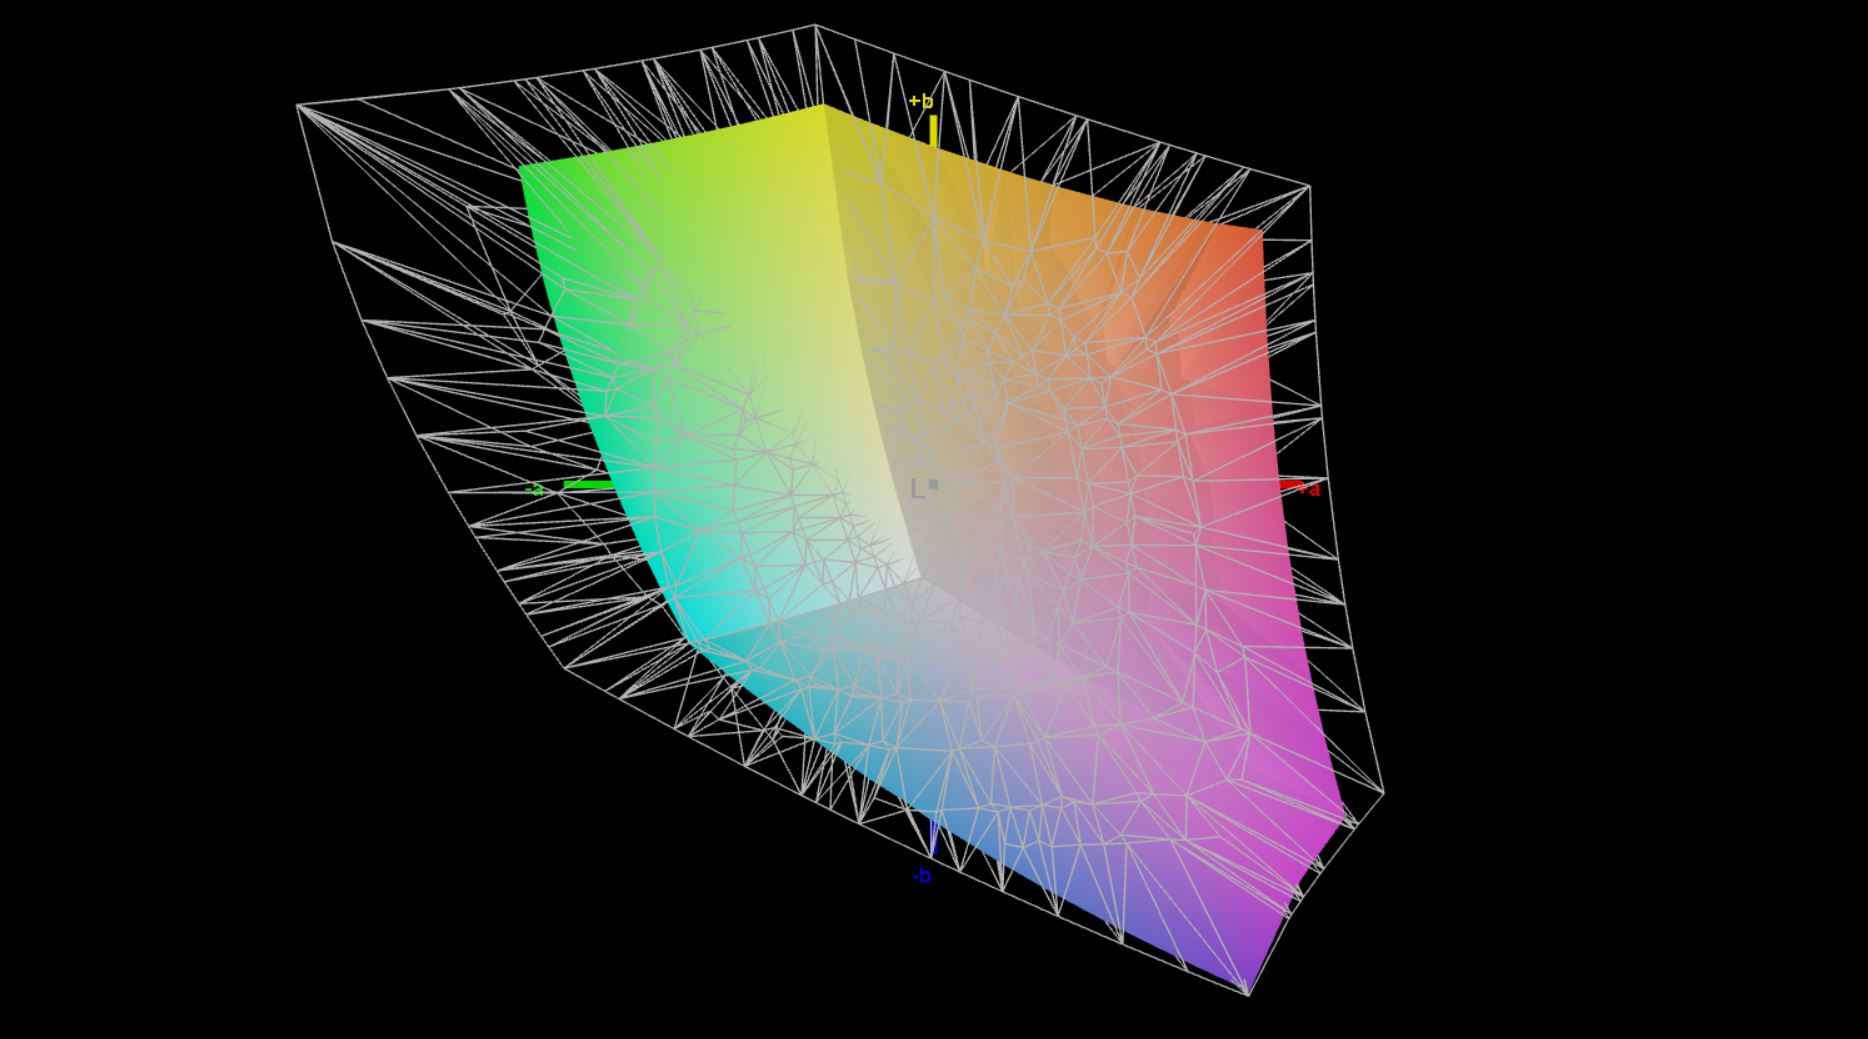
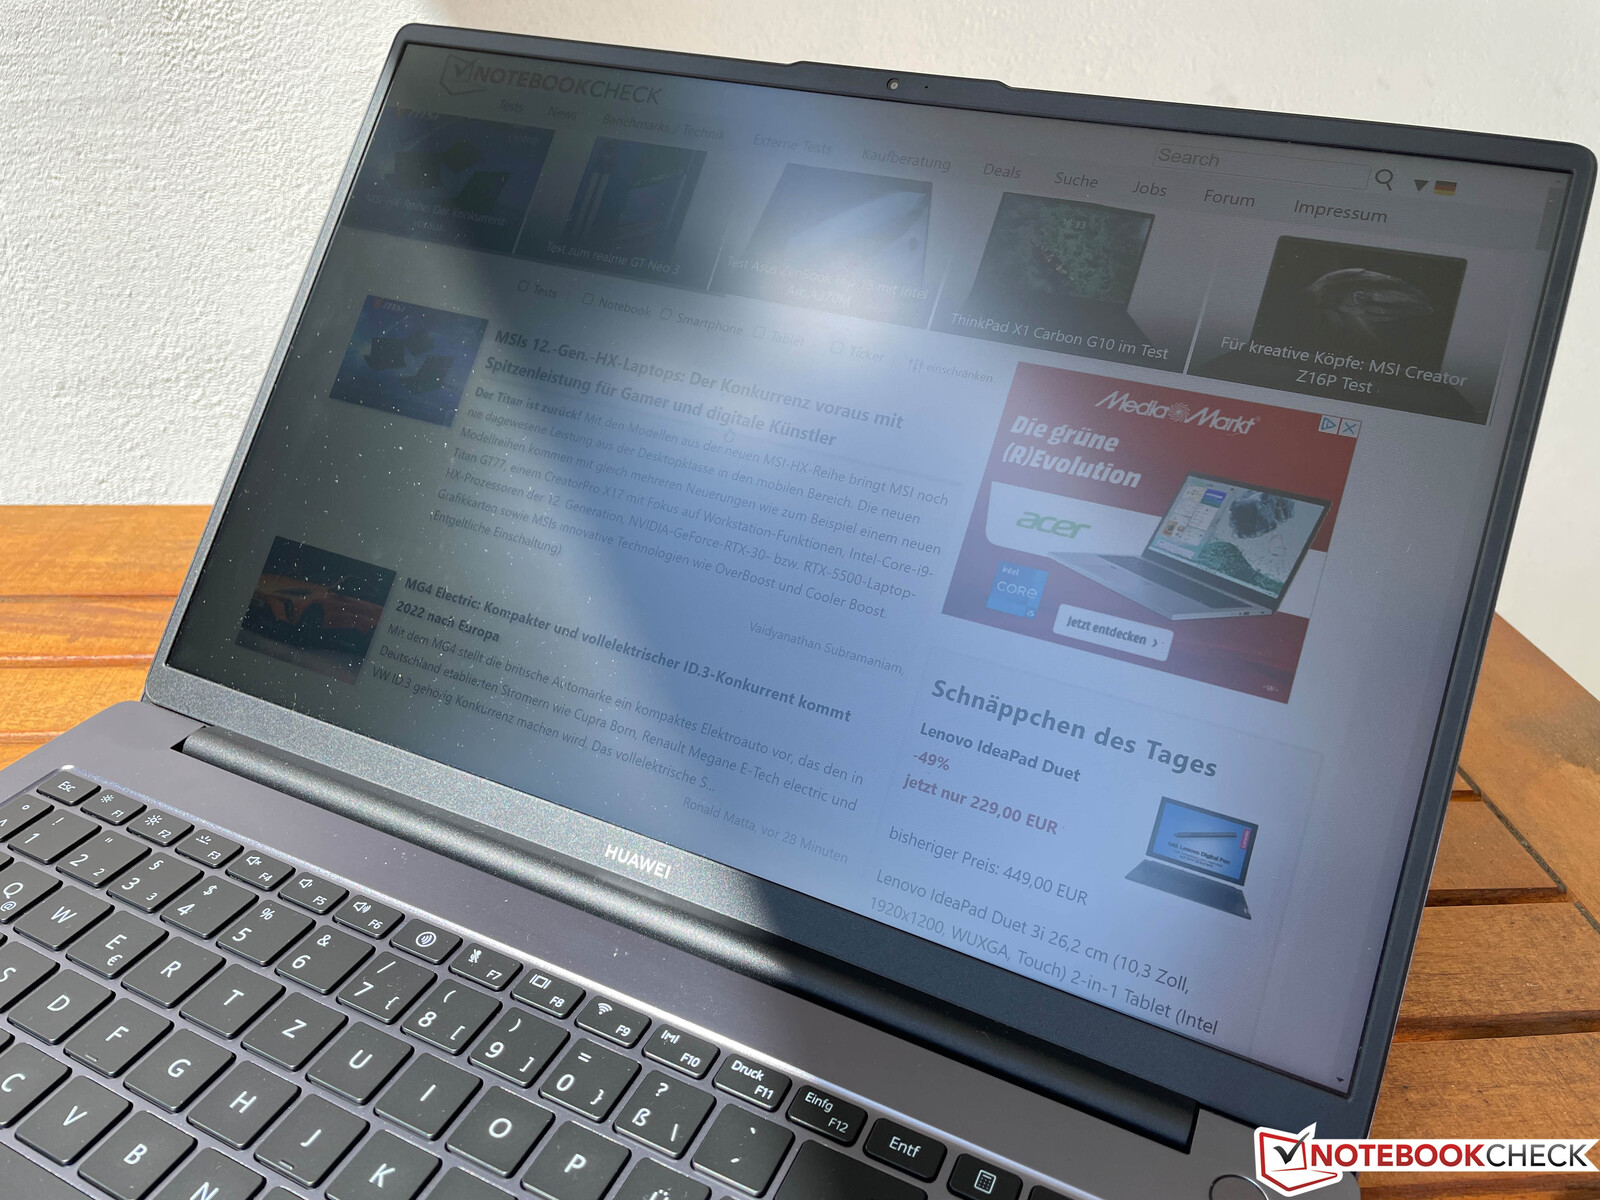
华为基本上继续使用哑光IPS面板,但现在它有一个16:10的格式,1920 x 1200像素。图像质量非常好,即使是明亮的地方也不会出现颗粒感。然而,你必须在没有任何特殊功能的情况下生活,因为只有60-Hz刷新率,没有HDR,也没有亮度传感器。
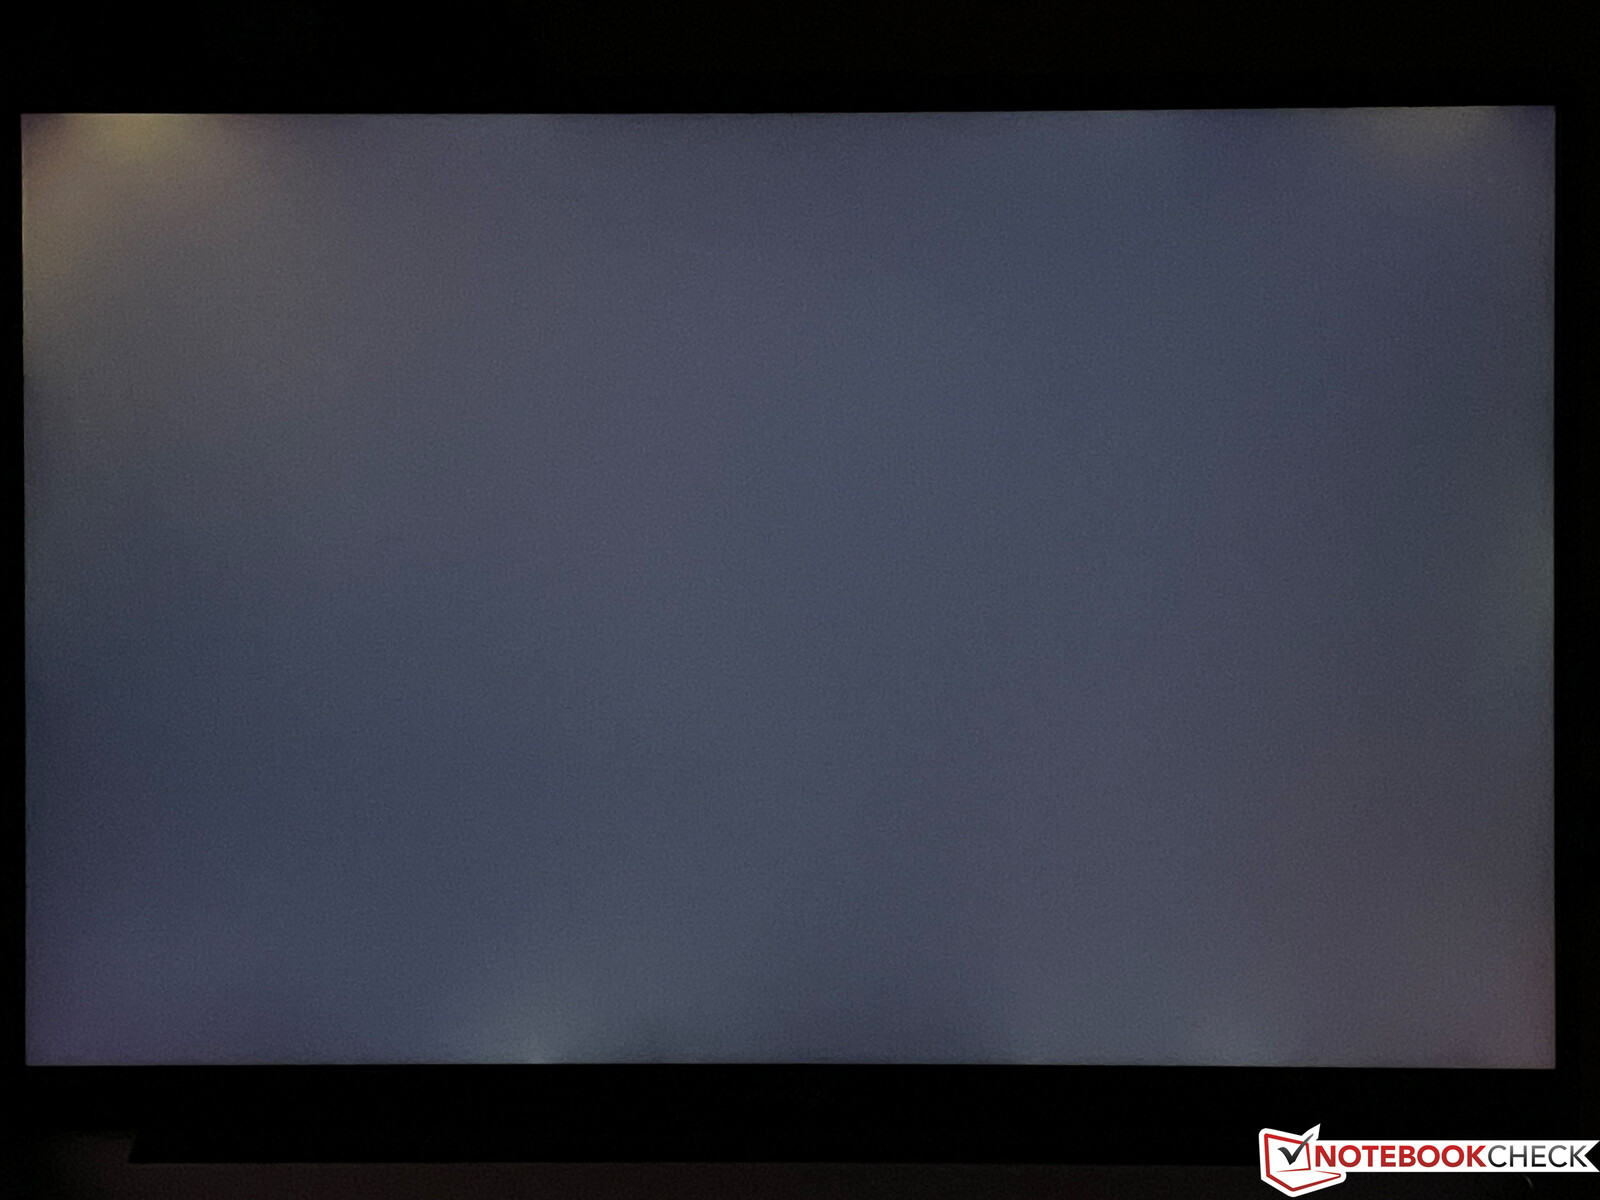
最大亮度略高于300cd/m²,与良好的黑色值相结合,形成了非常好的对比度,几乎是1400:1。我们没有测量任何PWM,响应时间也很好。有一些可见的光晕,特别是在顶部边缘,但IPS面板的视角稳定性没有显示出弱点。
| |||||||||||||||||||||||||
Brightness Distribution: 90 %
Center on Battery: 318 cd/m²
Contrast: 1387:1 (Black: 0.23 cd/m²)
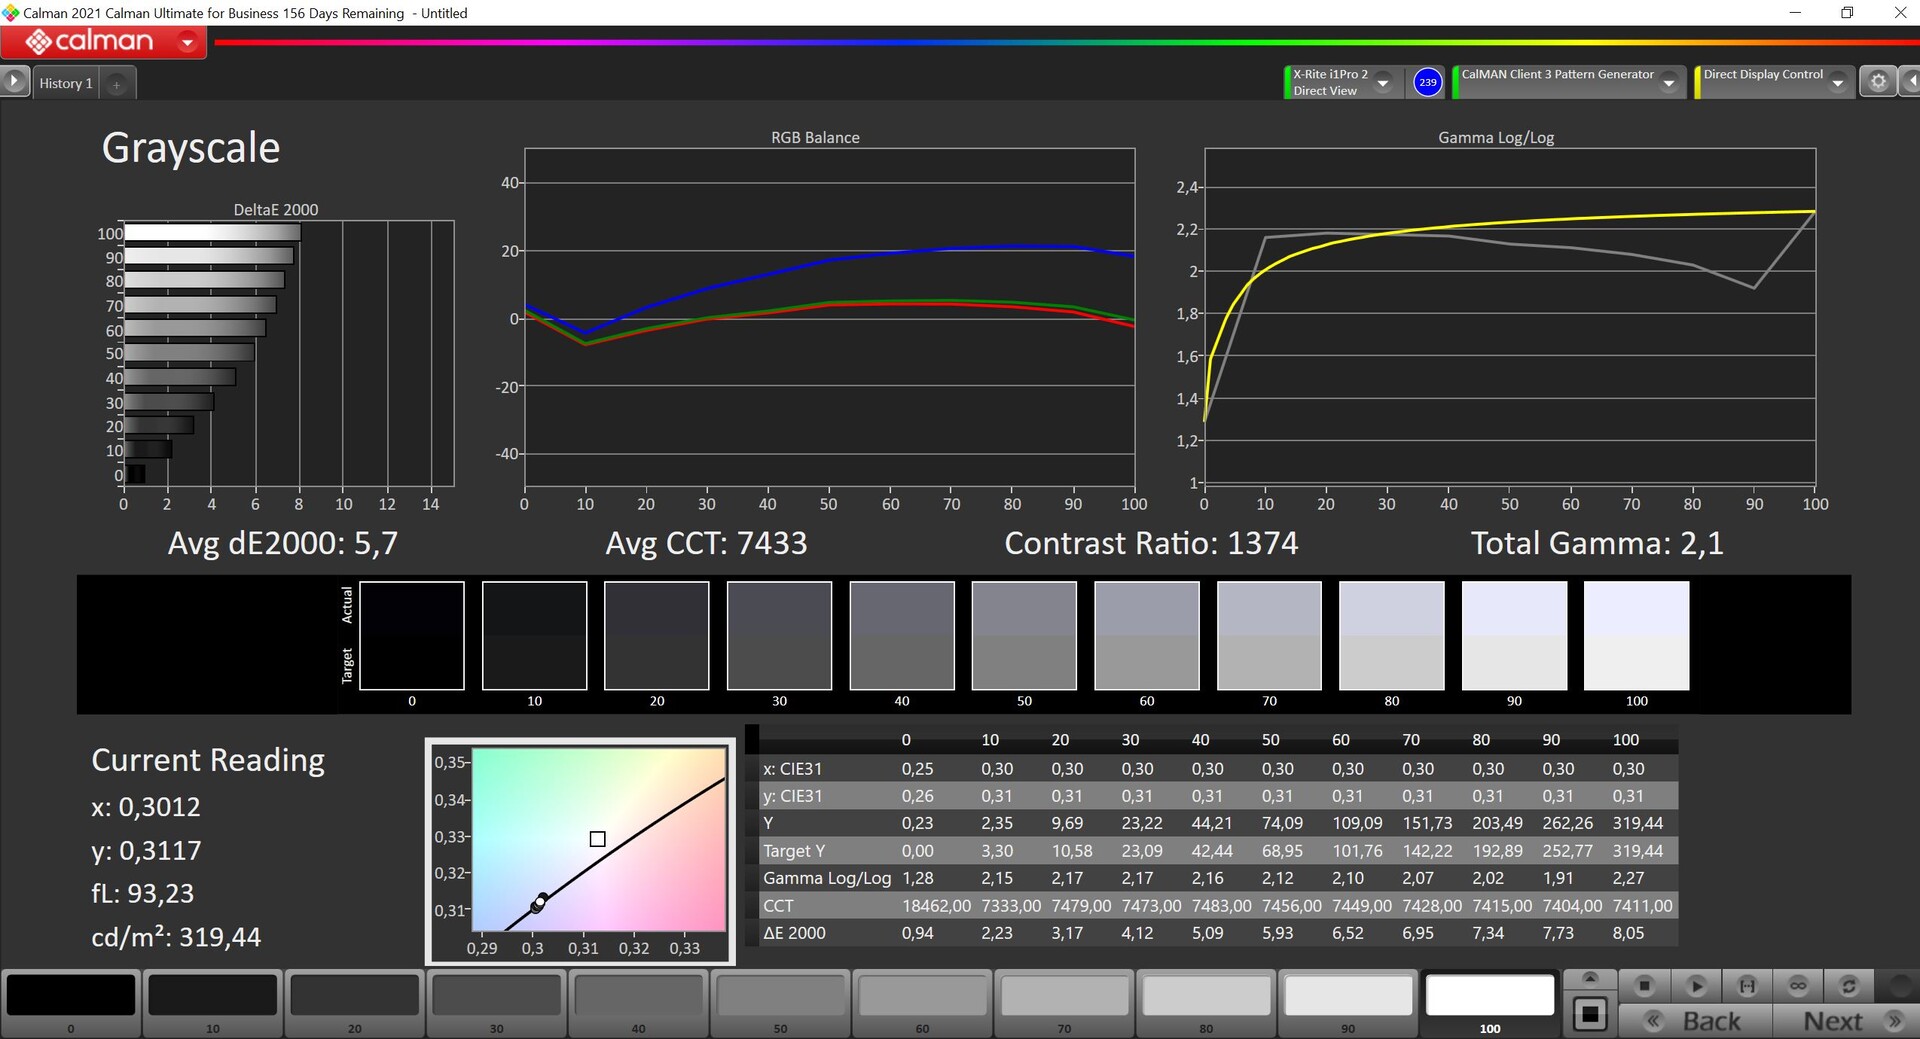
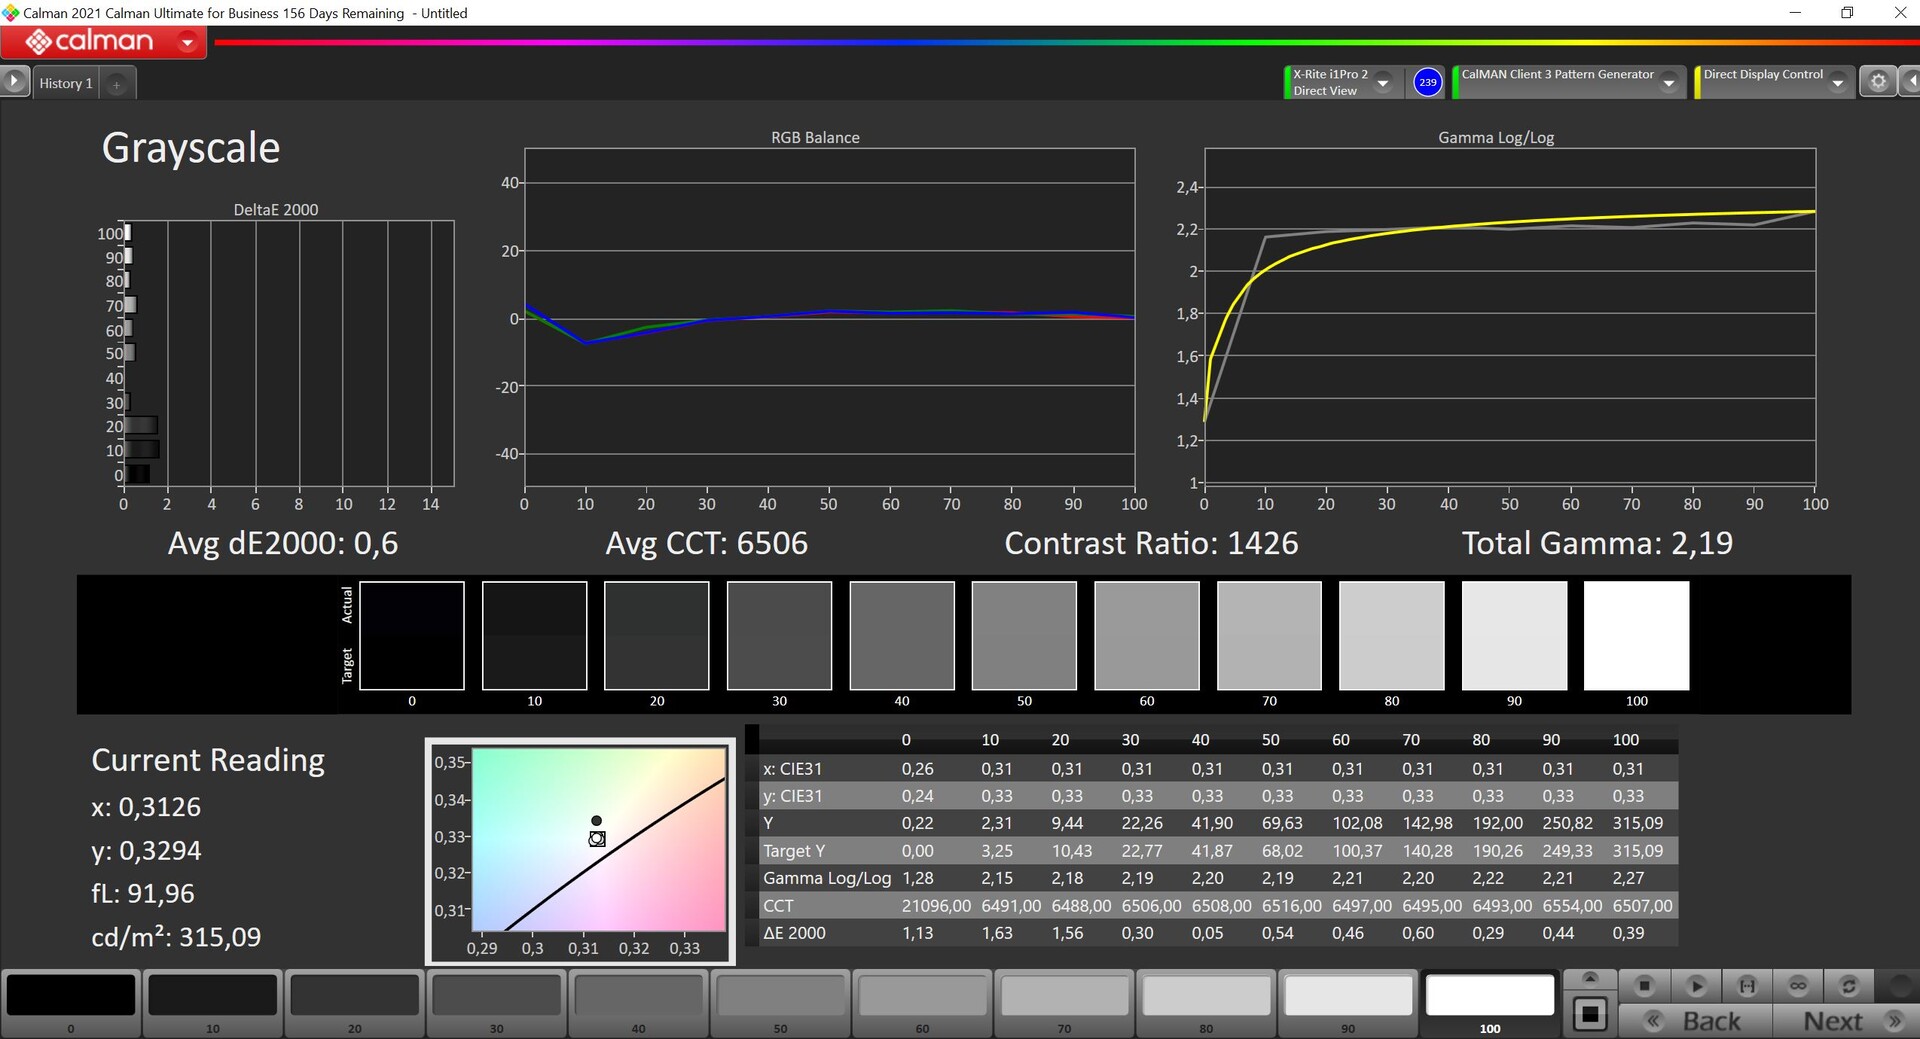
ΔE ColorChecker Calman: 3.4 | ∀{0.5-29.43 Ø4.71}
calibrated: 0.8
ΔE Greyscale Calman: 5.7 | ∀{0.09-98 Ø4.96}
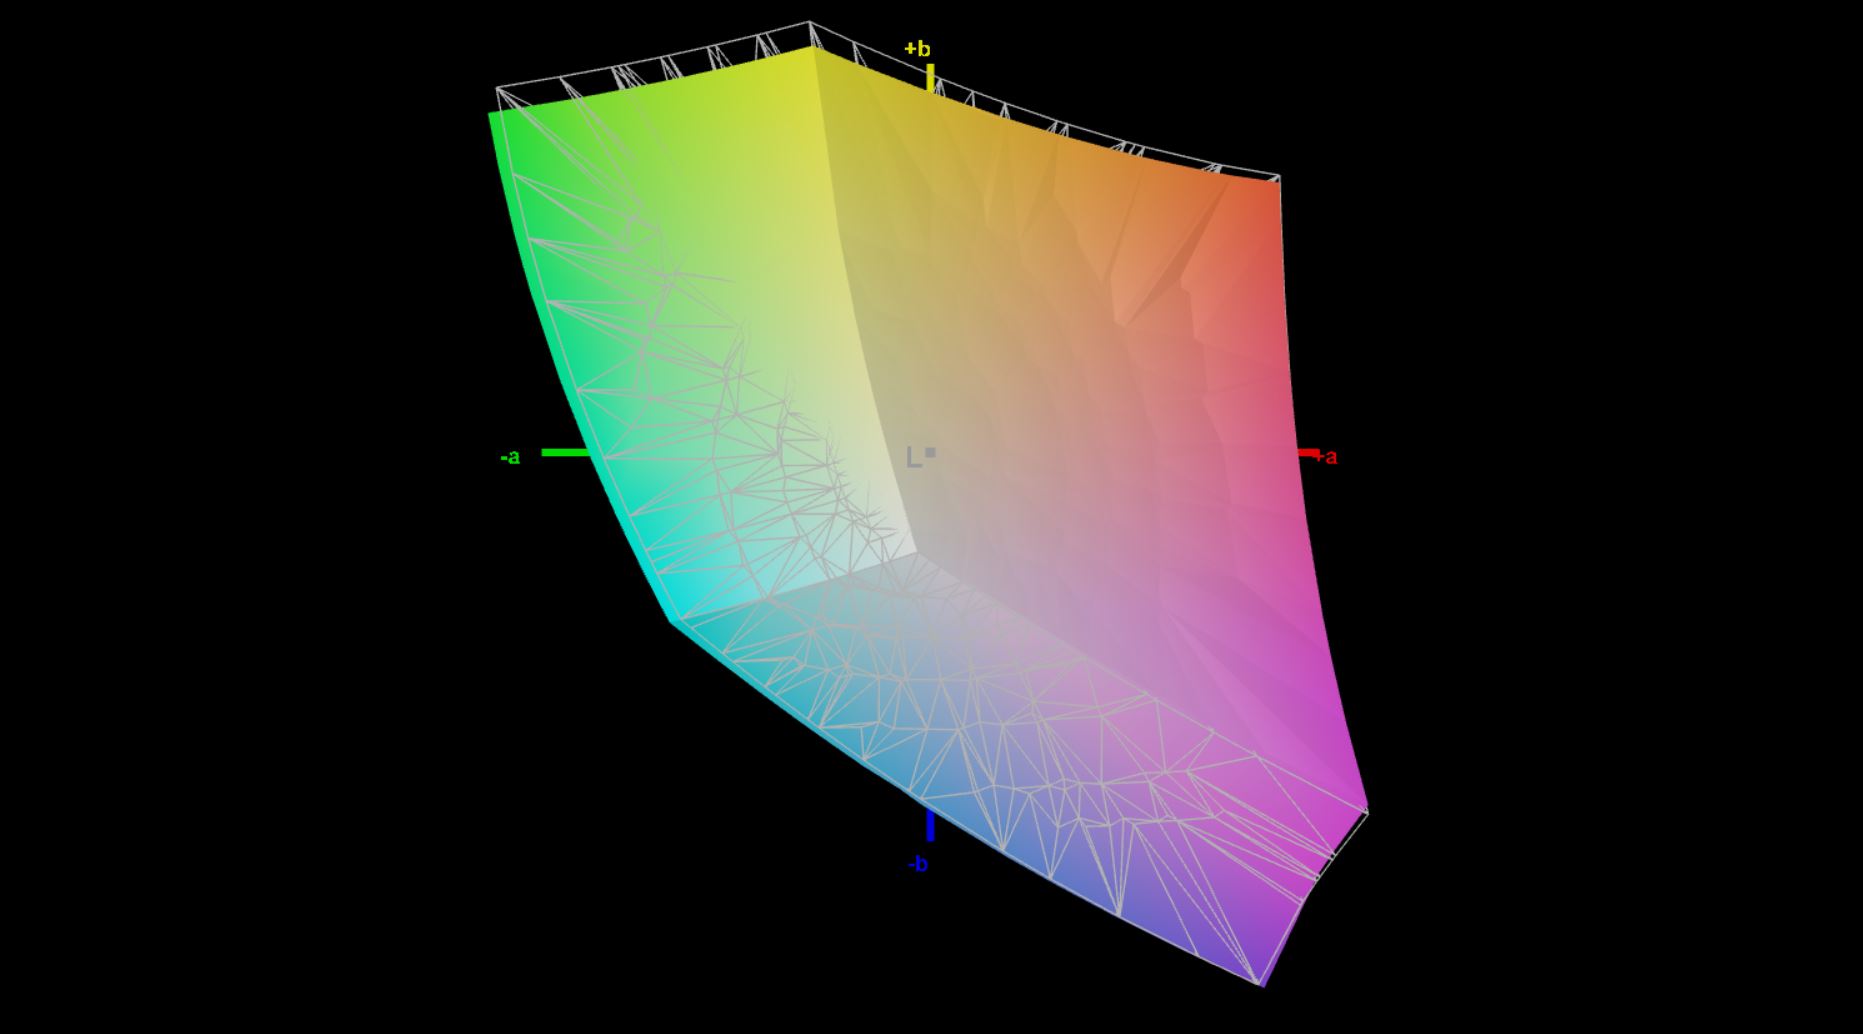
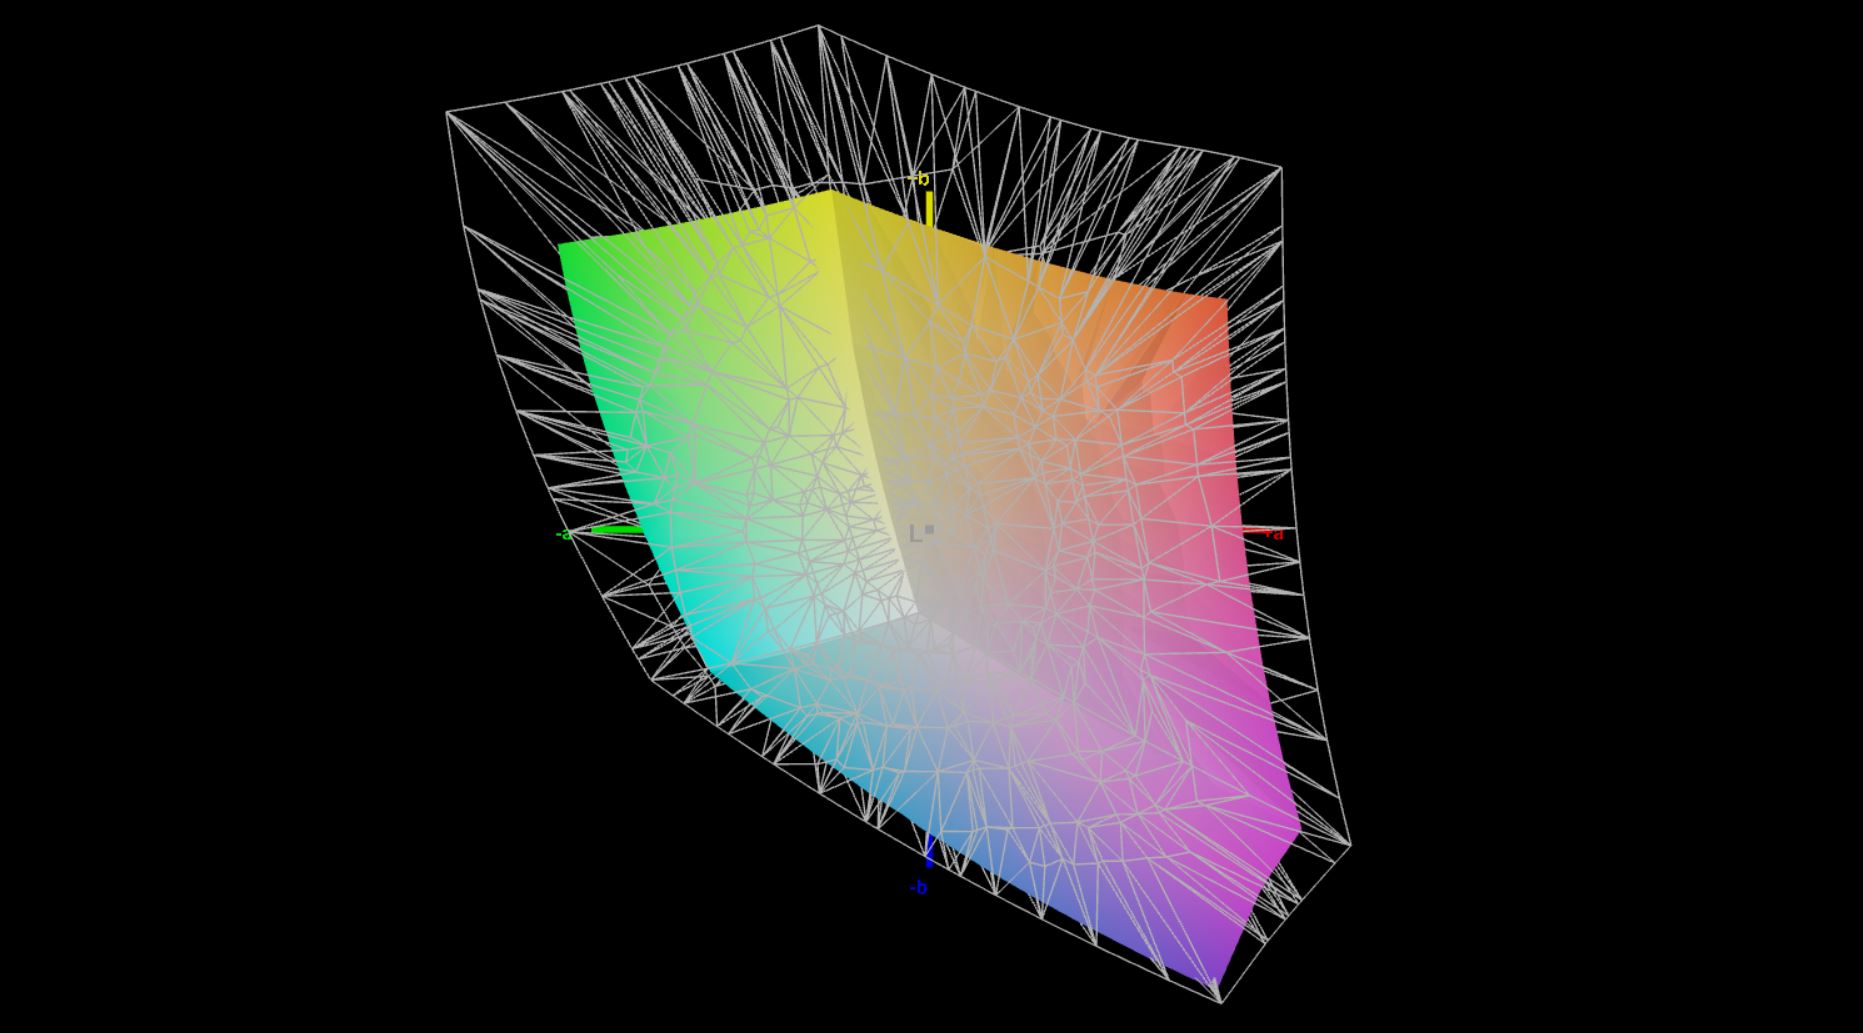
68.3% AdobeRGB 1998 (Argyll 3D)
96.4% sRGB (Argyll 3D)
66.2% Display P3 (Argyll 3D)
Gamma: 2.1
CCT: 7433 K
| Huawei MateBook D 16 2022 BOE NV160WUM-NH0, IPS, 1920x1200, 16" | Asus Vivobook 15 K513EQ Samsung ATNA56YX03-0, OLED, 1920x1080, 15.6" | Lenovo IdeaPad 5 Pro 16IHU6 Lenovo LEN160WQXGA, IPS, 2560x1600, 16" | Dell Inspiron 16 Plus 7610 AU Optronics B160QAN, IPS, 3072x1920, 16" | Huawei MateBook D 16-53011VFJ N161HCA-EA3, IPS, 1920x1080, 16.1" | |
|---|---|---|---|---|---|
| Display | 34% | 8% | 9% | 2% | |
| Display P3 Coverage (%) | 66.2 | 99.9 51% | 74 12% | 74.1 12% | 66.8 1% |
| sRGB Coverage (%) | 96.4 | 100 4% | 98.7 2% | 99.4 3% | 99 3% |
| AdobeRGB 1998 Coverage (%) | 68.3 | 99.9 46% | 74.5 9% | 75.8 11% | 69 1% |
| Response Times | 89% | 57% | -79% | 0% | |
| Response Time Grey 50% / Grey 80% * (ms) | 30.5 ? | 2.2 ? 93% | 13 ? 57% | 49.2 ? -61% | 25 ? 18% |
| Response Time Black / White * (ms) | 18.7 ? | 2.9 ? 84% | 8 ? 57% | 36.8 ? -97% | 22 ? -18% |
| PWM Frequency (Hz) | 59.5 ? | 2500 ? | |||
| Screen | 29% | 13% | -2% | 22% | |
| Brightness middle (cd/m²) | 319 | 384.5 21% | 356 12% | 296.8 -7% | 352 10% |
| Brightness (cd/m²) | 317 | 388 22% | 322 2% | 292 -8% | 330 4% |
| Brightness Distribution (%) | 90 | 98 9% | 80 -11% | 87 -3% | 89 -1% |
| Black Level * (cd/m²) | 0.23 | 0.27 -17% | 0.21 9% | 0.28 -22% | |
| Contrast (:1) | 1387 | 1319 -5% | 1413 2% | 1257 -9% | |
| Colorchecker dE 2000 * | 3.4 | 2.53 26% | 2.4 29% | 2.56 25% | 1.35 60% |
| Colorchecker dE 2000 max. * | 8.1 | 6.16 24% | 4.42 45% | 4.76 41% | 2.58 68% |
| Colorchecker dE 2000 calibrated * | 0.8 | 1.86 -133% | |||
| Greyscale dE 2000 * | 5.7 | 1.6 72% | 2.81 51% | 2.6 54% | 2.02 65% |
| Gamma | 2.1 105% | 2.24 98% | 2.4 92% | 2.07 106% | 2.49 88% |
| CCT | 7433 87% | 6464 101% | 6294 103% | 6628 98% | 6445 101% |
| Color Space (Percent of AdobeRGB 1998) (%) | 63 | ||||
| Color Space (Percent of sRGB) (%) | 99 | ||||
| Total Average (Program / Settings) | 51% /
41% | 26% /
19% | -24% /
-11% | 8% /
14% |
* ... smaller is better
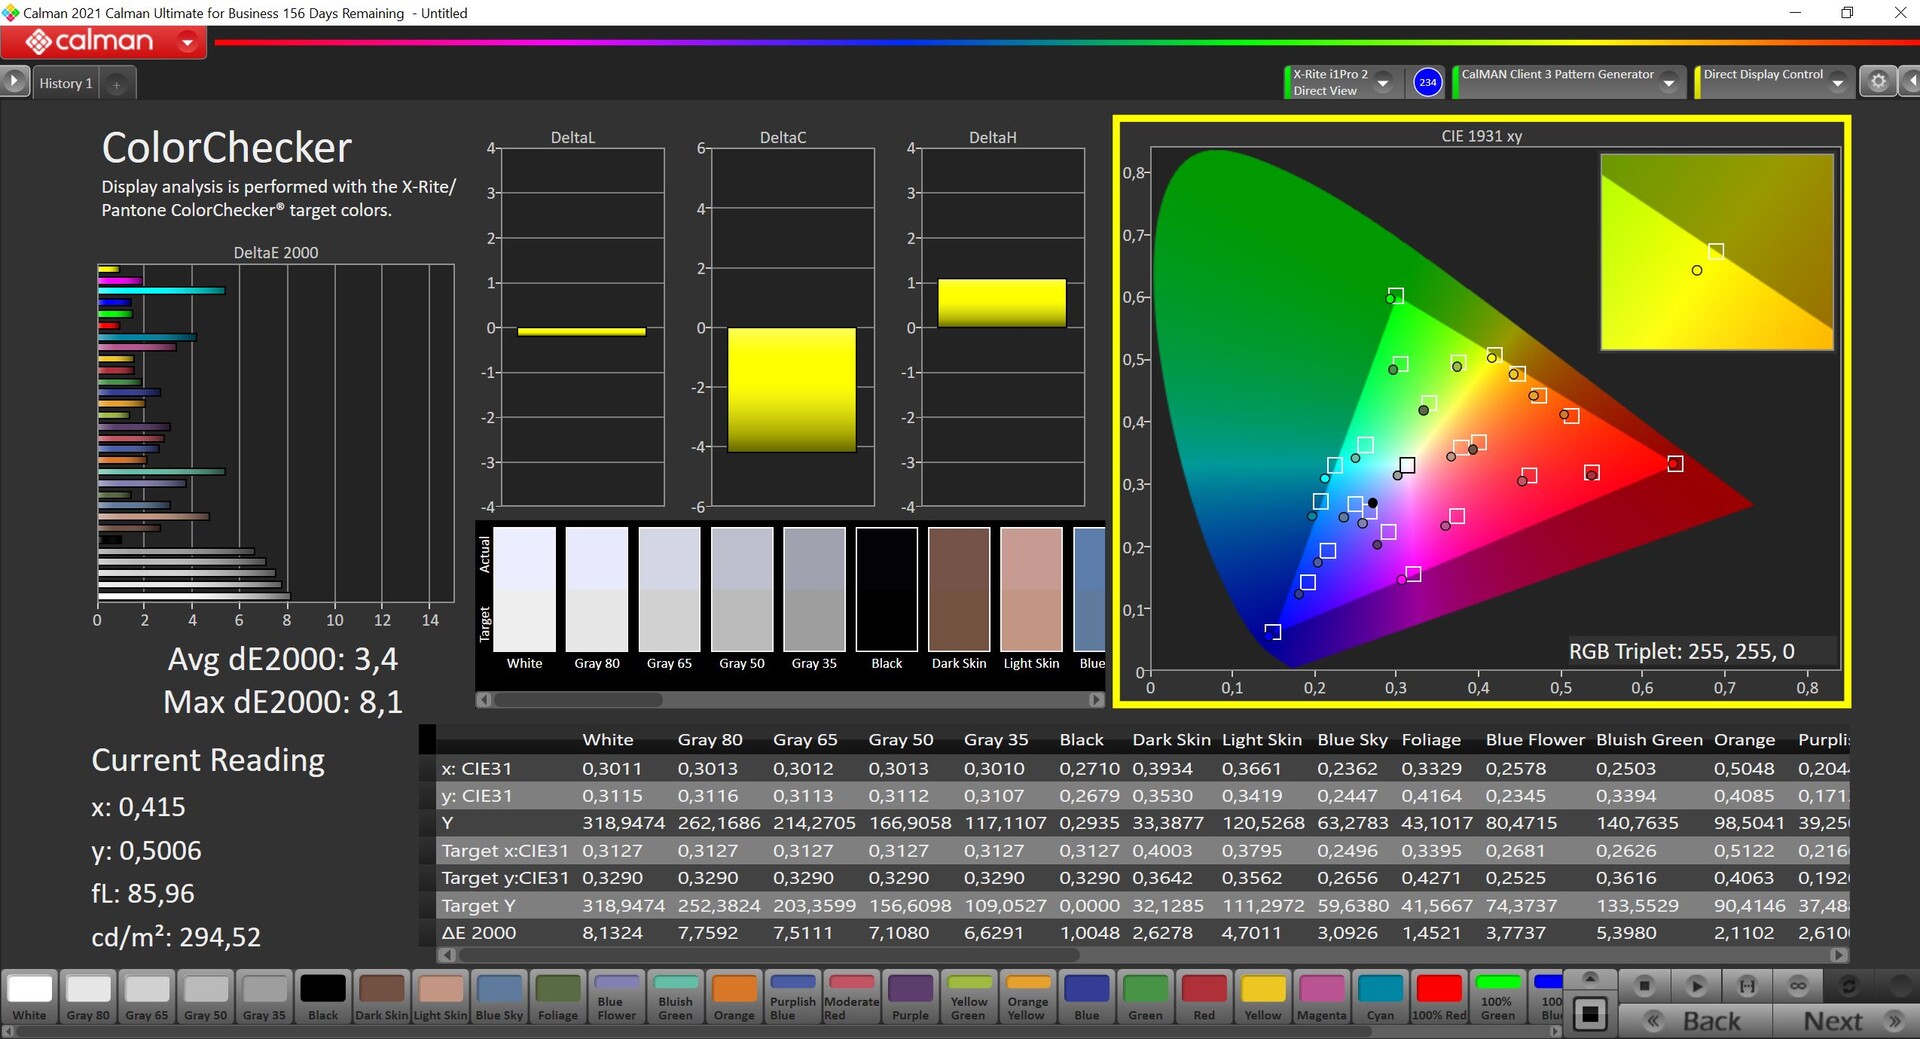
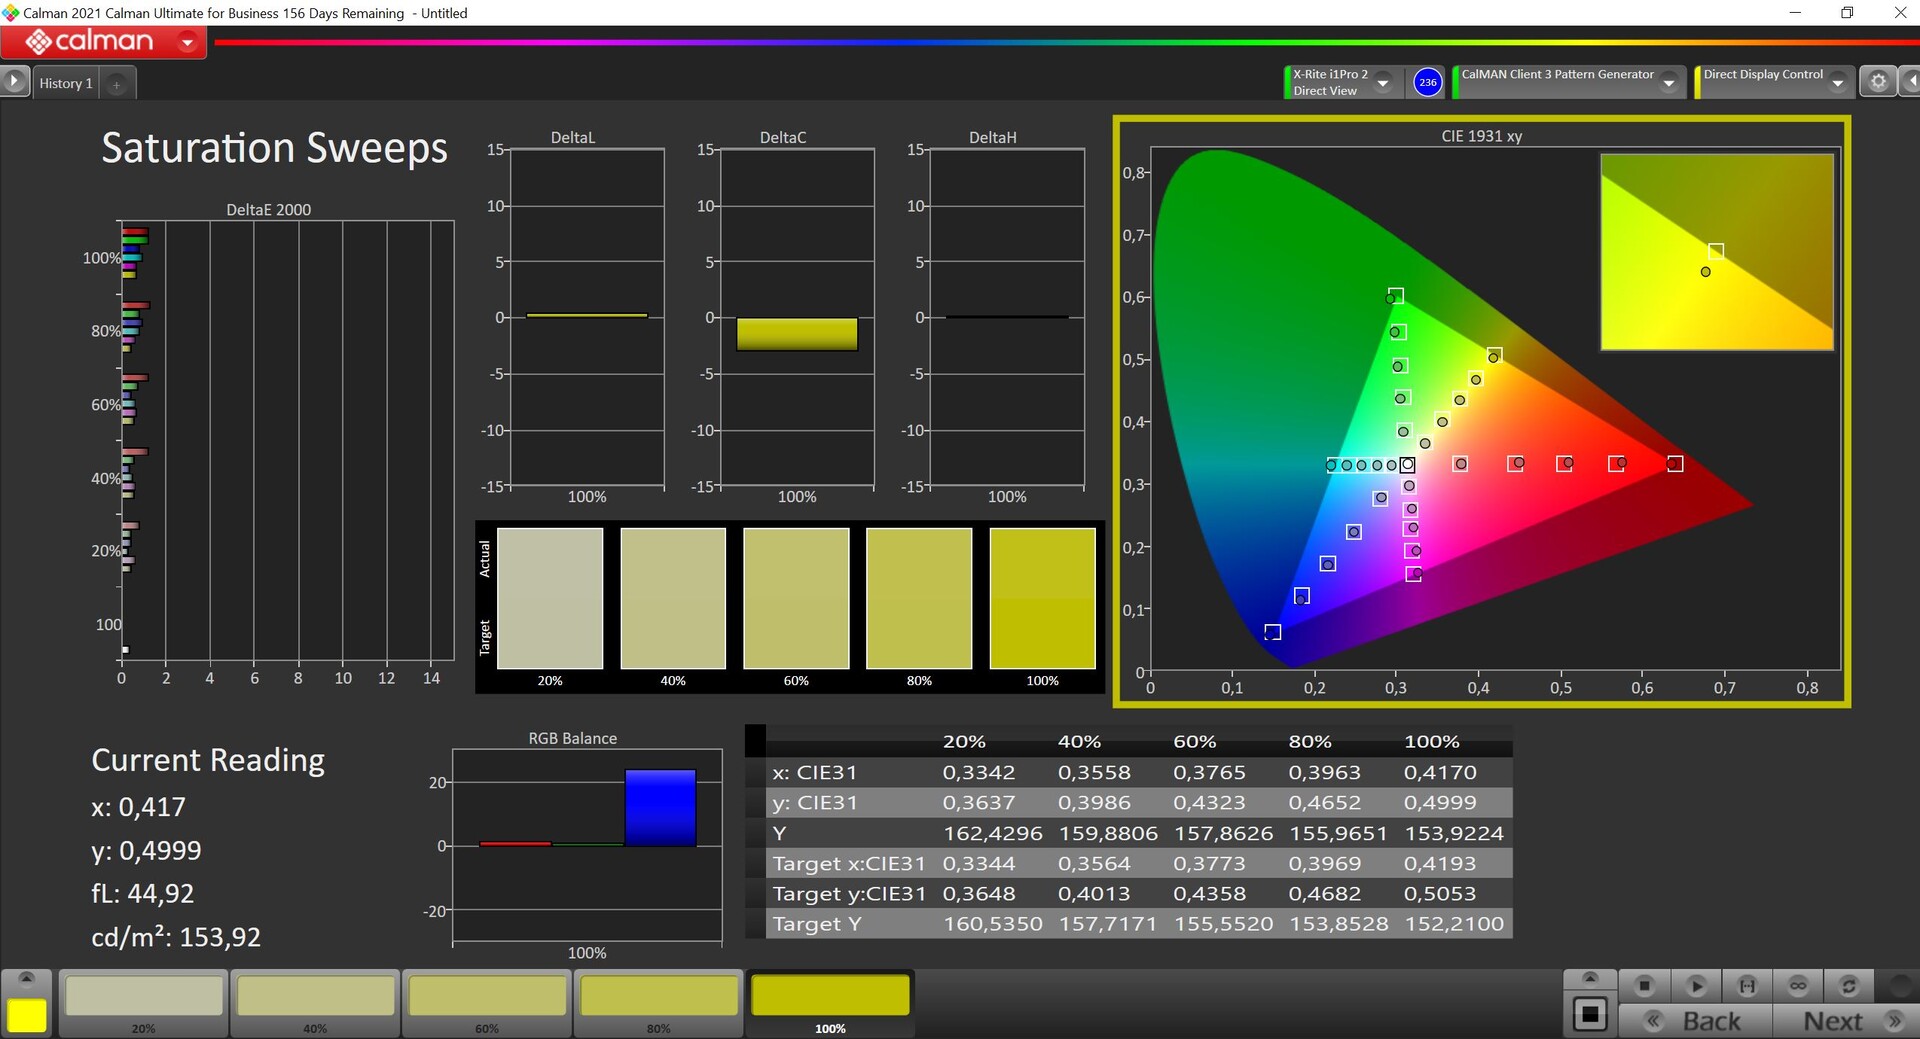
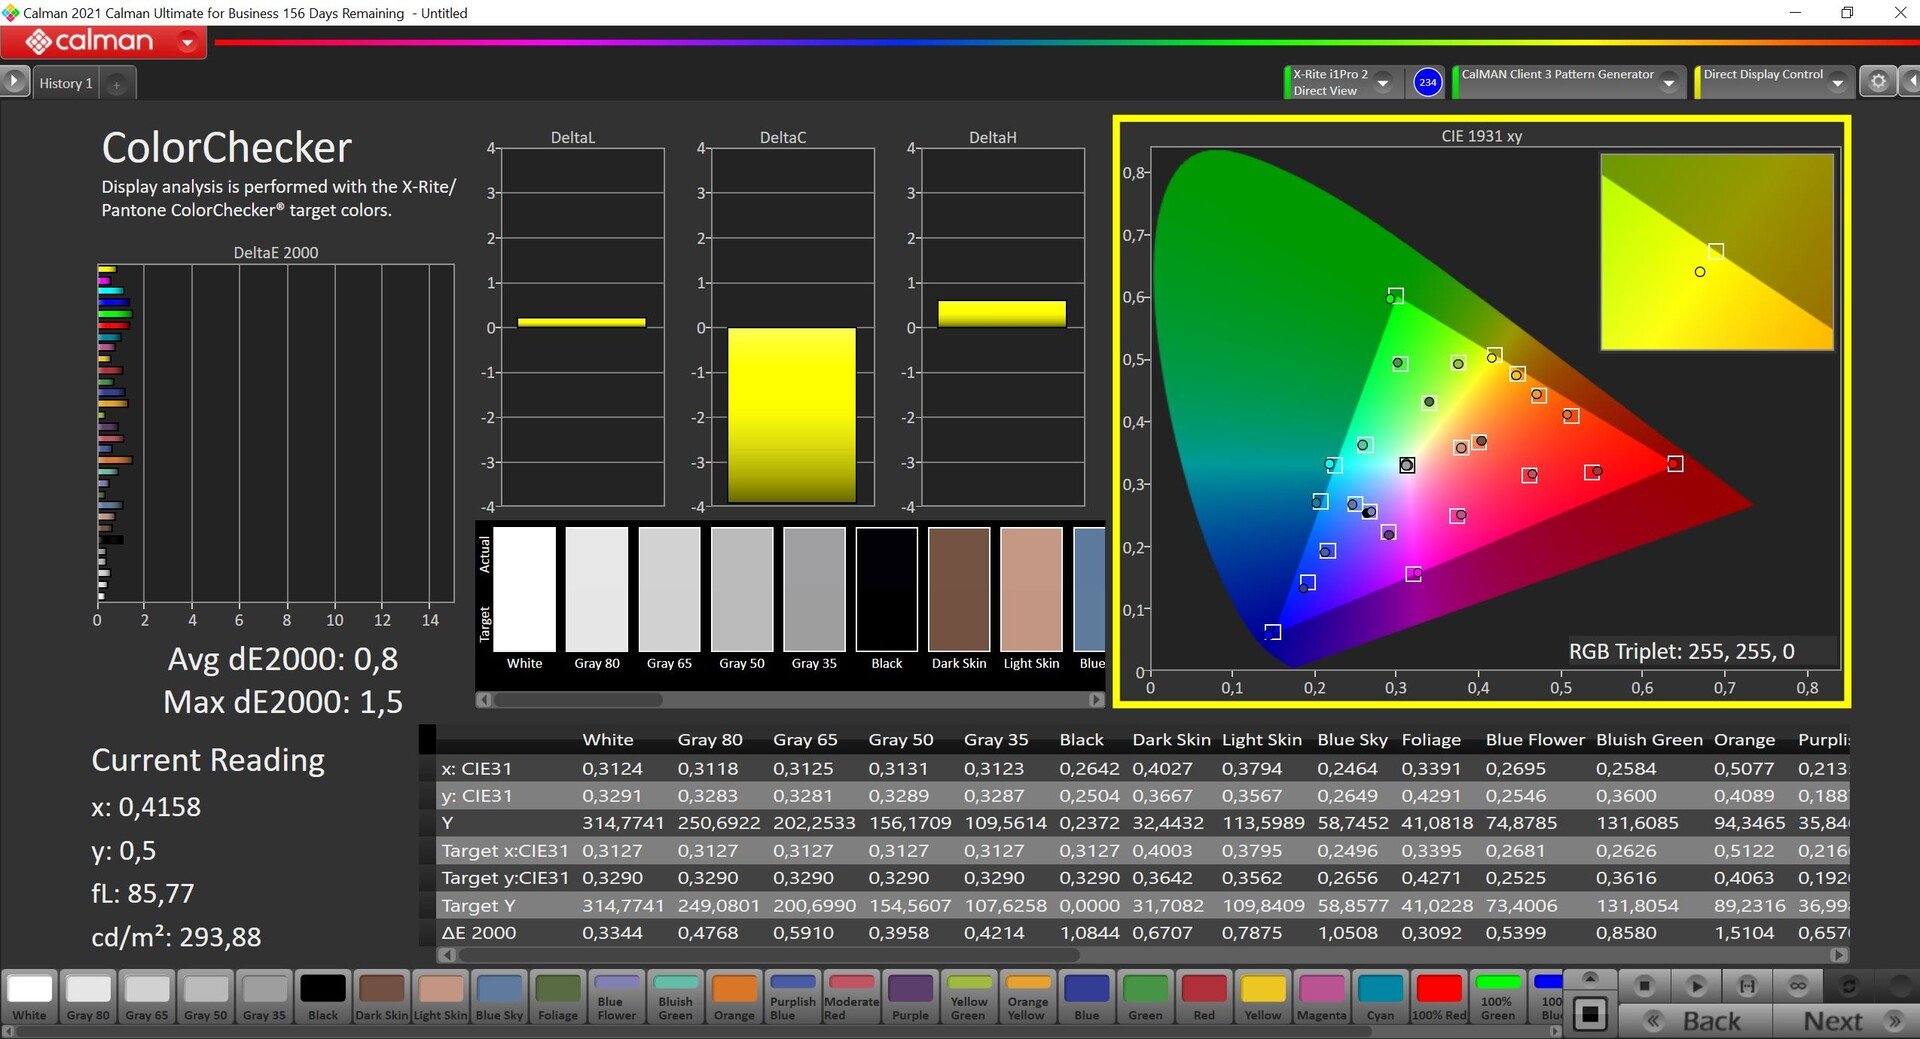
我们用专业的CalMAN软件(X-Rite i1 Pro 2)进行分析,显示出明显的蓝色色调,结合交付状态下过冷的色温。然而,我们的校准(上面有免费下载的配置文件)能够补救这个问题,同时也降低了颜色偏差。校准后的数值甚至非常好,图像/视频处理绝对可以在sRGB色彩空间中进行。

Display Response Times
| ↔ Response Time Black to White | ||
|---|---|---|
| 18.7 ms ... rise ↗ and fall ↘ combined | ↗ 9.7 ms rise | 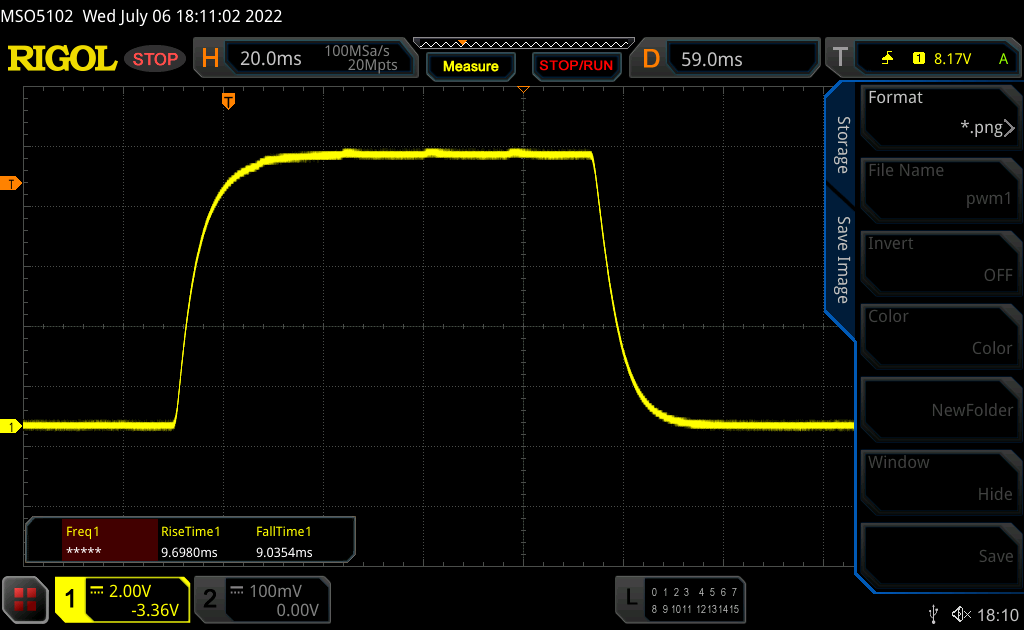 |
| ↘ 9 ms fall | ||
| The screen shows good response rates in our tests, but may be too slow for competitive gamers. In comparison, all tested devices range from 0.1 (minimum) to 240 (maximum) ms. » 42 % of all devices are better. This means that the measured response time is similar to the average of all tested devices (19.8 ms). | ||
| ↔ Response Time 50% Grey to 80% Grey | ||
| 30.5 ms ... rise ↗ and fall ↘ combined | ↗ 14.2 ms rise | 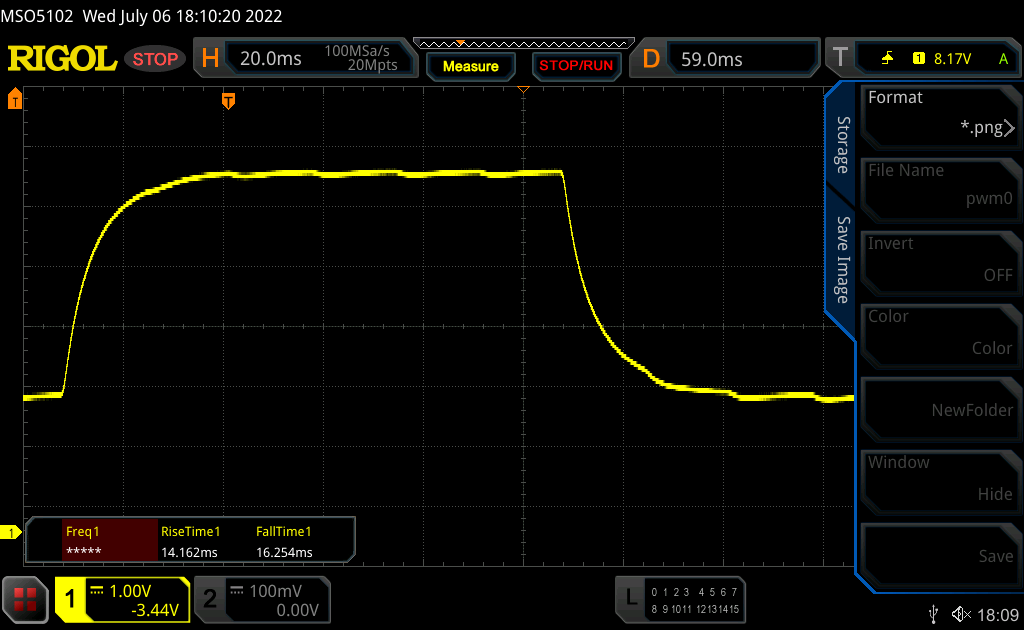 |
| ↘ 16.3 ms fall | ||
| The screen shows slow response rates in our tests and will be unsatisfactory for gamers. In comparison, all tested devices range from 0.165 (minimum) to 636 (maximum) ms. » 41 % of all devices are better. This means that the measured response time is similar to the average of all tested devices (31 ms). | ||
Screen Flickering / PWM (Pulse-Width Modulation)
| Screen flickering / PWM not detected | 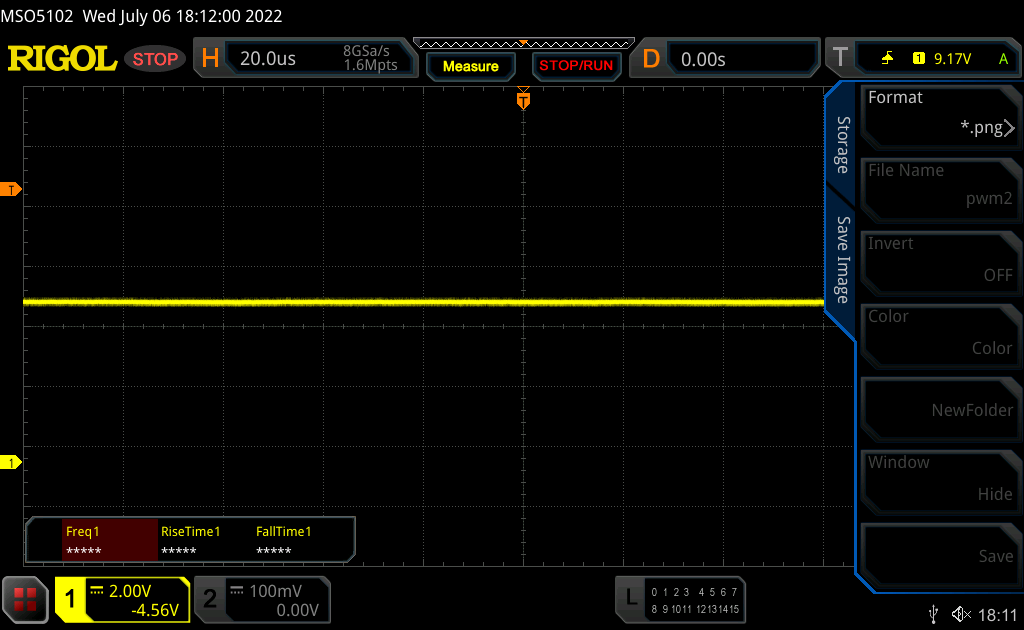 | ||
In comparison: 52 % of all tested devices do not use PWM to dim the display. If PWM was detected, an average of 7757 (minimum: 5 - maximum: 343500) Hz was measured. | |||
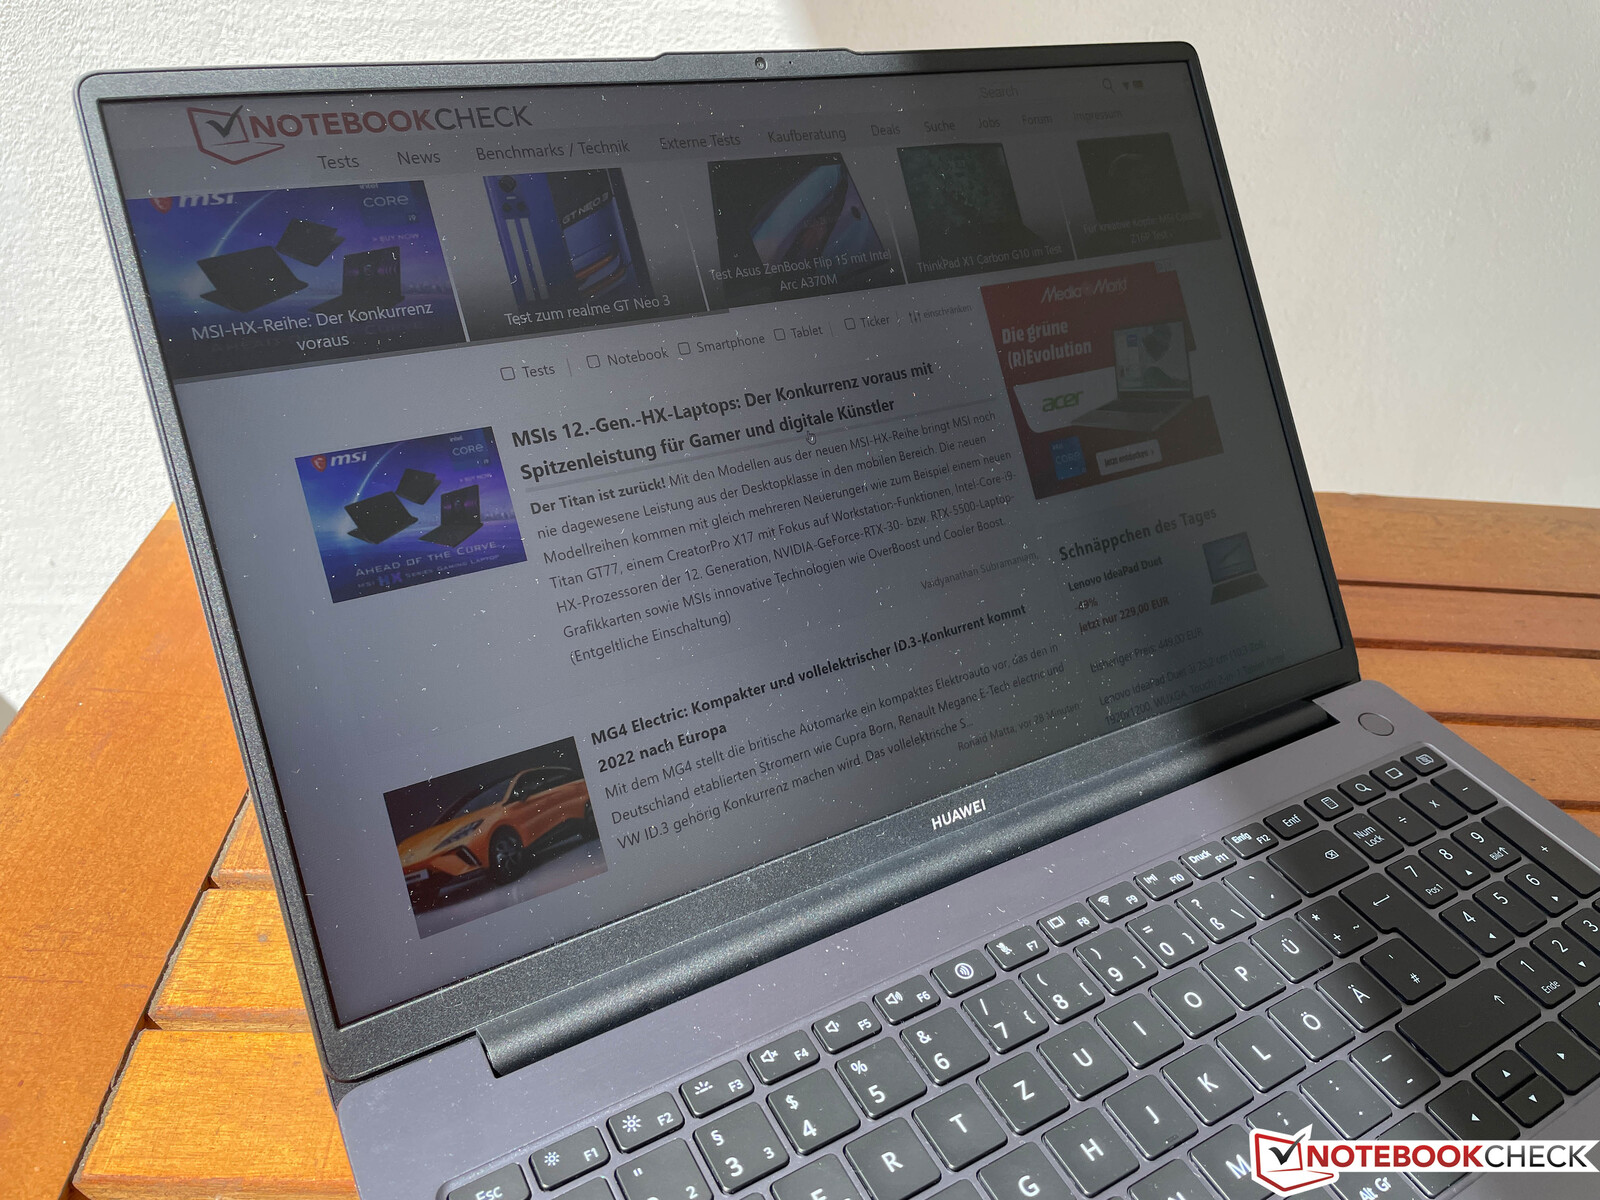
由于采用了哑光面板,如果避免阳光直射,你也可以在户外轻松工作。
性能 - 华为使用Alder Lake
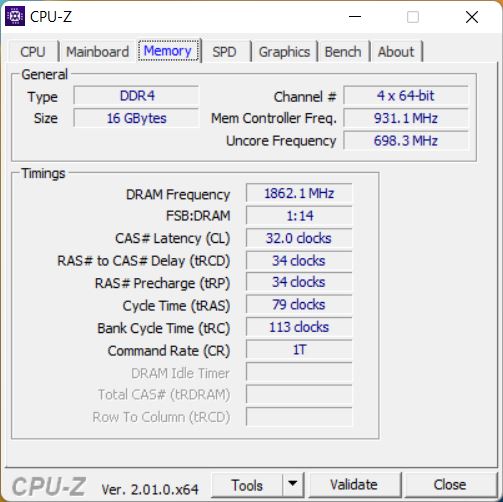
除了我们的测试装置采用 酷睿i7-12700H外,华为还提供入门级机型,配备 酷睿i5-12450H.然而,这款酷睿i5带来了一些缺点,如效率较低的核心和明显较慢的iGPU。直到现在我们还无法测试这款CPU,但与Ryzen 5 5600H相比,可能不会有任何性能优势。 Ryzen 5 5600H老款MateBook D 16的性能优势。MateBook D 16只提供LPDDR4X-3733内存,还没有LPDDR5模块。
测试条件
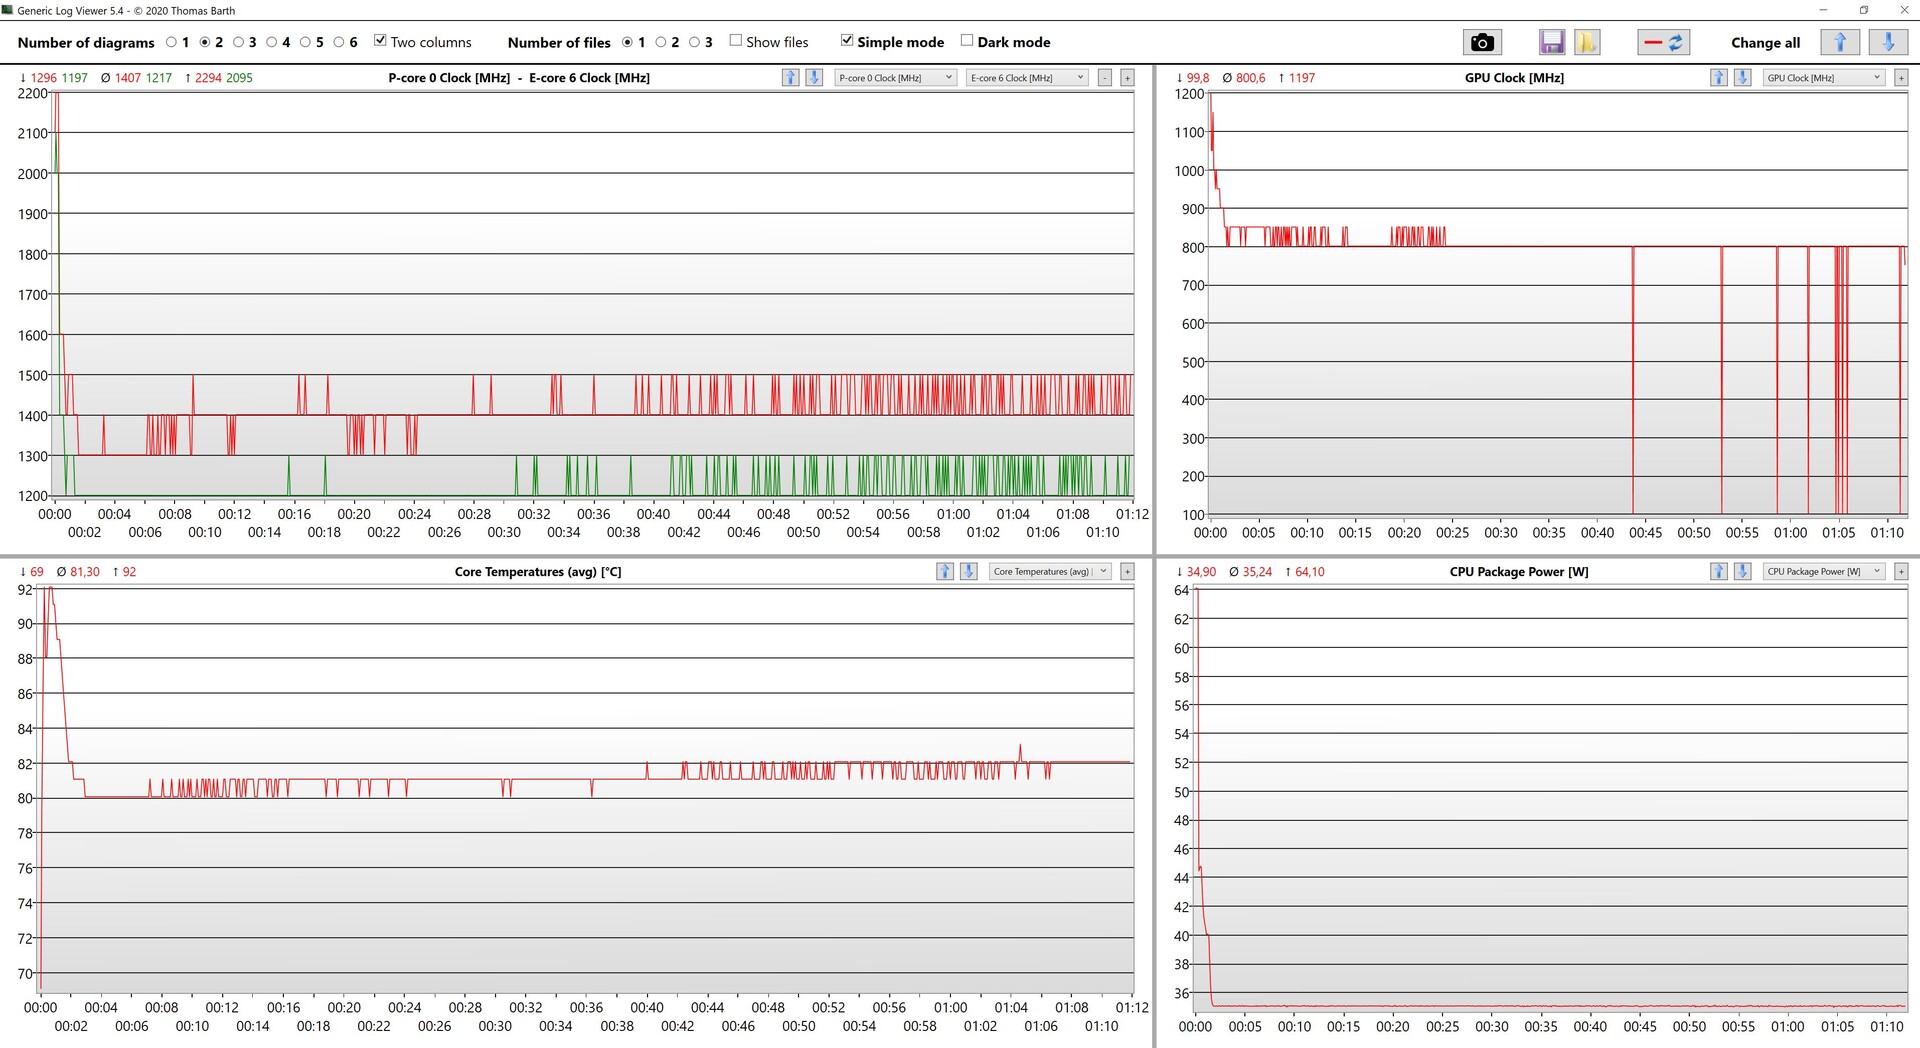
预装的PC管理器提供两种性能模式。处理器被允许在短时间内消耗高达64瓦的功率,之后迅速趋于平稳,为35瓦(平衡模式)或40瓦(性能模式,仅在主电源操作中)。这意味着,即使在性能模式下,该处理器仍然低于其标称的TDP(45瓦)。由于风扇的声音明显变大,我们不能推荐性能模式,在下面的所有测量和基准测试中使用了平衡模式。
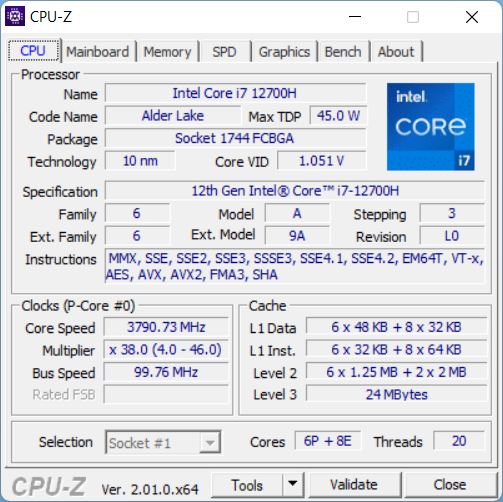
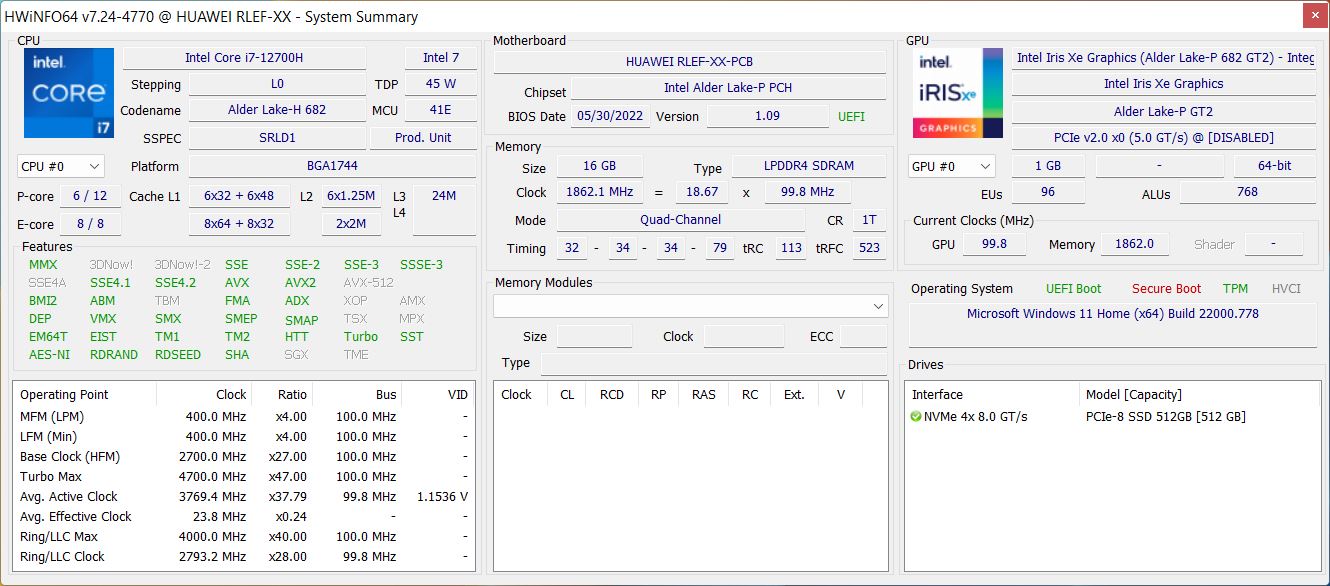
处理器 - 酷睿i7-12700H
我们已经对酷睿i7-12700H进行了多次测试,请您参考我们的 我们的CPU页面了解更多技术细节。相比之下 MateBook 16s有两个风扇,MateBook D 16只使用一个风扇,导致性能降低。在短时间内的64瓦和持续的35瓦,我们的测试装置的性能仍然明显低于Core i7-12700H的能力。
Cinebench R15 Multi Constant Load Test
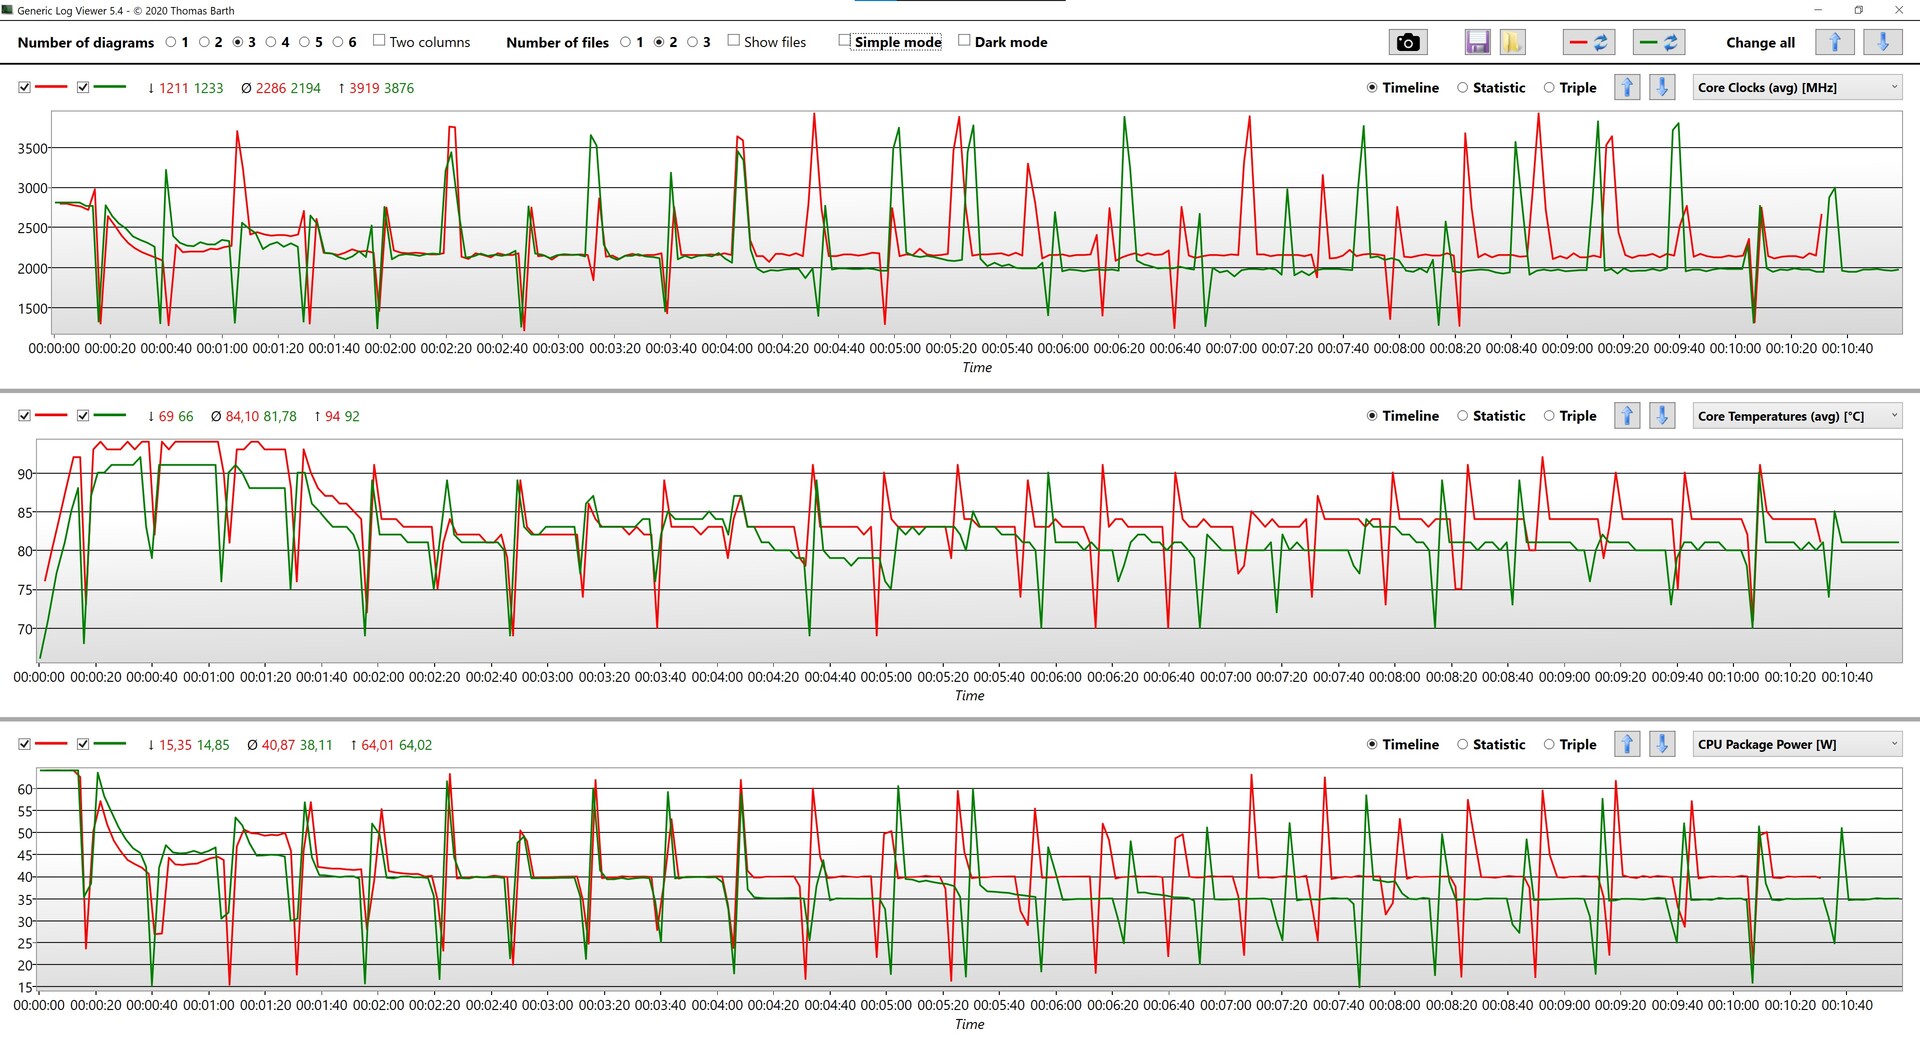
然而,在基准测试中,结果往往还是不错的,因为处理器能够从这里的高功率限制中受益--但也只是在测试开始时短暂地达到64瓦的最大值。 在持续的负载下,i7-12700H很快就被迫节流其性能。在单核运行中,性能核心的高性能也以高功耗为代价。在电池运行时,处理器的功耗被限制在40瓦(后来是35瓦),但有趣的是,这对性能几乎没有任何影响。由于CPU的温度在40瓦时不会增加那么多,所以CPU能够更长时间地保持这个数值,只是后来降到35瓦。例如,在CBR23多重测试中,只有2%的差异,这是可以忽略不计的。你可以找到更多的CPU基准测试 这里.
Cinebench R23: Multi Core | Single Core
Cinebench R20: CPU (Multi Core) | CPU (Single Core)
Cinebench R15: CPU Multi 64Bit | CPU Single 64Bit
Blender: v2.79 BMW27 CPU
7-Zip 18.03: 7z b 4 | 7z b 4 -mmt1
Geekbench 5.5: Multi-Core | Single-Core
HWBOT x265 Benchmark v2.2: 4k Preset
LibreOffice : 20 Documents To PDF
R Benchmark 2.5: Overall mean
| CPU Performance rating | |
| Average of class Multimedia | |
| Huawei MateBook 16s i7 | |
| Average Intel Core i7-12700H | |
| Huawei MateBook D 16 2022 | |
| Huawei MateBook 16 R7 5800H | |
| Dell Inspiron 16 Plus 7610 -2! | |
| Huawei MateBook D 16-53011VFJ | |
| Asus Vivobook 15 K513EQ -2! | |
| Lenovo IdeaPad 5 Pro 16IHU6 | |
| Cinebench R23 / Multi Core | |
| Average of class Multimedia (4861 - 33362, n=75, last 2 years) | |
| Average Intel Core i7-12700H (4032 - 19330, n=64) | |
| Huawei MateBook 16s i7 | |
| Huawei MateBook D 16 2022 | |
| Dell Inspiron 16 Plus 7610 | |
| Huawei MateBook 16 R7 5800H | |
| Huawei MateBook D 16-53011VFJ | |
| Lenovo IdeaPad 5 Pro 16IHU6 | |
| Asus Vivobook 15 K513EQ | |
| Cinebench R23 / Single Core | |
| Average of class Multimedia (1128 - 2459, n=67, last 2 years) | |
| Huawei MateBook 16s i7 | |
| Huawei MateBook D 16 2022 | |
| Average Intel Core i7-12700H (778 - 1826, n=63) | |
| Dell Inspiron 16 Plus 7610 | |
| Asus Vivobook 15 K513EQ | |
| Lenovo IdeaPad 5 Pro 16IHU6 | |
| Huawei MateBook 16 R7 5800H | |
| Huawei MateBook D 16-53011VFJ | |
| Cinebench R20 / CPU (Multi Core) | |
| Average of class Multimedia (1887 - 12912, n=58, last 2 years) | |
| Average Intel Core i7-12700H (1576 - 7407, n=64) | |
| Huawei MateBook 16s i7 | |
| Huawei MateBook D 16 2022 | |
| Dell Inspiron 16 Plus 7610 | |
| Huawei MateBook 16 R7 5800H | |
| Huawei MateBook D 16-53011VFJ | |
| Lenovo IdeaPad 5 Pro 16IHU6 | |
| Asus Vivobook 15 K513EQ | |
| Cinebench R20 / CPU (Single Core) | |
| Average of class Multimedia (425 - 853, n=58, last 2 years) | |
| Huawei MateBook 16s i7 | |
| Average Intel Core i7-12700H (300 - 704, n=64) | |
| Huawei MateBook D 16 2022 | |
| Dell Inspiron 16 Plus 7610 | |
| Asus Vivobook 15 K513EQ | |
| Lenovo IdeaPad 5 Pro 16IHU6 | |
| Huawei MateBook 16 R7 5800H | |
| Huawei MateBook D 16-53011VFJ | |
| Cinebench R15 / CPU Multi 64Bit | |
| Average of class Multimedia (856 - 5224, n=62, last 2 years) | |
| Huawei MateBook 16s i7 | |
| Huawei MateBook 16s i7 | |
| Average Intel Core i7-12700H (1379 - 2916, n=70) | |
| Huawei MateBook D 16 2022 | |
| Huawei MateBook D 16 2022 | |
| Huawei MateBook 16 R7 5800H | |
| Dell Inspiron 16 Plus 7610 | |
| Huawei MateBook D 16-53011VFJ | |
| Lenovo IdeaPad 5 Pro 16IHU6 | |
| Asus Vivobook 15 K513EQ | |
| Cinebench R15 / CPU Single 64Bit | |
| Average of class Multimedia (184.8 - 326, n=60, last 2 years) | |
| Huawei MateBook D 16 2022 | |
| Huawei MateBook 16s i7 | |
| Average Intel Core i7-12700H (113 - 263, n=65) | |
| Huawei MateBook 16 R7 5800H | |
| Dell Inspiron 16 Plus 7610 | |
| Asus Vivobook 15 K513EQ | |
| Huawei MateBook D 16-53011VFJ | |
| Lenovo IdeaPad 5 Pro 16IHU6 | |
| Blender / v2.79 BMW27 CPU | |
| Lenovo IdeaPad 5 Pro 16IHU6 | |
| Asus Vivobook 15 K513EQ | |
| Huawei MateBook D 16-53011VFJ | |
| Huawei MateBook D 16 2022 | |
| Dell Inspiron 16 Plus 7610 | |
| Huawei MateBook 16 R7 5800H | |
| Average of class Multimedia (100 - 557, n=59, last 2 years) | |
| Huawei MateBook 16s i7 | |
| Average Intel Core i7-12700H (168 - 732, n=63) | |
| 7-Zip 18.03 / 7z b 4 | |
| Average Intel Core i7-12700H (22844 - 73067, n=63) | |
| Average of class Multimedia (26062 - 130368, n=56, last 2 years) | |
| Huawei MateBook 16s i7 | |
| Huawei MateBook 16 R7 5800H | |
| Huawei MateBook D 16 2022 | |
| Dell Inspiron 16 Plus 7610 | |
| Huawei MateBook D 16-53011VFJ | |
| Lenovo IdeaPad 5 Pro 16IHU6 | |
| Asus Vivobook 15 K513EQ | |
| 7-Zip 18.03 / 7z b 4 -mmt1 | |
| Average of class Multimedia (3666 - 7545, n=57, last 2 years) | |
| Huawei MateBook 16s i7 | |
| Huawei MateBook D 16 2022 | |
| Average Intel Core i7-12700H (2743 - 5972, n=63) | |
| Huawei MateBook 16 R7 5800H | |
| Dell Inspiron 16 Plus 7610 | |
| Asus Vivobook 15 K513EQ | |
| Lenovo IdeaPad 5 Pro 16IHU6 | |
| Huawei MateBook D 16-53011VFJ | |
| Geekbench 5.5 / Multi-Core | |
| Average of class Multimedia (4652 - 20422, n=57, last 2 years) | |
| Huawei MateBook 16s i7 | |
| Average Intel Core i7-12700H (5144 - 13745, n=64) | |
| Huawei MateBook D 16 2022 | |
| Huawei MateBook 16 R7 5800H | |
| Huawei MateBook D 16-53011VFJ | |
| Lenovo IdeaPad 5 Pro 16IHU6 | |
| Geekbench 5.5 / Single-Core | |
| Average of class Multimedia (805 - 2974, n=57, last 2 years) | |
| Huawei MateBook 16s i7 | |
| Huawei MateBook D 16 2022 | |
| Average Intel Core i7-12700H (803 - 1851, n=64) | |
| Huawei MateBook 16 R7 5800H | |
| Lenovo IdeaPad 5 Pro 16IHU6 | |
| Huawei MateBook D 16-53011VFJ | |
| HWBOT x265 Benchmark v2.2 / 4k Preset | |
| Average of class Multimedia (5.26 - 36.1, n=57, last 2 years) | |
| Average Intel Core i7-12700H (4.67 - 21.8, n=64) | |
| Huawei MateBook 16s i7 | |
| Huawei MateBook 16 R7 5800H | |
| Huawei MateBook D 16 2022 | |
| Dell Inspiron 16 Plus 7610 | |
| Huawei MateBook D 16-53011VFJ | |
| Asus Vivobook 15 K513EQ | |
| Lenovo IdeaPad 5 Pro 16IHU6 | |
| LibreOffice / 20 Documents To PDF | |
| Huawei MateBook D 16-53011VFJ | |
| Lenovo IdeaPad 5 Pro 16IHU6 | |
| Average of class Multimedia (23.9 - 146.7, n=58, last 2 years) | |
| Huawei MateBook 16 R7 5800H | |
| Asus Vivobook 15 K513EQ | |
| Dell Inspiron 16 Plus 7610 | |
| Average Intel Core i7-12700H (34.2 - 95.3, n=63) | |
| Huawei MateBook 16s i7 | |
| Huawei MateBook D 16 2022 | |
| R Benchmark 2.5 / Overall mean | |
| Huawei MateBook D 16-53011VFJ | |
| Lenovo IdeaPad 5 Pro 16IHU6 | |
| Asus Vivobook 15 K513EQ | |
| Dell Inspiron 16 Plus 7610 | |
| Huawei MateBook 16 R7 5800H | |
| Average Intel Core i7-12700H (0.4441 - 1.052, n=63) | |
| Average of class Multimedia (0.3604 - 0.947, n=57, last 2 years) | |
| Huawei MateBook D 16 2022 | |
| Huawei MateBook 16s i7 | |
* ... smaller is better
AIDA64: FP32 Ray-Trace | FPU Julia | CPU SHA3 | CPU Queen | FPU SinJulia | FPU Mandel | CPU AES | CPU ZLib | FP64 Ray-Trace | CPU PhotoWorxx
| Performance rating | |
| Average of class Multimedia | |
| Average Intel Core i7-12700H | |
| Huawei MateBook D 16 2022 | |
| Huawei MateBook D 16-53011VFJ | |
| Lenovo IdeaPad 5 Pro 16IHU6 | |
| Asus Vivobook 15 K513EQ | |
| Dell Inspiron 16 Plus 7610 -9! | |
| AIDA64 / FP32 Ray-Trace | |
| Average of class Multimedia (2214 - 50388, n=54, last 2 years) | |
| Huawei MateBook D 16 2022 | |
| Average Intel Core i7-12700H (2585 - 17957, n=64) | |
| Huawei MateBook D 16-53011VFJ | |
| Lenovo IdeaPad 5 Pro 16IHU6 | |
| Asus Vivobook 15 K513EQ | |
| AIDA64 / FPU Julia | |
| Average of class Multimedia (12867 - 201874, n=55, last 2 years) | |
| Huawei MateBook D 16 2022 | |
| Huawei MateBook D 16-53011VFJ | |
| Average Intel Core i7-12700H (12439 - 90760, n=64) | |
| Lenovo IdeaPad 5 Pro 16IHU6 | |
| Asus Vivobook 15 K513EQ | |
| AIDA64 / CPU SHA3 | |
| Average of class Multimedia (626 - 8623, n=55, last 2 years) | |
| Average Intel Core i7-12700H (833 - 4242, n=64) | |
| Huawei MateBook D 16 2022 | |
| Lenovo IdeaPad 5 Pro 16IHU6 | |
| Asus Vivobook 15 K513EQ | |
| Huawei MateBook D 16-53011VFJ | |
| AIDA64 / CPU Queen | |
| Average Intel Core i7-12700H (57923 - 103202, n=63) | |
| Huawei MateBook D 16 2022 | |
| Average of class Multimedia (13483 - 181505, n=42, last 2 years) | |
| Huawei MateBook D 16-53011VFJ | |
| Asus Vivobook 15 K513EQ | |
| Lenovo IdeaPad 5 Pro 16IHU6 | |
| AIDA64 / FPU SinJulia | |
| Huawei MateBook D 16-53011VFJ | |
| Average Intel Core i7-12700H (3249 - 9939, n=64) | |
| Average of class Multimedia (886 - 28794, n=55, last 2 years) | |
| Huawei MateBook D 16 2022 | |
| Asus Vivobook 15 K513EQ | |
| Lenovo IdeaPad 5 Pro 16IHU6 | |
| AIDA64 / FPU Mandel | |
| Average of class Multimedia (6395 - 105740, n=54, last 2 years) | |
| Huawei MateBook D 16-53011VFJ | |
| Average Intel Core i7-12700H (7135 - 44760, n=64) | |
| Huawei MateBook D 16 2022 | |
| Lenovo IdeaPad 5 Pro 16IHU6 | |
| Asus Vivobook 15 K513EQ | |
| AIDA64 / CPU AES | |
| Huawei MateBook D 16 2022 | |
| Average Intel Core i7-12700H (31839 - 144360, n=64) | |
| Asus Vivobook 15 K513EQ | |
| Lenovo IdeaPad 5 Pro 16IHU6 | |
| Average of class Multimedia (8171 - 126790, n=55, last 2 years) | |
| Huawei MateBook D 16-53011VFJ | |
| AIDA64 / CPU ZLib | |
| Average of class Multimedia (143.8 - 2022, n=55, last 2 years) | |
| Average Intel Core i7-12700H (305 - 1171, n=64) | |
| Huawei MateBook D 16 2022 | |
| Huawei MateBook D 16-53011VFJ | |
| Asus Vivobook 15 K513EQ | |
| Lenovo IdeaPad 5 Pro 16IHU6 | |
| Dell Inspiron 16 Plus 7610 | |
| AIDA64 / FP64 Ray-Trace | |
| Average of class Multimedia (1014 - 26875, n=55, last 2 years) | |
| Average Intel Core i7-12700H (1437 - 9692, n=64) | |
| Huawei MateBook D 16 2022 | |
| Huawei MateBook D 16-53011VFJ | |
| Lenovo IdeaPad 5 Pro 16IHU6 | |
| Asus Vivobook 15 K513EQ | |
| AIDA64 / CPU PhotoWorxx | |
| Average of class Multimedia (8187 - 88154, n=55, last 2 years) | |
| Huawei MateBook D 16 2022 | |
| Average Intel Core i7-12700H (12863 - 52207, n=64) | |
| Huawei MateBook D 16-53011VFJ | |
| Asus Vivobook 15 K513EQ | |
| Lenovo IdeaPad 5 Pro 16IHU6 | |
系统性能
新款MateBook D 16的主观性能印象非常好,我们在测试中没有遇到任何问题。这一印象也被良好的基准测试结果所证实。
CrossMark: Overall | Productivity | Creativity | Responsiveness
| PCMark 10 / Score | |
| Average of class Multimedia (4325 - 10386, n=53, last 2 years) | |
| Dell Inspiron 16 Plus 7610 | |
| Huawei MateBook D 16 2022 | |
| Average Intel Core i7-12700H, Intel Iris Xe Graphics G7 96EUs (5541 - 6281, n=8) | |
| Lenovo IdeaPad 5 Pro 16IHU6 | |
| Asus Vivobook 15 K513EQ | |
| Huawei MateBook D 16-53011VFJ | |
| PCMark 10 / Essentials | |
| Huawei MateBook D 16 2022 | |
| Average Intel Core i7-12700H, Intel Iris Xe Graphics G7 96EUs (9991 - 11699, n=8) | |
| Average of class Multimedia (8025 - 11664, n=52, last 2 years) | |
| Dell Inspiron 16 Plus 7610 | |
| Asus Vivobook 15 K513EQ | |
| Huawei MateBook D 16-53011VFJ | |
| Lenovo IdeaPad 5 Pro 16IHU6 | |
| PCMark 10 / Productivity | |
| Average of class Multimedia (7323 - 18233, n=52, last 2 years) | |
| Asus Vivobook 15 K513EQ | |
| Lenovo IdeaPad 5 Pro 16IHU6 | |
| Dell Inspiron 16 Plus 7610 | |
| Huawei MateBook D 16 2022 | |
| Huawei MateBook D 16-53011VFJ | |
| Average Intel Core i7-12700H, Intel Iris Xe Graphics G7 96EUs (6690 - 8038, n=8) | |
| PCMark 10 / Digital Content Creation | |
| Average of class Multimedia (3651 - 16240, n=52, last 2 years) | |
| Dell Inspiron 16 Plus 7610 | |
| Average Intel Core i7-12700H, Intel Iris Xe Graphics G7 96EUs (6207 - 7401, n=8) | |
| Huawei MateBook D 16 2022 | |
| Lenovo IdeaPad 5 Pro 16IHU6 | |
| Huawei MateBook D 16-53011VFJ | |
| Asus Vivobook 15 K513EQ | |
| CrossMark / Overall | |
| Average of class Multimedia (866 - 2728, n=61, last 2 years) | |
| Huawei MateBook D 16 2022 | |
| Average Intel Core i7-12700H, Intel Iris Xe Graphics G7 96EUs (1492 - 1907, n=8) | |
| CrossMark / Productivity | |
| Huawei MateBook D 16 2022 | |
| Average of class Multimedia (931 - 2489, n=61, last 2 years) | |
| Average Intel Core i7-12700H, Intel Iris Xe Graphics G7 96EUs (1499 - 1832, n=8) | |
| CrossMark / Creativity | |
| Average of class Multimedia (907 - 3465, n=61, last 2 years) | |
| Huawei MateBook D 16 2022 | |
| Average Intel Core i7-12700H, Intel Iris Xe Graphics G7 96EUs (1507 - 2016, n=8) | |
| CrossMark / Responsiveness | |
| Huawei MateBook D 16 2022 | |
| Average Intel Core i7-12700H, Intel Iris Xe Graphics G7 96EUs (1384 - 1831, n=8) | |
| Average of class Multimedia (605 - 2024, n=61, last 2 years) | |
| PCMark 10 Score | 6041 points | |
Help | ||
| AIDA64 / Memory Copy | |
| Average of class Multimedia (11299 - 132135, n=55, last 2 years) | |
| Huawei MateBook D 16 2022 | |
| Average Intel Core i7-12700H (25615 - 80511, n=64) | |
| Lenovo IdeaPad 5 Pro 16IHU6 | |
| Asus Vivobook 15 K513EQ | |
| Huawei MateBook D 16-53011VFJ | |
| AIDA64 / Memory Read | |
| Average of class Multimedia (11624 - 174586, n=55, last 2 years) | |
| Average Intel Core i7-12700H (25586 - 79442, n=64) | |
| Huawei MateBook D 16 2022 | |
| Asus Vivobook 15 K513EQ | |
| Lenovo IdeaPad 5 Pro 16IHU6 | |
| Huawei MateBook D 16-53011VFJ | |
| AIDA64 / Memory Write | |
| Average of class Multimedia (11755 - 134998, n=55, last 2 years) | |
| Huawei MateBook D 16 2022 | |
| Average Intel Core i7-12700H (23679 - 88660, n=64) | |
| Asus Vivobook 15 K513EQ | |
| Lenovo IdeaPad 5 Pro 16IHU6 | |
| Huawei MateBook D 16-53011VFJ | |
| AIDA64 / Memory Latency | |
| Average of class Multimedia (7 - 535, n=54, last 2 years) | |
| Huawei MateBook D 16 2022 | |
| Asus Vivobook 15 K513EQ | |
| Huawei MateBook D 16-53011VFJ | |
| Lenovo IdeaPad 5 Pro 16IHU6 | |
| Average Intel Core i7-12700H (76.2 - 133.9, n=62) | |
| Dell Inspiron 16 Plus 7610 | |
* ... smaller is better
DPC延迟
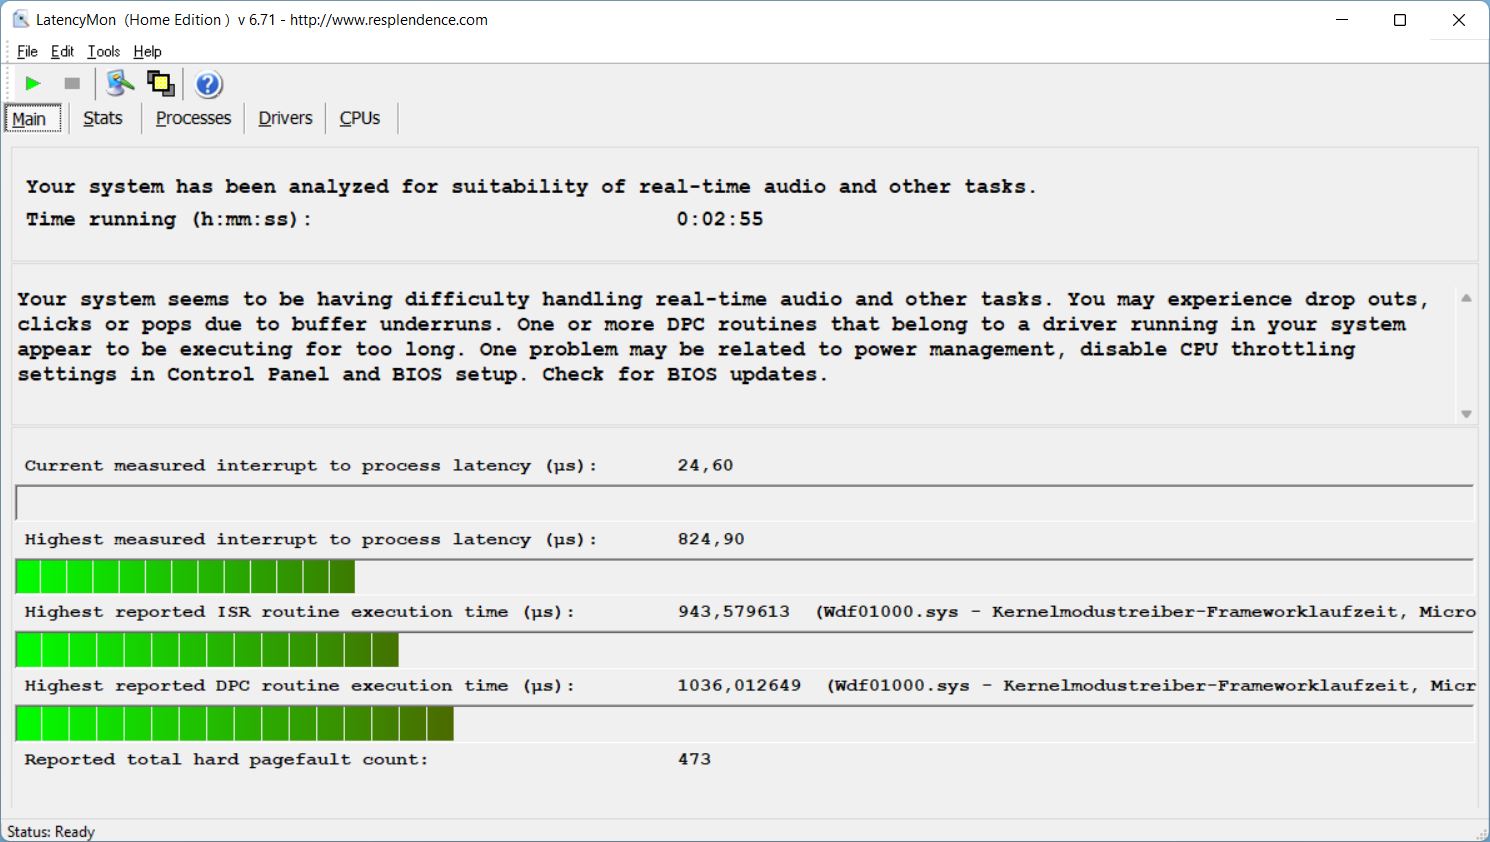
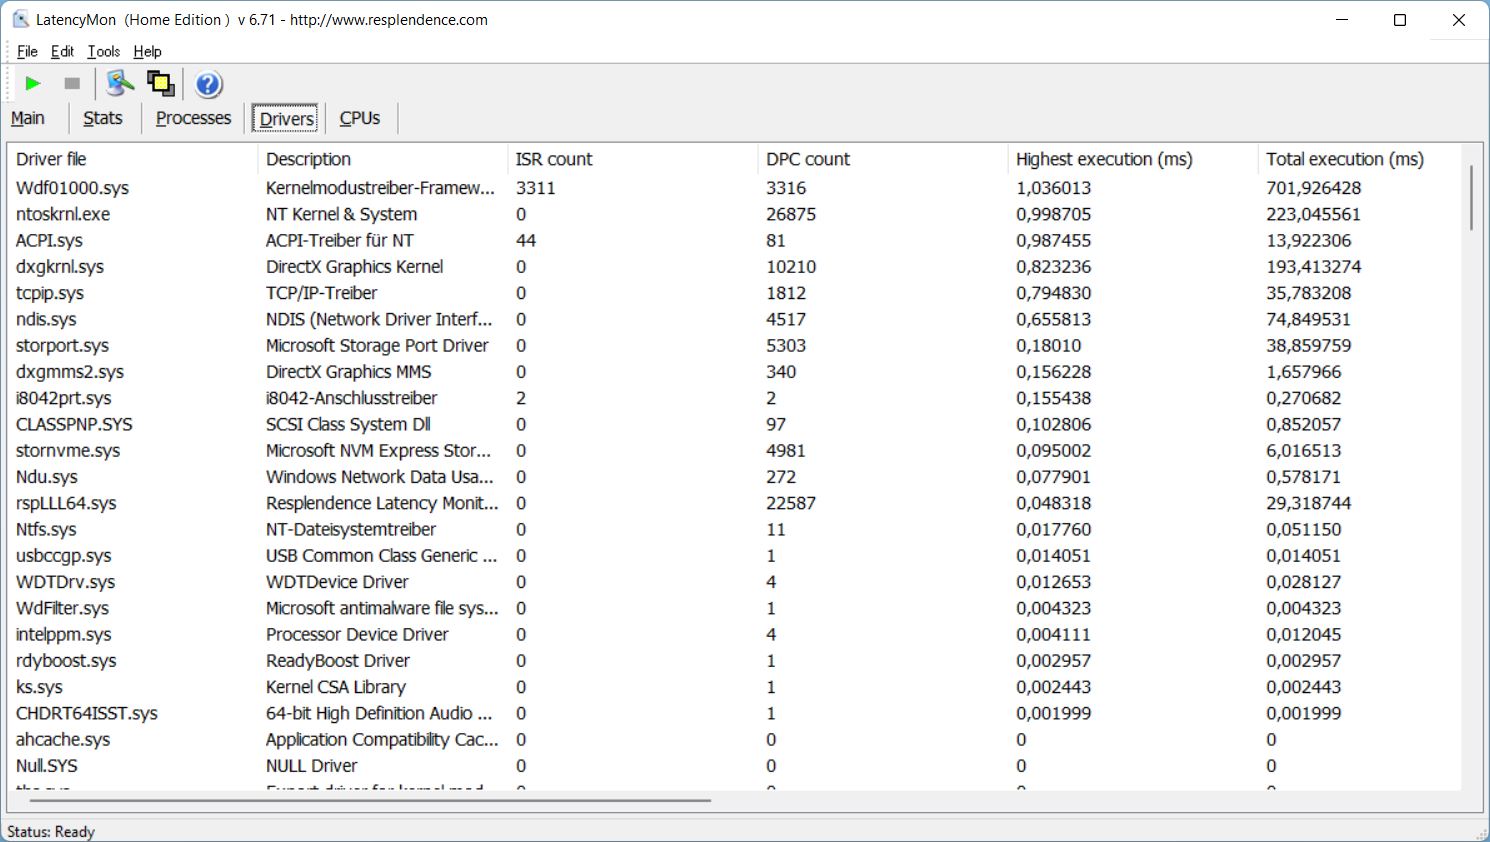
| DPC Latencies / LatencyMon - interrupt to process latency (max), Web, Youtube, Prime95 | |
| Asus Vivobook 15 K513EQ | |
| Dell Inspiron 16 Plus 7610 | |
| Huawei MateBook D 16 2022 | |
| Huawei MateBook D 16-53011VFJ | |
| Lenovo IdeaPad 5 Pro 16IHU6 | |
* ... smaller is better
存储解决方案
我们测试装置中的M.2-2280固态硬盘提供512GB的存储容量。不幸的是,它在交付状态下被不必要地分区,系统驱动器上只有略多于70GB的可用空间。PCIe 3.0-x4固态硬盘的传输率还可以,但用户必须在没有现代PCIe 4.0连接的情况下生活。你可以找到更多的SSD基准测试 这里.

* ... smaller is better
Constant Performance Reading: DiskSpd Read Loop, Queue Depth 8
图形卡
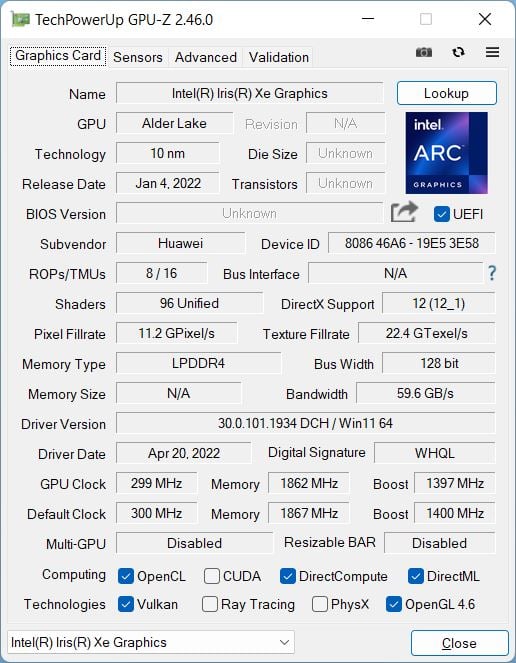
华为没有提供专用的GPU,所以只有 Iris Xe Graphics G7 (96 EUs)的处理器。这为日常任务提供了足够的性能,包括高分辨率视频的再现,但在游戏时,iGPU很快就会失去动力。这意味着你被限制在要求不高的游戏和经常降低的细节设置。至少,在持续负载和电池运行的情况下,图形性能也保持稳定。你可以找到更多的GPU基准测试 这里.
| 3DMark 11 Performance | 7649 points | |
| 3DMark Cloud Gate Standard Score | 24596 points | |
| 3DMark Fire Strike Score | 5391 points | |
| 3DMark Time Spy Score | 1982 points | |
Help | ||
The Witcher 3 FPS Chart
| low | med. | high | ultra | |
|---|---|---|---|---|
| GTA V (2015) | 123.3 | 107.8 | 24.9 | 10.8 |
| The Witcher 3 (2015) | 102 | 66 | 35 | 14 |
| Dota 2 Reborn (2015) | 139.2 | 98.3 | 69.5 | 63.5 |
| Final Fantasy XV Benchmark (2018) | 47.9 | 26.8 | 26.8 | |
| X-Plane 11.11 (2018) | 50.1 | 36.3 | 41.8 | |
| Strange Brigade (2018) | 98.7 | 45.9 | 36.4 | 29.3 |
| F1 2021 (2021) | 108.4 | 54.8 | 43 | 30 |
排放和电源管理
噪声排放
即使在低负荷的情况下,单风扇也经常以低速运行,但这通常几乎听不见。特别是在一些负载阶段结束后,风扇仍然以略高于30 dB(A)的速度运行数分钟,即使在完全空闲的情况下也是如此,这在日常工作中可能真的很恼人。AMD的前身明显更安静,特别是在空闲运行和低负荷时。
在负载情况下,风扇很快就达到了39.8 dB(A)的最大音量,不管你是在玩游戏还是只对处理器施加一些负载。在可选的性能模式下,它甚至达到了近48分贝(A),考虑到40瓦的TDP和大型机箱,这简直太吵了。就因为这个原因,我们不推荐使用性能模式。我们没有注意到任何额外的电子噪音。
Noise level
| Idle |
| 24.2 / 25.8 / 30.5 dB(A) |
| Load |
| 39.8 / 39.8 dB(A) |
 | ||
30 dB silent 40 dB(A) audible 50 dB(A) loud |
||
min: | ||
| Huawei MateBook D 16 2022 Iris Xe G7 96EUs, i7-12700H, Silicon Motion PCIe-8 SSD | Asus Vivobook 15 K513EQ GeForce MX350, i7-1165G7, Intel SSD 660p SSDPEKNW512G8 | Lenovo IdeaPad 5 Pro 16IHU6 GeForce MX450, i5-11300H, Samsung SSD PM981a MZVLB512HBJQ | Dell Inspiron 16 Plus 7610 GeForce RTX 3050 4GB Laptop GPU, i7-11800H, Kingston OM3PDP3512B | Huawei MateBook D 16-53011VFJ Vega 6, R5 4600H, Samsung SSD PM981a MZVLB512HBJQ | |
|---|---|---|---|---|---|
| Noise | 1% | 2% | -6% | 3% | |
| off / environment * (dB) | 24.2 | 23.4 3% | 25 -3% | 24.4 -1% | 25.5 -5% |
| Idle Minimum * (dB) | 24.2 | 23.6 2% | 25 -3% | 24.4 -1% | 25.5 -5% |
| Idle Average * (dB) | 25.8 | 23.6 9% | 25 3% | 24.4 5% | 25.5 1% |
| Idle Maximum * (dB) | 30.5 | 23.6 23% | 25 18% | 24.4 20% | 25.5 16% |
| Load Average * (dB) | 39.8 | 41 -3% | 44.5 -12% | 48.3 -21% | 33 17% |
| Witcher 3 ultra * (dB) | 39.8 | 42.9 -8% | 48.9 -23% | ||
| Load Maximum * (dB) | 39.8 | 47 -18% | 36.5 8% | 48.9 -23% | 42.1 -6% |
* ... smaller is better
温度
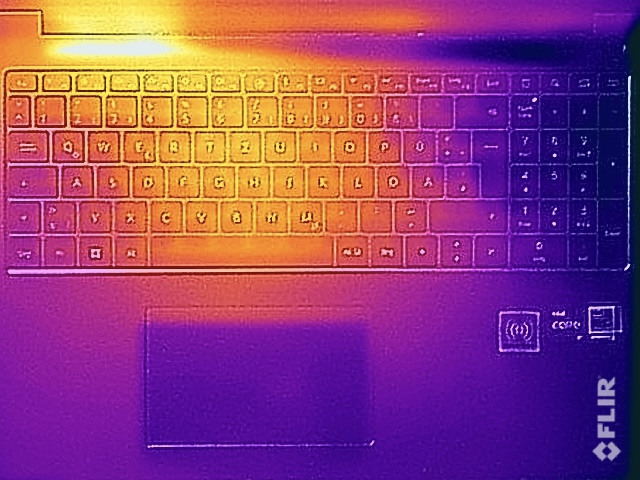
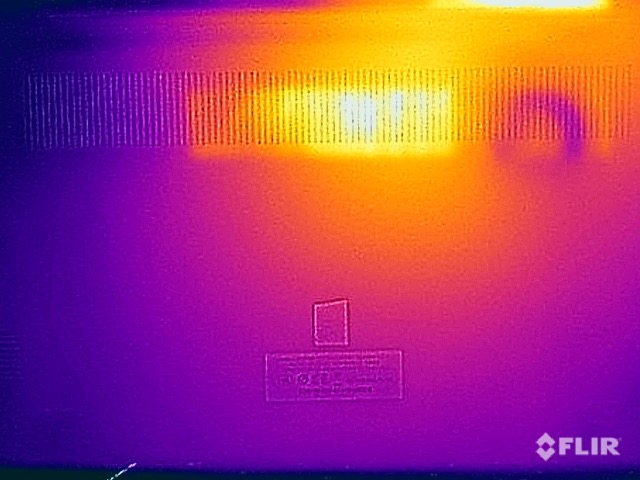
热量的发展集中在顶部的左侧,这也是单风扇的位置。在压力测试中,底部明显变热,但这并不导致这里有任何限制,反正在日常操作中不会有任何问题。在压力测试中,处理器的TDP迅速下降到35瓦,但之后就保持稳定。
(±) The maximum temperature on the upper side is 41.8 °C / 107 F, compared to the average of 36.8 °C / 98 F, ranging from 21 to 71 °C for the class Multimedia.
(-) The bottom heats up to a maximum of 47.3 °C / 117 F, compared to the average of 39.1 °C / 102 F
(+) In idle usage, the average temperature for the upper side is 26.9 °C / 80 F, compared to the device average of 31.3 °C / 88 F.
(±) Playing The Witcher 3, the average temperature for the upper side is 32.6 °C / 91 F, compared to the device average of 31.3 °C / 88 F.
(+) The palmrests and touchpad are cooler than skin temperature with a maximum of 28.4 °C / 83.1 F and are therefore cool to the touch.
(±) The average temperature of the palmrest area of similar devices was 28.7 °C / 83.7 F (+0.3 °C / 0.6 F).
| Huawei MateBook D 16 2022 Intel Core i7-12700H, Intel Iris Xe Graphics G7 96EUs | Asus Vivobook 15 K513EQ Intel Core i7-1165G7, NVIDIA GeForce MX350 | Lenovo IdeaPad 5 Pro 16IHU6 Intel Core i5-11300H, NVIDIA GeForce MX450 | Dell Inspiron 16 Plus 7610 Intel Core i7-11800H, NVIDIA GeForce RTX 3050 4GB Laptop GPU | Huawei MateBook D 16-53011VFJ AMD Ryzen 5 4600H, AMD Radeon RX Vega 6 (Ryzen 4000/5000) | |
|---|---|---|---|---|---|
| Heat | -7% | -13% | -15% | 5% | |
| Maximum Upper Side * (°C) | 41.8 | 48.8 -17% | 65.3 -56% | 46.4 -11% | 42.6 -2% |
| Maximum Bottom * (°C) | 47.3 | 42 11% | 55.4 -17% | 54.8 -16% | 41.7 12% |
| Idle Upper Side * (°C) | 28.3 | 30 -6% | 25.4 10% | 31.4 -11% | 27.8 2% |
| Idle Bottom * (°C) | 30.2 | 35 -16% | 26.8 11% | 36.6 -21% | 27.6 9% |
* ... smaller is better
发言人
这两个扬声器不再位于键盘旁边,但它们现在向底部输出声音。因此,根据表面的情况,它们可能听起来很闷。扬声器比前代产品的声音略大,但也缺乏压力。然而,性能很好,特别是在中音和高音部分,有利于声音的再现。
Huawei MateBook D 16 2022 audio analysis
(±) | speaker loudness is average but good (76 dB)
Bass 100 - 315 Hz
(-) | nearly no bass - on average 17.7% lower than median
(±) | linearity of bass is average (9.8% delta to prev. frequency)
Mids 400 - 2000 Hz
(+) | balanced mids - only 1.9% away from median
(+) | mids are linear (5.6% delta to prev. frequency)
Highs 2 - 16 kHz
(+) | balanced highs - only 4.4% away from median
(+) | highs are linear (3.1% delta to prev. frequency)
Overall 100 - 16.000 Hz
(±) | linearity of overall sound is average (16.2% difference to median)
Compared to same class
» 41% of all tested devices in this class were better, 7% similar, 51% worse
» The best had a delta of 5%, average was 17%, worst was 45%
Compared to all devices tested
» 26% of all tested devices were better, 6% similar, 68% worse
» The best had a delta of 4%, average was 23%, worst was 134%
Asus Vivobook 15 K513EQ audio analysis
(±) | speaker loudness is average but good (80.8 dB)
Bass 100 - 315 Hz
(-) | nearly no bass - on average 15.3% lower than median
(±) | linearity of bass is average (13% delta to prev. frequency)
Mids 400 - 2000 Hz
(+) | balanced mids - only 4.2% away from median
(+) | mids are linear (3.8% delta to prev. frequency)
Highs 2 - 16 kHz
(+) | balanced highs - only 0.8% away from median
(+) | highs are linear (2.3% delta to prev. frequency)
Overall 100 - 16.000 Hz
(+) | overall sound is linear (12.5% difference to median)
Compared to same class
» 24% of all tested devices in this class were better, 3% similar, 73% worse
» The best had a delta of 5%, average was 17%, worst was 45%
Compared to all devices tested
» 11% of all tested devices were better, 2% similar, 87% worse
» The best had a delta of 4%, average was 23%, worst was 134%
消耗功率
如果仅处理器就能消耗64瓦,那么紧凑的65瓦充电器无法提供足够的CPU高负荷下的全部电力消耗就不足为奇了。系统将从电池中最多吸取24瓦,只有在TDP约为38瓦时,才不再使用电池。 正如已经在 MateBook 16s之前,华为在错误的地方偷工减料,该设备应该包括一个90瓦的充电器。在高负荷或游戏时,这也导致了充电器的高温。但新机型也比其 AMD的前辈在空闲运行期间。
| Off / Standby | |
| Idle | |
| Load |
|
Key:
min: | |
Power Consumption The Witcher 3 / Stress Test
Power Consumption With External Monitor
电池寿命
即使电池容量从56瓦特略微增加到60瓦特,但由于耗电量增加,电池寿命也变差了。在我们的WLAN测试中,在150cd/m²的亮度下(相当于我们测试设备最大亮度的51%),该设备只持续了7小时多一点,而在最大亮度下,只有5.5小时。前代产品在这里持续的时间明显更长,分别为9小时或6.5小时。
| Huawei MateBook D 16 2022 i7-12700H, Iris Xe G7 96EUs, 60 Wh | Asus Vivobook 15 K513EQ i7-1165G7, GeForce MX350, 42 Wh | Lenovo IdeaPad 5 Pro 16IHU6 i5-11300H, GeForce MX450, 75 Wh | Dell Inspiron 16 Plus 7610 i7-11800H, GeForce RTX 3050 4GB Laptop GPU, 86 Wh | Huawei MateBook D 16-53011VFJ R5 4600H, Vega 6, 56 Wh | Average of class Multimedia | |
|---|---|---|---|---|---|---|
| Battery runtime | -15% | 28% | 39% | 27% | 72% | |
| WiFi v1.3 (h) | 7.1 | 6 -15% | 9.1 28% | 9.9 39% | 9 27% | 12.2 ? 72% |
| Witcher 3 ultra (h) | 1 |
Pros
Cons
结论 - 昂贵的英特尔CPU被扼杀了
原则上,新的MateBook D 16的判决书与 MateBook 16s因为改用英特尔处理器也带来了几个问题。这些问题主要包括价格的增加,特别是如果你考虑到酷睿i7带来的性能明显下降,其中一个风扇的下降。此外,华为放弃了Thunderbolt 4,右侧的一个USB-A连接只支持老式的USB 2.0标准。
虽然CPU性能(特别是单核)比前代产品好,但我们曾用Ryzen 5 5600H测试过。因此,为了公平起见,我们应该用新的MateBook D 16与Core i5-12450H进行比较,它也配备了较慢的GPU。该版本可能会在与旧型号的性能比较中失利,这也意味着我们很难推荐949欧元(约958美元)的基本版本。此外,英特尔处理器更高的功耗也导致了更短的电池寿命,而且65瓦的充电器也太弱。
老款MateBook D 16主要以其良好的性价比而令人信服。但配备英特尔酷睿i7的新机型不再是这种情况,同时制造商还在一些地方偷工减料(没有雷电4,USB-2.0端口老化,充电器太弱),这对于增加的1299欧元(约1331美元)的价格根本不合适。
另一方面,我们当然也应该提到,华为改进了外壳质量,带有数字键盘和较长键程的全尺寸键盘也给人留下了好印象。因此,一些轻微的价格上涨可能是合理的,但不是400欧元(约404美元)。 虽然改用英特尔处理器在纸面上看起来不错,但如果MateBook D 16配备了AMD处理器,它将是一个明显更有吸引力和(很可能)也更快的整体包装。
价格和可用性
新的MateBook D 16已经在欧洲推出。在其市场介绍中,华为包括MateView GT 27和一个免费背包。,配备较弱的酷睿i5-12450H的入门级机型价格为949欧元(约958美元),而我们的测试单元采用Core i7-12700H,价格为1299欧元(~$1311).
Huawei MateBook D 16 2022
- 07/15/2022 v7 (old)
Andreas Osthoff
Price comparison

