


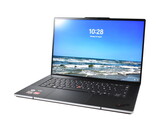
联想ThinkPad Z16 G1笔记本电脑评论。强大的AMD旗舰机,有一个小插曲
高质量,高性能,甚至相对高效地使用目前的AMD Ryzen CPU和Radeon显卡--有什么可能出错呢?事实上,有很多。但实际上,联想ThinkPad Z16 G1只有一个问题,给我们的测试评估带来了困难。
AMD Ryzen 7 PRO 6850H, Radeon RX 6500M, 16", 1.9 kg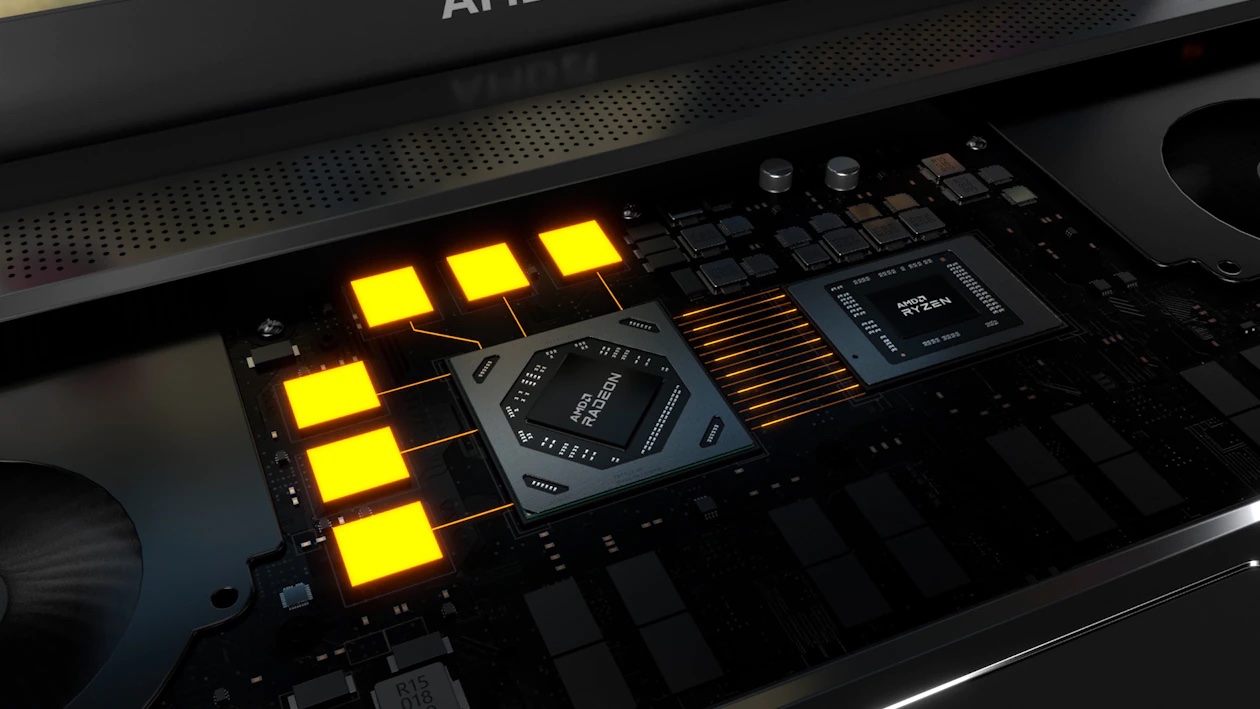
AMD Radeon RX 6500M是一款基于Navi 24芯片(RDNA 2架构)的移动入门级显卡,采用现代6纳米工艺制造。它具有1024个内核(16个CU--计算单元)和4GB的快速GDDR6显存,与128位内存总线相连。该芯片还包括16MB Infinity Cache。游戏时钟速度被指定为2191 MHz。AMD规定理论性能为9.97 TFLOPS(半精度比6300M提高60%)和4.98 TFLOPS(单精度)。6500M支持智能访问内存和智能移位技术。
其性能应该类似于移动RTX 3050(据AMD称),因此最适合于高设置的1080p游戏。
Navi 24芯片由台积电以现代6纳米工艺制造,应提供良好的能源效率。RX6500M的TDP为50瓦,因此最适合普通多媒体笔记本电脑。
Radeon RX 6000M Series
| ||||||||||||||||||||||||||||||||||||||||||||||
| Architecture | RDNA 2 | |||||||||||||||||||||||||||||||||||||||||||||
| Pipelines | 1024 - unified | |||||||||||||||||||||||||||||||||||||||||||||
| TMUs | 64 | |||||||||||||||||||||||||||||||||||||||||||||
| ROPs | 32 | |||||||||||||||||||||||||||||||||||||||||||||
| Core Speed | 2191 (Boost) MHz | |||||||||||||||||||||||||||||||||||||||||||||
| Theoretical Performance | 9.97 TFLOPS FP16, 4.98 TFLOPS FP32 | |||||||||||||||||||||||||||||||||||||||||||||
| Cache | L3: 16 MB | |||||||||||||||||||||||||||||||||||||||||||||
| Memory Speed | 18000 MHz | |||||||||||||||||||||||||||||||||||||||||||||
| Memory Bus Width | 64 Bit | |||||||||||||||||||||||||||||||||||||||||||||
| Memory Type | GDDR6 | |||||||||||||||||||||||||||||||||||||||||||||
| Max. Amount of Memory | 4 GB | |||||||||||||||||||||||||||||||||||||||||||||
| Shared Memory | no | |||||||||||||||||||||||||||||||||||||||||||||
| Memory Bandwidth | 128 GB/s | |||||||||||||||||||||||||||||||||||||||||||||
| API | DirectX 12_2, Shader 6.4, OpenGL 4.6, OpenCL 2.2, Vulkan 1.3 | |||||||||||||||||||||||||||||||||||||||||||||
| Power Consumption | 50 Watt | |||||||||||||||||||||||||||||||||||||||||||||
| Transistor Count | 5.4 Billion | |||||||||||||||||||||||||||||||||||||||||||||
| Die Size | 107 mm² | |||||||||||||||||||||||||||||||||||||||||||||
| Man. Technology | 6 nm | |||||||||||||||||||||||||||||||||||||||||||||
| PCIe | 4.0 x4 | |||||||||||||||||||||||||||||||||||||||||||||
| Features | DisplayPort 1.4 w/DFSC, HDMI 2.0b, Radeon Media Engine (H.264 4K150 decode, 4K90 encode / H.265 4K90 decode, 4K60 encode / VP9 4K90 decode) | |||||||||||||||||||||||||||||||||||||||||||||
| Notebook Size | medium sized | |||||||||||||||||||||||||||||||||||||||||||||
| Date of Announcement | 04.01.2022 | |||||||||||||||||||||||||||||||||||||||||||||
| Link to Manufacturer Page | www.amd.com | |||||||||||||||||||||||||||||||||||||||||||||
The following benchmarks stem from our benchmarks of review laptops. The performance depends on the used graphics memory, clock rate, processor, system settings, drivers, and operating systems. So the results don't have to be representative for all laptops with this GPU. For detailed information on the benchmark results, click on the fps number.


| low | med. | high | ultra | QHD | 4K | |
|---|---|---|---|---|---|---|
| Last Epoch | 100.4 | 81.2 | 69.1 | 48.2 | ||
| Skull & Bones | 54 | 50 | 34 | |||
| Helldivers 2 | 43.4 | 32.8 | 24.5 | 12.1 | ||
| Enshrouded | 37.2 | 33 | 27.5 | 22.9 | ||
| Palworld | 59.5 | 47.9 | 26.8 | 21.1 | ||
| The Finals | 94 | 84.4 | 77.1 | 56.7 | ||
| Call of Duty Modern Warfare 3 2023 | 89 | 75 | 53 | |||
| Alan Wake 2 | 23.7 | 23.6 | 20.3 | |||
| Total War Pharaoh | 141.9 | 87.7 | 53.3 | 37 | ||
| Cyberpunk 2077 | 50.7 | 39.8 | 28.4 | 24.4 | ||
| Baldur's Gate 3 | 58 | 45.3 | 38.5 | 38.1 | ||
| F1 23 | 67.7 | 61 | 45.5 | |||
| Diablo 4 | 98.6 | 90 | 81 | 75.3 | ||
| The Witcher 3 v4 | 81.4 | 61 | 29.4 | 25.7 | ||
| Spider-Man Miles Morales | 40.7 | 32.6 | 28.8 | 24.6 | ||
| The Quarry | 64.1 | 48.3 | 38.9 | 25.4 | ||
| F1 22 | 116.3 | 97.2 | 75.6 | 13.9 | ||
| Vampire Bloodhunt | 142.7 | 115 | 106.7 | 98.1 | ||
| Ghostwire Tokyo | 72.7 | 71 | 65.5 | 66.3 | ||
| Tiny Tina's Wonderlands | 118.1 | 88.5 | 45.8 | 29.8 | ||
| Cyberpunk 2077 1.6 | 66.2 | 66.5 | 32.3 | 29.2 | ||
| Elex 2 | 53.4 | 51 | 44 | 37.6 | ||
| GRID Legends | 146.9 | 105 | 75.9 | 59.9 | ||
| Dying Light 2 | 58.4 | 46.6 | 37 | |||
| Rainbow Six Extraction | 96 | 69 | 61 | 34 | ||
| God of War | 64.5 | 54.1 | 39.6 | 11.9 | ||
| Halo Infinite | 62.4 | 43.6 | 42.4 | |||
| Farming Simulator 22 | 96.6 | 86 | ||||
| Battlefield 2042 | 129.7 | 71.2 | 53.3 | 23.3 | ||
| Forza Horizon 5 | 152 | 101 | 81 | 27 | ||
| Riders Republic | 71 | 68 | 58 | 43 | ||
| Guardians of the Galaxy | 83 | 48 | 47 | 44 | ||
| Back 4 Blood | 116 | 95.3 | 92.7 | |||
| Far Cry 6 | 91.7 | 69.8 | 62.5 | 54.5 | ||
| New World | 70.3 | 53 | 46.2 | 40.4 | ||
| F1 2021 | 245 | 139 | 105.1 | 42.9 | ||
| Days Gone | 116.3 | 70.6 | 62.7 | 44.2 | ||
| Mass Effect Legendary Edition | 82.2 | 75.6 | ||||
| Hitman 3 | 157.2 | 102.1 | 88.7 | 80.5 | ||
| Immortals Fenyx Rising | 89 | 68 | 47 | 41 | ||
| Yakuza Like a Dragon | 80.3 | 60.6 | 58.4 | 54.5 | ||
| Assassin´s Creed Valhalla | 113 | 62 | 45 | 39 | ||
| Dirt 5 | 159.4 | 72.9 | 56.3 | 37.4 | ||
| Watch Dogs Legion | 81.1 | 70 | 59.1 | 24.6 | ||
| Star Wars Squadrons | 267 | 150.5 | 131.7 | 119.6 | ||
| Mafia Definitive Edition | 91.4 | 53 | 48.7 | |||
| Crysis Remastered | 185.6 | 88.7 | 26.3 | 19.6 | ||
| Horizon Zero Dawn | 103 | 71 | 59 | 54 | ||
| Death Stranding | 130.4 | 89.3 | 82.2 | 78.9 | ||
| Gears Tactics | 257.8 | 125.2 | 82.4 | 56.6 | ||
| Doom Eternal | 232 | 101.2 | 57.5 | |||
| Hunt Showdown | 124.8 | 68.9 | 57.3 | |||
| Borderlands 3 | 78.2 | 66.6 | 47.1 | 34.5 | ||
| The Division 2 | 129 | 82 | 67 | 47 | ||
| Metro Exodus | 137.4 | 66.7 | 46.7 | 37 | ||
| Strange Brigade | 241 | 114 | 95 | 83 | ||
| Far Cry 5 | 90 | 75 | 71 | 66 | ||
| X-Plane 11.11 | 49 | 41 | 35 | |||
| Final Fantasy XV Benchmark | 122 | 64 | 42 | |||
| Dota 2 Reborn | 101 | 87 | 89 | 80 | ||
| The Witcher 3 | 195 | 136.2 | 57.4 | 39.1 | ||
| GTA V | 144 | 133 | 93 | 45 | ||
| low | med. | high | ultra | QHD | 4K | < 30 fps < 60 fps < 120 fps ≥ 120 fps | 1 10 28 20 | 1 15 39 5 | 8 30 22 1 | 15 25 12 | | |
For more games that might be playable and a list of all games and graphics cards visit our Gaming List
MSI Bravo 15 B5ED, R7 5800H: AMD Ryzen 7 5800H, 15.60", 2.4 kg
External Review » MSI Bravo 15 B5ED, R7 5800H
Lenovo ThinkPad Z16, R5 PRO 6650H: AMD Ryzen 5 PRO 6650H, 16.00", 1.8 kg
External Review » Lenovo ThinkPad Z16, R5 PRO 6650H
HP Victus 15-fb0035ns: AMD Ryzen 5 5600H, 15.60", 2.3 kg
External Review » HP Victus 15-fb0035ns
MSI Bravo 15 B5ED: AMD Ryzen 5 5600H, 15.60", 2.4 kg
External Review » MSI Bravo 15 B5ED
Lenovo ThinkPad Z16 G1 21D4002GG: AMD Ryzen 9 PRO 6950H, 16.00", 1.9 kg
External Review » Lenovo ThinkPad Z16 G1 21D4002GG
Lenovo ThinkPad Z16 G1 21D5S00T00: AMD Ryzen 7 PRO 6850H, 16.00", 1.9 kg
External Review » Lenovo ThinkPad Z16 G1 21D5S00T00
HP Victus 15-fb0011AX: AMD Ryzen 5 5600H, 15.60", 2.3 kg
External Review » HP Victus 15-fb0011AX
» Comparison of GPUs
Detailed list of all laptop GPUs sorted by class and performance.
» Benchmark List
Sort and restrict laptop GPUs based on performance in synthetic benchmarks.
» Notebook Gaming List
Playable games for each graphics card and their average FPS results.
* Approximate position of the graphics adapter
» Notebookcheck多媒体笔记本电脑Top 10排名
» Notebookcheck游戏笔记本电脑Top 10排名
» Notebookcheck低价办公/商务笔记本电脑Top 10排名
» Notebookcheck高端办公/商务笔记本电脑Top 10排名
» Notebookcheck工作站笔记本电脑Top 10排名
» Notebookcheck亚笔记本电脑Top 10排名
» Notebookcheck超级本产品Top 10排名
» Notebookcheck变形本产品Top 10排名
» Notebookcheck平板电脑Top 10排名
» Notebookcheck智能手机Top 10排名
» Notebookcheck评测过最出色的笔记本电脑屏幕
» Notebookcheck售价500欧元以下笔记本电脑Top 10排名
» Notebookcheck售价300欧元以下笔记本电脑Top 10排名