Notebookcheck Logo

NVIDIA RTX 2000 Ada Generation Laptop GPU

NVIDIA NVIDIA RTX 2000 Ada Generation Laptop GPU

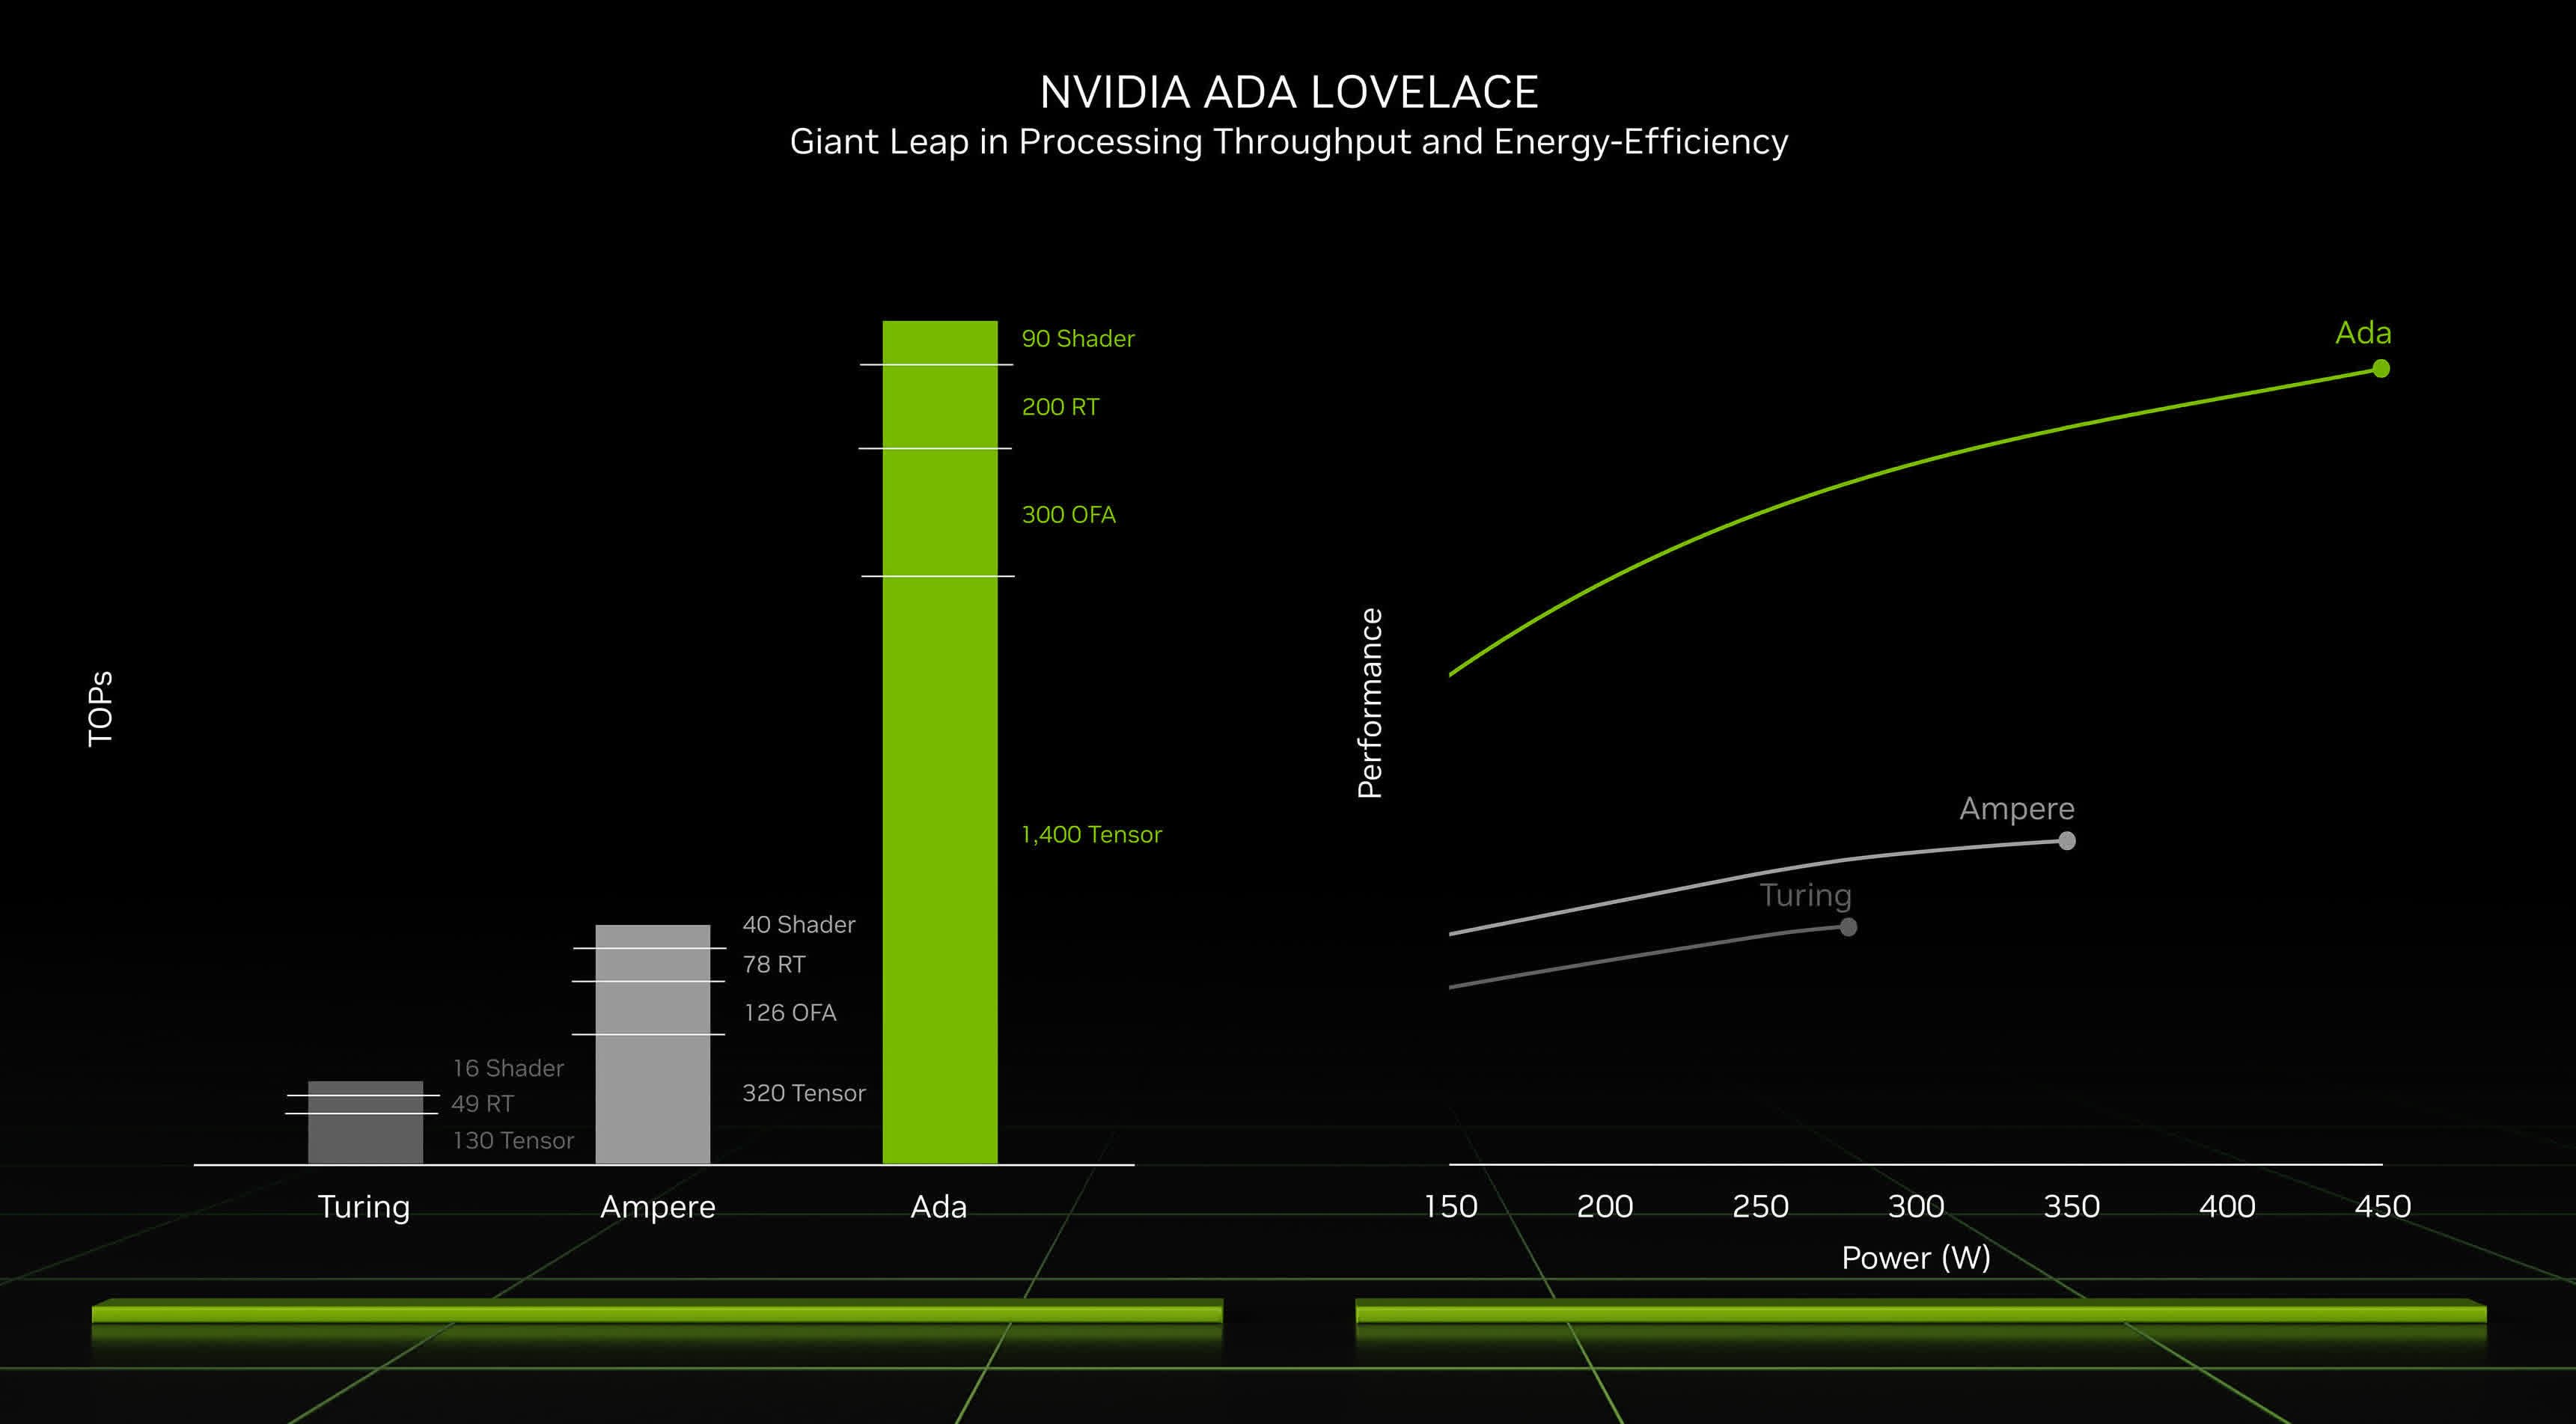
Nvidia RTX 2000 Ada Generation(不要与 A2000、P2000 或 T2000 混淆)是一款中档专业显卡,适用于笔记本电脑,配备 3,072 个 CUDA 核心和 8 GB GDDR6 VRAM。可以公平地说,这是伪装的 GeForce RTX 4060(笔记本电脑);因此,该显卡采用相同的 AD107 芯片,速度足够快,可以处理任何具有 Ultra 质量设置的 1080p AAA 游戏。 RTX 2000 于 2023 年推出,利用台积电的 5 nm 工艺和 Nvidia 的 Ada Lovelace 架构,实现了非常不错的性能和适中的功耗。

Quadro 系列显卡配备的 BIOS 和驱动程序与 GeForce 卡有很大不同,并且面向专业用途而不是游戏。产品设计、大规模计算、模拟、数据挖掘、24 x 7 运行、经过认证的驱动程序 - 如果这些听起来很熟悉,那么 Quadro 卡会让您满意。

架构与特点

Ada Lovelace 利用即将推出的 Ampere 架构对旧显卡进行了一系列改进。这不仅是因为我们拥有更好的制造工艺和更多的 CUDA 核心(分别为 16,384 个和 10,752 个);引擎盖下的改进非常多,包括更大的二级缓存、通过简化对透明和不透明的评估而实现的优化光线追踪例程以及其他更改。当然,这些显卡可以对一些最广泛使用的视频编解码器进行编码和解码,包括 AVC、HEVC 和 AV1;它们还支持一系列 Nvidia 技术,包括 Optimus 和 DLSS 3。后者利用机器学习动态生成额外的帧,从而以少量工件为代价,将支持的游戏的帧速率提高许多倍。

RTX 2000具有24个第三代RT核心、96个第四代Tensor核心和3,072个CUDA核心。将这些数字增加 50%,您就得到了 RTX 3000 Ada Generation——当然,只要我们忽略时钟速度差异。与昂贵的 Ada Generation 专业笔记本电脑显卡不同,RTX 2000 配备 8 GB 非 ECC VRAM;由于缺乏纠错电路,该卡不太适合超级重要的任务和全天候操作。与 RTX 3000 Ada Generation 非常相似,VRAM 为 128 位宽,带宽约为 256 GB/s。

RTX 2000 Ada Generation 使用 PCI-Express 4 协议,就像基于 Ampere 的卡一样。支持 8K SUHD 显示器,但 DP 1.4a 视频输出可能会成为瓶颈。

表现

根据我们对 65 W RTX 2000 Ada Generation 的内部测试结果,我们可以自信地说,该显卡确实像 RTX 4060 笔记本电脑一样行走、像 RTX 4060 笔记本电脑一样说话,并提供:

• Blender 3.3 Classroom CUDA 得分约为 50 秒

• 3DMark 11 GPU 得分约为 35,000 分

• GTA V 中高达 70 fps(1440p - 最高设置,16x AF、4x MSAA、FXAA)

• Cyber​​punk 2077 中高达 40 fps(1440p - 高设置、Ultra RT、“质量”DLSS)

Nvidia 的营销材料提到 14.5 TFLOPS 的性能,与 RTX 3000 Ada Generation 提供的 20 TFLOPS 相比显着下降。

您的里程数可能会有所不同,具体取决于您笔记本电脑的冷却解决方案的能力以及 RTX 2000 Ada 的 TGP 功率目标有多高。

能量消耗

Nvidia 不再将其笔记本电脑显卡分为 Max-Q 和非 max-Q 型号。相反,笔记本电脑制造商可以根据自己的需要自由设置 TGP,而且范围有时会大得惊人。 RTX 2000 的情况尤其如此,因为建议的最低值仅为 35 W,而最高值则高出 300%,为 140 W。围绕 RTX 2000 构建的最慢系统的速度很容易只有最快系统的一半一。我们已经在配备最新 GeForce RTX 卡的消费级笔记本电脑上看到了这种增量。

最后但并非最不重要的一点是,截至 2023 年中期,RTX 2000 采用改进的 5 nm 工艺(TSMC 4N)构建,可实现非常不错的能源效率。

RTX Ada Generation Laptop GPU Series

NVIDIA RTX 5000 Ada Generation Laptop GPU 9728 @ 0.93 - 1.68 GHz256 Bit @ 20000 MHz
NVIDIA RTX 4000 Ada Generation Laptop GPU 7424 192 Bit @ 16000 MHz
NVIDIA RTX 3500 Ada Generation Laptop GPU 5120 192 Bit @ 16000 MHz
NVIDIA RTX 3000 Ada Generation Laptop GPU 4608 128 Bit @ 16000 MHz
NVIDIA RTX 2000 Ada Generation Laptop GPU 3072 128 Bit @ 16000 MHz
Nvidia RTX 1000 Ada Generation Laptop GPU 2560 96 Bit @ 16000 MHz
Nvidia RTX 500 Ada Generation Laptop GPU 2048 64 Bit @ 12000 MHz
ArchitectureAda Lovelace
Pipelines3072 - unified
TMUs96
ROPs32
Raytracing Cores24
Tensor / AI Cores96
CacheL2: 32 MB
Memory Speed16000 effective = 2000 MHz
Memory Bus Width128 Bit
Memory TypeGDDR6
Max. Amount of Memory8 GB
Shared Memoryno
Memory Bandwidth256 GB/s
APIDirectX 12 Ultimate, Shader 6.7, OpenGL 4.6, OpenCL 3.0, Vulkan 1.3
Power Consumption115 Watt (35 - 115 Watt TGP)
technology5 nm
PCIe4
Displays4 Displays (max.), HDMI 2.1, DisplayPort 1.4a
Notebook Sizelarge
Date of Announcement21.03.2023
Link to Manufacturer Pageimages.nvidia.com
PredecessorRTX A2000 Laptop GPU

Benchmarks

3DMark - 3DMark Time Spy Score
min: 7813     avg: 8763     median: 8849 (26%)     max: 9628 Points
3DMark - 3DMark Time Spy Graphics
min: 7410     avg: 8334     median: 8433 (22%)     max: 9158 Points
3DMark - 3DMark Cloud Gate Graphics
133204 Points (35%)
3DMark - 3DMark Fire Strike Standard Score
min: 18177     avg: 20223     median: 19987 (35%)     max: 22505 Points
3DMark - 3DMark Fire Strike Standard Graphics
min: 20340     avg: 22325     median: 22039 (25%)     max: 24596 Points
3DMark - 3DMark Wild Life Extreme Unlimited
15840 Points (18%)
3DMark 11 - 3DM11 Performance Score
min: 25876     avg: 27504     median: 27558 (38%)     max: 29077 Points
3DMark 11 - 3DM11 Performance GPU
min: 26968     avg: 30077     median: 30262 (26%)     max: 33001 Points
171.8 -99%
...
26816 -11%
NVIDIA GeForce RTX 2070 Super Max-Q
27104 -10%
27852 -7%
NVIDIA GeForce GTX 1080 Mobile
28106 -7%
28539 -5%
28692 -5%
28847 -4%
NVIDIA GeForce RTX 2070 Super Mobile
29416 -2%
29663 -1%
NVIDIA RTX 2000 Ada Generation Laptop GPU
30077
31142 4%
32331 7%
32662 9%
32846 9%
33169 10%
33497 11%
34188 14%
34335 14%
34842 16%
...
59943 99%
max:
106023 253%
0%
100%
3DMark Vantage
3DM Vant. Perf. total +
3DMark Vantage - 3DM Vant. Perf. total
37844 Points (11%)
3DM Vant. Perf. GPU no PhysX +
3DMark Vantage - 3DM Vant. Perf. GPU no PhysX
32473 Points (18%)
ATI Radeon HD 3200
62 -100%
...
29214 -10%
NVIDIA GeForce GTX 1050 Ti Max-Q
29448 -9%
29844 -8%
AMD Radeon R9 M295X
29938 -8%
30252 -7%
NVIDIA Quadro P2000 Max-Q
30786 -5%
NVIDIA Quadro P2000
31451 -3%
31800 -2%
NVIDIA GeForce GTX 1050 Ti Mobile
32349 0%
NVIDIA RTX 2000 Ada Generation Laptop GPU
32473
33179 2%
33321 3%
33740 4%
33810 4%
34450 6%
34680 7%
34951 8%
35209 8%
35286 9%
...
132443 308%
max:
170928 426%
0%
100%
3DMark 06 3DMark 06 - Standard 1280x1024 +
Unigine Valley 1.0 - Unigine Valley 1.0 DX
34.1 fps (11%)
Blender - Blender 3.3 Classroom CUDA *
min: 51     avg: 85.7     median: 51 (8%)     max: 155 Seconds
Blender - Blender 3.3 Classroom OPTIX *
min: 25     avg: 26.3     median: 26 (10%)     max: 28 Seconds
SPECviewperf 13 specvp13 sw-04 +
SPECviewperf 13 - specvp13 sw-04
min: 173.89     avg: 181.1     median: 174.7 (47%)     max: 194.75 fps
specvp13 snx-03 +
SPECviewperf 13 - specvp13 snx-03
min: 315.35     avg: 333.9     median: 330 (37%)     max: 356.29 fps
specvp13 showcase-02 +
SPECviewperf 13 - specvp13 showcase-02
min: 79.97     avg: 85.9     median: 82.8 (18%)     max: 95.04 fps
specvp13 medical-02 +
SPECviewperf 13 - specvp13 medical-02
min: 103.3     avg: 126.4     median: 110.7 (23%)     max: 165.27 fps
specvp13 maya-05 +
SPECviewperf 13 - specvp13 maya-05
min: 271.86     avg: 280.7     median: 276.7 (31%)     max: 293.61 fps
specvp13 energy-02 +
SPECviewperf 13 - specvp13 energy-02
min: 46.29     avg: 48.4     median: 49.4 (16%)     max: 49.58 fps
specvp13 creo-02 +
SPECviewperf 13 - specvp13 creo-02
min: 249.3     avg: 258.6     median: 261.4 (38%)     max: 265.15 fps
specvp13 catia-05 +
SPECviewperf 13 - specvp13 catia-05
min: 257.86     avg: 293.4     median: 309.5 (34%)     max: 312.95 fps
specvp13 3dsmax-06 +
SPECviewperf 13 - specvp13 3dsmax-06
min: 155.94     avg: 179.7     median: 182.5 (32%)     max: 200.54 fps
SPECviewperf 2020 specvp2020 solidworks-05 1080p +
SPECviewperf 2020 - specvp2020 solidworks-05 1080p
min: 191.93     avg: 205.4     median: 198.6 (39%)     max: 225.76 fps
specvp2020 snx-04 1080p +
SPECviewperf 2020 - specvp2020 snx-04 1080p
min: 315.31     avg: 341.5     median: 327.9 (53%)     max: 381.32 fps
specvp2020 medical-03 1080p +
SPECviewperf 2020 - specvp2020 medical-03 1080p
min: 50.48     avg: 66.6     median: 57.2 (59%)     max: 92.01 fps
specvp2020 maya-06 1080p +
SPECviewperf 2020 - specvp2020 maya-06 1080p
min: 309.59     avg: 331.5     median: 329.5 (48%)     max: 355.25 fps
specvp2020 energy-03 1080p +
SPECviewperf 2020 - specvp2020 energy-03 1080p
min: 46.5     avg: 50.2     median: 49.7 (40%)     max: 54.54 fps
specvp2020 creo-03 1080p +
SPECviewperf 2020 - specvp2020 creo-03 1080p
min: 96.6     avg: 118.7     median: 121.7 (60%)     max: 137.93 fps
specvp2020 catia-06 1080p +
SPECviewperf 2020 - specvp2020 catia-06 1080p
min: 81.59     avg: 85.6     median: 84 (54%)     max: 91.24 fps
specvp2020 3dsmax-07 1080p +
SPECviewperf 2020 - specvp2020 3dsmax-07 1080p
min: 73.7     avg: 84.5     median: 84.6 (38%)     max: 95.09 fps
specvp2020 solidworks-05 4k +
specvp2020 snx-04 4k +
SPECviewperf 2020 - specvp2020 snx-04 4k
148.1 fps (15%)
specvp2020 medical-03 4k +
specvp2020 maya-06 4k +
SPECviewperf 2020 - specvp2020 maya-06 4k
114 fps (19%)
specvp2020 energy-03 4k +
specvp2020 creo-03 4k +
specvp2020 catia-06 4k +
specvp2020 3dsmax-07 4k +
SPECviewperf 2020 - specvp2020 3dsmax-07 4k
46.8 fps (20%)
Cinebench R15
Cinebench R15 OpenGL 64 Bit +
Cinebench R15 - Cinebench R15 OpenGL 64 Bit
min: 223     avg: 290.3     median: 295 (17%)     max: 353 fps
Cinebench R15 OpenGL Ref. Match 64 Bit +
Cinebench R15 - Cinebench R15 OpenGL Ref. Match 64 Bit
99.6 % (100%)
GFXBench - GFXBench 5.0 4K Aztec Ruins High Tier Offscreen
27 fps (11%)
GFXBench - GFXBench 5.0 Aztec Ruins High Tier Offscreen
61.4 fps (11%)
3.3 -95%
...
44.4 -28%
44.86 -27%
45 -27%
NVIDIA GeForce GTX 1050 Max-Q
48.1 -22%
48.6 -21%
AMD Radeon 680M
49.2 -20%
NVIDIA GeForce GTX 1050 Ti Max-Q
49.5 -19%
AMD Radeon RX 560X (Laptop)
52.4 -15%
58.3 -5%
NVIDIA RTX 2000 Ada Generation Laptop GPU
61.4
62.7 2%
62.7 2%
62.8 2%
63.8 4%
NVIDIA Quadro T2000 Max-Q
64.8 6%
65.5 7%
Apple M1 7-Core GPU
72.4 18%
Apple M1 8-Core GPU
74.3 21%
78.8 28%
...
536 773%
0%
100%
GFXBench - GFXBench 5.0 Aztec Ruins Normal Tier Offscreen
162.8 fps (12%)
GFXBench - GFXBench Car Chase Offscreen
145.2 fps (16%)
GFXBench 3.1 - GFXBench Manhattan ES 3.1 Offscreen
193.4 fps (4%)
GFXBench 3.0 - GFXBench 3.0 Manhattan Offscreen
304.1 fps (18%)
GFXBench (DX / GLBenchmark) 2.7
GFXBench T-Rex HD Offscreen C24Z16 +
GFXBench (DX / GLBenchmark) 2.7 - GFXBench T-Rex HD Offscreen C24Z16
599 fps (5%)
Basemark GPU 1.2 - Basemark GPU 1.2 Vulkan Official Medium Offscreen 1080
min: 104.6     avg: 196.8     median: 196.8 (1%)     max: 289 fps
Basemark GPU 1.2 - Basemark GPU 1.2 Vulkan Official High Offscreen 2160
3.6 fps (1%)
Geekbench 6.2 - Geekbench 6.2 GPU OpenCL
min: 75472     avg: 76342     median: 76342 (22%)     max: 77212 points
Geekbench 6.2 - Geekbench 6.2 GPU Vulkan
min: 19217     avg: 46136     median: 46136 (15%)     max: 73055 points
LuxMark v2.0 64Bit - LuxMark v2.0 Room GPU
2981 Samples/s (13%)
LuxMark v2.0 64Bit - LuxMark v2.0 Sala GPU
6323 Samples/s (11%)
ComputeMark v2.1 - ComputeMark v2.1 Result
14884 points (16%)
Power Consumption - Furmark Stress Test Power Consumption - external Monitor *
min: 75.1     avg: 94.2     median: 87.9 (12%)     max: 119.5 Watt
0102030405060708090100110120Tooltip
Power Consumption - The Witcher 3 Power Consumption - external Monitor *
min: 84.4     avg: 109.1     median: 101.5 (14%)     max: 141.5 Watt
0102030405060708090100110120130140Tooltip
Power Consumption - Witcher 3 Power Consumption *
min: 87.9     avg: 112.5     median: 104.7 (23%)     max: 144.9 Watt
0102030405060708090100110120130140150160Tooltip
Power Consumption - Witcher 3 ultra Power Efficiency - external Monitor
0.8 fps per Watt (65%)
Emissions Witcher 3 Fan Noise +
Emissions - Witcher 3 Fan Noise
min: 40.7     avg: 44.9     median: 43.3 (69%)     max: 50.6 dB(A)
- Range of benchmark values for this graphics card
- Average benchmark values for this graphics card
* Smaller numbers mean a higher performance

Game Benchmarks

The following benchmarks stem from our benchmarks of review laptops. The performance depends on the used graphics memory, clock rate, processor, system settings, drivers, and operating systems. So the results don't have to be representative for all laptops with this GPU. For detailed information on the benchmark results, click on the fps number.

Assassin's Creed Mirage

Assassin's Creed Mirage

2023
low 1920x1080
113  fps    + Compare
med. 1920x1080
103  fps    + Compare
high 1920x1080
97  fps    + Compare
ultra 1920x1080
76  fps    + Compare
QHD 2560x1440
58  fps    + Compare
» With all tested laptops playable in detail settings ultra.
Cyberpunk 2077 2.0 Phantom Liberty

Cyberpunk 2077 2.0 Phantom Liberty

2023
low 1920x1080
85.4  fps    + Compare
med. 1920x1080
64.5  fps    + Compare
high 1920x1080
55.2  fps    + Compare
ultra 1920x1080
48.3  fps    + Compare
QHD 2560x1440
29.9  fps    + Compare
» With all tested laptops playable in detail settings ultra.
Additional Benchmarks
Low Preset (FSR off) 1280x720
134.1
Ray Tracing Ultra Preset (DLSS off) 1920x1080
21.6
Ultra Preset (FSR on) 1920x1080
60.6
F1 23

F1 23

2023
low 1920x1080
201 202 ~ 202 fps    + Compare
med. 1920x1080
191.1 192.1 ~ 192 fps    + Compare
high 1920x1080
142.1 147 ~ 145 fps    + Compare
ultra 1920x1080
44.4 49.2 ~ 47 fps    + Compare
QHD 2560x1440
27.6 31.6 ~ 30 fps    + Compare
» With all tested laptops playable in detail settings ultra.
Additional Benchmarks
Ultra Low Preset TAA 1280x720
241
low 1920x1080
49  fps    + Compare
med. 1920x1080
45  fps    + Compare
high 1920x1080
42  fps    + Compare
ultra 1920x1080
40  fps    + Compare
QHD 2560x1440
27  fps    + Compare
» With all tested laptops playable in detail settings ultra.
low 1920x1080
101  fps    + Compare
med. 1920x1080
80  fps    + Compare
high 1920x1080
64  fps    + Compare
ultra 1920x1080
53  fps    + Compare
QHD 2560x1440
38  fps    + Compare
» With all tested laptops playable in detail settings ultra.
F1 22

F1 22

2022
low 1920x1080
166.7 213 ~ 190 fps    + Compare
med. 1920x1080
151.8 193.2 ~ 173 fps    + Compare
high 1920x1080
119.9 138.5 ~ 129 fps    + Compare
ultra 1920x1080
44.2 52.8 ~ 49 fps    + Compare
QHD 2560x1440
28.9 34.2 ~ 32 fps    + Compare
» With all tested laptops playable in detail settings ultra.
Additional Benchmarks
Ultra Low Preset 16xAF TAA 1280x720
259
low 1920x1080
119.8  fps    + Compare
med. 1920x1080
110.5  fps    + Compare
high 1920x1080
77.3  fps    + Compare
ultra 1920x1080
62.3  fps    + Compare
QHD 2560x1440
43.5  fps    + Compare
» With all tested laptops playable in detail settings ultra.
low 1920x1080
101  fps    + Compare
med. 1920x1080
81  fps    + Compare
high 1920x1080
72  fps    + Compare
ultra 1920x1080
65  fps    + Compare
QHD 2560x1440
41  fps    + Compare
» With all tested laptops playable in detail settings ultra.
Far Cry 6

Far Cry 6

2021
low 1280x720
157  fps    + Compare
med. 1920x1080
121  fps    + Compare
high 1920x1080
104  fps    + Compare
ultra 1920x1080
87  fps    + Compare
QHD 2560x1440
63  fps    + Compare
» With all tested laptops playable in detail settings ultra.
F1 2021

F1 2021

2021
low 1280x720
353  fps    + Compare
med. 1920x1080
230  fps    + Compare
high 1920x1080
186.6  fps    + Compare
ultra 1920x1080
99.2  fps    + Compare
QHD 2560x1440
74.9  fps    + Compare
» With all tested laptops playable in detail settings ultra.
Strange Brigade

Strange Brigade

2018
low 1280x720
332 408 459 ~ 400 fps    + Compare
med. 1920x1080
183 228 231 ~ 214 fps    + Compare
high 1920x1080
148.4 182.5 184.2 ~ 172 fps    + Compare
ultra 1920x1080
132.5 158.2 158.4 ~ 150 fps    + Compare
QHD 2560x1440
94.1 103.9 107.5 ~ 102 fps    + Compare
» With all tested laptops playable in detail settings ultra.
Far Cry 5

Far Cry 5

2018
low 1280x720
151 175 ~ 163 fps    + Compare + 📈 Graph
med. 1920x1080
110 130 ~ 120 fps    + Compare + 📈 Graph
high 1920x1080
102 120 ~ 111 fps    + Compare + 📈 Graph
ultra 1920x1080
95 113 ~ 104 fps    + Compare + 📈 Graph
QHD 2560x1440
63 81 ~ 72 fps    + Compare + 📈 Graph
» With all tested laptops playable in detail settings ultra.
low 1280x720
80.6 149.2 156.5 ~ 129 fps    + Compare
med. 1920x1080
73 131.6 133.5 ~ 113 fps    + Compare
high 1920x1080
52.5 103.4 108.9 ~ 88 fps    + Compare
» With all tested laptops playable in detail settings high.
low 1280x720
173.3 199.2 ~ 186 fps    + Compare
med. 1920x1080
93.5 111.2 120.3 ~ 108 fps    + Compare
high 1920x1080
67.7 83.5 84.2 ~ 78 fps    + Compare
QHD 2560x1440
50.3 61.3 63.7 ~ 58 fps    + Compare
» With all tested laptops playable in detail settings high.
low 1280x720
155 178.4 188.2 ~ 174 fps    + Compare
med. 1366x768
140.8 153.1 168.7 ~ 154 fps    + Compare
high 1920x1080
136.9 143.9 160.7 ~ 147 fps    + Compare
ultra 1920x1080
132 133.4 150.2 ~ 139 fps    + Compare
» With all tested laptops playable in detail settings ultra.
low 1024x768
336.4 390 424 ~ 383 fps    + Compare
med. 1366x768
219 261 291 ~ 257 fps    + Compare
high 1920x1080
127.9 164 184.5 ~ 159 fps    + Compare
ultra 1920x1080
65.5 79.6 95.6 ~ 80 fps    + Compare + 📈 Graph
QHD 2560x1440
65  fps    + Compare
» With all tested laptops playable in detail settings ultra.
GTA V

GTA V

2015
low 1024x768
176.3 178.1 185.2 ~ 180 fps    + Compare
med. 1366x768
170.6 173.4 181.3 ~ 175 fps    + Compare
high 1920x1080
157.7 163.6 171.9 173 ~ 167 fps    + Compare
ultra 1920x1080
86.2 98 101.6 ~ 95 fps    + Compare
QHD 2560x1440
60.6 69 74.6 76.8 ~ 70 fps    + Compare
» With all tested laptops playable in detail settings ultra.
Additional Benchmarks
Normal/Off 4xAF 1920x1080
171.6
180.7
172.3
Lowest Settings possible 1920x1080
176.9
178.6
lowmed.highultraQHD4K
Assassin's Creed Mirage113103977658
Cyberpunk 2077 2.0 Phantom Liberty85.464.555.248.329.9
F1 232021921454730
Star Wars Jedi Survivor4945424027
Hogwarts Legacy10180645338
F1 221901731294932
Tiny Tina's Wonderlands119.8110.577.362.343.5
Cyberpunk 2077 1.610181726541
Far Cry 61571211048763
F1 2021353230186.699.274.9
Strange Brigade400214172150102
Far Cry 516312011110472
X-Plane 11.1112911388
Final Fantasy XV Benchmark1861087858
Dota 2 Reborn174154147139
The Witcher 33832571598065
GTA V1801751679570
< 30 fps
< 60 fps
< 120 fps
≥ 120 fps

1
5
11

1
7
9

2
8
7

5
8
2
2
7
6


For more games that might be playable and a list of all games and graphics cards visit our Gaming List

v1.26
log 25. 14:31:09

#0 no ids found in url (should be separated by "_") +0s ... 0s

#1 not redirecting to Ajax server +0s ... 0s

#2 did not recreate cache, as it is less than 5 days old! Created at Thu, 25 Apr 2024 05:40:10 +0200 +0.001s ... 0.001s

#3 no comparison url found in template nbc.compare_page_1 needed +0.035s ... 0.036s

#4 no comparison url found in template nbc.compare_page_1 needed +0s ... 0.036s

#5 no comparison url found in template nbc.compare_page_1 needed +0s ... 0.037s

#6 no comparison url found in template nbc.compare_page_1 needed +0s ... 0.037s

#7 no comparison url found in template nbc.compare_page_1 needed +0s ... 0.037s

#8 no comparison url found in template nbc.compare_page_1 needed +0s ... 0.037s

#9 composed specs +0.001s ... 0.039s

#10 did output specs +0s ... 0.039s

#11 start showIntegratedCPUs +0s ... 0.039s

#12 getting avg benchmarks for device 11601 +0.013s ... 0.052s

#13 got single benchmarks 11601 +0.019s ... 0.07s

#14 got avg benchmarks for devices +0s ... 0.07s

#15 min, max, avg, median took s +0.87s ... 0.941s

#16 before gaming benchmark output +0s ... 0.941s

#17 Got 147 rows for game benchmarks. +0.068s ... 1.009s

#18 composed SQL query for gamebenchmarks +0s ... 1.009s

#19 got data and put it in $dataArray +0.015s ... 1.024s

#20 benchmarks composed for output. +0.795s ... 1.819s

#21 no comparison url found in template nbc.compare_page_1 needed +0.004s ... 1.823s

#22 return log +0s ... 1.823s

Notebook reviews with NVIDIA RTX 2000 Ada Generation Laptop GPU graphics card

联想 ThinkPad P16 G2 笔记本电脑评测:改进后的 165 Hz 屏幕和 Nvidia RTX 2000 Ada

联想 ThinkPad P16 G2 笔记本电脑评测:改进后的 165 Hz 屏幕和 Nvidia RTX 2000 Ada

联想 ThinkPad P16 的第二代产品继承了第一代产品的优势。ThinkPad P16 G2 增加了 165 Hz 快速屏幕、NvidiaGeForce RTX 2000 Ada 以及 Intel Raptor Lake HX,使其成为工作站领域的有力竞争者。...
Intel Core i7-13700HX | NVIDIA RTX 2000 Ada Generation Laptop GPU | 16.00" | 3 kg
惠普 ZBook Power 15 G10 工作站评测:ThinkPad P15v 的绝佳替代品

惠普 ZBook Power 15 G10 工作站评测:ThinkPad P15v 的绝佳替代品

ZBook Power 15 G10 是少数同时配备 AMD Zen 4 Pro CPU 和 Nvidia RTX Ada GPU 的 15.6 英寸工作站之一。如果你不介意错过 4K、OLED、ECC 内存和 16 英寸屏幕尺寸,那么 ZBook Power 15 G10 应该是一款值得信赖的经典产品。...
AMD Ryzen 7 PRO 7840HS | NVIDIA RTX 2000 Ada Generation Laptop GPU | 15.60" | 2 kg
联想 ThinkPad P1 G6 笔记本电脑评测--取代 ThinkPad X1 Extreme 的移动工作站

联想 ThinkPad P1 G6 笔记本电脑评测--取代 ThinkPad X1 Extreme 的移动工作站

联想不再提供 ThinkPad X1 Extreme。取而代之的是结构完全相同的 ThinkPad P1 Gen 6,作为一款功能强大的多媒体计算机或移动工作站,ThinkPad P1 Gen 6 从此接过了任务。我们测试了配备专业 Nvidia RTX 2000 GPU 和刷新率为 165 Hz 的雾面 IPS 面板...
Intel Core i9-13900H | NVIDIA RTX 2000 Ada Generation Laptop GPU | 16.00" | 1.9 kg

HP ZBook Power 15 G10, PRO 7940HS: AMD Ryzen 9 PRO 7940HS, 15.60", 2 kg
  External Review » HP ZBook Power 15 G10, PRO 7940HS

Lenovo ThinkPad P1 G6-21FV000DGE: Intel Core i9-13900H, 16.00", 1.9 kg
  External Review » Lenovo ThinkPad P1 G6-21FV000DGE

Please share our article, every link counts!

» Comparison of GPUs
Detailed list of all laptop GPUs sorted by class and performance.

» Benchmark List
Sort and restrict laptop GPUs based on performance in synthetic benchmarks.

» Notebook Gaming List
Playable games for each graphics card and their average FPS results.

Class 1

GeForce RTX 2080 Super Mobile

Class 2

M1 Max 32-Core GPU *
GeForce RTX 2070 Super Mobile
M1 Max 24-Core GPU *
Quadro RTX 5000 Max-Q
Radeon RX 5700M *
GeForce GTX 1080 Mobile
Quadro RTX 4000 (Laptop)
M1 Pro 16-Core GPU *
Radeon PRO W6600M *
GeForce RTX 2070 Super Max-Q
Quadro RTX 4000 Max-Q *
M1 Pro 14-Core GPU *
Quadro P5200
Quadro RTX 3000 Max-Q *
Quadro P4200
Quadro P5000 Max-Q *
GeForce GTX 980 (Laptop)
Quadro P4000
Quadro P4000 Max-Q
Quadro P3200
Radeon RX 580X (Laptop) *
Radeon RX 580 (Laptop)
Radeon Pro 5300M
Radeon RX 5300M
Quadro P3000 Max-Q *
Quadro T2000 Max-Q *
Radeon Pro WX 7100 *
Radeon RX 570X (Laptop) *
Radeon RX 570 (Laptop) *
Radeon RX 470 (Laptop) *
Quadro T1000 Max-Q *

Class 3

Vega M GH
Quadro M5000M
GeForce GTX 1050 Ti Mobile
Radeon 680M
Quadro P2000
Quadro P2000 Max-Q
Quadro M4000M
T500 Laptop GPU *
Radeon R9 M395X
GeForce GTX 1050 Ti Max-Q *
Radeon Pro Vega 16
WX Vega M GL
Radeon R9 M485X
Quadro M3000M
FirePro W7170M
Radeon R9 M395
GeForce GTX 1050 Max-Q *
Radeon 660M
Radeon Pro WX 4150 *
Radeon RX 560X (Laptop)
Radeon RX 560 (Laptop)
Radeon RX 460 (Laptop)
Quadro P1000
Radeon R9 M390
Xe MAX
Radeon Pro 560X
Radeon Pro 560
Radeon Pro 460
Radeon Pro WX 4130 *
GeForce GTX 960M
Quadro P620 *
Radeon RX 550X (Laptop)
Radeon Pro WX 3200 *
Radeon Pro 555X
Radeon Pro 555
Radeon Pro 455
Quadro P600
Quadro M2000M
Radeon RX 540X *
Radeon Pro WX 2100 *
Radeon Pro WX 3100 *
GeForce GTX 950M
Radeon Pro 450
Radeon 630
Radeon 540X *
Radeon R9 M385X
Quadro P520
Quadro M1000M
GeForce 945M
Quadro P500 *
Iris Plus Graphics G7 (Ice Lake 64 EU) *
Vega 10 *
Iris Pro Graphics 580
FirePro W5170M *
Radeon R9 M370X
Vega 9
FirePro W5130M
UHD Graphics Xe G4 48EUs *
UHD Graphics 32EUs
UHD Graphics Xe 32EUs (Tiger Lake-H) *
UHD Graphics 750
Vega 7
Radeon R7 M465
Iris Pro Graphics 6200
Vega 8
GeForce 940M
Iris Plus Graphics G4 (Ice Lake 48 EU)
Quadro M600M
FirePro W4190M
Radeon R9 M375
Radeon R7 M445
Iris Plus Graphics 650
Iris Graphics 550
Radeon 625
Vega 6 *
Iris Plus Graphics 640
Iris Graphics 540
UHD Graphics 24EUs (Alder Lake-N) *
Radeon R7 M360
GeForce 920M
Radeon 620
Radeon R7 M340
Radeon 610
Radeon 610M *
Vega 6 *
UHD Graphics G1 (Ice Lake 32 EU)
UHD Graphics Xe 16EUs (Tiger Lake-H) *
HD Graphics 530
Radeon R5 (Bristol Ridge)
Adreno 690 *
Adreno 685 *
Adreno 680 *
Radeon R5 M330
GeForce 910M
HD Graphics 520

Class 4

UHD Graphics 730
Radeon R5 M320 *
Radeon R5 M315 *
Radeon R5 M420 *
Vega 2 *
Xclipse 530
UHD Graphics 617
UHD Graphics 615
HD Graphics 515
UHD Graphics 610
HD Graphics 510
UHD Graphics 605
Radeon R4 (Stoney Ridge)
Radeon R2 (Stoney Ridge)
HD Graphics (Broadwell)
UHD Graphics 600
HD Graphics (Braswell)

Class 5

* Approximate position of the graphics adapter

> Notebookcheck中文版(NBC中国) > FAQ / 小提示/ 技术参数 > 移动显示芯片——基准测试成绩列表 > NVIDIA NVIDIA RTX 2000 Ada Generation Laptop GPU
Klaus Hinum (Update: 2023-11-23)