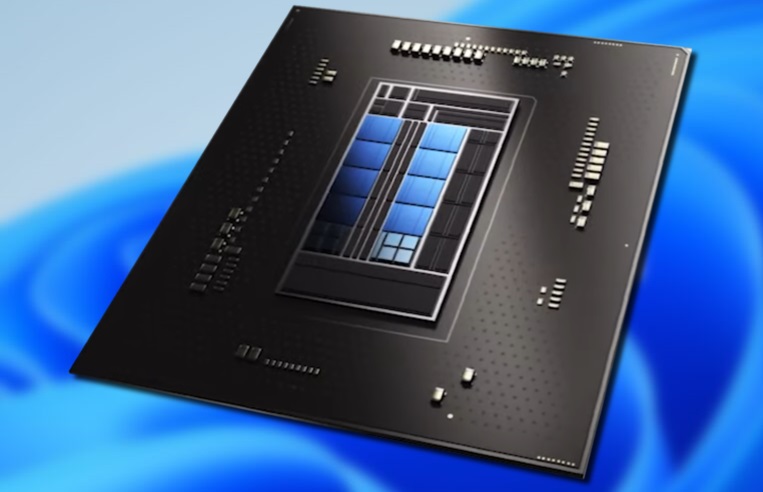
UHD Graphics 770是Alder Lake SoC中的集成显卡(IGP,GT1),提供32个执行单元(EUs)和高达1.55 GHz的时钟速度(取决于CPU型号)。
性能取决于它所集成的CPU型号和使用的内存。游戏性能即使在快速模型上也只适合于720p和低细节设置的低要求游戏。更高要求的游戏,如《赛博朋克2077》或《毁灭之光2》(见下面的基准测试)在我们的测试中运行得并不好。
Gen. 12 / xG Series UHD Graphics 770 32/ cores @ 0.3 - 1.55 GHz UHD Graphics 750
Codename Alder Lake xG Architecture Alder Lake iGPU Integrated Graphics Pipelines 32 / Pixel- / Vertexshader TMUs 16 ROPs 8 Core Speed 300 - 1550 (Boost) MHz Shared Memory yes API DirectX 12.1, OpenGL 4.6, OpenCL 3.0, Vulkan 1.4 Power Consumption 15 Watt Man. Technology 10 nm Date of Announcement 04.01.2022
Performance Rating - 3DMark 11 + Fire Strike + Time Spy
AMD Radeon HD 8180
...
NVIDIA GeForce 845M
AMD Radeon RX Vega 8 (Ryzen 2000/3000)
AMD Radeon R9 M370X
NVIDIA Quadro M600M
Intel UHD Graphics Xe G4 48EUs
NVIDIA GeForce GTX 765M
Intel UHD Graphics Xe 32EUs (Tiger Lake-H)
AMD Radeon Pro WX 3100
Intel Iris Plus Graphics G7 (Ice Lake 64 EU)
AMD Radeon RX Vega 9
AMD Radeon RX Vega 6 (Ryzen 4000/5000)
NVIDIA Quadro K3100M
NVIDIA GeForce 945M
AMD FirePro W5170M
...
max:
3DMark - 3DMark Steel Nomad
min: 63 avg: 67.5 median: 67.5 (0%) max: 72 Points
Intel UHD Graphics 24EUs (Alder Lake-N)
AMD Radeon 610M
AMD Radeon RX Vega 7
AMD Radeon 660M
...
NVIDIA RTX PRO 5000 Blackwell Generation Laptop
max:
NVIDIA GeForce RTX 5090
3DMark - 3DMark Steel Nomad Light
min: 485 avg: 519 median: 519 (1%) max: 553 Points
Intel UHD Graphics 605
Intel UHD Graphics 24EUs (Alder Lake-N)
Intel UHD Graphics G1 (Ice Lake 32 EU)
AMD Radeon 610M
Intel UHD Graphics Xe G4 48EUs
...
max:
3DMark - 3DMark Wild Life Unlimited
Intel UHD Graphics 605
...
Intel UHD Graphics G1 (Ice Lake 32 EU)
Intel Iris Graphics 550
AMD Radeon RX Vega 8 (Ryzen 2000/3000)
AMD Radeon RX Vega 10
AMD Radeon RX Vega 6 (Ryzen 4000/5000)
AMD Radeon RX Vega 7
Intel UHD Graphics Xe G4 48EUs
AMD Radeon 660M
AMD Radeon RX 560X (Laptop)
Intel Arc Graphics 130T
...
max:
3DMark - 3DMark Wild Life Extreme Unlimited
Intel UHD Graphics 605
Intel UHD Graphics 615
Intel UHD Graphics Xe 750 32EUs (Rocket Lake)
Intel UHD Graphics G1 (Ice Lake 32 EU)
Intel Iris Graphics 550
AMD Radeon RX Vega 7
Intel UHD Graphics Xe G4 48EUs
Qualcomm Adreno 690
...
max:
3DMark - 3DMark Fire Strike Standard Score
min: 2163 avg: 2518 median: 2494.5 (4%) max: 2790 Points
...
NVIDIA Quadro M600M
Intel UHD Graphics Xe 32EUs (Tiger Lake-H)
Intel Iris Plus Graphics G7 (Ice Lake 64 EU)
AMD Radeon RX Vega 6 (Ryzen 4000/5000)
AMD Radeon 540X
NVIDIA GeForce GTX 765M
AMD Radeon Pro WX 3100
NVIDIA GeForce 945M
AMD Radeon RX Vega 9
NVIDIA Quadro K3100M
AMD FirePro W5170M
Qualcomm Adreno 690
AMD Radeon Pro WX 3200
AMD Radeon RX Vega 7
...
max:
3DMark - 3DMark Fire Strike Standard Graphics
min: 2363 avg: 2664 median: 2655 (2%) max: 2900 Points
AMD Radeon HD 8180
...
AMD Radeon R9 M370X
NVIDIA Quadro M600M
NVIDIA GeForce GTX 765M
Intel UHD Graphics Xe 32EUs (Tiger Lake-H)
Intel UHD Graphics Xe G4 48EUs
Intel Iris Plus Graphics G7 (Ice Lake 64 EU)
AMD Radeon Pro WX 3100
AMD Radeon RX Vega 6 (Ryzen 4000/5000)
NVIDIA Quadro K3100M
AMD Radeon 540X
AMD Radeon RX Vega 9
NVIDIA GeForce 945M
AMD FirePro W5170M
...
max:
3DMark - 3DMark Ice Storm Graphics
min: 58760 avg: 76751 median: 78188 (9%) max: 89577 Points
Intel Graphics Media Accelerator (GMA) 4500MHD
...
NVIDIA Quadro M600M
Intel UHD Graphics Xe G4 48EUs
AMD Radeon R7 M275DX
Intel Iris Plus Graphics G4 (Ice Lake 48 EU)
AMD Radeon RX 460 (Laptop)
NVIDIA Quadro K2100M
AMD Radeon Pro WX 3200
Intel HD Graphics 5600
NVIDIA Quadro P1000
...
max:
NVIDIA GeForce RTX 5090
3DMark - 3DMark Time Spy Score
min: 768 avg: 863 median: 856 (2%) max: 930 Points
Intel UHD Graphics 600
...
NVIDIA Quadro M600M
Intel Iris Plus Graphics G4 (Ice Lake 48 EU)
AMD Radeon RX Vega 8 (Ryzen 2000/3000)
Intel UHD Graphics Xe 32EUs (Tiger Lake-H)
AMD Radeon RX Vega 10
Intel Iris Plus Graphics G7 (Ice Lake 64 EU)
Qualcomm Adreno 690
AMD Radeon Pro WX 3100
Intel UHD Graphics Xe G4 48EUs
AMD Radeon 540X
AMD Radeon RX Vega 6 (Ryzen 4000/5000)
AMD Radeon RX Vega 9
...
NVIDIA RTX PRO 5000 Blackwell Generation Laptop
max:
NVIDIA GeForce RTX 5090
3DMark - 3DMark Time Spy Graphics
min: 666 avg: 744 median: 738 (2%) max: 798 Points
Intel UHD Graphics 600
...
NVIDIA Quadro M600M
Intel Iris Plus Graphics G4 (Ice Lake 48 EU)
Intel UHD Graphics Xe 32EUs (Tiger Lake-H)
AMD Radeon RX Vega 8 (Ryzen 2000/3000)
AMD Radeon RX Vega 10
AMD Radeon 540X
Qualcomm Adreno 690
Intel UHD Graphics Xe G4 48EUs
AMD Radeon Pro WX 3100
AMD Radeon RX Vega 6 (Ryzen 4000/5000)
...
NVIDIA RTX PRO 5000 Blackwell Generation Laptop
max:
NVIDIA GeForce RTX 5090
3DMark - 3DMark Ice Storm Unlimited Graphics
min: 116280 avg: 139293 median: 119185 (12%) max: 179804 Points
NVIDIA Quadro K5100M
...
Intel Iris Graphics 540
AMD Radeon R7 M445
AMD Radeon RX Vega 9
Intel Iris Graphics 550
Intel Iris Plus Graphics G7 (Ice Lake 64 EU)
NVIDIA Quadro P520
Intel Iris Plus Graphics 640
AMD Radeon 610M
...
3DMark - 3DMark Ice Storm Extreme Graphics
min: 46258 avg: 54274 median: 52927 (6%) max: 61769 Points
Intel HD Graphics (Bay Trail)
...
NVIDIA Quadro RTX 5000 Max-Q
AMD Radeon R8 M365DX
Intel Iris Plus Graphics G4 (Ice Lake 48 EU)
Intel UHD Graphics Xe G4 48EUs
Intel Iris Plus Graphics G7 (Ice Lake 64 EU)
AMD Radeon HD 8790M
AMD Radeon RX 560X (Laptop)
Intel UHD Graphics Xe 32EUs (Tiger Lake-H)
Intel Iris Graphics 540
Intel HD Graphics 630
...
max:
NVIDIA GeForce RTX 5080
3DMark - 3DMark Cloud Gate Score
min: 14271 avg: 16270 median: 16618 (16%) max: 17404 Points
Intel Graphics Media Accelerator (GMA) 4500MHD
...
AMD Radeon Pro 555
Intel UHD Graphics Xe 32EUs (Tiger Lake-H)
AMD Radeon RX Vega 6 (Ryzen 4000/5000)
AMD Radeon Pro 455
NVIDIA Quadro M1000M
NVIDIA T500 Laptop GPU
AMD Radeon R9 M395
AMD Radeon Pro 460
AMD Radeon R9 M290X
NVIDIA GeForce GTX 1050 Max-Q
...
max:
NVIDIA GeForce RTX 5090
3DMark - 3DMark Cloud Gate Graphics
min: 14455 avg: 16122 median: 16443 (4%) max: 16983 Points
Intel Graphics Media Accelerator (GMA) 4500MHD
...
AMD Radeon 540X
AMD Radeon RX Vega 8 (Ryzen 2000/3000)
Intel Iris Pro Graphics 6200
AMD Radeon R9 M370X
Intel Iris Plus Graphics G7 (Ice Lake 64 EU)
Intel UHD Graphics Xe 32EUs (Tiger Lake-H)
NVIDIA GeForce GTX 760M
Intel UHD Graphics Xe G4 48EUs
Qualcomm Adreno 690
AMD FirePro M5100
AMD Radeon RX Vega 6 (Ryzen 2000/3000)
NVIDIA GeForce GTX 765M
NVIDIA Quadro M600M
AMD Radeon Pro WX 3100
...
max:
NVIDIA GeForce RTX 5090
3DMark - 3DMark Night Raid
Intel UHD Graphics 600
...
Intel UHD Graphics Xe G4 48EUs
AMD Radeon RX Vega 10
Intel Iris Plus Graphics G7 (Ice Lake 64 EU)
Intel Iris Plus Graphics G4 (Ice Lake 48 EU)
AMD Radeon 610M
AMD Radeon RX Vega 6 (Ryzen 4000/5000)
AMD Radeon RX Vega 7
Intel Iris Xe MAX Graphics
AMD Radeon 660M
...
max:
3DMark - 3DMark Night Raid Graphics Score
Intel UHD Graphics 600
...
Intel Iris Plus Graphics G4 (Ice Lake 48 EU)
Intel Iris Plus Graphics G7 (Ice Lake 64 EU)
AMD Radeon 610M
AMD Radeon RX Vega 10
Intel UHD Graphics Xe G4 48EUs
Intel UHD Graphics Xe 32EUs (Tiger Lake-H)
AMD Radeon RX Vega 6 (Ryzen 4000/5000)
AMD Radeon RX Vega 7
AMD Radeon 660M
Intel Iris Xe MAX Graphics
...
max:
3DMark 11 - 3DM11 Performance Score
min: 3665 avg: 3969 median: 3957 (5%) max: 4181 Points
...
NVIDIA GeForce GTX 760M
Intel UHD Graphics Xe 32EUs (Tiger Lake-H)
Intel UHD Graphics Xe G4 48EUs
AMD Radeon R9 M280X
NVIDIA Quadro K3100M
AMD Radeon R9 M370X
AMD Radeon Pro WX 3100
NVIDIA GeForce GTX 765M
Intel Iris Plus Graphics G7 (Ice Lake 64 EU)
AMD Radeon 540X
...
NVIDIA RTX PRO 5000 Blackwell Generation Laptop
max:
NVIDIA GeForce RTX 5090
3DMark 11 - 3DM11 Performance GPU
min: 3268 avg: 3445 median: 3428 (3%) max: 3591 Points
...
Intel Iris Pro Graphics 580
NVIDIA GeForce 945M
AMD Radeon R9 M375
NVIDIA GeForce GTX 760M
AMD Radeon RX Vega 8 (Ryzen 2000/3000)
AMD Radeon RX Vega 10
AMD Radeon R7 M275DX
Intel UHD Graphics Xe G4 48EUs
NVIDIA Quadro K3100M
...
NVIDIA RTX PRO 5000 Blackwell Generation Laptop
max:
NVIDIA GeForce RTX 5090
3DMark Vantage + 3DMark Vantage - 3DM Vant. Perf. total
min: 12664 avg: 14563 median: 14821 (4%) max: 15865 Points
ATI Radeon HD 3200
...
NVIDIA GeForce GTX 760M
AMD Radeon Pro 450
Intel Iris Plus Graphics G7 (Ice Lake 64 EU)
AMD Radeon RX 550X (Laptop)
NVIDIA GeForce GTX 765M
NVIDIA Quadro K3100M
NVIDIA GeForce GTX 950M
NVIDIA Quadro P520
...
max:
NVIDIA T600
3DM Vant. Perf. GPU no PhysX + 3DMark Vantage - 3DM Vant. Perf. GPU no PhysX
min: 10089 avg: 11562 median: 11740 (6%) max: 12456 Points
ATI Radeon HD 3200
...
Intel UHD Graphics Xe 32EUs (Tiger Lake-H)
NVIDIA Quadro M600M
AMD Radeon RX Vega 9
AMD Radeon R9 M280X
NVIDIA GeForce GT 755M
AMD Radeon R9 M370X
NVIDIA GeForce GTX 760M
NVIDIA GeForce 945M
AMD Radeon Pro 450
Intel Iris Plus Graphics G7 (Ice Lake 64 EU)
...
max:
3DMark 05 - 3DMark 05 - Standard
min: 27996 avg: 31647 median: 32024.5 (35%) max: 34544 Points
Intel Graphics Media Accelerator (GMA) 500
...
Intel UHD Graphics Xe G4 48EUs
Intel UHD Graphics Xe 32EUs (Tiger Lake-H)
AMD Radeon 610M
AMD Radeon RX Vega 7
...
max:
3DMark 06 3DMark 06 - Standard 1280x1024 + 3DMark 06
min: 20029 avg: 21659 median: 21770 (28%) max: 23428 Points
Intel Graphics Media Accelerator (GMA) 500
...
NVIDIA GeForce GTX 950M
AMD Radeon RX Vega 7
AMD Radeon RX 550X (Laptop)
NVIDIA Quadro K3100M
Intel Iris Xe MAX Graphics
NVIDIA GeForce GTX 770M
NVIDIA Quadro P600
NVIDIA GeForce GTX 860M
...
max:
Unigine Valley 1.0 - Unigine Valley 1.0 DX
min: 6.8 avg: 8.9 median: 8.9 (3%) max: 11 fps
Intel UHD Graphics 600
...
AMD Radeon RX Vega 10
AMD FirePro W4190M
AMD Radeon RX Vega 6 (Ryzen 4000/5000)
AMD Radeon RX Vega 8 (Ryzen 2000/3000)
Intel Iris Plus Graphics G4 (Ice Lake 48 EU)
Intel UHD Graphics Xe 32EUs (Tiger Lake-H)
AMD Radeon 540X
AMD Radeon 610M
AMD Radeon Pro WX 3100
AMD Radeon RX Vega 7
AMD Radeon 660M
...
max:
Unigine Heaven 3.0 - Unigine Heaven 3.0 DX 11
Intel HD Graphics (Bay Trail)
...
AMD Radeon 540X
Intel Iris Plus Graphics G4 (Ice Lake 48 EU)
NVIDIA GeForce GTX 760M
AMD Radeon RX Vega 7
AMD Radeon RX 550X (Laptop)
NVIDIA GeForce GTX 765M
NVIDIA Quadro K3100M
AMD Radeon Pro 555
NVIDIA GeForce GTX 950M
...
Unigine Heaven 3.0 - Unigine Heaven 3.0 OpenGL
AMD Radeon HD 8250
...
NVIDIA GeForce GTX 765M
AMD Radeon RX Vega 7
Intel Iris Plus Graphics G4 (Ice Lake 48 EU)
NVIDIA GeForce GTX 950M
NVIDIA Quadro K3100M
Apple M1 7-Core GPU
NVIDIA GeForce GTX 770M
NVIDIA Quadro M2000M
NVIDIA Quadro M1000M
AMD FirePro M6100
AMD FirePro W7170M
...
Unigine Heaven 2.1 - Heaven 2.1 high
...
NVIDIA GeForce GTX 760M
AMD Radeon RX Vega 7
NVIDIA Quadro K3100M
AMD Radeon R9 M280X
NVIDIA GeForce GTX 765M
AMD Radeon RX 550X (Laptop)
NVIDIA GeForce GTX 950M
NVIDIA GeForce GT 750M SLI
AMD Radeon R9 M385X
...
SPECviewperf 12 + SPECviewperf 12 - specvp12 sw-03
min: 35.6 avg: 38.4 median: 38.4 (10%) max: 41.1 fps
...
NVIDIA Quadro K620M
NVIDIA Quadro P500
NVIDIA GeForce GTX 1050 Ti Mobile
AMD FirePro W4170M
Intel UHD Graphics Xe 32EUs (Tiger Lake-H)
AMD Radeon R9 M370X
AMD FirePro M5100
AMD Radeon Pro WX 3200
NVIDIA Quadro P520
...
max:
specvp12 snx-02 + SPECviewperf 12 - specvp12 snx-02
min: 3.2 avg: 3.3 median: 3.3 (0%) max: 3.45 fps
Intel Iris Xe MAX Graphics
...
Intel Iris Pro Graphics 5200
Intel HD Graphics 520
Intel UHD Graphics Xe 32EUs (Tiger Lake-H)
Intel UHD Graphics Xe 16EUs
...
max:
specvp12 showcase-01 + SPECviewperf 12 - specvp12 showcase-01
min: 8.53 avg: 10 median: 10 (2%) max: 11.5 fps
AMD FirePro M4100
...
AMD Radeon R7 M275DX
AMD FirePro W4190M
Intel Iris Graphics 540
Intel Iris Pro Graphics 5200
NVIDIA Quadro K1100M
NVIDIA Quadro K2100M
Intel UHD Graphics Xe 32EUs (Tiger Lake-H)
AMD Radeon RX Vega 10
NVIDIA Quadro P500
AMD FirePro W4170M
...
max:
NVIDIA GeForce RTX 5090
specvp12 mediacal-01 + SPECviewperf 12 - specvp12 mediacal-01
min: 4.98 avg: 5.1 median: 5.1 (1%) max: 5.18 fps
AMD FirePro M4100
...
AMD Radeon Pro WX 3100
Intel Iris Graphics 540
NVIDIA Quadro K2100M
AMD Radeon R7 M260X
Intel UHD Graphics Xe 32EUs (Tiger Lake-H)
AMD Radeon R7 M275DX
AMD FirePro W4190M
NVIDIA Quadro K1100M
NVIDIA GeForce 940M
AMD FirePro W4170M
AMD FirePro W5130M
AMD Radeon R9 M390
...
max:
specvp12 maya-04 + SPECviewperf 12 - specvp12 maya-04
min: 19.7 avg: 22.4 median: 22.4 (6%) max: 25.1 fps
NVIDIA GeForce 940M
...
NVIDIA GeForce GTX 960M
NVIDIA Quadro P520
AMD Radeon Pro WX 3200
AMD FirePro W5130M
NVIDIA Quadro M600M
NVIDIA GeForce GTX 950M
NVIDIA GeForce GTX 860M
AMD FirePro W4170M
Intel UHD Graphics Xe 32EUs (Tiger Lake-H)
AMD Radeon 610M
AMD Radeon R9 M370X
AMD FirePro M5100
...
max:
specvp12 energy-01 + SPECviewperf 12 - specvp12 energy-01
min: 0.19 avg: 0.2 median: 0.2 (0%) max: 0.2 fps
AMD Radeon R7 M260X
...
Intel Iris Pro Graphics 5200
Intel HD Graphics 4400
Intel UHD Graphics Xe 16EUs
Intel UHD Graphics 24EUs (Alder Lake-N)
AMD Radeon Pro 455
AMD Radeon HD 8550G
Intel Iris Graphics 540
Intel UHD Graphics Xe 32EUs (Tiger Lake-H)
NVIDIA Quadro K2100M
AMD Radeon R9 M390
AMD Radeon R7 M275DX
AMD Radeon Pro WX 3100
...
AMD Radeon 660M
max:
NVIDIA GeForce RTX 5090
specvp12 creo-01 + SPECviewperf 12 - specvp12 creo-01
min: 15.4 avg: 16.1 median: 16.1 (6%) max: 16.7 fps
...
AMD FirePro M4100
AMD Radeon R7 M260X
Intel UHD Graphics Xe 32EUs (Tiger Lake-H)
NVIDIA Quadro K1100M
AMD Radeon RX Vega 10
NVIDIA Quadro K620M
AMD FirePro W4190M
AMD Radeon Pro WX 3100
AMD FirePro W4170M
...
max:
specvp12 catia-04 + SPECviewperf 12 - specvp12 catia-04
min: 20.8 avg: 22.1 median: 22.1 (3%) max: 23.4 fps
...
AMD Radeon R7 M260X
AMD FirePro W4190M
NVIDIA Quadro K620M
AMD FirePro W4170M
NVIDIA Quadro K2100M
Intel UHD Graphics Xe 32EUs (Tiger Lake-H)
AMD FirePro W5130M
AMD FirePro M5100
AMD Radeon R9 M370X
NVIDIA Quadro P500
AMD Radeon 610M
...
max:
AMD Radeon RX 9070
specvp12 3dsmax-05 + SPECviewperf 12 - specvp12 3dsmax-05
min: 24.7 avg: 27.3 median: 27.3 (4%) max: 29.8 fps
AMD FirePro W4190M
...
AMD Radeon RX Vega 10
NVIDIA Quadro P520
AMD Radeon Pro 455
AMD Radeon Pro 555
Intel UHD Graphics Xe 32EUs (Tiger Lake-H)
AMD Radeon 610M
AMD Radeon Pro WX 3200
AMD Radeon Pro WX 3100
NVIDIA Quadro M2000M
...
max:
NVIDIA GeForce RTX 5090
SPECviewperf 13 specvp13 sw-04 + SPECviewperf 13 - specvp13 sw-04
min: 43.3 avg: 46.5 median: 46.5 (12%) max: 49.7 fps
Intel Iris Plus Graphics G7 (Ice Lake 64 EU)
...
AMD Radeon Pro WX 3200
Intel UHD Graphics Xe 32EUs (Tiger Lake-H)
NVIDIA Quadro P520
...
max:
specvp13 snx-03 + SPECviewperf 13 - specvp13 snx-03
min: 5.77 avg: 6 median: 6 (1%) max: 6.2 fps
Intel Iris Xe MAX Graphics
...
Intel Iris Plus Graphics G7 (Ice Lake 64 EU)
Intel UHD Graphics 24EUs (Alder Lake-N)
Intel UHD Graphics Xe 32EUs (Tiger Lake-H)
Intel UHD Graphics Xe 16EUs
...
NVIDIA RTX PRO 5000 Blackwell Generation Laptop
max:
AMD Radeon RX 9070 XT
specvp13 showcase-02 + SPECviewperf 13 - specvp13 showcase-02
min: 8.53 avg: 10.1 median: 10.1 (2%) max: 11.6 fps
Intel UHD Graphics 24EUs (Alder Lake-N)
Intel UHD Graphics Xe 16EUs
AMD Radeon RX Vega 10
Intel Iris Plus Graphics G7 (Ice Lake 64 EU)
Intel UHD Graphics Xe 32EUs (Tiger Lake-H)
AMD Radeon 610M
NVIDIA Quadro P520
...
NVIDIA RTX PRO 5000 Blackwell Generation Laptop
max:
NVIDIA GeForce RTX 5090
specvp13 medical-02 + SPECviewperf 13 - specvp13 medical-02
min: 5.46 avg: 5.5 median: 5.5 (1%) max: 5.57 fps
Intel UHD Graphics Xe 16EUs
Intel UHD Graphics 24EUs (Alder Lake-N)
Intel Iris Plus Graphics G7 (Ice Lake 64 EU)
Intel UHD Graphics Xe 32EUs (Tiger Lake-H)
AMD Radeon RX Vega 10
NVIDIA Quadro P600
AMD Radeon Pro WX 3200
NVIDIA Quadro P1000
...
NVIDIA RTX PRO 5000 Blackwell Generation Laptop
max:
AMD Radeon RX 9070 XT
specvp13 maya-05 + SPECviewperf 13 - specvp13 maya-05
min: 27.4 avg: 31 median: 31 (4%) max: 34.6 fps
Intel UHD Graphics 24EUs (Alder Lake-N)
Intel UHD Graphics Xe 16EUs
Intel Iris Plus Graphics G7 (Ice Lake 64 EU)
AMD Radeon RX Vega 10
Intel UHD Graphics Xe 32EUs (Tiger Lake-H)
AMD Radeon Pro WX 3200
NVIDIA Quadro P520
AMD Radeon 610M
Intel Iris Xe MAX Graphics
...
max:
specvp13 energy-02 + SPECviewperf 13 - specvp13 energy-02
min: 1.36 avg: 1.4 median: 1.4 (0%) max: 1.4 fps
...
AMD Radeon RX Vega 10
AMD Radeon RX 5300M
Intel UHD Graphics Xe 32EUs (Tiger Lake-H)
AMD Radeon Pro WX 3200
AMD Radeon 610M
NVIDIA Quadro P520
NVIDIA Quadro P1000
Intel Iris Plus Graphics G7 (Ice Lake 64 EU)
...
Intel UHD Graphics 24EUs (Alder Lake-N)
specvp13 creo-02 + SPECviewperf 13 - specvp13 creo-02
min: 22.5 avg: 23.6 median: 23.6 (3%) max: 24.6 fps
Intel Iris Plus Graphics G7 (Ice Lake 64 EU)
Intel UHD Graphics 24EUs (Alder Lake-N)
Intel Iris Xe MAX Graphics
Intel UHD Graphics Xe 16EUs
AMD Radeon RX Vega 10
Intel UHD Graphics Xe 32EUs (Tiger Lake-H)
...
NVIDIA RTX PRO 5000 Blackwell Generation Laptop
max:
AMD Radeon RX 9070 XT
specvp13 catia-05 + SPECviewperf 13 - specvp13 catia-05
min: 30.5 avg: 32.2 median: 32.2 (4%) max: 33.8 fps
Intel UHD Graphics 24EUs (Alder Lake-N)
...
Intel Iris Plus Graphics G7 (Ice Lake 64 EU)
AMD Radeon RX Vega 10
Intel UHD Graphics Xe 32EUs (Tiger Lake-H)
AMD Radeon 610M
AMD Radeon Pro WX 3200
NVIDIA Quadro P520
AMD Radeon RX Vega 7
...
NVIDIA RTX PRO 5000 Blackwell Generation Laptop
max:
AMD Radeon RX 9070 XT
specvp13 3dsmax-06 + SPECviewperf 13 - specvp13 3dsmax-06
min: 24.3 avg: 27 median: 27 (4%) max: 29.7 fps
Intel UHD Graphics 24EUs (Alder Lake-N)
...
Intel UHD Graphics Xe 16EUs
Intel Iris Plus Graphics G7 (Ice Lake 64 EU)
AMD Radeon RX Vega 10
AMD Radeon 610M
Intel UHD Graphics Xe 32EUs (Tiger Lake-H)
NVIDIA Quadro P520
AMD Radeon Pro WX 3200
AMD Radeon RX Vega 7
...
NVIDIA RTX PRO 5000 Blackwell Generation Laptop
max:
NVIDIA GeForce RTX 5090
SPECviewperf 2020 specvp2020 snx-04 1080p + SPECviewperf 2020 - specvp2020 snx-04 1080p
min: 5.83 avg: 6.1 median: 6.1 (1%) max: 6.56 fps
NVIDIA GeForce RTX 2070 Super Max-Q
...
NVIDIA RTX PRO 5000 Blackwell Generation Laptop
max:
AMD Radeon RX 9070 XT
specvp2020 medical-03 1080p + SPECviewperf 2020 - specvp2020 medical-03 1080p
min: 3.5 avg: 3.5 median: 3.5 (1%) max: 3.54 fps
AMD Radeon 610M
AMD Radeon RX Vega 7
NVIDIA Quadro P520
AMD Radeon 660M
...
NVIDIA RTX PRO 5000 Blackwell Generation Laptop
max:
AMD Radeon RX 9070 XT
specvp2020 maya-06 1080p + SPECviewperf 2020 - specvp2020 maya-06 1080p
min: 34.5 avg: 41.2 median: 43 (5%) max: 44.4 fps
AMD Radeon 610M
AMD Radeon RX Vega 7
NVIDIA Quadro P520
NVIDIA T500 Laptop GPU
...
max:
AMD Radeon RX 9070 XT
specvp2020 energy-03 1080p + SPECviewperf 2020 - specvp2020 energy-03 1080p
min: 1.38 avg: 1.4 median: 1.4 (0%) max: 1.4 fps
AMD Radeon 610M
NVIDIA Quadro P520
AMD Radeon RX Vega 7
...
NVIDIA RTX PRO 5000 Blackwell Generation Laptop
max:
NVIDIA GeForce RTX 5090
specvp2020 creo-03 1080p + SPECviewperf 2020 - specvp2020 creo-03 1080p
min: 14.1 avg: 14.8 median: 15 (5%) max: 15.1 fps
AMD Radeon RX Vega 7
NVIDIA Quadro P520
AMD Radeon 610M
...
NVIDIA RTX PRO 5000 Blackwell Generation Laptop
max:
AMD Radeon RX 9070 XT
specvp2020 catia-06 1080p + SPECviewperf 2020 - specvp2020 catia-06 1080p
min: 7.92 avg: 8.9 median: 9.2 (5%) max: 9.36 fps
AMD Radeon RX Vega 7
NVIDIA Quadro P520
AMD Radeon 610M
...
NVIDIA RTX PRO 5000 Blackwell Generation Laptop
max:
AMD Radeon RX 9070 XT
specvp2020 3dsmax-07 1080p + SPECviewperf 2020 - specvp2020 3dsmax-07 1080p
min: 9.43 avg: 10.7 median: 11.1 (3%) max: 11.3 fps
AMD Radeon 610M
...
AMD Radeon 610M
AMD Radeon RX Vega 7
NVIDIA Quadro P520
...
NVIDIA RTX PRO 5000 Blackwell Generation Laptop
max:
NVIDIA GeForce RTX 5090
specvp2020 snx-04 4k + SPECviewperf 2020 - specvp2020 snx-04 4k
min: 5.4 avg: 5.8 median: 5.8 (1%) max: 6.24 fps
Intel UHD Graphics Xe G4 48EUs
Intel UHD Graphics Xe 32EUs (Tiger Lake-H)
...
NVIDIA RTX PRO 5000 Blackwell Generation Laptop
max:
specvp2020 medical-03 4k + SPECviewperf 2020 - specvp2020 medical-03 4k
min: 1.32 avg: 1.3 median: 1.3 (1%) max: 1.35 fps
Intel UHD Graphics Xe 32EUs (Tiger Lake-H)
Intel UHD Graphics Xe G4 48EUs
AMD Radeon 610M
AMD Radeon RX Vega 7
...
NVIDIA RTX PRO 5000 Blackwell Generation Laptop
max:
AMD Radeon RX 9070 XT
specvp2020 maya-06 4k + SPECviewperf 2020 - specvp2020 maya-06 4k
min: 12.2 avg: 15.1 median: 16 (2%) max: 16.3 fps
Intel UHD Graphics Xe G4 48EUs
Intel UHD Graphics Xe 32EUs (Tiger Lake-H)
AMD Radeon RX Vega 7
AMD Radeon 660M
...
max:
NVIDIA GeForce RTX 5090
specvp2020 energy-03 4k + SPECviewperf 2020 - specvp2020 energy-03 4k
min: 0.76 avg: 1.1 median: 1.1 (0%) max: 1.51 fps
...
Intel UHD Graphics Xe 32EUs (Tiger Lake-H)
Intel UHD Graphics Xe G4 48EUs
AMD Radeon 610M
AMD Radeon RX Vega 7
...
max:
specvp2020 creo-03 4k + SPECviewperf 2020 - specvp2020 creo-03 4k
min: 7.73 avg: 8.8 median: 9.1 (4%) max: 9.17 fps
Intel UHD Graphics Xe G4 48EUs
Intel UHD Graphics Xe 32EUs (Tiger Lake-H)
AMD Radeon 610M
AMD Radeon RX Vega 7
...
NVIDIA RTX PRO 5000 Blackwell Generation Laptop
max:
AMD Radeon RX 9070 XT
specvp2020 catia-06 4k + SPECviewperf 2020 - specvp2020 catia-06 4k
min: 4.61 avg: 5.3 median: 5.5 (4%) max: 5.6 fps
Intel UHD Graphics Xe G4 48EUs
Intel UHD Graphics Xe 32EUs (Tiger Lake-H)
AMD Radeon 610M
...
NVIDIA RTX PRO 5000 Blackwell Generation Laptop
max:
specvp2020 3dsmax-07 4k + SPECviewperf 2020 - specvp2020 3dsmax-07 4k
min: 5.53 avg: 6.4 median: 6.6 (2%) max: 6.69 fps
Intel UHD Graphics Xe G4 48EUs
Intel UHD Graphics Xe 32EUs (Tiger Lake-H)
AMD Radeon RX Vega 7
AMD Radeon 660M
...
max:
NVIDIA GeForce RTX 5090
Cinebench R10 Cinebench R10 Shading (32bit) + Cinebench R10 - Cinebench R10 Shading (32bit)
min: 14423 avg: 14758 median: 14633.5 (10%) max: 15343 points
Intel Graphics Media Accelerator (GMA) 500
...
AMD Radeon 680M
Intel UHD Graphics Xe 32EUs (Tiger Lake-H)
...
Cinebench R11.5 Cinebench R11.5 OpenGL 64 Bit + Cinebench R11.5 - Cinebench R11.5 OpenGL 64 Bit
min: 77.93 avg: 87 median: 89.4 (9%) max: 91.49 fps
Intel Graphics Media Accelerator (GMA) 4500MHD
...
NVIDIA Quadro M1000M
AMD Radeon R9 M290X
AMD FirePro W7170M
AMD Radeon RX 580 (Laptop)
NVIDIA GeForce RTX 2070 Super Max-Q
NVIDIA Quadro M4000M
NVIDIA Quadro P4000 Max-Q
AMD FirePro M6100
AMD Radeon R9 M390
...
max:
Nvidia RTX A2000
Cinebench R15 + Cinebench R15 - Cinebench R15 OpenGL 64 Bit
min: 77.94 avg: 86.3 median: 86.9 (5%) max: 94.6 fps
Intel Graphics Media Accelerator (GMA) 4500MHD
...
Intel UHD Graphics Xe 32EUs (Tiger Lake-H)
NVIDIA Quadro P500
Apple M1 Pro 16-Core GPU
Intel Iris Pro Graphics 580
AMD Radeon RX 560X (Laptop)
AMD Radeon Pro 560
NVIDIA GeForce GTX 765M SLI
Apple M1 8-Core GPU
Apple M1 7-Core GPU
NVIDIA GeForce GTX 780M
NVIDIA GeForce GTX 765M
NVIDIA Quadro M2000M
Apple M1 Pro 14-Core GPU
...
NVIDIA RTX PRO 3000 Blackwell Generation Laptop
Cinebench R15 OpenGL Ref. Match 64 Bit + Cinebench R15 - Cinebench R15 OpenGL Ref. Match 64 Bit
...
Intel HD Graphics 4200
Intel HD Graphics 4400
Intel Iris Graphics 5100
Intel HD Graphics (Bay Trail)
Intel HD Graphics 520
...
NVIDIA GeForce GTX 780M
GFXBench - GFXBench 5.0 4K Aztec Ruins High Tier Offscreen
Intel UHD Graphics Xe G4 48EUs
AMD Radeon 660M
Intel Arc Graphics 130T
AMD Radeon 680M
...
GFXBench - GFXBench 5.0 Aztec Ruins High Tier Offscreen
...
AMD Radeon RX Vega 8 (Ryzen 2000/3000)
Intel Iris Plus Graphics G4 (Ice Lake 48 EU)
AMD Radeon RX Vega 10
Intel UHD Graphics Xe G4 48EUs
Intel UHD Graphics Xe 32EUs (Tiger Lake-H)
AMD Radeon 540X
AMD Radeon RX Vega 7
NVIDIA Quadro P520
AMD Radeon RX 550X (Laptop)
AMD Radeon 660M
...
GFXBench - GFXBench 5.0 Aztec Ruins Normal Tier Offscreen
...
AMD Radeon RX Vega 8 (Ryzen 2000/3000)
Intel Iris Plus Graphics G4 (Ice Lake 48 EU)
AMD Radeon RX Vega 10
Intel UHD Graphics Xe G4 48EUs
AMD Radeon 540X
AMD Radeon RX Vega 7
NVIDIA Quadro P520
AMD Radeon 660M
AMD Radeon RX 550X (Laptop)
...
GFXBench - GFXBench Car Chase Offscreen
...
NVIDIA Quadro M600M
AMD Radeon RX Vega 7
Intel Iris Plus Graphics G4 (Ice Lake 48 EU)
Intel UHD Graphics Xe G4 48EUs
AMD Radeon RX 550X (Laptop)
NVIDIA GeForce GTX 950M
AMD Radeon 660M
NVIDIA Quadro P520
NVIDIA Quadro M2000M
AMD Radeon Pro 560
...
GFXBench 3.1 - GFXBench Manhattan ES 3.1 Offscreen
Intel HD Graphics (Bay Trail)
...
AMD Radeon RX 550X (Laptop)
NVIDIA Quadro M600M
AMD Radeon Pro 560
Intel Iris Plus Graphics G4 (Ice Lake 48 EU)
Intel UHD Graphics Xe G4 48EUs
AMD Radeon 660M
NVIDIA GeForce GTX 950M
AMD Radeon RX 560X (Laptop)
NVIDIA Quadro P520
...
GFXBench 3.0 - GFXBench 3.0 Manhattan Offscreen
...
NVIDIA GeForce 945M
AMD Radeon RX 580 (Laptop)
Intel Iris Plus Graphics G4 (Ice Lake 48 EU)
NVIDIA GeForce GTX 950M
NVIDIA Quadro M2000M
NVIDIA Quadro P520
AMD Radeon R9 M295X
NVIDIA Quadro P1000
...
GFXBench (DX / GLBenchmark) 2.7 + GFXBench (DX / GLBenchmark) 2.7 - GFXBench T-Rex HD Offscreen C24Z16
Intel HD Graphics (Bay Trail)
...
Intel UHD Graphics Xe G4 48EUs
AMD Radeon 540X
Intel Iris Plus Graphics G4 (Ice Lake 48 EU)
AMD Radeon R9 M370X
AMD Radeon Pro 455
AMD Radeon RX Vega 7
NVIDIA GeForce GTX 950M
AMD Radeon 660M
AMD Radeon RX 550X (Laptop)
AMD Radeon Pro 560
NVIDIA Quadro M2000M
...
Basemark GPU 1.2 - Basemark GPU 1.2 Vulkan Official Medium Offscreen 1080
Intel UHD Graphics 600
...
Intel UHD Graphics Xe G4 48EUs
AMD Radeon R9 M280X
AMD Radeon 660M
AMD Radeon RX Vega 7
...
max:
NVIDIA GeForce RTX 5090
Basemark GPU 1.2 - Basemark GPU 1.2 Vulkan Official High Offscreen 2160
Intel UHD Graphics 600
Intel UHD Graphics 605
Intel UHD Graphics Xe 750 32EUs (Rocket Lake)
...
max:
NVIDIA GeForce RTX 5090
Geekbench 6.7 - Geekbench 6.7.1 GPU OpenCL
min: 7482 avg: 7843 median: 7796 (2%) max: 8346 points
Intel UHD Graphics 605
...
Intel UHD Graphics Xe 16EUs
Intel UHD Graphics 24EUs (Alder Lake-N)
Intel UHD Graphics G1 (Ice Lake 32 EU)
AMD Radeon 610M
Intel UHD Graphics Xe 32EUs (Tiger Lake-H)
Intel Iris Graphics 550
Intel UHD Graphics Xe G4 48EUs
AMD Radeon RX Vega 8 (Ryzen 2000/3000)
AMD Radeon RX Vega 6 (Ryzen 4000/5000)
AMD Radeon RX Vega 7
...
NVIDIA RTX PRO 5000 Blackwell Generation Laptop
max:
NVIDIA GeForce RTX 5090
Geekbench 6.7 - Geekbench 6.7.1 GPU Vulkan
min: 8422 avg: 8874 median: 8988 (2%) max: 9023 points
...
Intel UHD Graphics 24EUs (Alder Lake-N)
Intel UHD Graphics 615
Intel UHD Graphics G1 (Ice Lake 32 EU)
AMD Radeon 610M
Intel Iris Graphics 550
Intel UHD Graphics Xe 32EUs (Tiger Lake-H)
AMD Radeon RX Vega 8 (Ryzen 2000/3000)
Intel UHD Graphics Xe G4 48EUs
AMD Radeon RX Vega 6 (Ryzen 4000/5000)
AMD Radeon RX Vega 7
...
NVIDIA RTX PRO 3000 Blackwell Generation Laptop
max:
NVIDIA GeForce RTX 5090
LuxMark v2.0 64Bit - LuxMark v2.0 Room GPU
min: 356 avg: 470.8 median: 487 (2%) max: 663 Samples/s
AMD Radeon HD 8180
...
NVIDIA GeForce 945M
AMD Radeon RX 550X (Laptop)
AMD Radeon R9 M375
AMD Radeon Pro WX 3100
AMD Radeon Pro 455
NVIDIA Quadro M600M
Intel Arc Graphics 130T
AMD Radeon Pro WX 3200
AMD Radeon Pro 555
...
max:
4x NVIDIA RTX A6000
LuxMark v2.0 64Bit - LuxMark v2.0 Sala GPU
min: 1086 avg: 1217 median: 1232 (2%) max: 1293 Samples/s
...
NVIDIA Quadro P600
Intel Iris Plus Graphics G7 (Ice Lake 64 EU)
Intel UHD Graphics Xe 32EUs (Tiger Lake-H)
NVIDIA Quadro M1000M
AMD Radeon Pro 460
NVIDIA GeForce GTX 950M
AMD Radeon 680M
AMD Radeon R9 M390
NVIDIA Quadro P1000
NVIDIA GeForce GTX 960M
AMD Radeon R9 M280X
AMD Radeon Pro 560
...
max:
4x NVIDIA RTX A6000
ComputeMark v2.1 - ComputeMark v2.1 Result
min: 1432 avg: 1546 median: 1543 (1%) max: 1667 points
...
AMD Radeon R7 M340
Intel Iris Graphics 540
AMD Radeon R5 M335
AMD Radeon R7 M360
AMD Radeon R8 M365DX
AMD Radeon R6 M340DX
NVIDIA GeForce GT 745M
NVIDIA Quadro K2100M
NVIDIA Maxwell GPU Surface Book
Intel Iris Plus Graphics 640
...
max:
NVIDIA GeForce RTX 5090
Power Consumption - Furmark Stress Test Power Consumption - external Monitor *
min: 39.3 avg: 40.4 median: 40.6 (5%) max: 41.4 Watt
...
NVIDIA Quadro P520
Intel UHD Graphics Xe 32EUs (Tiger Lake-H)
Intel Arc Graphics 130T
AMD Radeon 660M
AMD Radeon 610M
AMD Radeon RX Vega 8 (Ryzen 2000/3000)
AMD Radeon RX Vega 9
...
max:
NVIDIA GeForce RTX 5090
0 5 10 15 20 25 30 35 40 45 50 55 60 65 70 75 80 85 Tooltip HP Pro Mini 400 G9-937U0EA: Ø39.3 (37.3-49.7)
Dell OptiPlex Micro: Ø39.6 (35.9-75.4)
HP Pro Mini 400 G9-936M3EA: Ø40.6 (38.9-55.5)
HP Elite Mini 800 G9-5M9T9EA: Ø40.7 (36.7-86.6)
HP Elite Mini 800 G9-5M9X6EA: Ø41.4 (37.4-53.8)
Power Consumption - The Witcher 3 Power Consumption - external Monitor *
Qualcomm Adreno 690
...
NVIDIA GeForce GTX 1050 Ti Max-Q
AMD Radeon RX 560X (Laptop)
...
max:
4x NVIDIA RTX A6000
0 5 10 15 20 25 30 35 40 45 50 55 60 65 70 75 80 85 Tooltip Dell OptiPlex Micro: Ø77.1 (72.5-88)
Power Consumption - Witcher 3 Power Consumption *
Intel UHD Graphics 605
...
NVIDIA Quadro P1000
NVIDIA Quadro P600
Apple M1 Max 24-Core GPU
NVIDIA Quadro P2000
NVIDIA Quadro P2000 Max-Q
AMD Radeon Pro WX Vega M GL
NVIDIA Quadro T2000 Max-Q
AMD Radeon RX 560 (Laptop)
...
0 5 10 15 20 25 30 35 40 45 50 55 60 65 70 75 80 85 Tooltip Dell OptiPlex Micro: Ø77.1 (72.5-88)
Power Consumption - Cyberpunk 2077 Power Consumption - external Monitor *
min: 49 avg: 63.3 median: 65.3 (8%) max: 73.8 Watt
...
AMD Radeon 610M
...
max:
0 5 10 15 20 25 30 35 40 45 50 55 60 65 70 75 80 85 90 95 100 105 110 Tooltip HP Pro Mini 400 G9-937U0EA: Ø49 (47.4-53.5)
HP Pro Mini 400 G9-936M3EA: Ø57.1 (54.8-73.1)
HP Elite Mini 800 G9-5M9X6EA: Ø73.4 (69-87.1)
HP Elite Mini 800 G9-5M9T9EA: Ø73.8 (69.2-110.8)
Emissions Witcher 3 Fan Noise + Emissions - Witcher 3 Fan Noise
...
AMD Radeon RX 560 (Laptop)
AMD Radeon R7 M340
AMD Radeon RX Vega M GH
Intel UHD Graphics Xe G4 48EUs
NVIDIA Quadro RTX 3000 Max-Q
AMD Radeon RX 460 (Laptop)
...
- Range of benchmark values
- Average benchmark values
* Smaller numbers mean a higher performance
The following benchmarks stem from our benchmarks of review laptops. The performance depends on the used graphics memory, clock rate, processor, system settings, drivers, and operating systems. So the results don't have to be representative for all laptops with this GPU. For detailed information on the benchmark results, click on the fps number.
log 26. 12:37:52
#0 ran 0s before starting gpusingle class +0s ... 0s
#1 no ids found in url (should be separated by "_") +0s ... 0s
#2 not redirecting to Ajax server +0s ... 0s
#3 did not recreate cache, as it is less than 5 days old! Created at Sat, 25 Jul 2026 05:31:39 +0200 +0.004s ... 0.004s
#4 no comparison url found in template nbc.compare_page_1 needed +0.013s ... 0.018s
#5 composed specs +0s ... 0.018s
#6 did output specs +0s ... 0.018s
#7 start showIntegratedCPUs +0s ... 0.018s
#8 getting avg benchmarks for device 10972 +0.041s ... 0.059s
#9 got single benchmarks 10972 +0.027s ... 0.086s
#10 got avg benchmarks for devices +0s ... 0.086s
#11 min, max, avg, median took s +4.168s ... 4.254s
#12 before gaming benchmark output +0.001s ... 4.255s
#13 Got 273 rows for game benchmarks. +0.015s ... 4.27s
#14 composed SQL query for gamebenchmarks +0s ... 4.27s
#15 got data and put it in $dataArray +0.043s ... 4.312s
#16 benchmarks composed for output. +1.024s ... 5.336s
#17 no comparison url found in template nbc.compare_page_1 needed +0.518s ... 5.854s
#18 return log +0s ... 5.854s