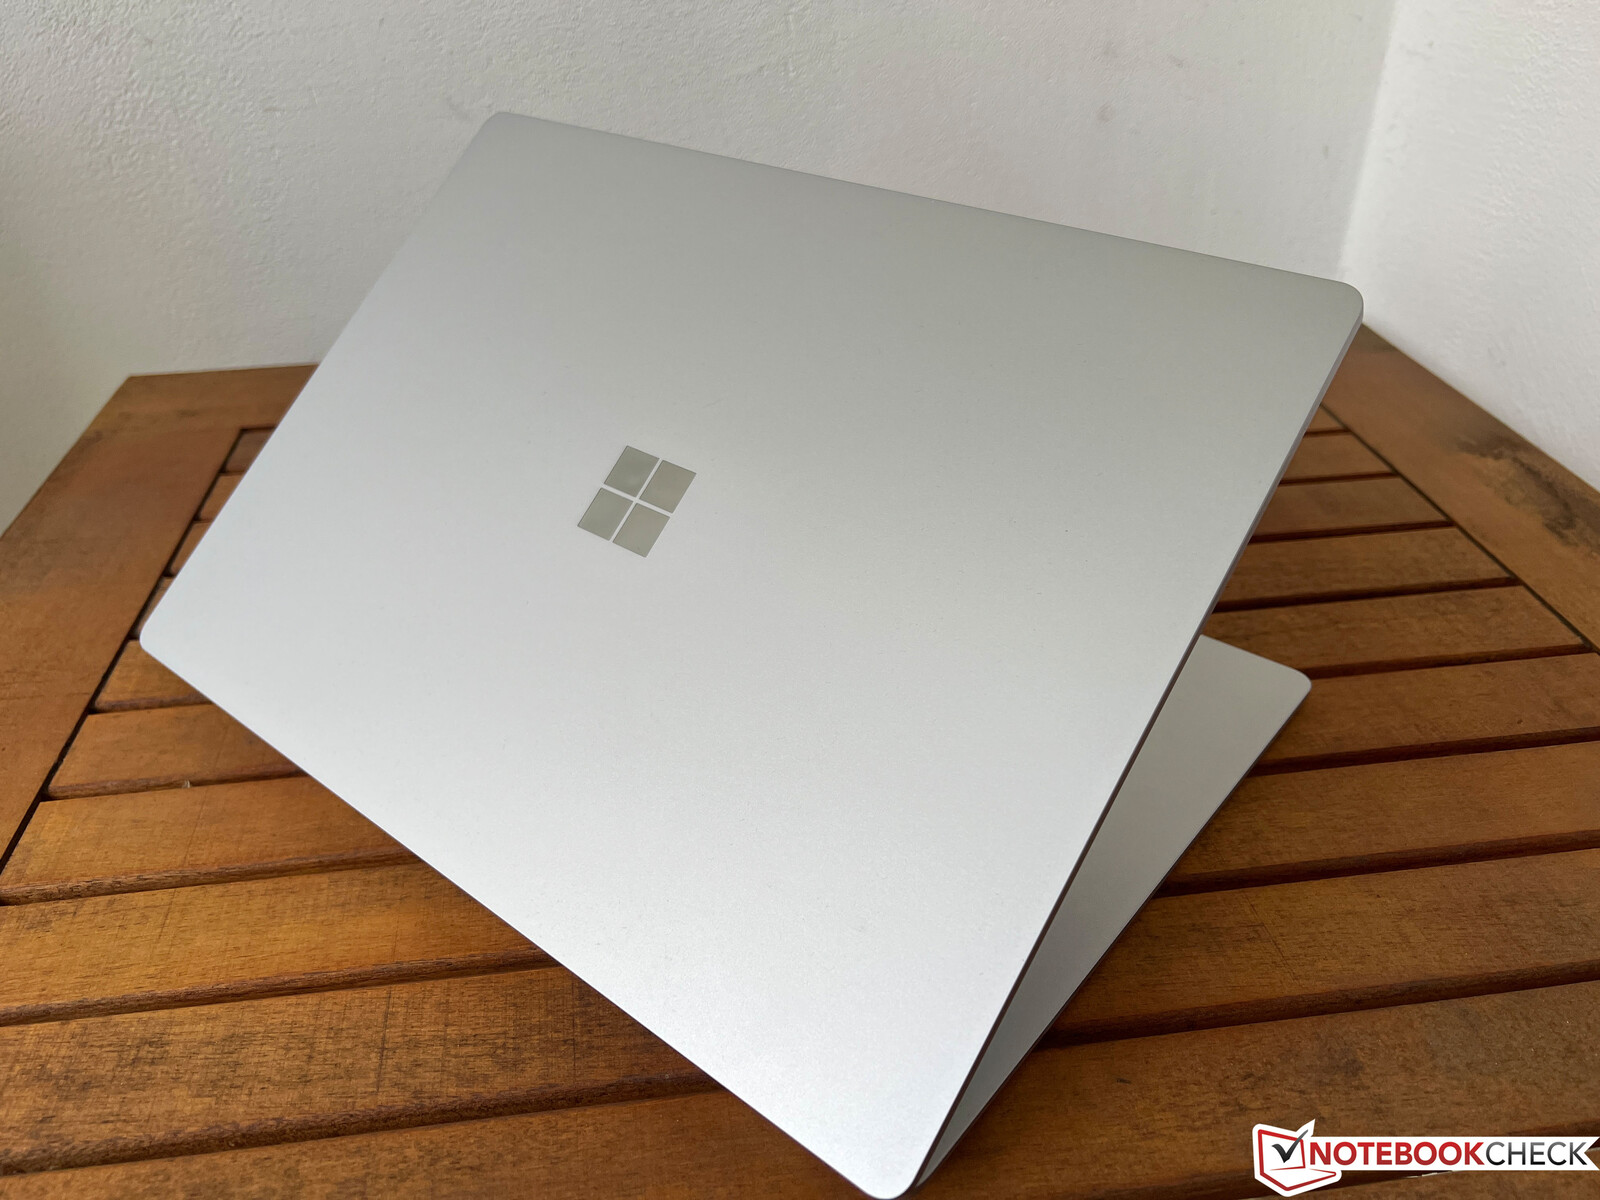
微软Surface Laptop 5 15评测--老式设计,高端价格
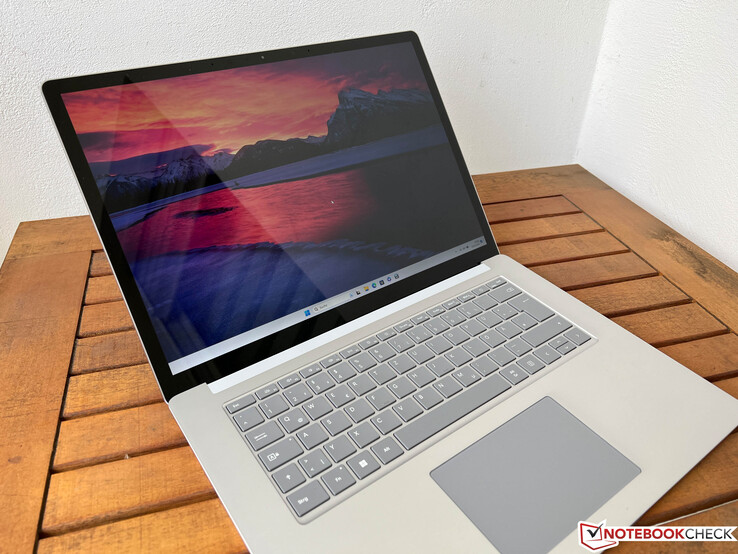
微软在去年年底更新了他们的Surface笔记本电脑,但这次新的更新实际上并没有带来很多新功能。制造商决定放弃第五代的AMD选项,转而提供13.5和15英寸的版本,专门配备英特尔Alder Lake处理器。除了新的处理器外,实际上没有其他变化--因为笔记本电脑仍然使用完全相同的外壳。然而,价格仍然在高端范围内,而我们的测试配置--15英寸机型配备的是 酷睿i7-1255U16GB内存和512GB固态硬盘的15英寸机型,目前微软的建议零售价约为4,000美元,考虑到该设备的技术规格,这个价格过于自信。然而,从其他零售商那里可以找到更便宜的笔记本,价格从1699美元左右开始。我们已经测试了Surface Laptop 5 15在2023年初是否还能与其他类似设备竞争。
潜在的竞争对手比较
Rating | Date | Model | Weight | Height | Size | Resolution | Price |
|---|---|---|---|---|---|---|---|
| 84.3 % v7 (old) | 04 / 2023 | Microsoft Surface Laptop 5 15, i7-1255U i7-1255U, Iris Xe G7 96EUs | 1.6 kg | 14.7 mm | 15.00" | 2496x1664 | |
| 84.9 % v7 (old) | 05 / 2021 | Microsoft Surface Laptop 4 15 AMD TFF_00028 R7 4980U, Vega 8 | 1.6 kg | 14.7 mm | 15.00" | 2496x1664 | |
| 85.9 % v7 (old) | 12 / 2022 | LG Gram 15Z90Q i5-1240P, Iris Xe G7 80EUs | 1.1 kg | 17.4 mm | 15.60" | 1920x1080 | |
| 89.5 % v7 (old) | 05 / 2022 | Dell XPS 15 9520 RTX 3050 Ti i7-12700H, GeForce RTX 3050 Ti Laptop GPU | 1.9 kg | 18 mm | 15.60" | 3456x2160 | |
| 87.3 % v7 (old) | 12 / 2021 | Samsung Galaxy Book Pro 15 NP950XDB-KC5US i7-1165G7, Iris Xe G7 96EUs | 1.1 kg | 11.7 mm | 15.60" | 1920x1080 | |
| 87.7 % v7 (old) | 05 / 2022 | Asus Zenbook Pro 15 OLED UM535Q R9 5900HX, GeForce RTX 3050 Ti Laptop GPU | 1.9 kg | 18 mm | 15.60" | 1920x1080 |
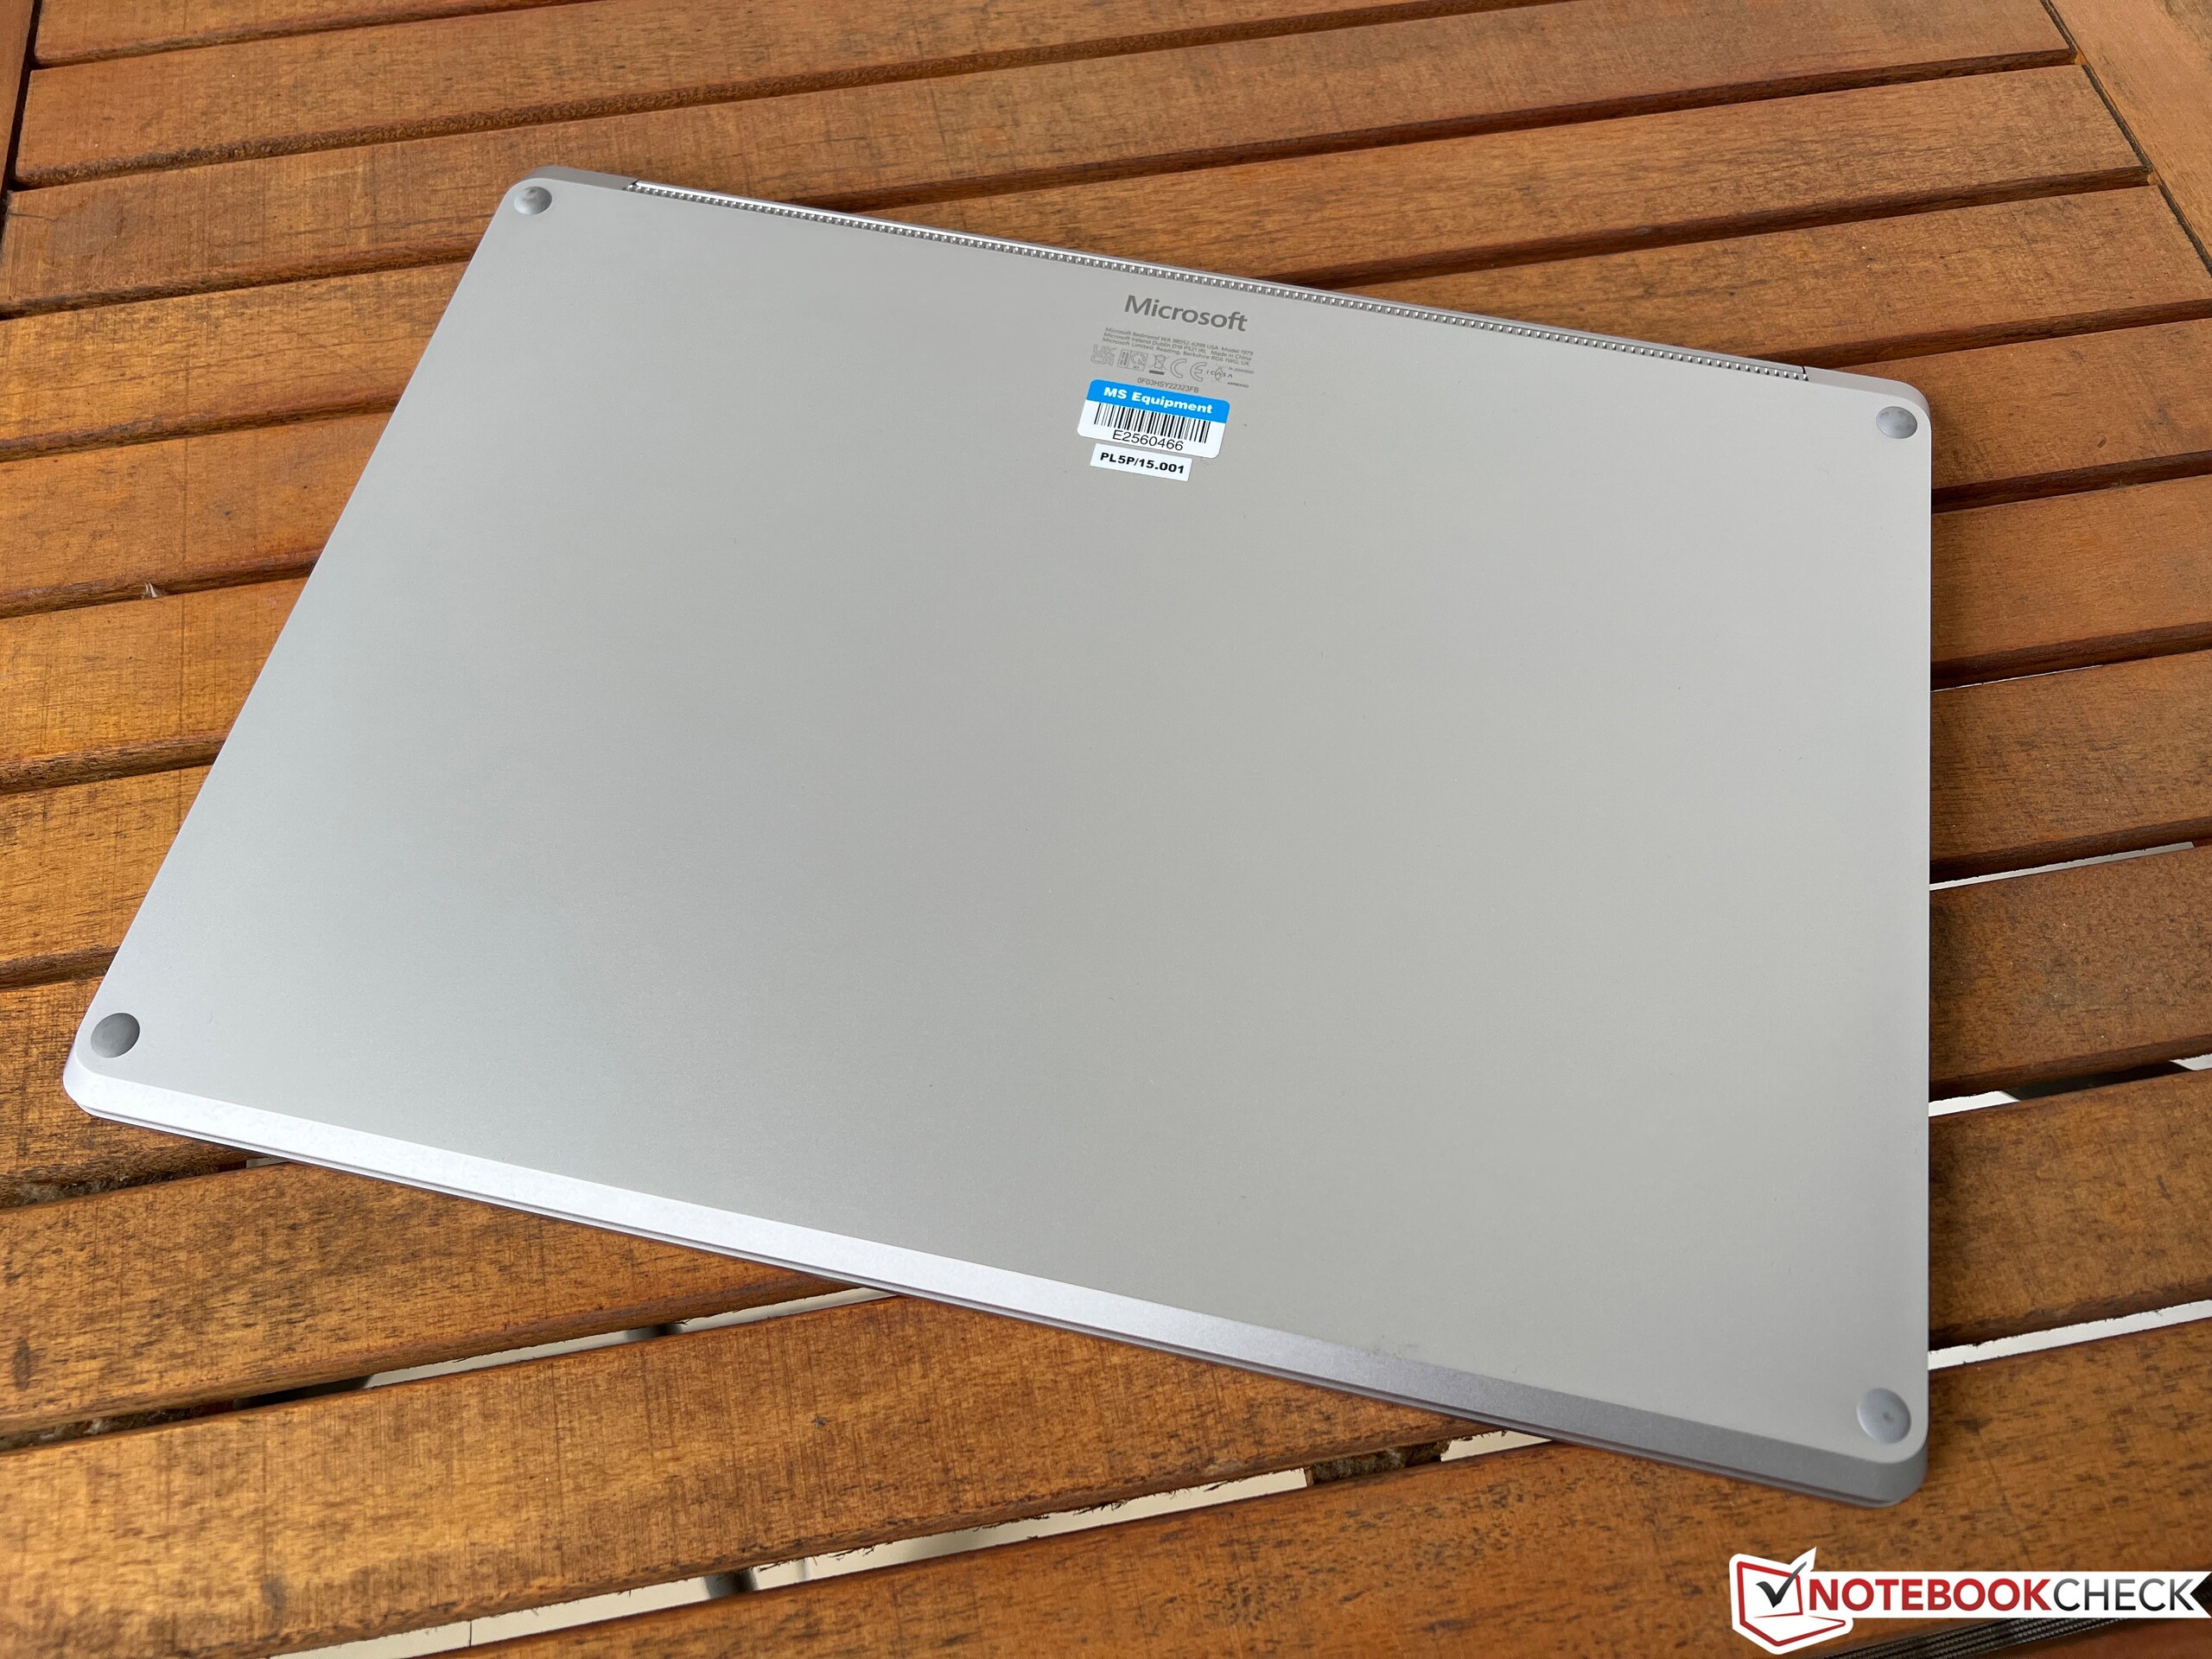
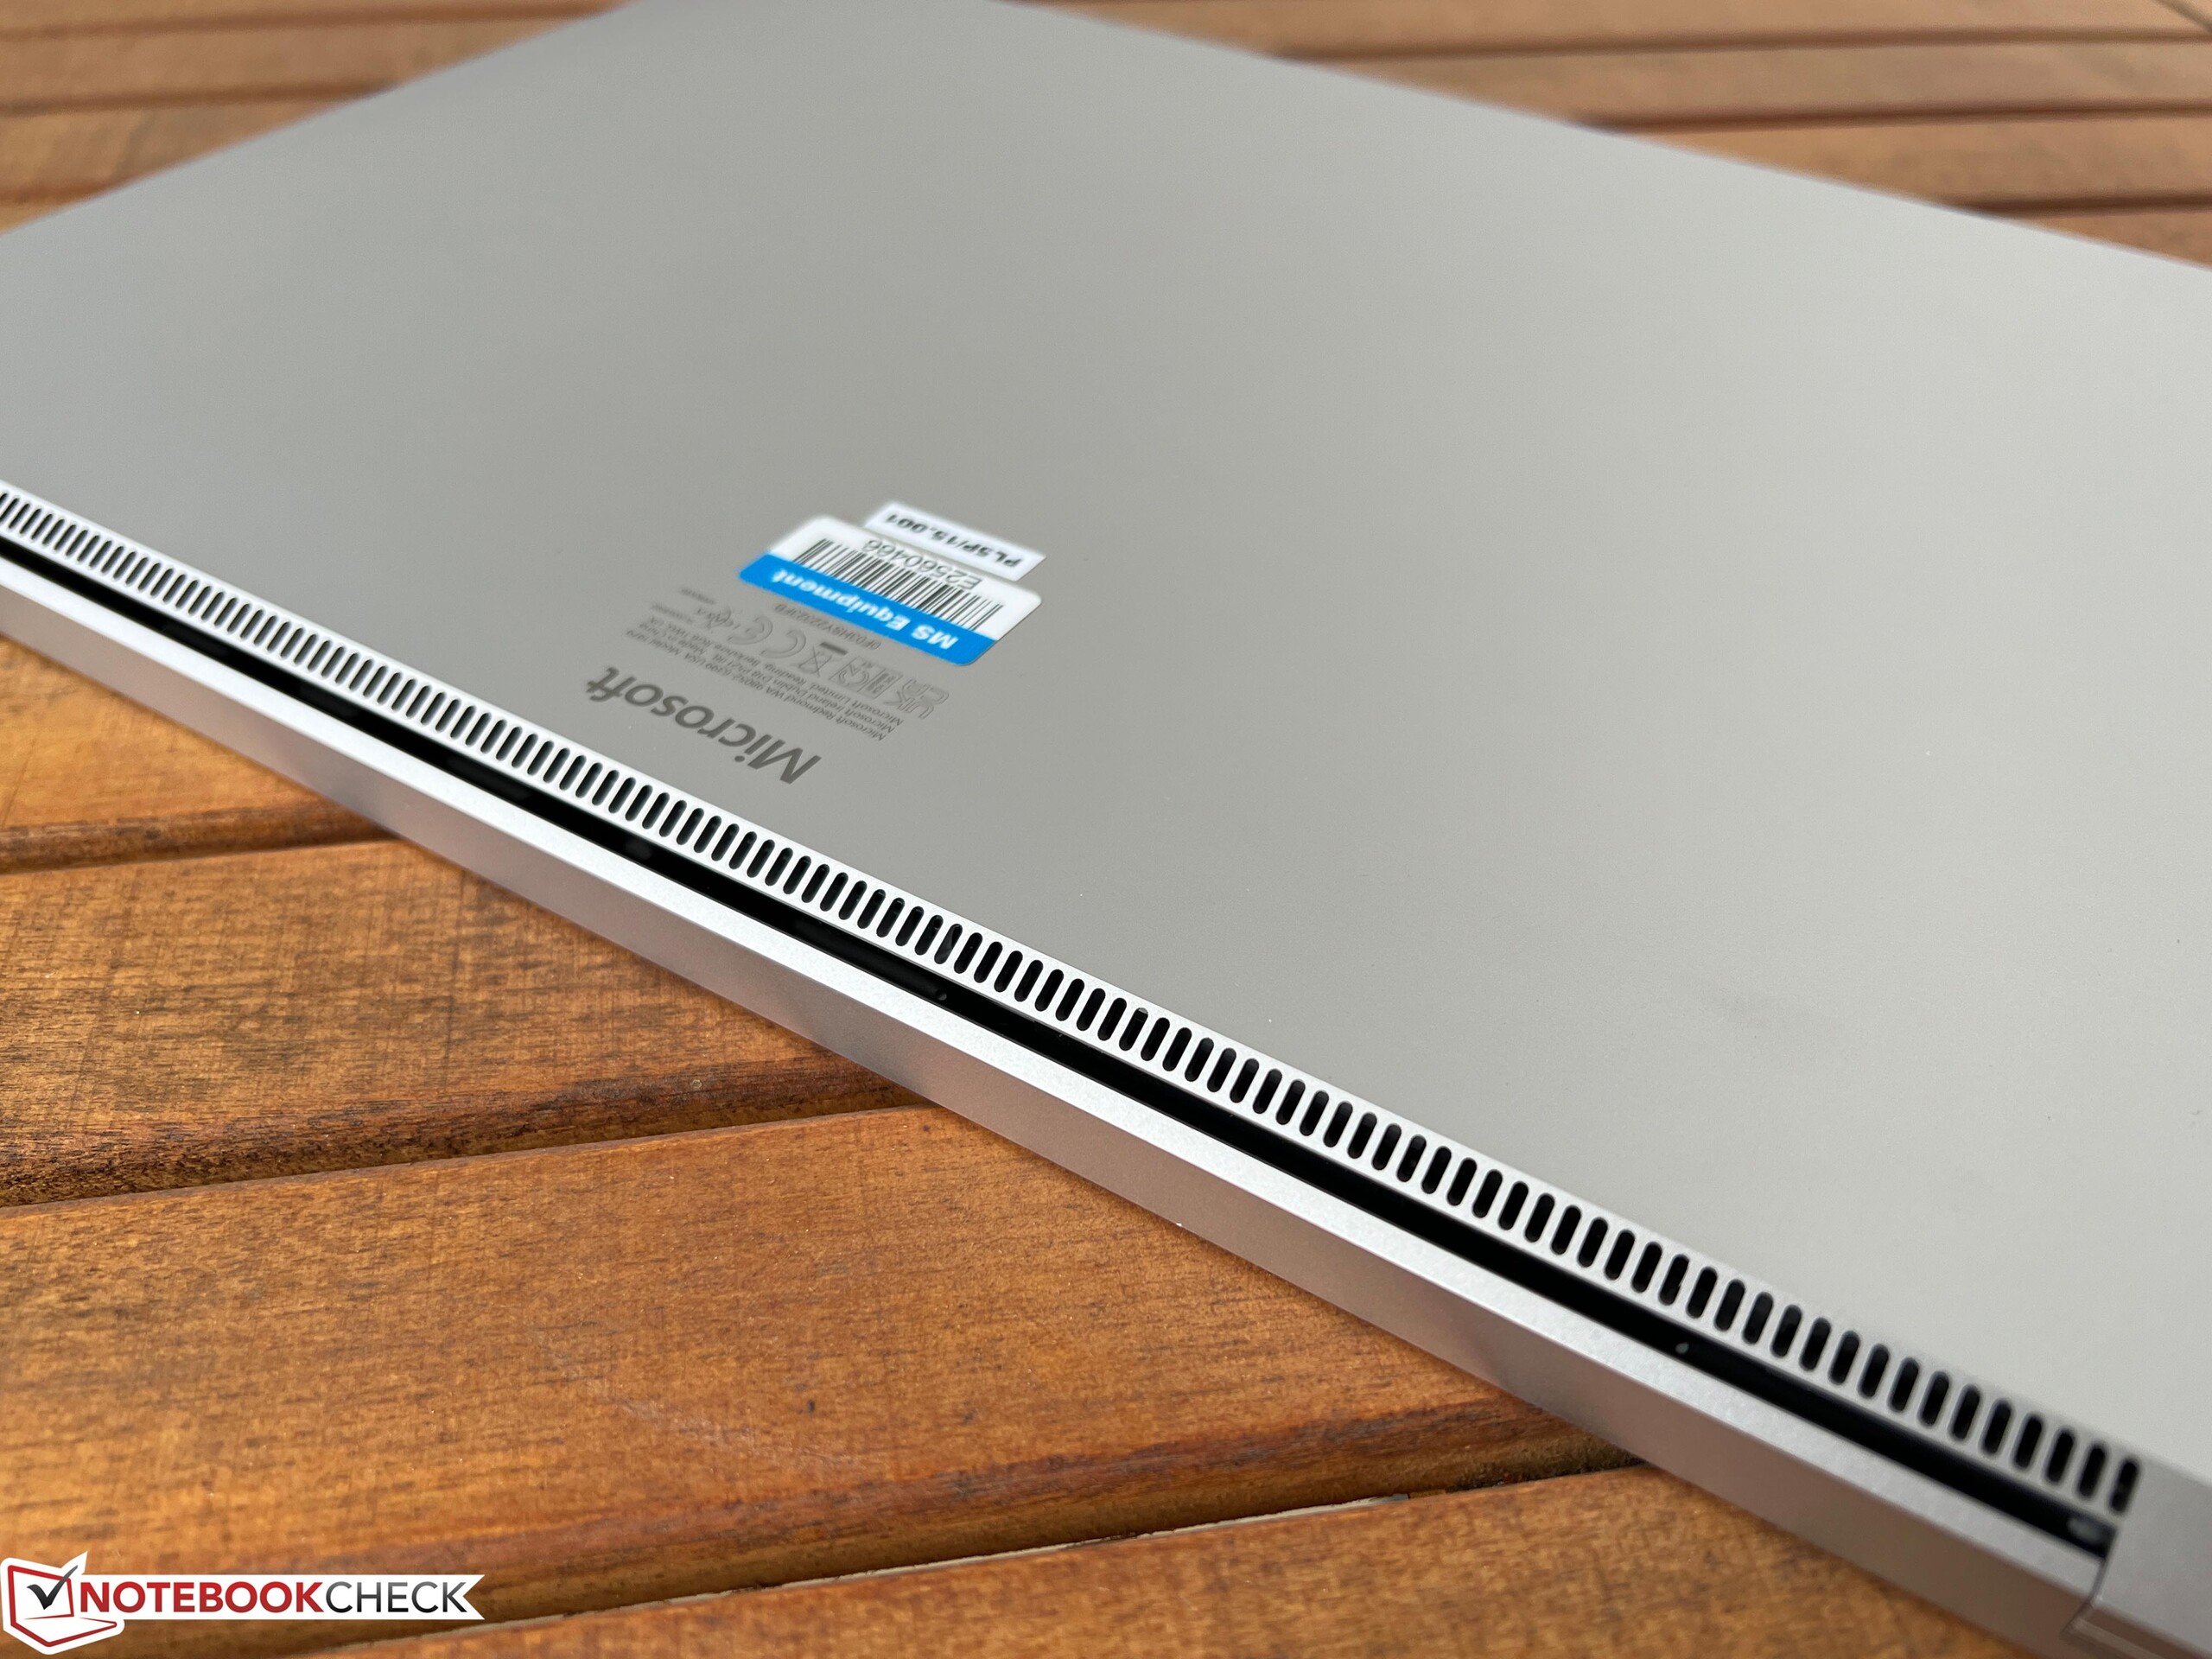
案例与特点
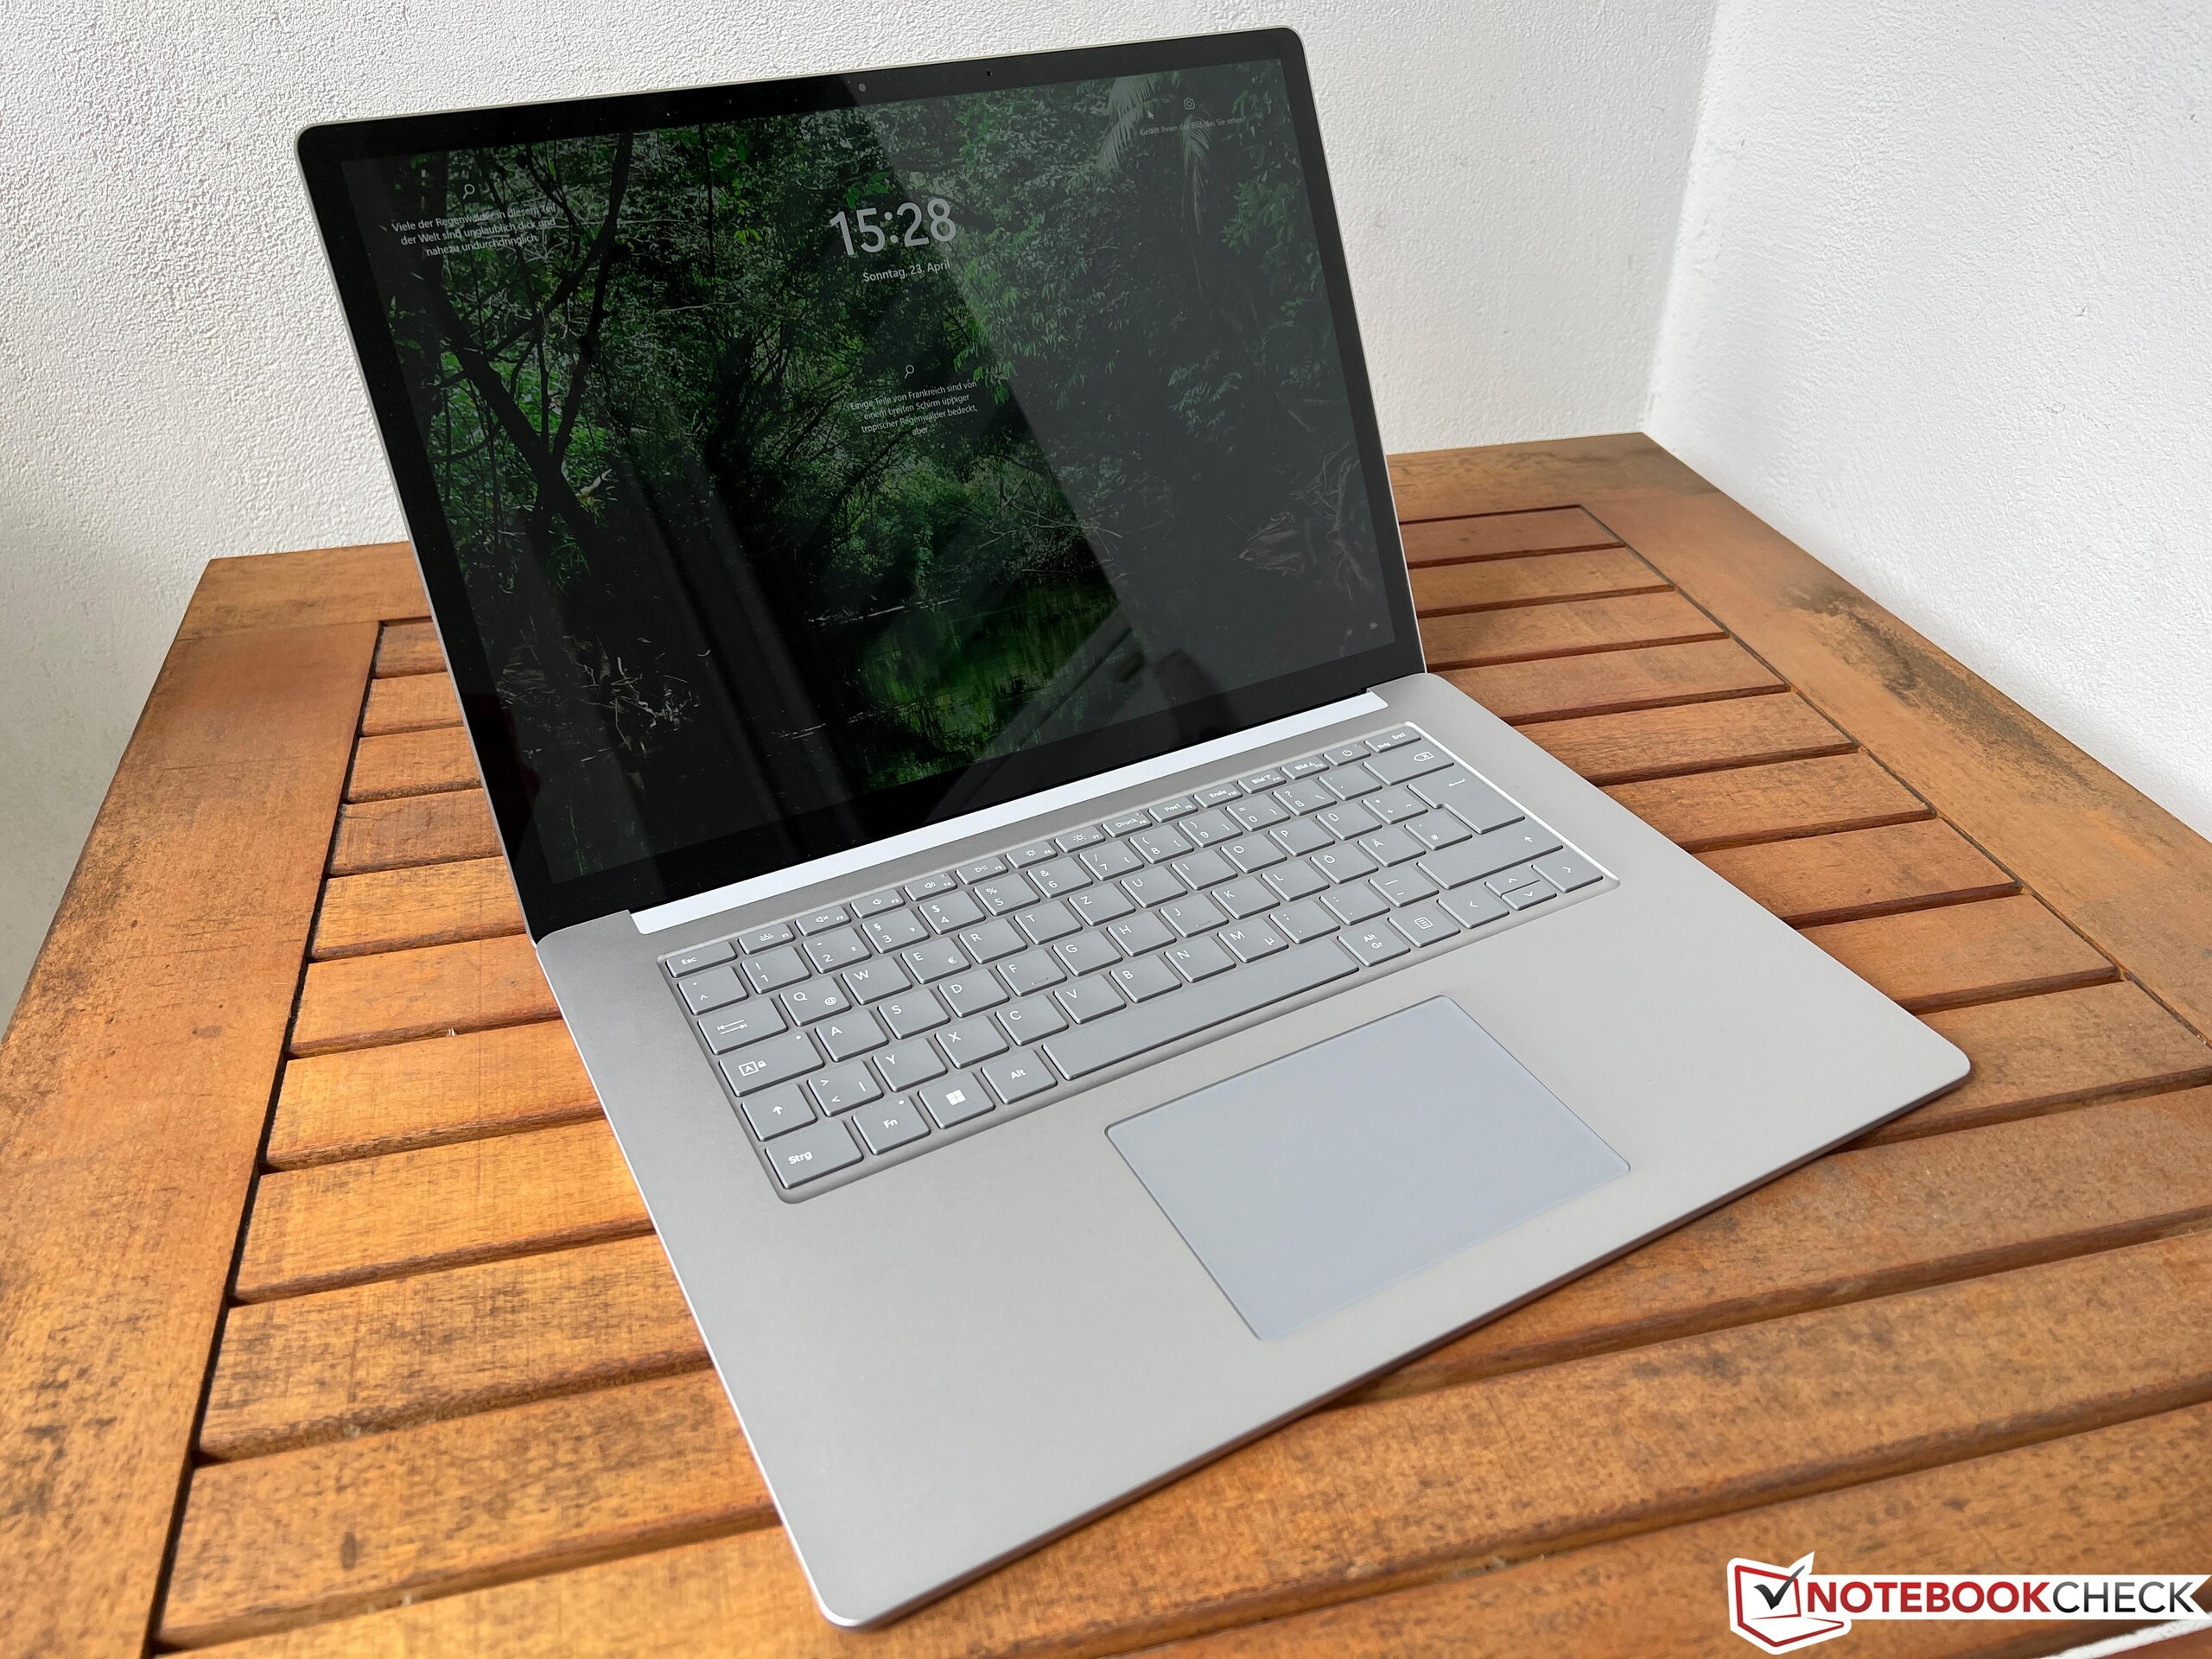
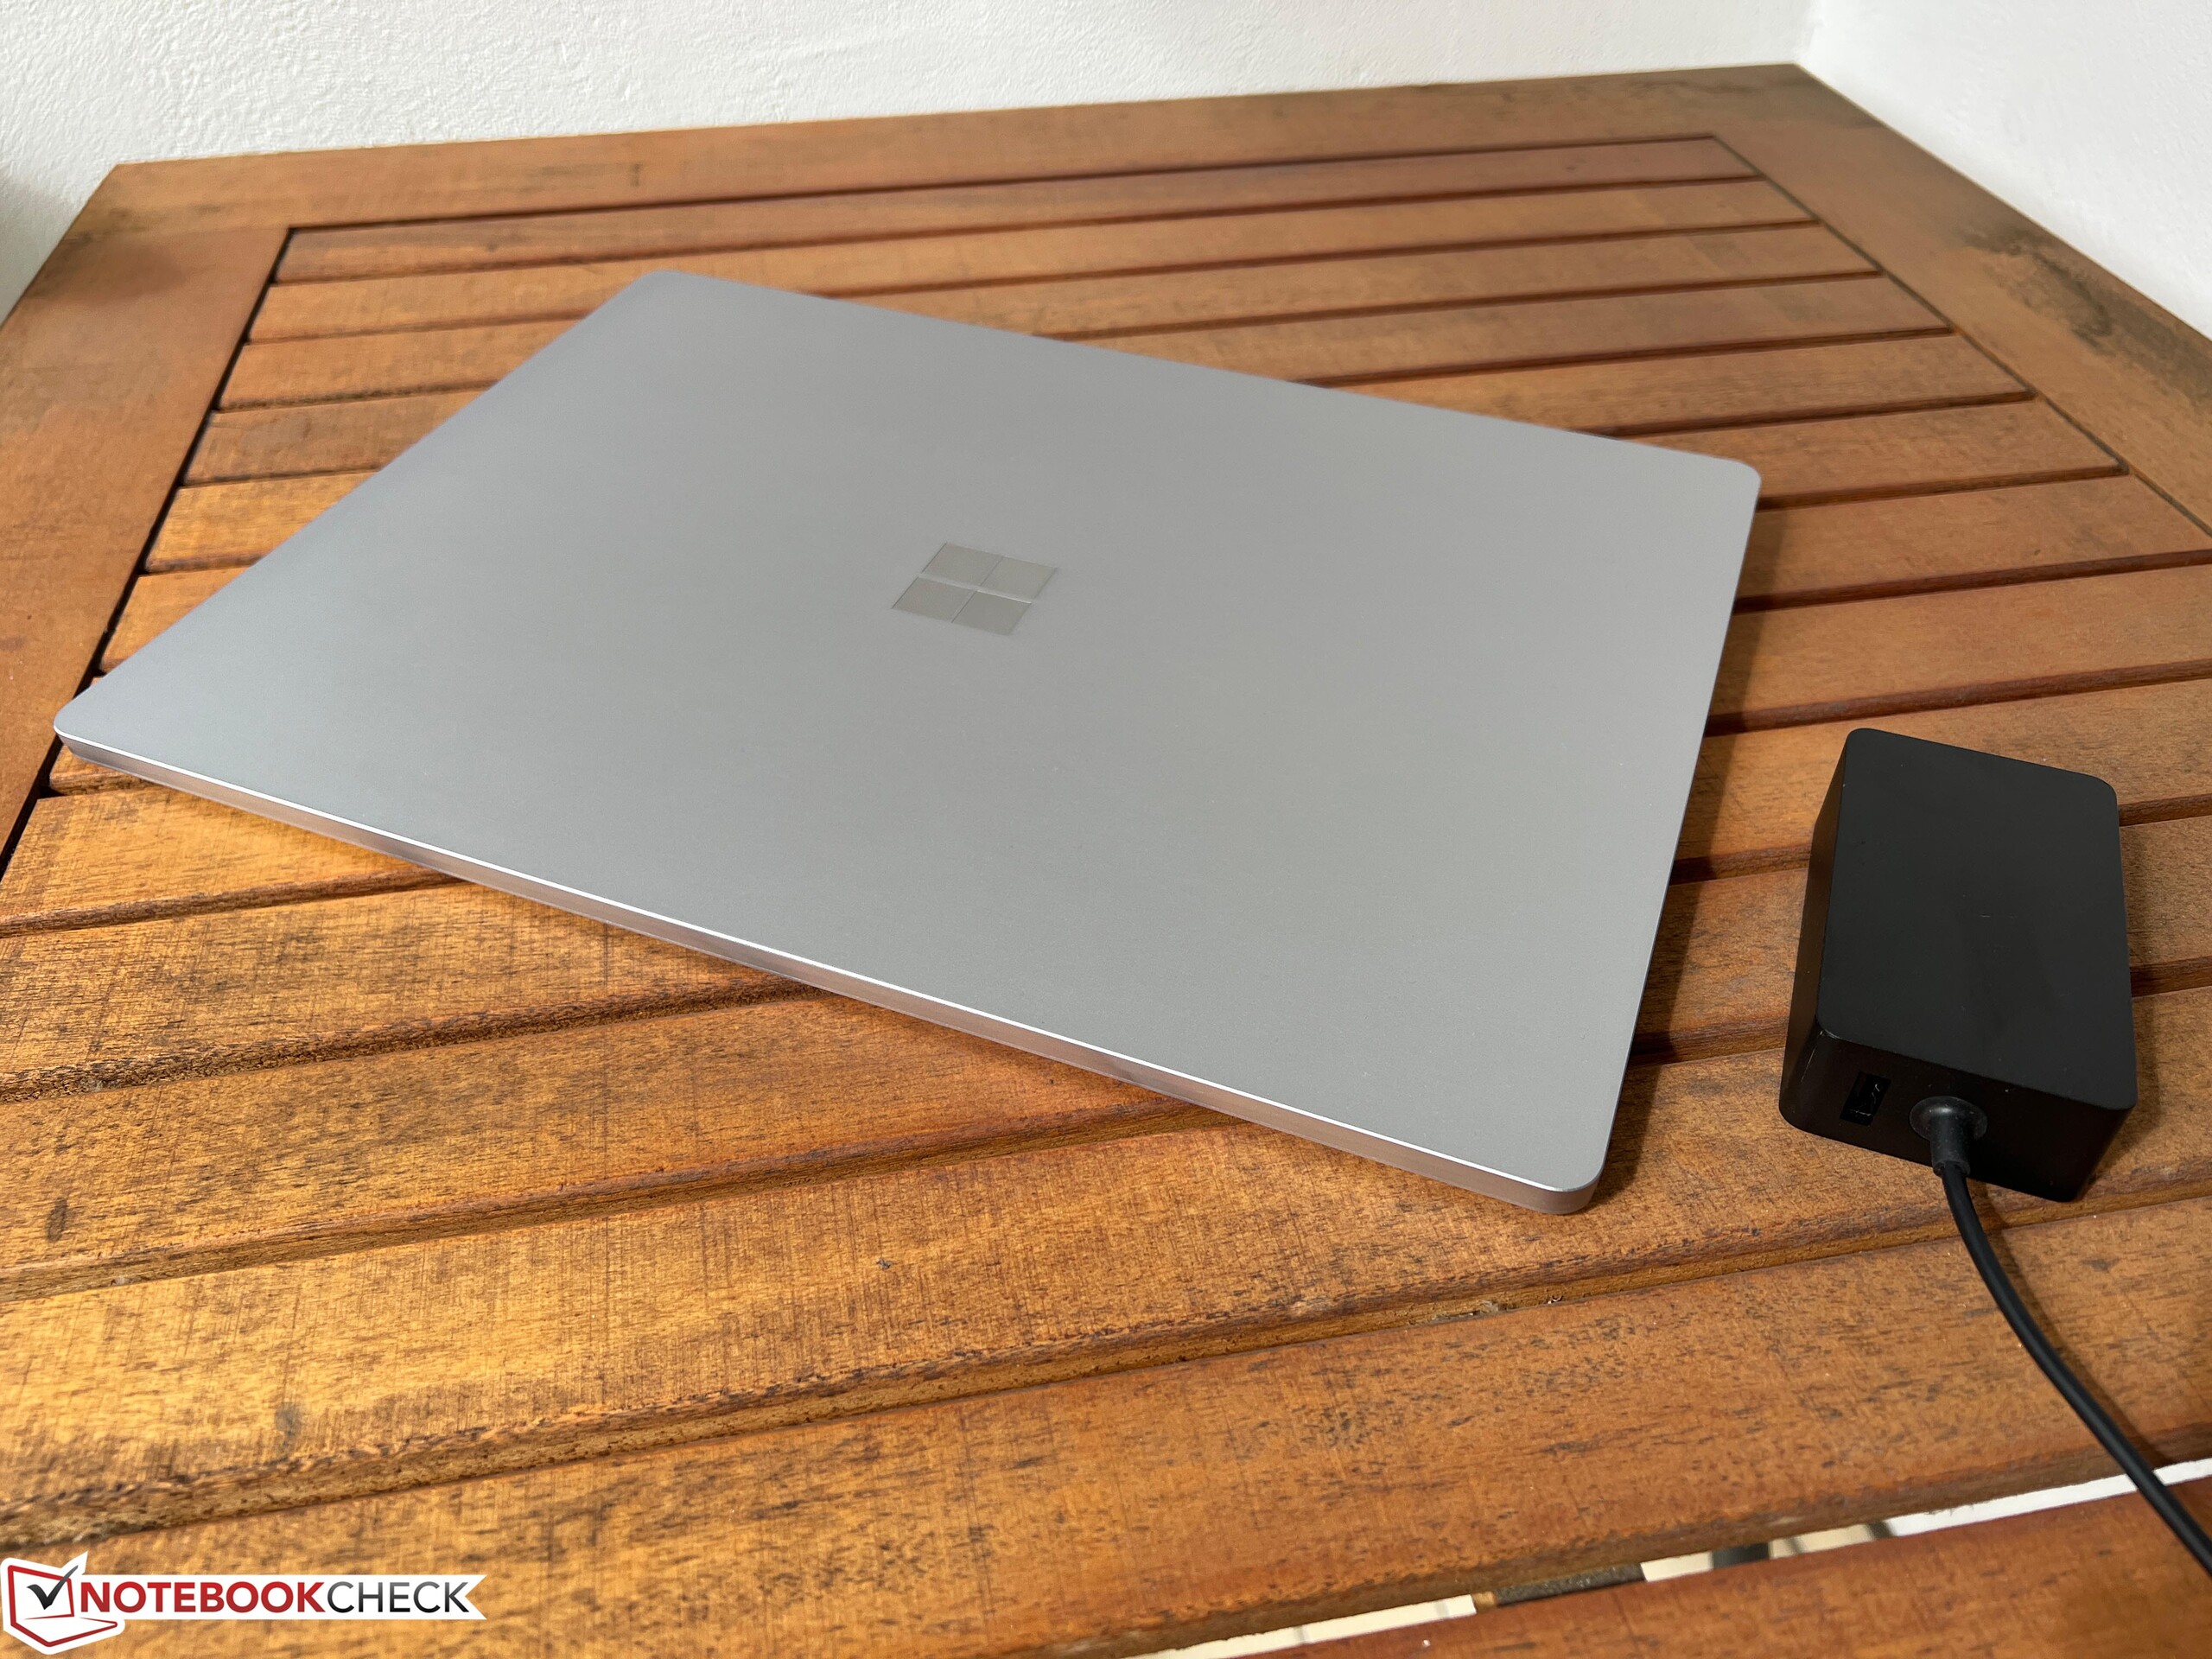
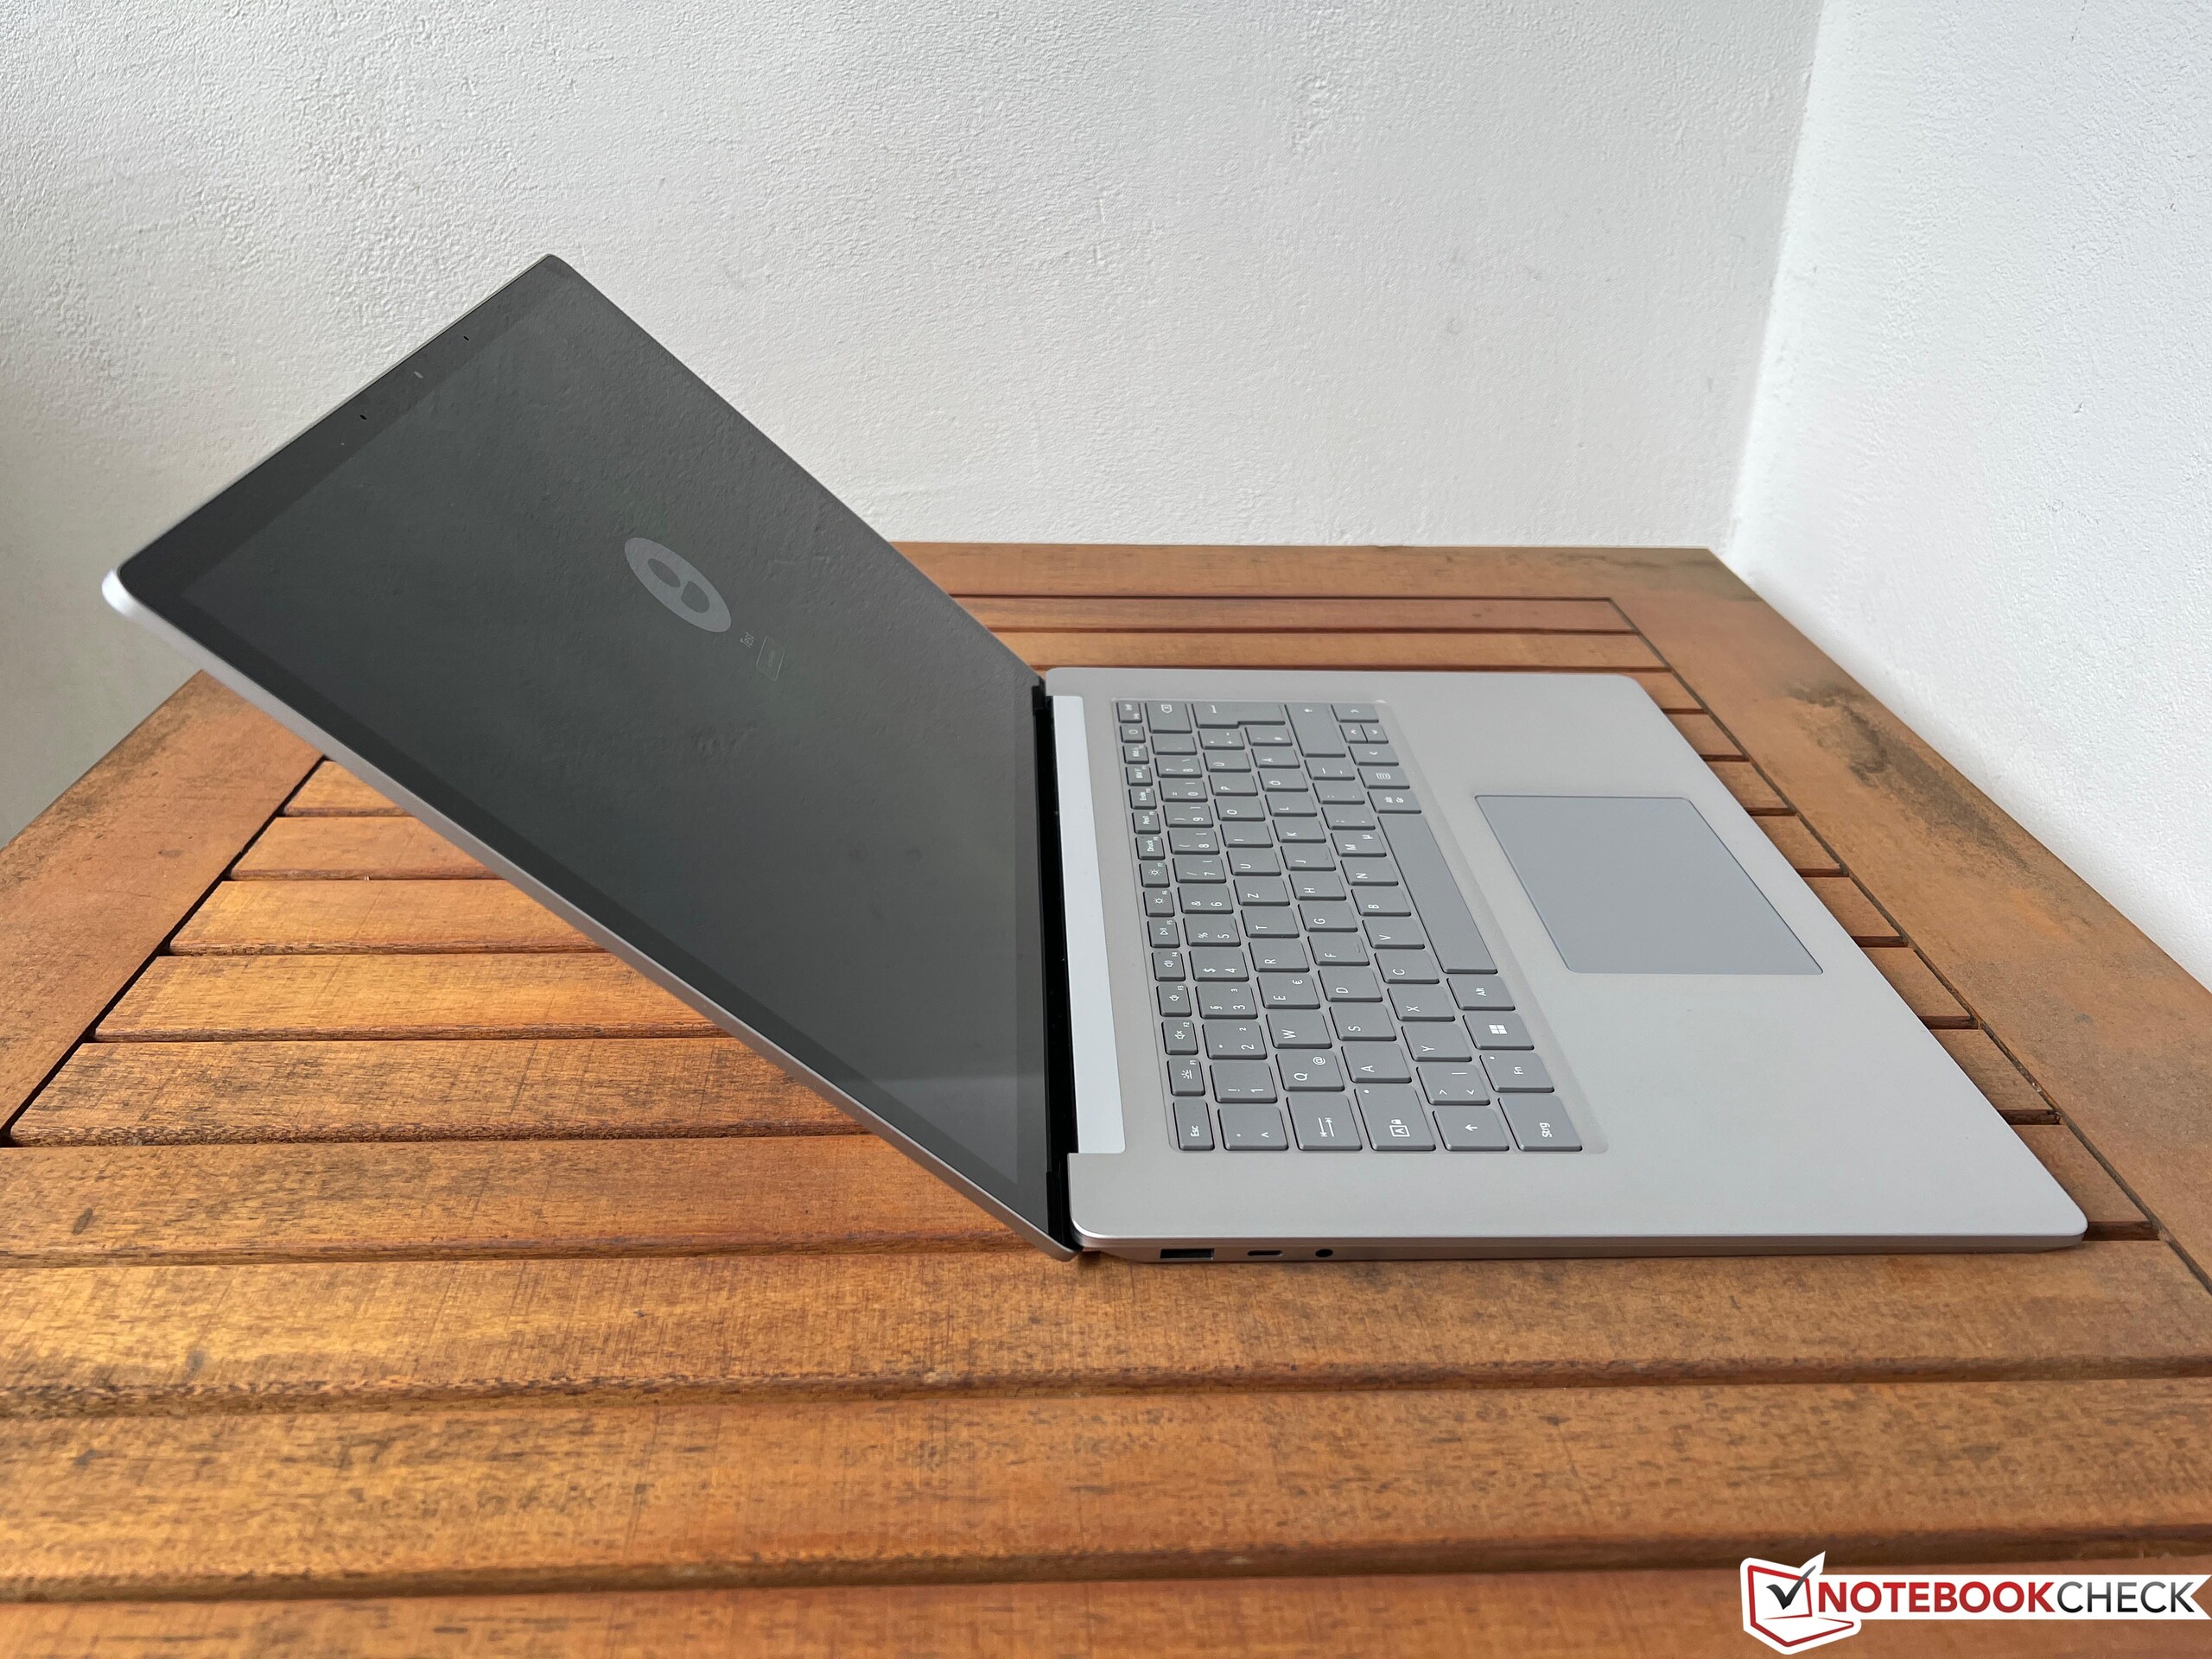
这款笔记本电脑的外壳与前代产品完全相同。微软继续提供铂金和黑色的颜色选择,总的来说,该设备的金属外壳是由高质量的材料制成的--尽管,我们的测试设备在处理时往往会有很多吱吱声。此外,它的宽边框不再是很新的,这最终真正显示了设计的年龄。 屏幕的铰链被适当调整(最大打开角度~135度),但不能防止轻微的摇晃。机箱仍然不能打开,所以用户既不可能清洁风扇,也不可能更换或升级笔记本的任何部件。
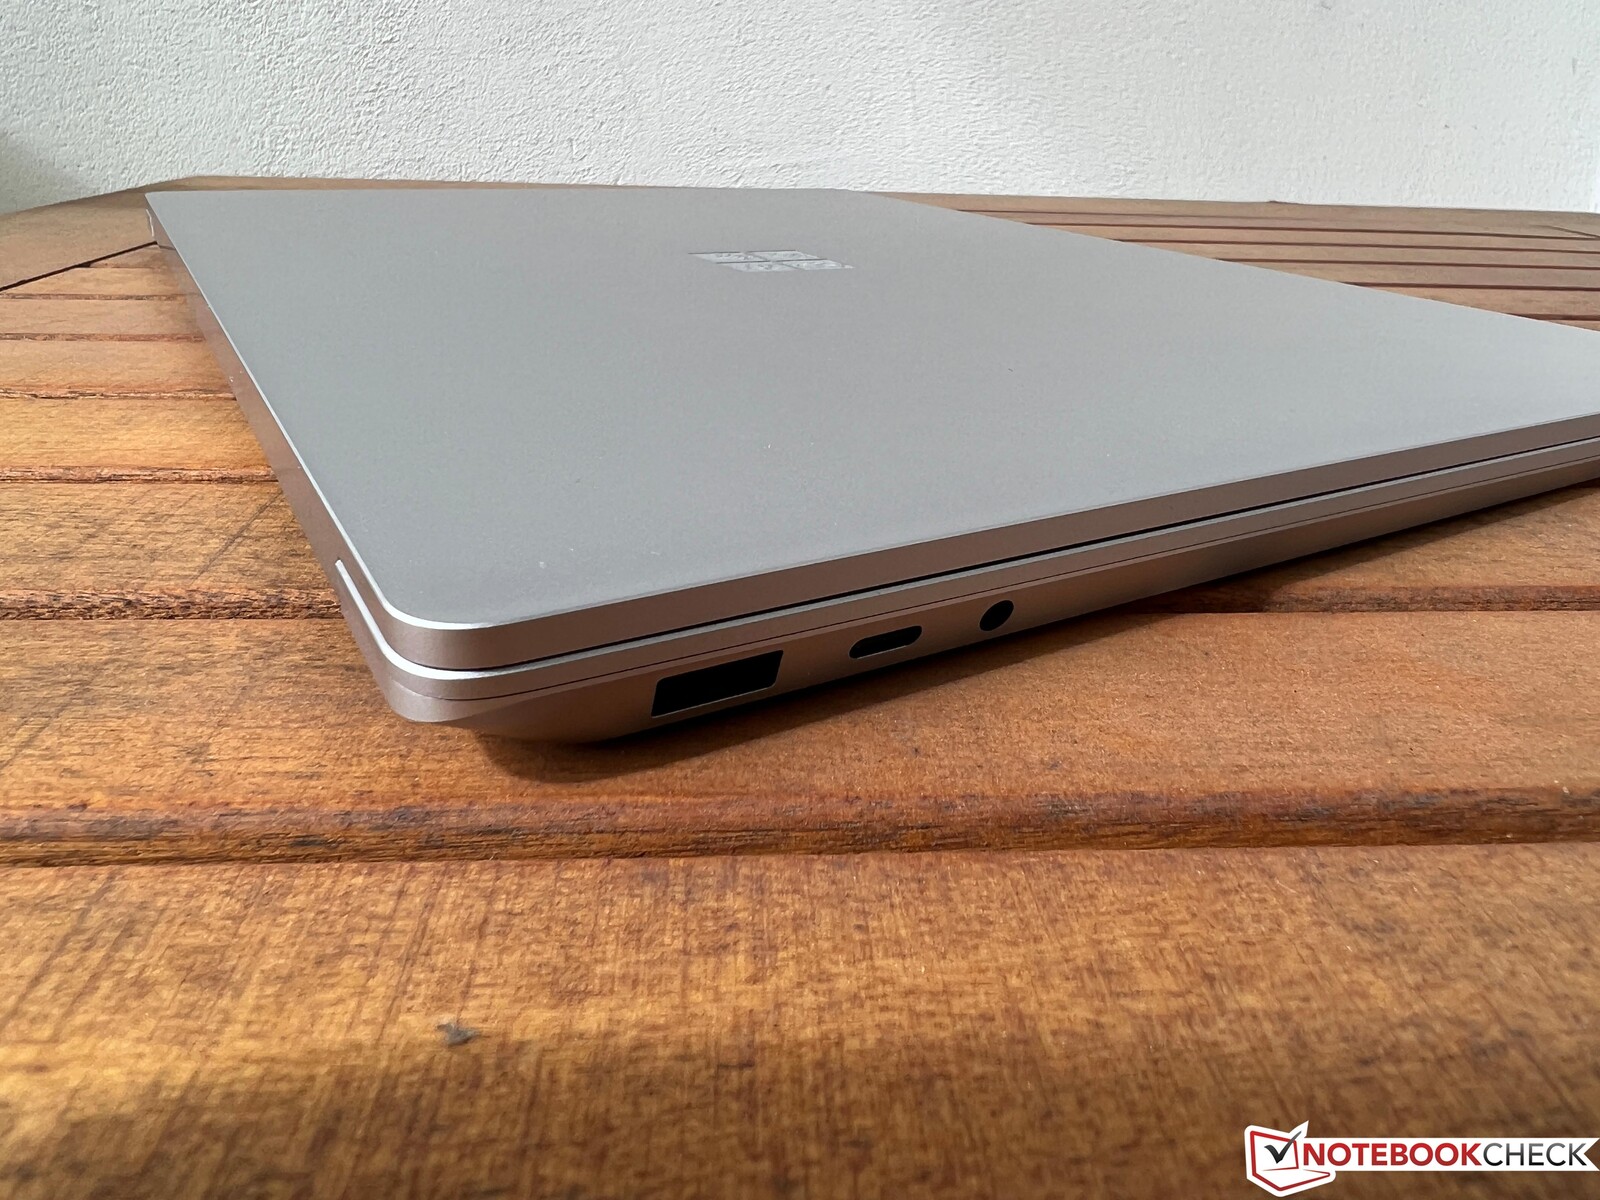
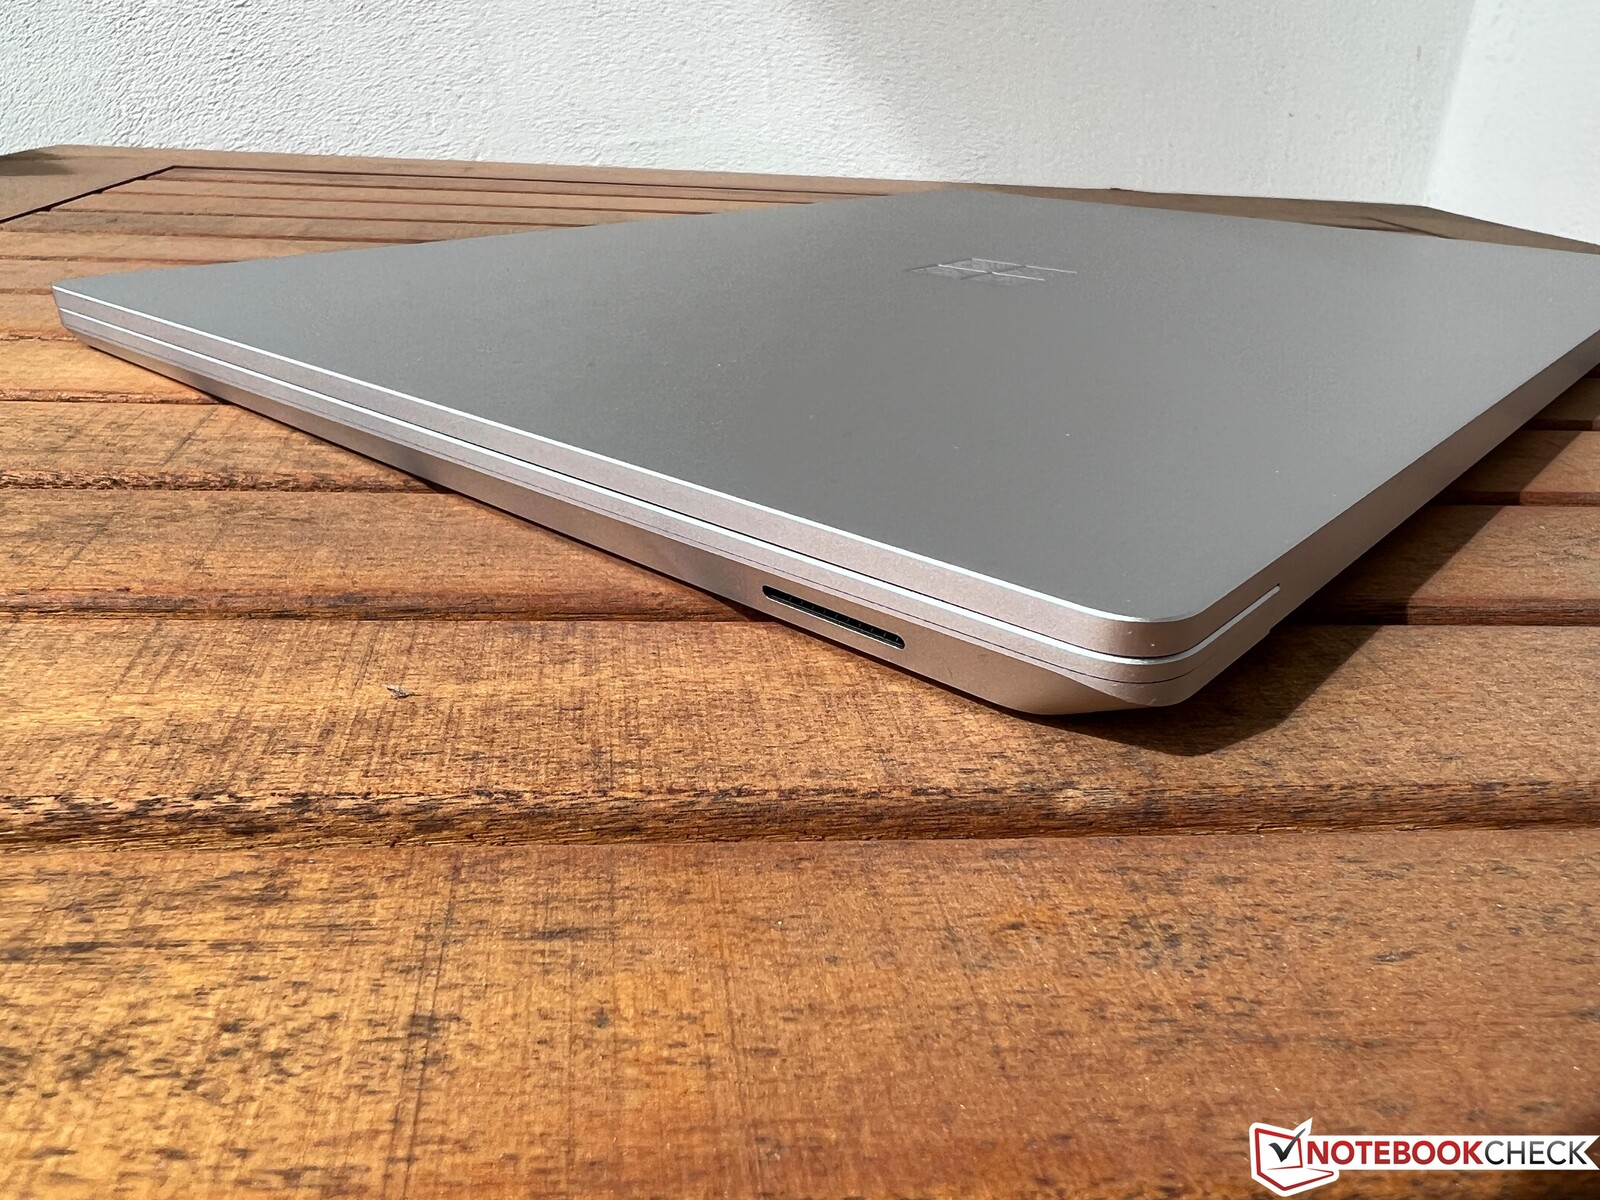
连接也大多与以前一样--尽管现在,USB-C连接终于支持Thunderbolt 4了。至少这里有一些延续性,尽管我们仍然不觉得这个连接器特别实用。然而,考虑到机箱的尺寸,该设备的端口种类非常有限。
笔记本电脑仍然没有SD读卡器,微软保留了旧的AX201 WLAN模块。网络摄像头仍然只有720p的分辨率--尽管在良好的照明条件下,图片质量实际上是有些体面的。

| Networking | |
| Microsoft Surface Laptop 5 15, i7-1255U | |
| iperf3 transmit AXE11000 | |
| iperf3 receive AXE11000 | |
| Microsoft Surface Laptop 4 15 AMD TFF_00028 | |
| iperf3 transmit AX12 | |
| iperf3 receive AX12 | |
| LG Gram 15Z90Q | |
| iperf3 transmit AXE11000 | |
| iperf3 receive AXE11000 | |
| Dell XPS 15 9520 RTX 3050 Ti | |
| iperf3 transmit AXE11000 | |
| iperf3 receive AXE11000 | |
| Samsung Galaxy Book Pro 15 NP950XDB-KC5US | |
| iperf3 transmit AX12 | |
| iperf3 receive AX12 | |
| Asus Zenbook Pro 15 OLED UM535Q | |
| iperf3 transmit AX12 | |
| iperf3 receive AX12 | |


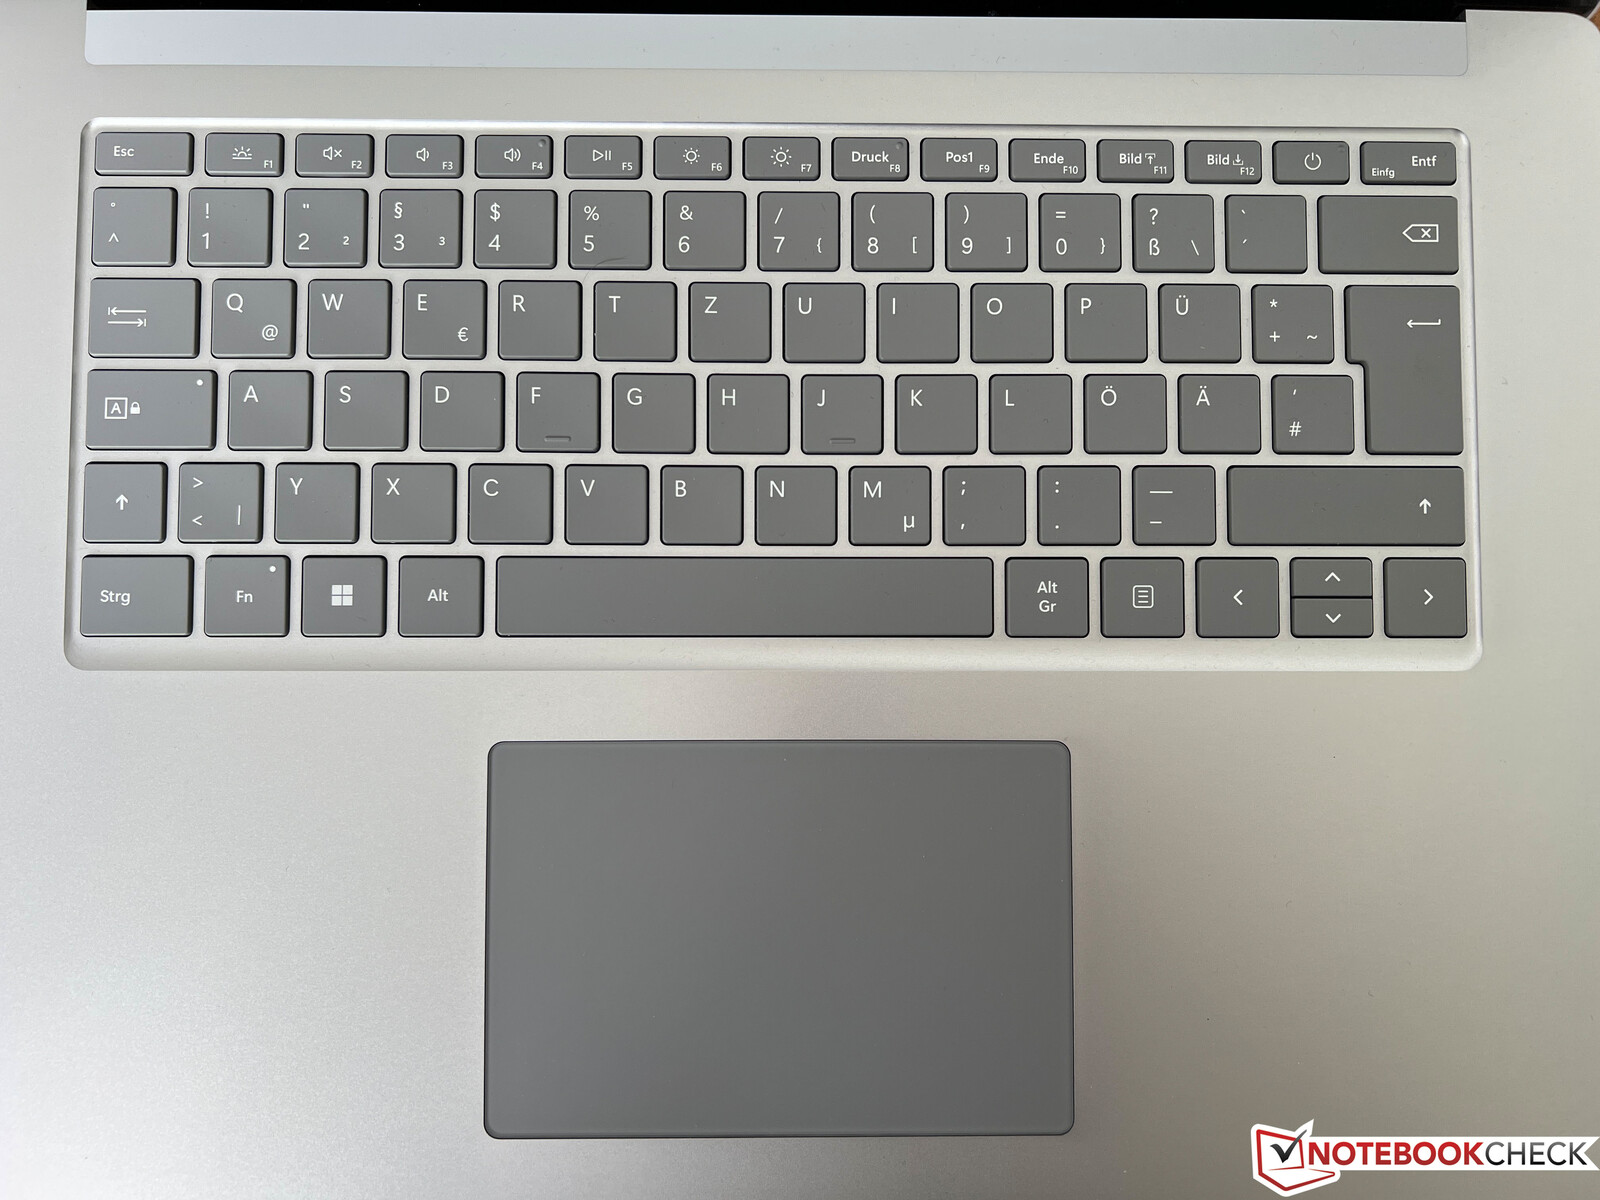
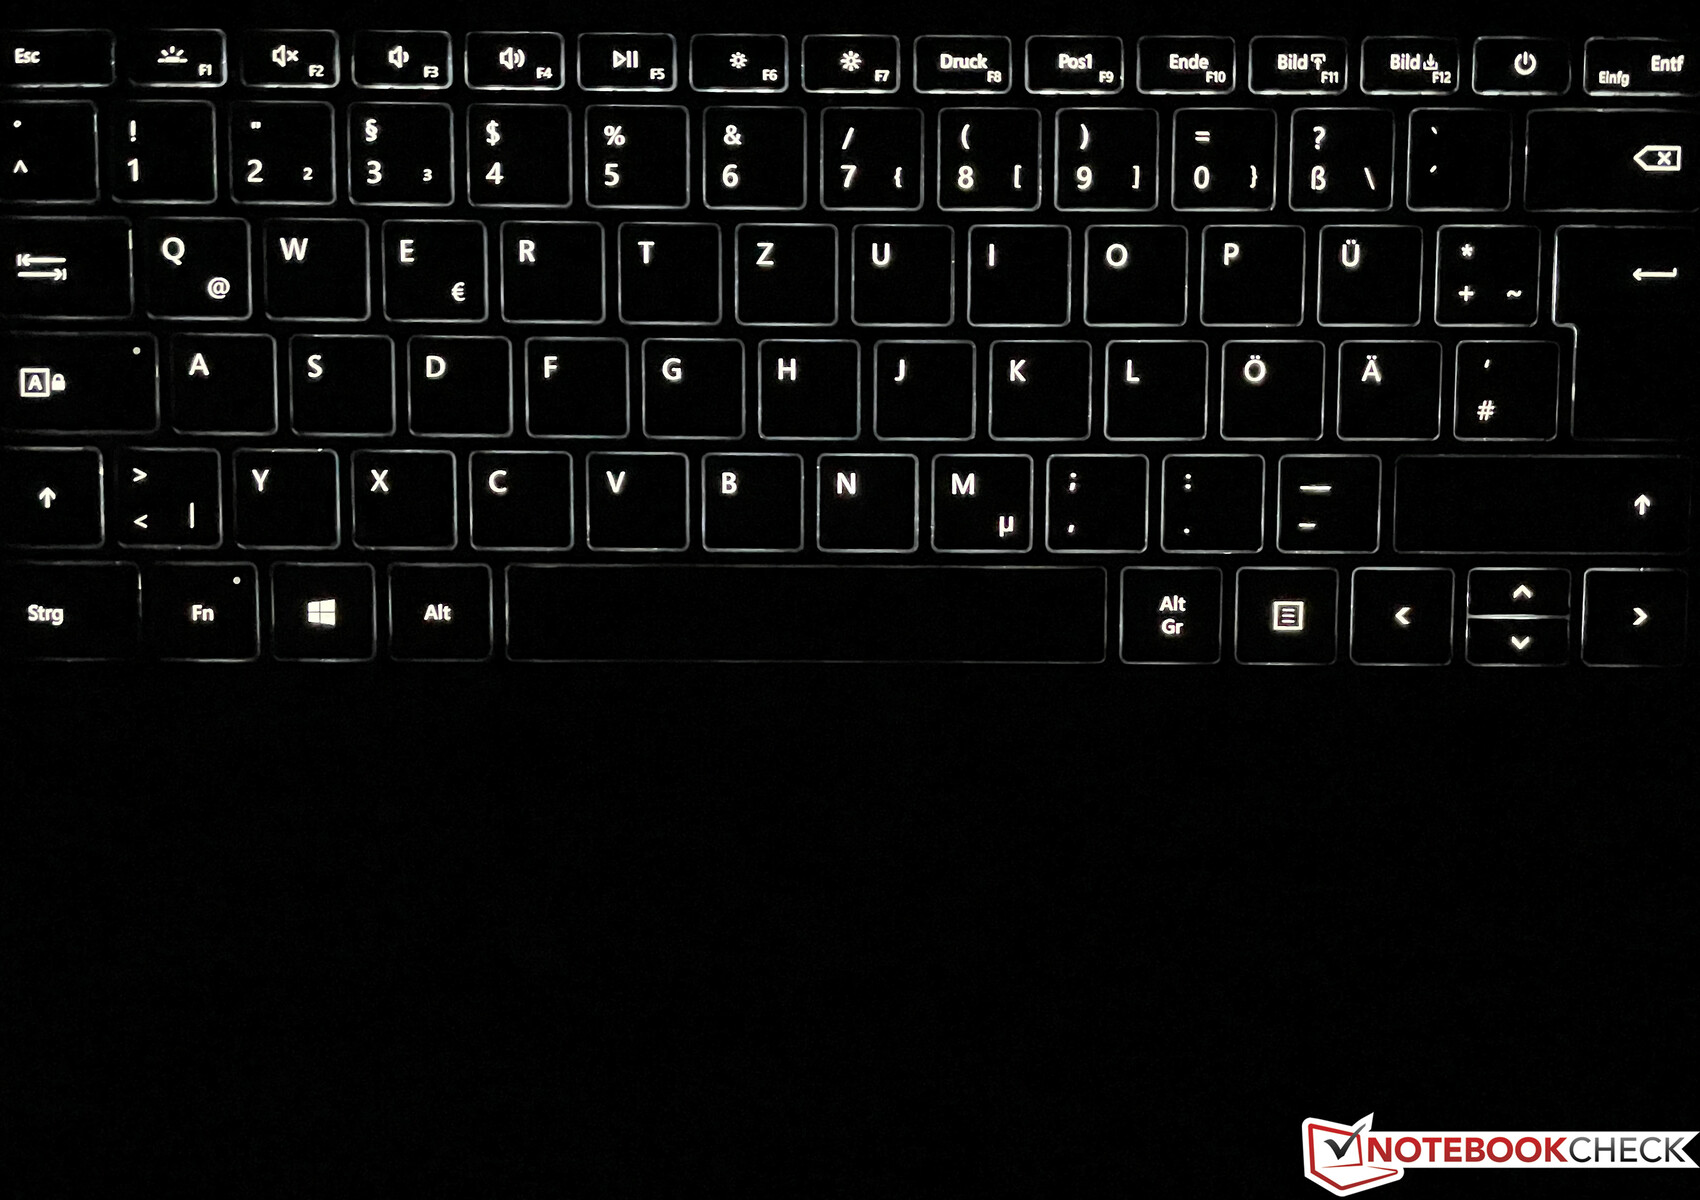
输入设备 - 背光键盘和小型点击板
输入设备也采用了以前的型号。总的来说,当你打字时,键盘的感觉还可以,但它的大键仍然倾向于发出一点响声。你肯定可以用该设备写较长的文字,但市场上显然有更好的键盘。键盘的白色背光灯有三个调节级别。
点击板给人的印象相当好,正常的指针控制也不会造成任何问题。点击噪音也不是太大。其11.5 x 7.7厘米的尺寸仍然足够,但肯定会有更多的空间用于更大的垫子。
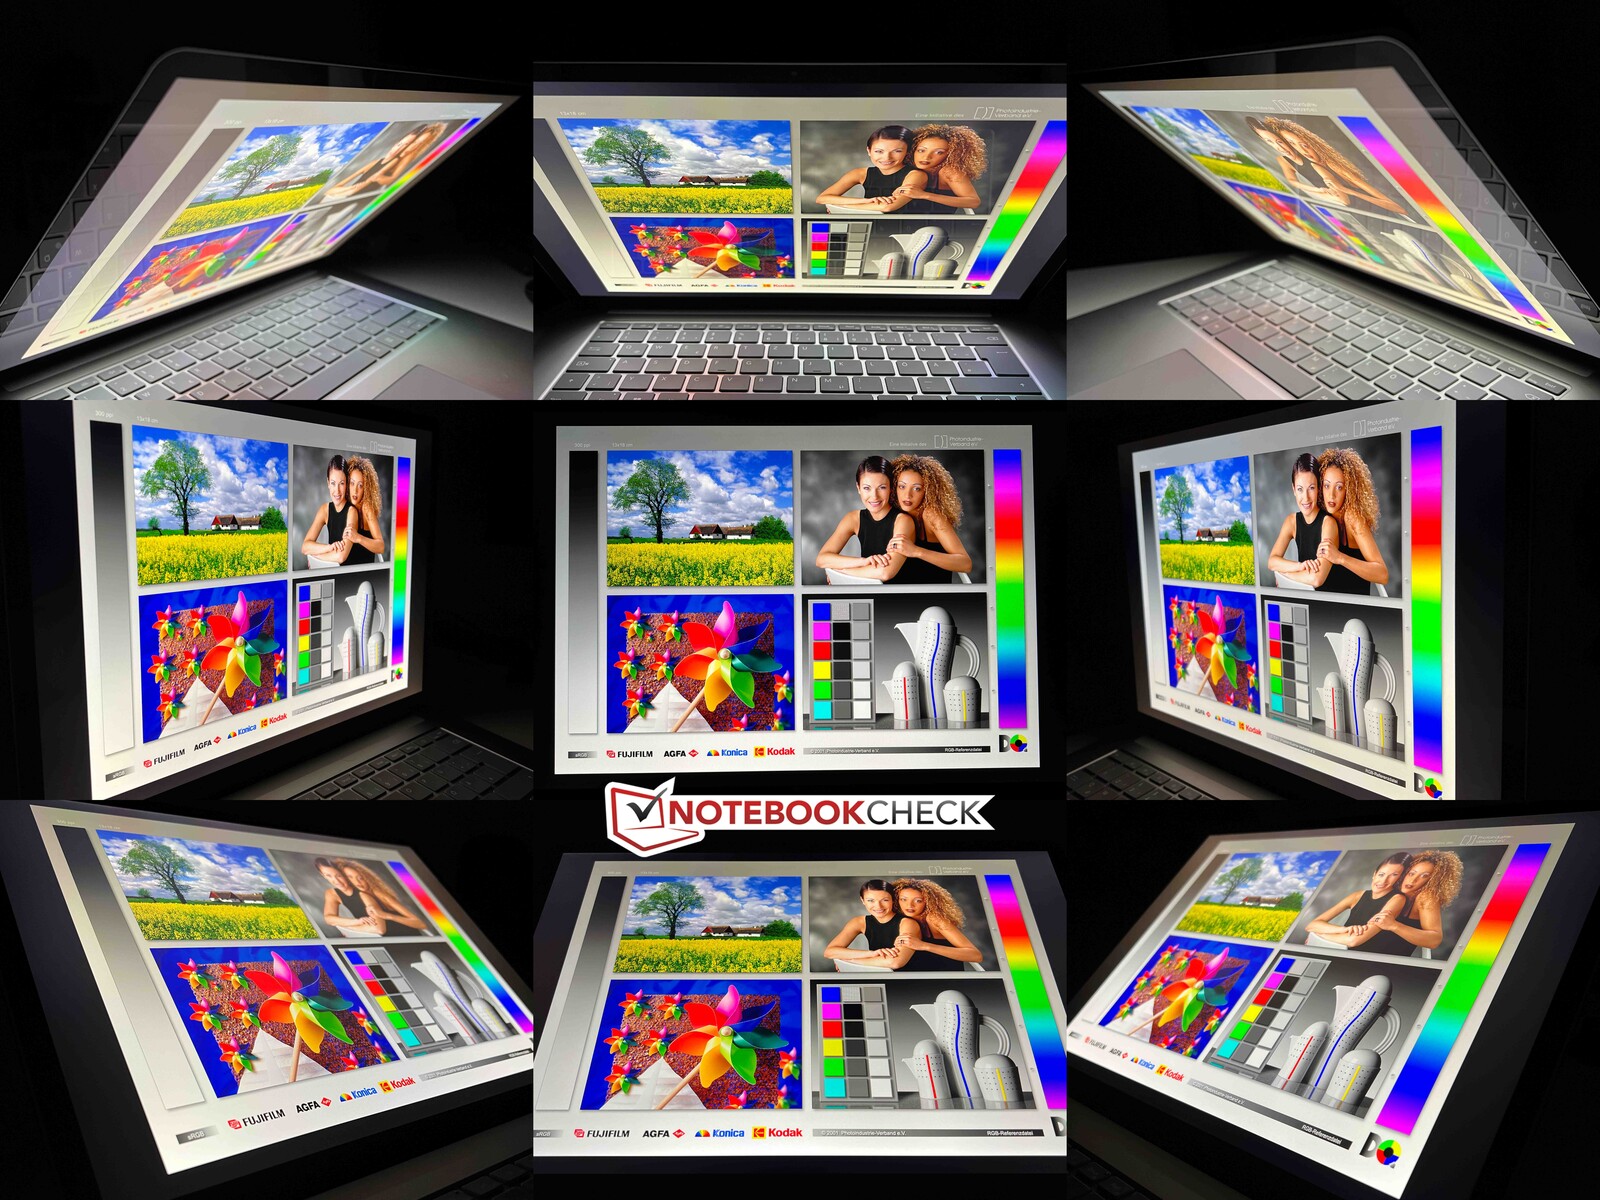
显示屏 - PixelSense触摸屏
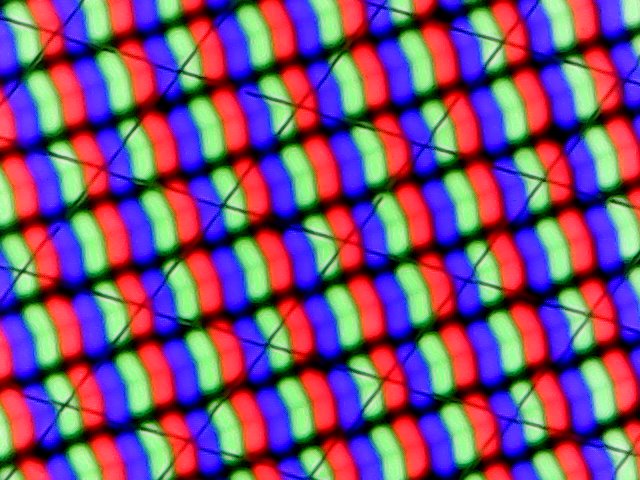
15英寸显示屏的分辨率仍为2,496 x 1,664像素,长宽比为3:2。主观上,触摸屏的画质看起来仍然很好,但是笔记本电脑的技术规格60赫兹和sRGB覆盖率已经不是很新潮了,特别是对于这个价格范围。该设备的亮度为400cd/m²,我们测量的最高亮度为438cd/m²(平均~400cd/m²)。它的黑值为0.29,还算可以,这导致了近1400:1的对比度。
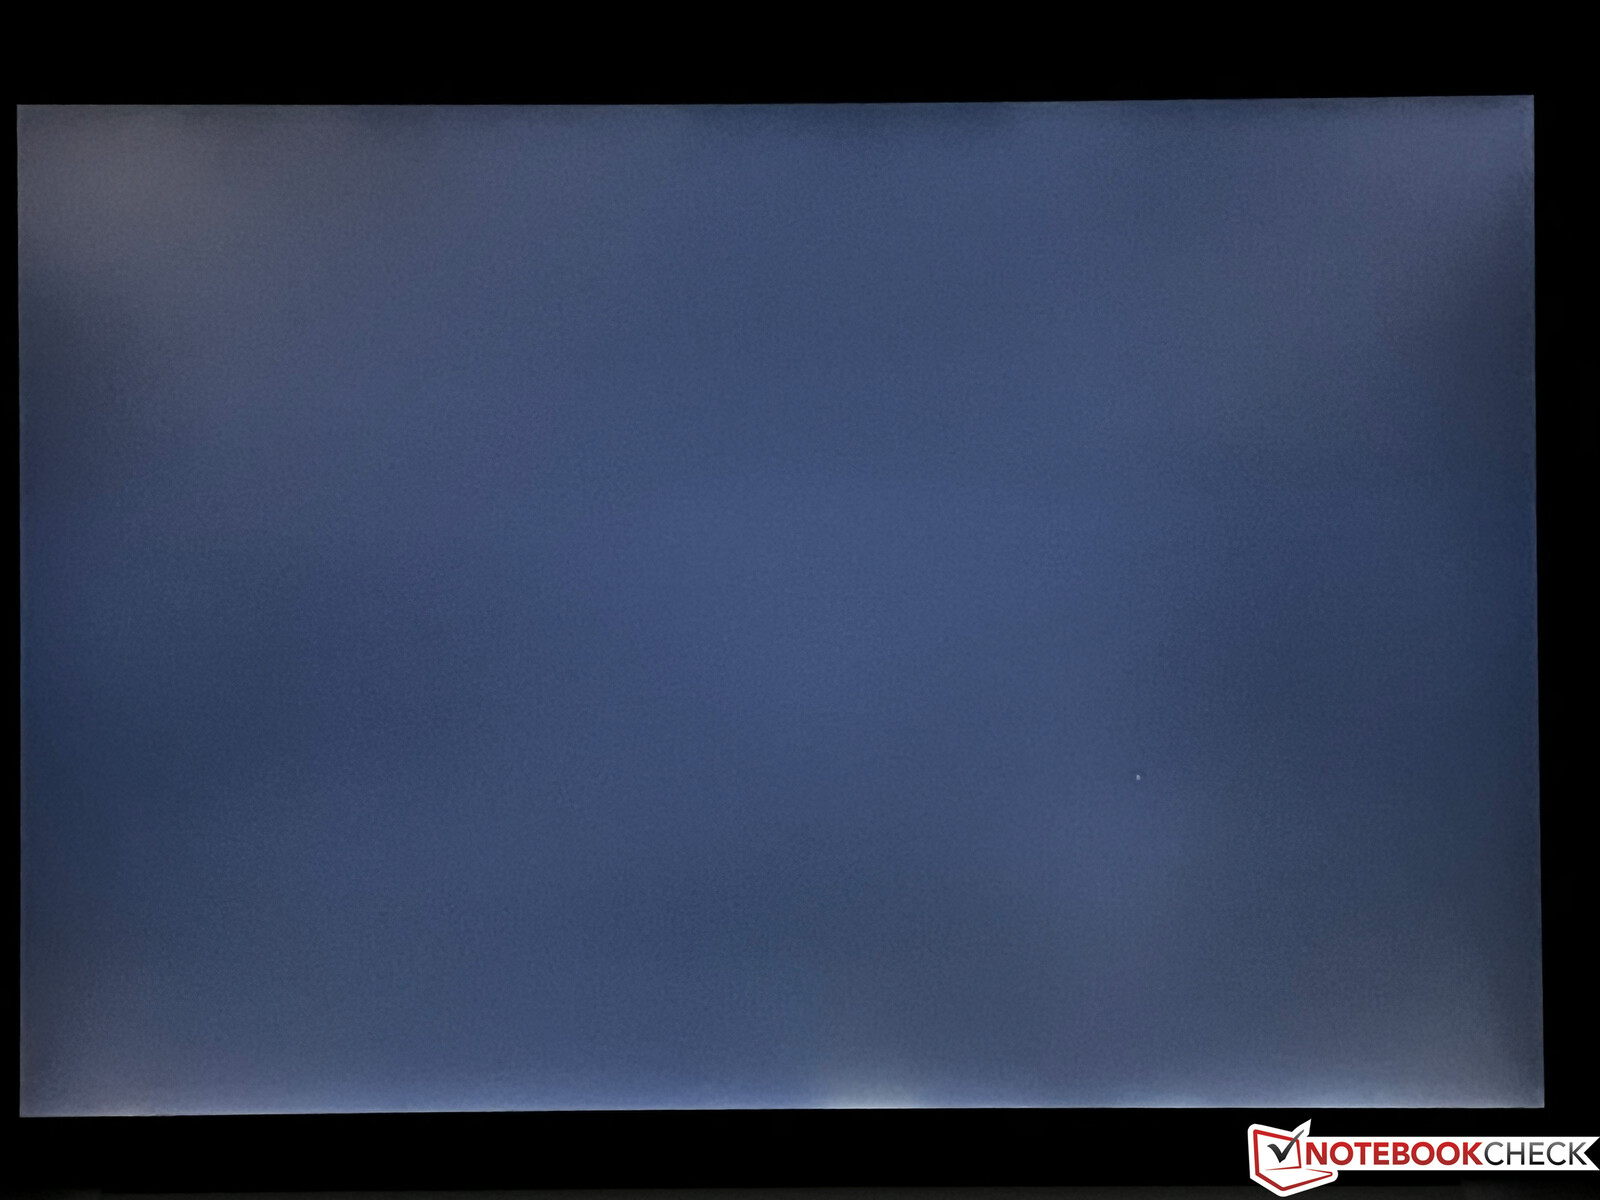
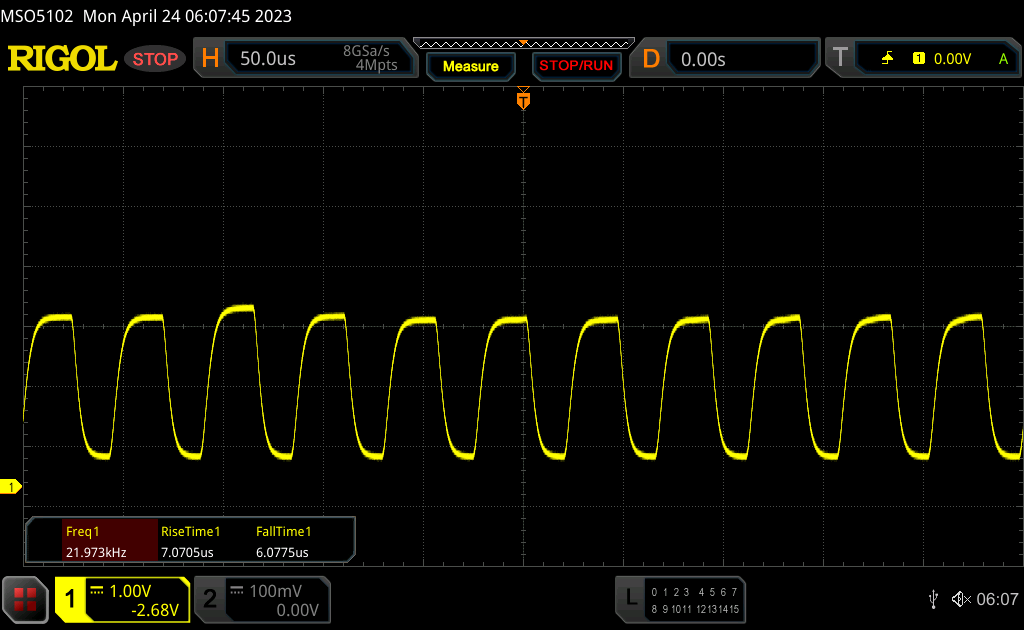
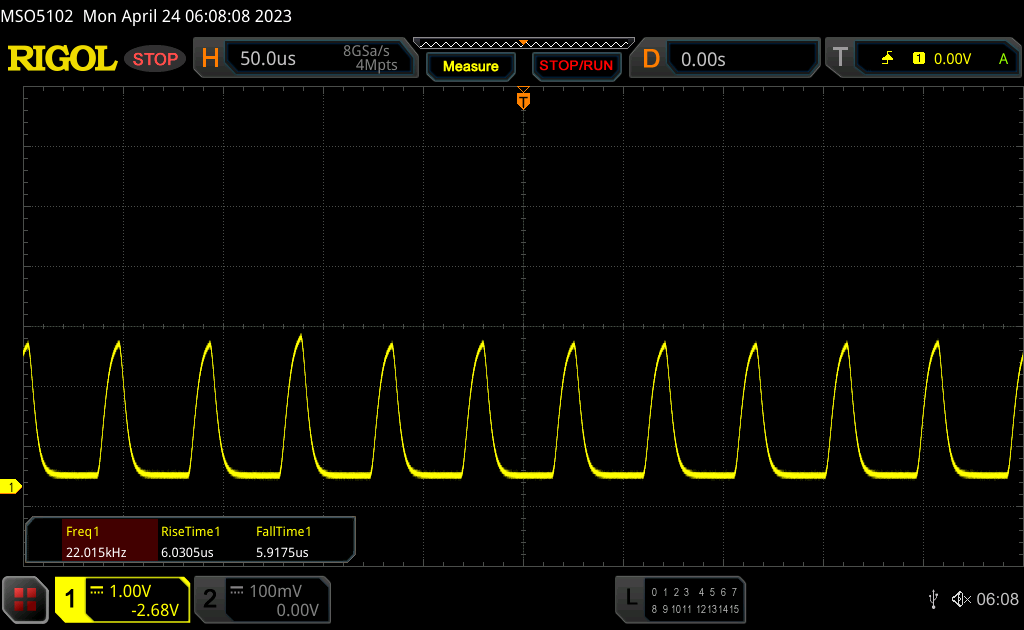
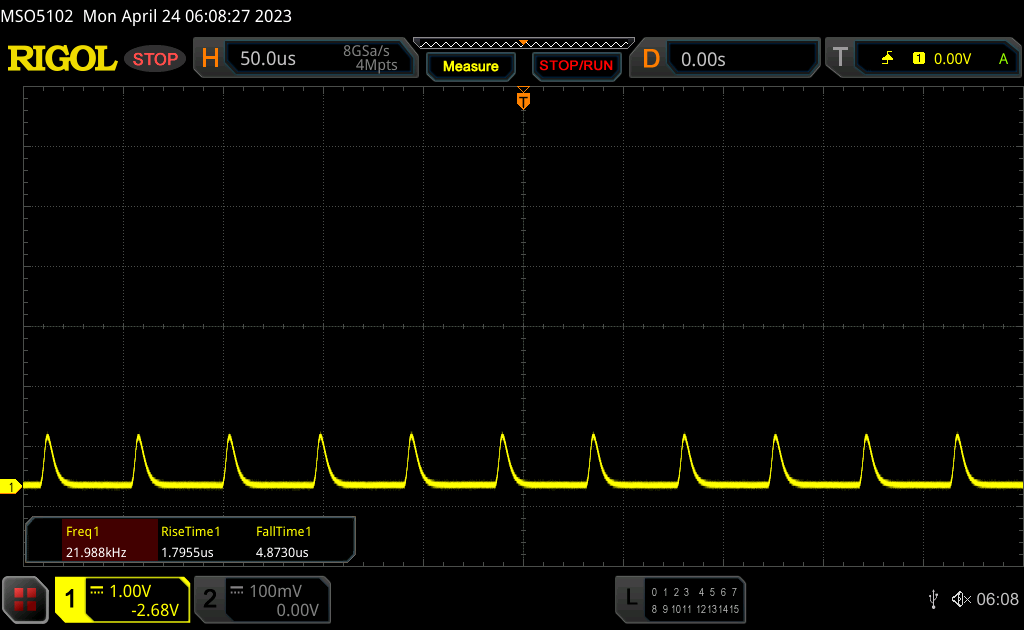
该面板在高亮度水平和黑色背景下向屏幕下部边缘显示轻微的屏幕出血,但这在日常使用中应该不会太令人讨厌。在50%或更低的亮度下也可以看到PWM,但其~22 kHz的频率非常高,应该不会对用户造成任何问题。
| |||||||||||||||||||||||||
Brightness Distribution: 85 %
Center on Battery: 395 cd/m²
Contrast: 1369:1 (Black: 0.29 cd/m²)
ΔE ColorChecker Calman: 0.8 | ∀{0.5-29.43 Ø4.71}
ΔE Greyscale Calman: 1.1 | ∀{0.09-98 Ø4.96}
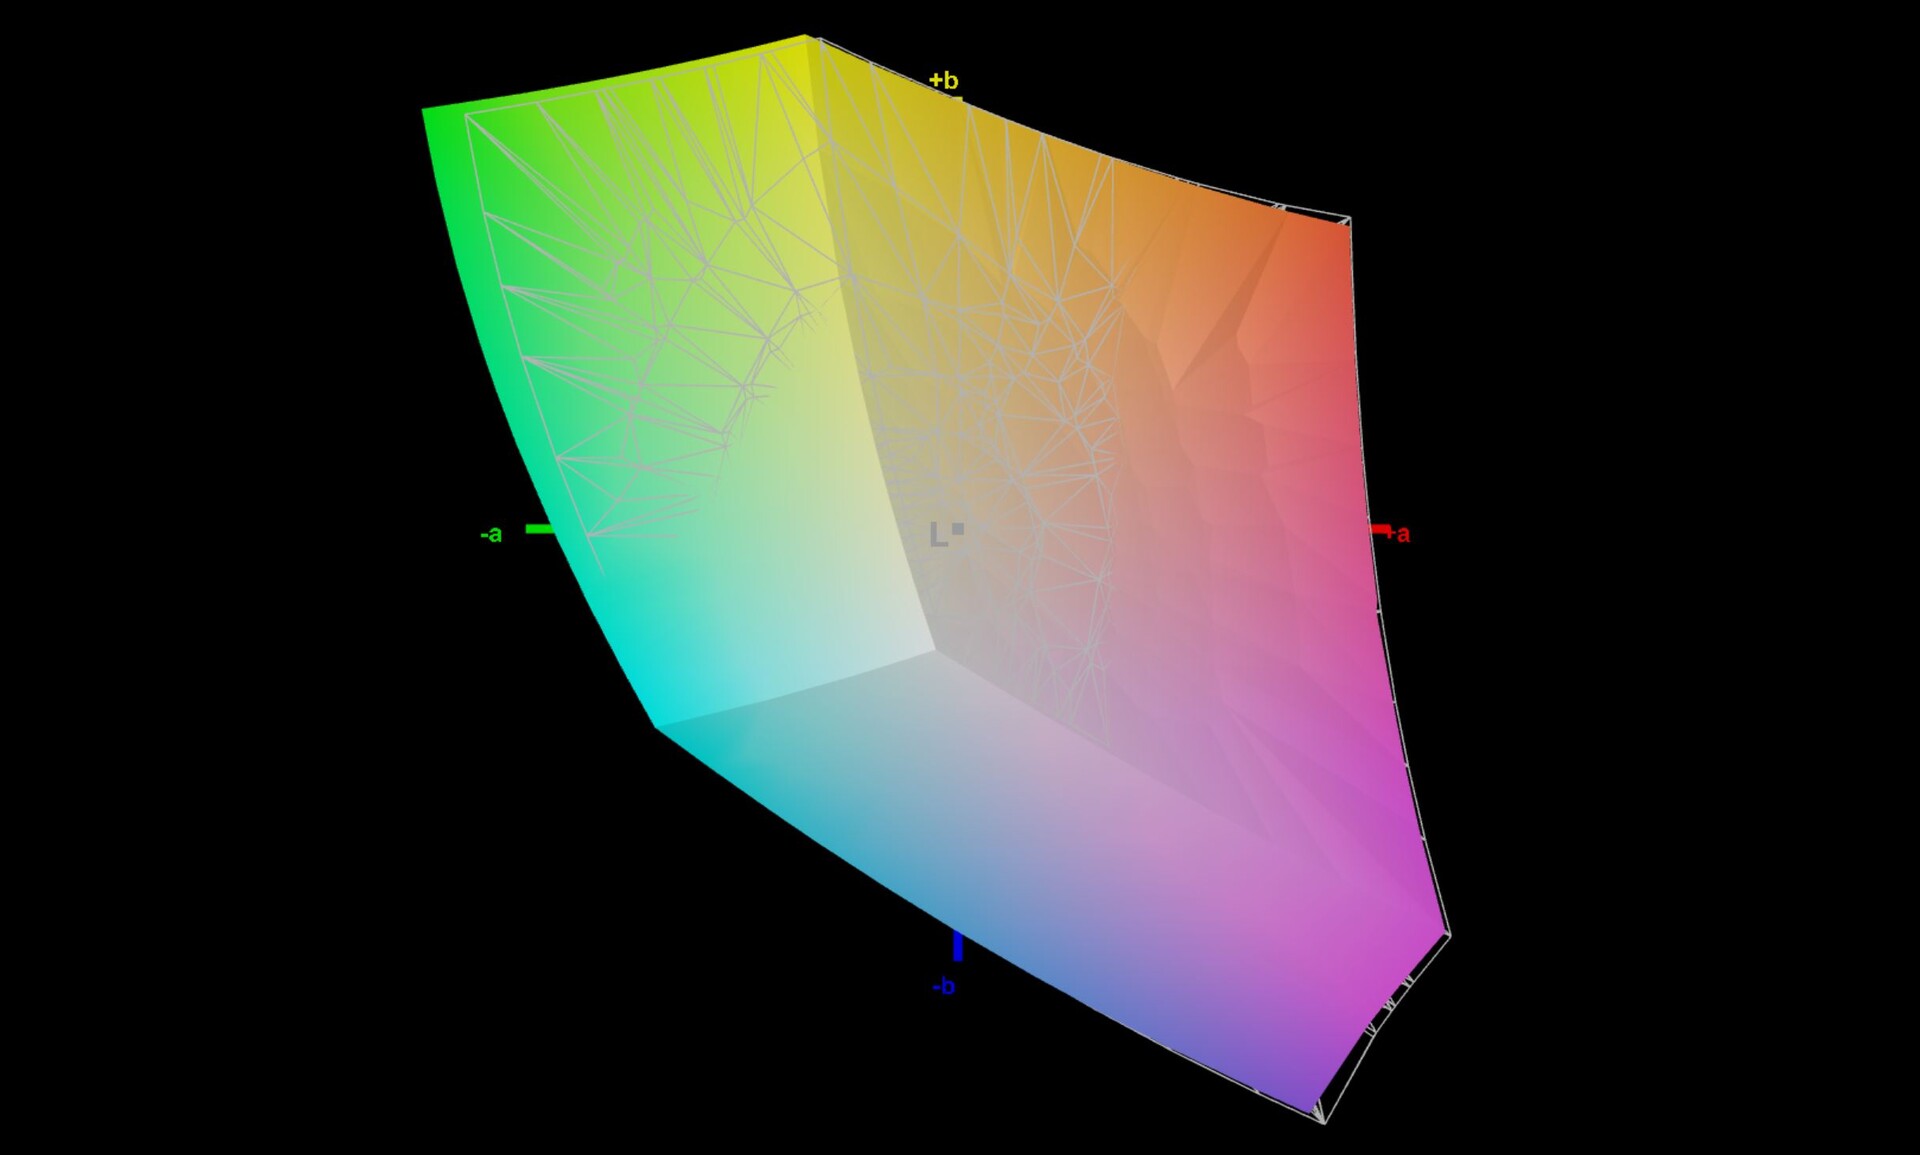
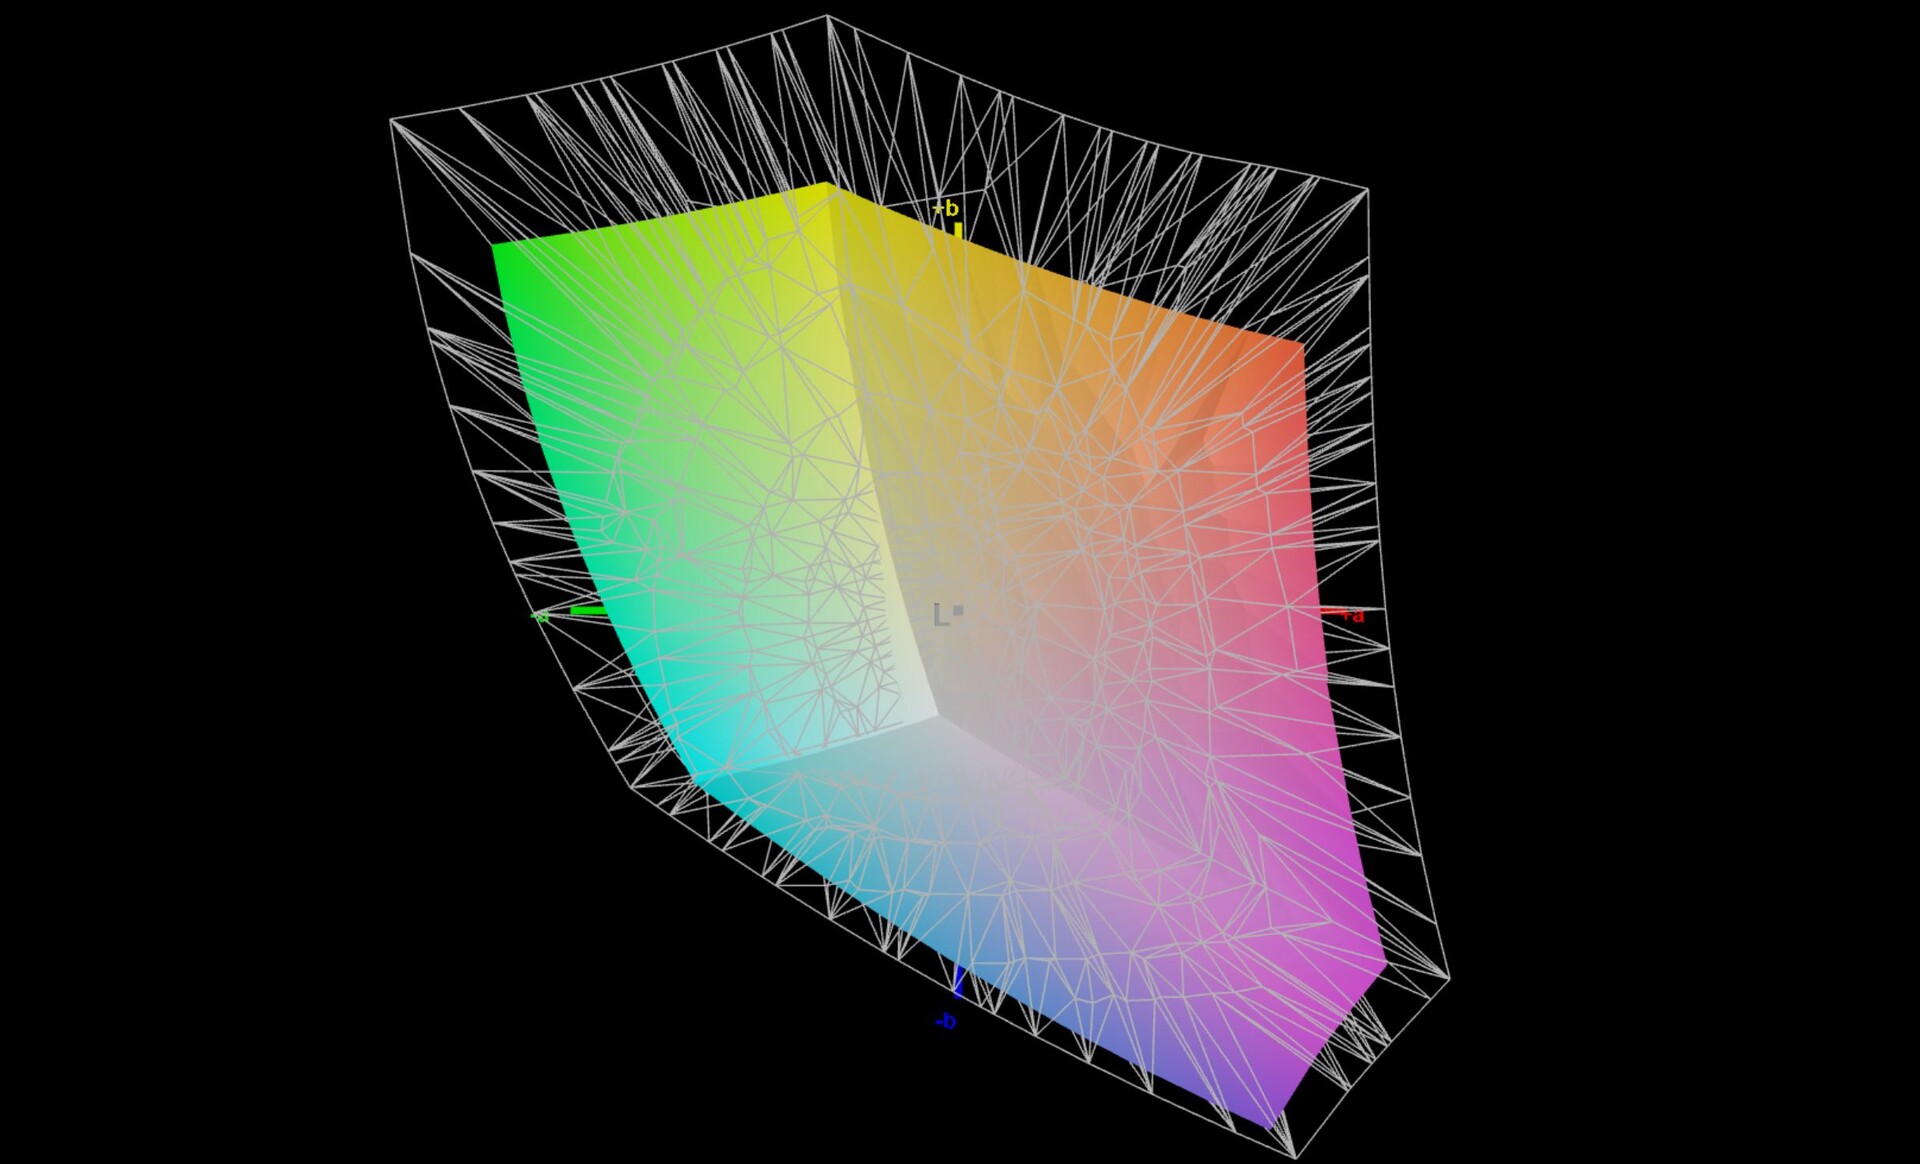
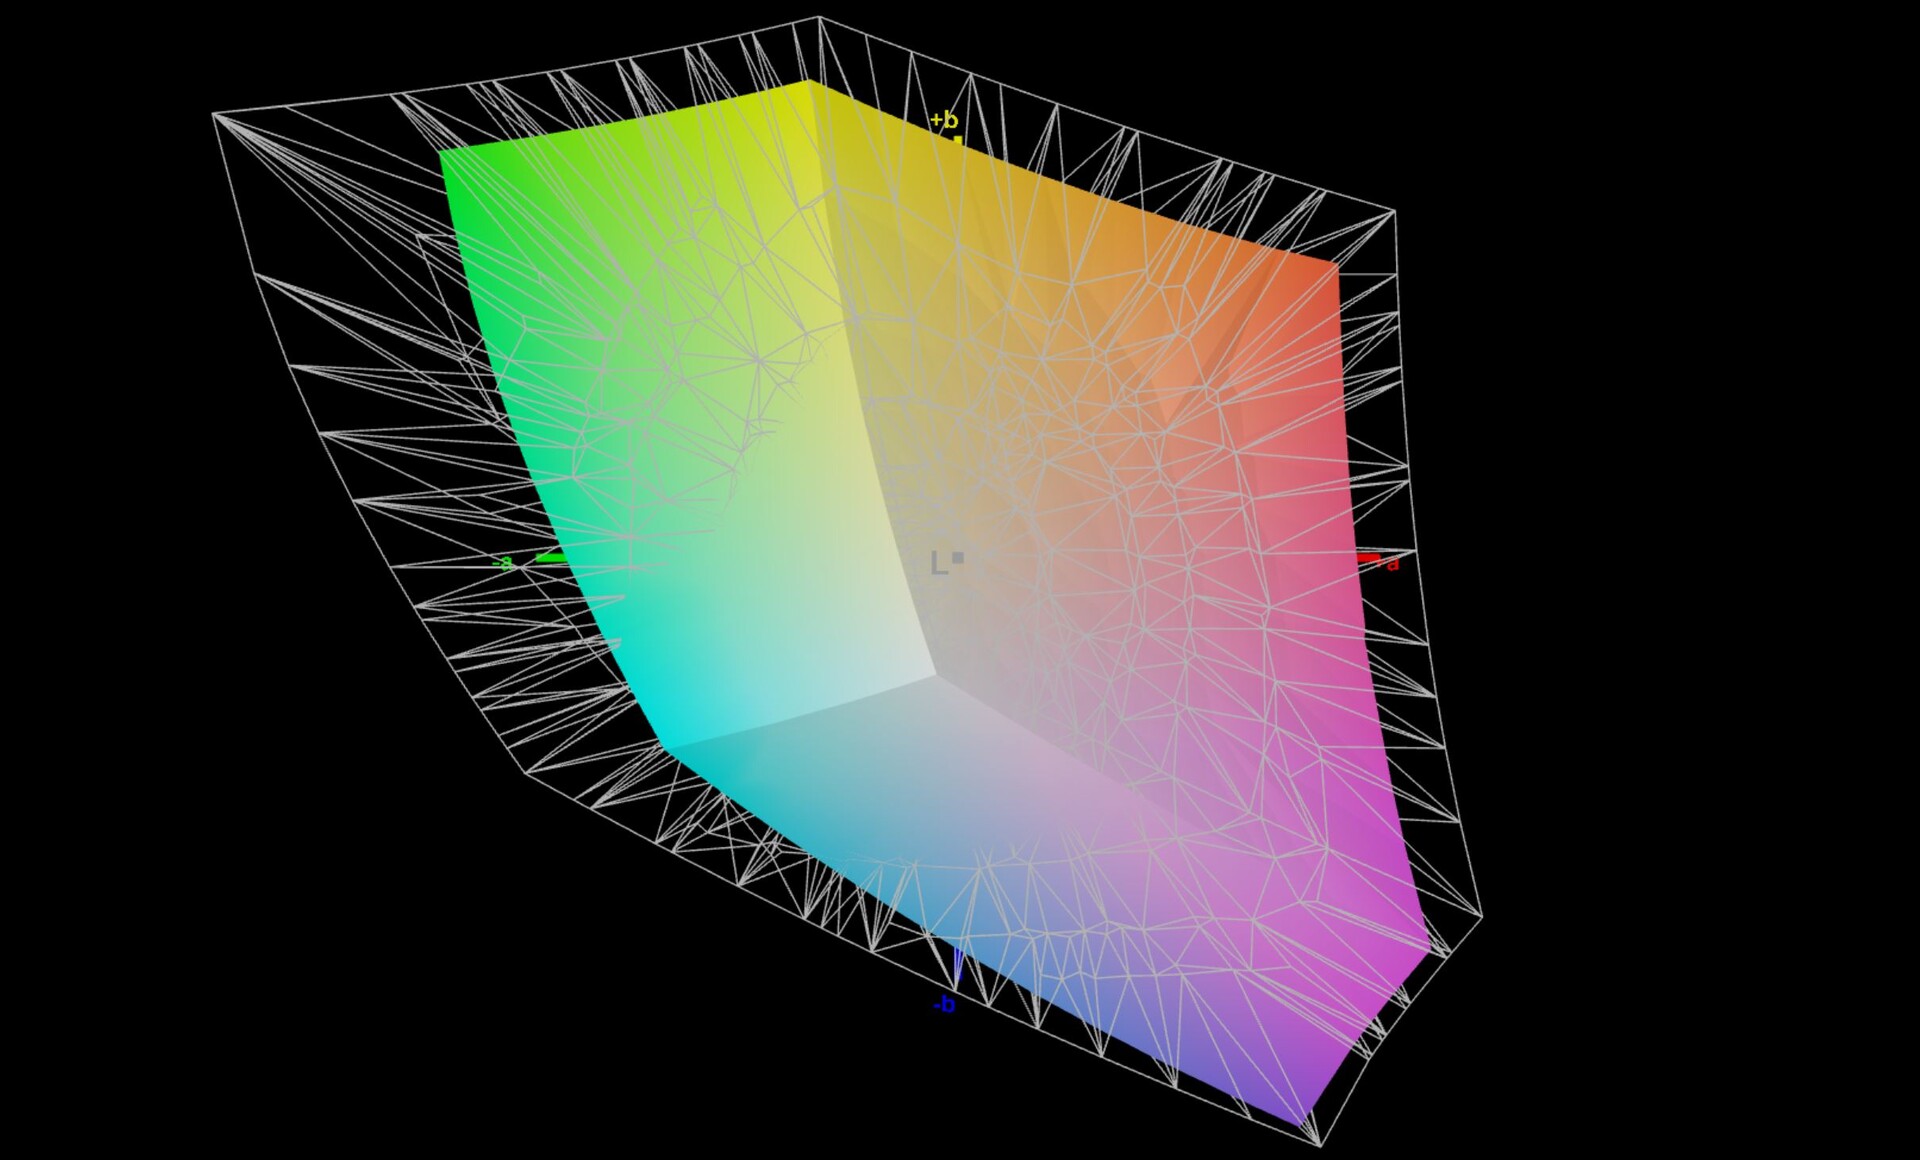
70.3% AdobeRGB 1998 (Argyll 3D)
97.3% sRGB (Argyll 3D)
68.1% Display P3 (Argyll 3D)
Gamma: 2.18
CCT: 6705 K
| Microsoft Surface Laptop 5 15, i7-1255U LQ150P1JX51, IPS, 2496x1664, 15" | Microsoft Surface Laptop 4 15 AMD TFF_00028 SHP14B4, IPS, 2496x1664, 15" | LG Gram 15Z90Q LG LP156WFC-SPZ2 (LGD0706), IPS, 1920x1080, 15.6" | Dell XPS 15 9520 RTX 3050 Ti Samsung 156XG01, OLED, 3456x2160, 15.6" | Samsung Galaxy Book Pro 15 NP950XDB-KC5US Samsung ATNA56YX02-0, AMOLED, 1920x1080, 15.6" | Asus Zenbook Pro 15 OLED UM535Q Samsung ATNA56YX03-0, OLED, 1920x1080, 15.6" | |
|---|---|---|---|---|---|---|
| Display | -3% | -5% | 23% | 24% | 13% | |
| Display P3 Coverage (%) | 68.1 | 65.2 -4% | 63.5 -7% | 97.8 44% | 87.6 29% | 79.3 16% |
| sRGB Coverage (%) | 97.3 | 97.7 0% | 95 -2% | 99.9 3% | 100 3% | 95.6 -2% |
| AdobeRGB 1998 Coverage (%) | 70.3 | 67.3 -4% | 65.1 -7% | 86 22% | 99.3 41% | 87.3 24% |
| Response Times | -10% | 20% | 95% | 94% | 94% | |
| Response Time Grey 50% / Grey 80% * (ms) | 52.4 ? | 58.4 ? -11% | 48.4 ? 8% | 1.9 ? 96% | 1.9 ? 96% | 2.1 ? 96% |
| Response Time Black / White * (ms) | 28.7 ? | 31.2 ? -9% | 19.6 ? 32% | 1.9 ? 93% | 2.2 ? 92% | 2.3 ? 92% |
| PWM Frequency (Hz) | 22000 ? | 21550 ? | 59.52 ? | 59 | 60.2 | |
| Screen | -82% | -99% | -180% | -122% | -83% | |
| Brightness middle (cd/m²) | 397 | 405 2% | 420 6% | 381.4 -4% | 296.8 -25% | 342.9 -14% |
| Brightness (cd/m²) | 399 | 379 -5% | 399 0% | 384 -4% | 298 -25% | 346 -13% |
| Brightness Distribution (%) | 85 | 79 -7% | 88 4% | 95 12% | 98 15% | 98 15% |
| Black Level * (cd/m²) | 0.29 | 0.26 10% | 0.32 -10% | |||
| Contrast (:1) | 1369 | 1558 14% | 1313 -4% | |||
| Colorchecker dE 2000 * | 0.8 | 2.6 -225% | 2.51 -214% | 4.34 -443% | 3.07 -284% | 2.42 -203% |
| Colorchecker dE 2000 max. * | 1.4 | 6.6 -371% | 6.64 -374% | 9.24 -560% | 5.29 -278% | 4.05 -189% |
| Greyscale dE 2000 * | 1.1 | 1.9 -73% | 3.3 -200% | 2 -82% | 2.6 -136% | 2.1 -91% |
| Gamma | 2.18 101% | 2.11 104% | 2.052 107% | 2.13 103% | 2.26 97% | 2.21 100% |
| CCT | 6705 97% | 6825 95% | 6921 94% | 6210 105% | 6904 94% | 6364 102% |
| Colorchecker dE 2000 calibrated * | 0.9 | 0.89 | ||||
| Color Space (Percent of AdobeRGB 1998) (%) | 62 | |||||
| Color Space (Percent of sRGB) (%) | 97.7 | |||||
| Total Average (Program / Settings) | -32% /
-53% | -28% /
-59% | -21% /
-75% | -1% /
-43% | 8% /
-24% |
* ... smaller is better
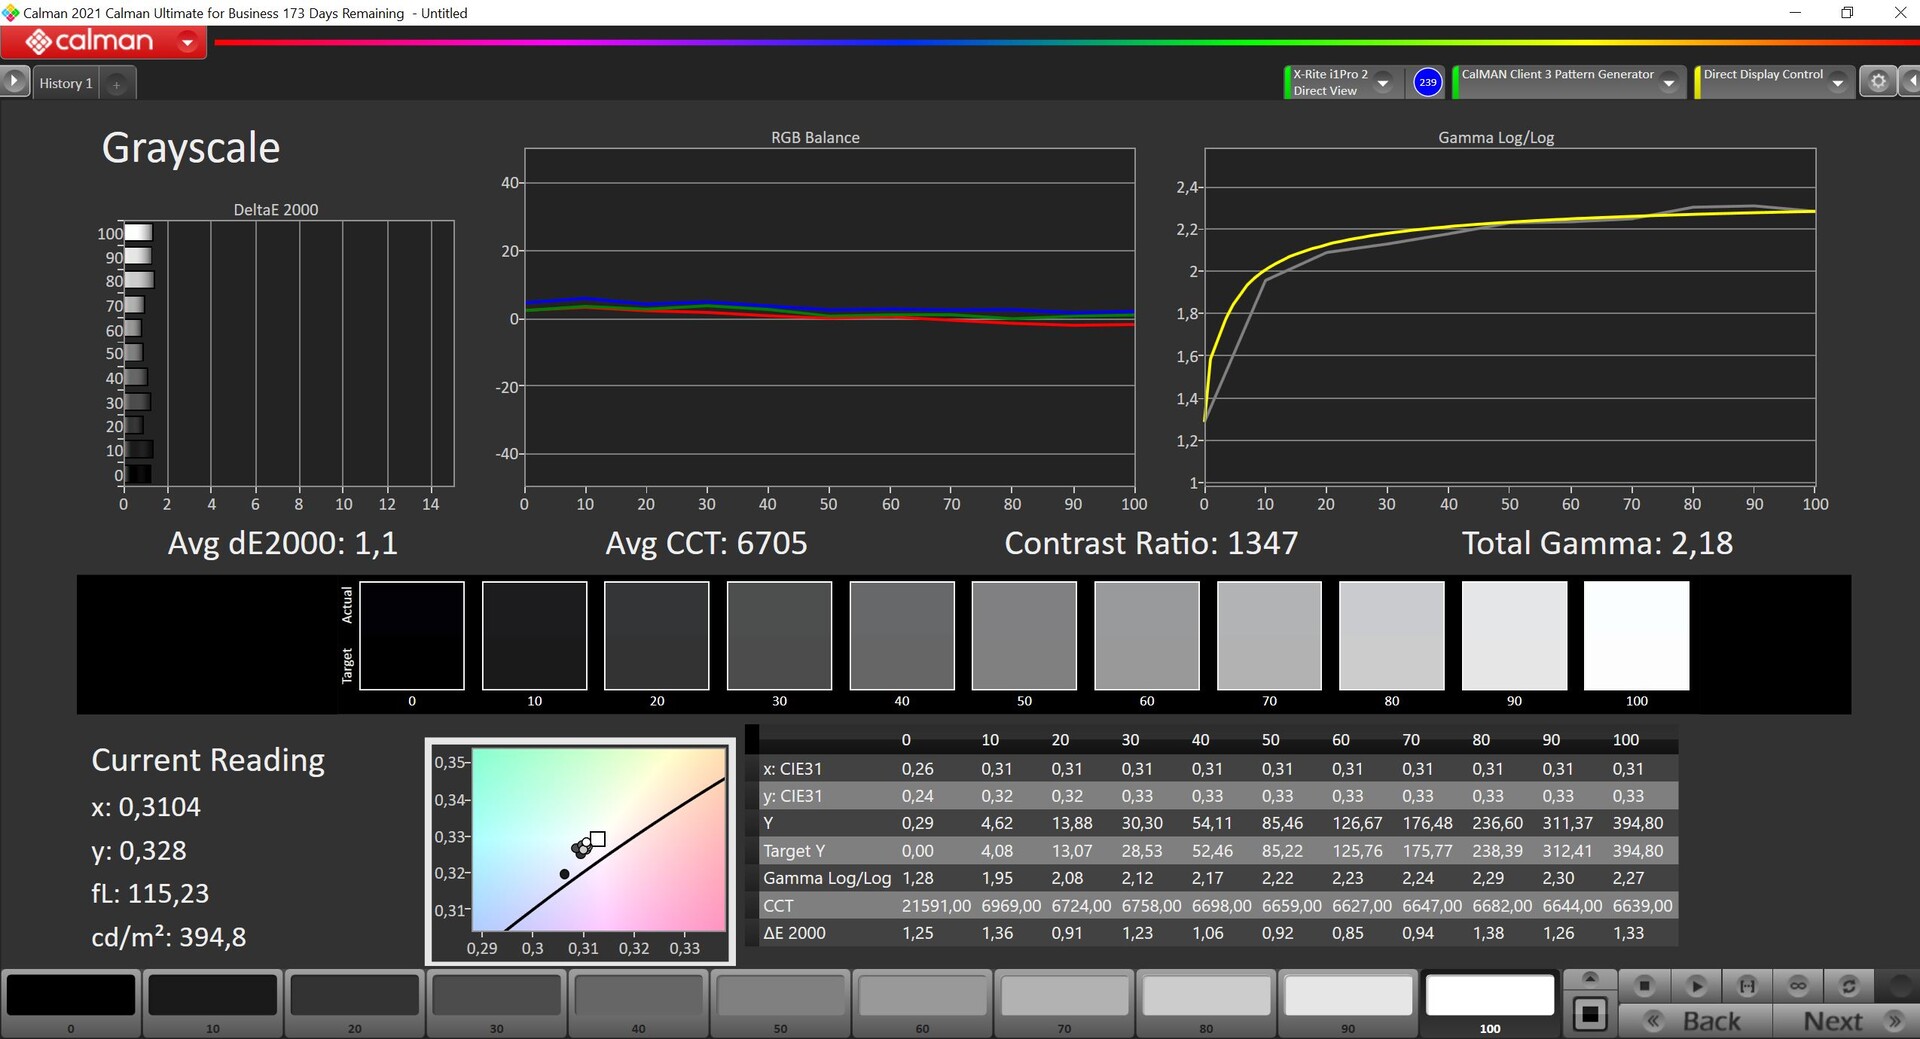
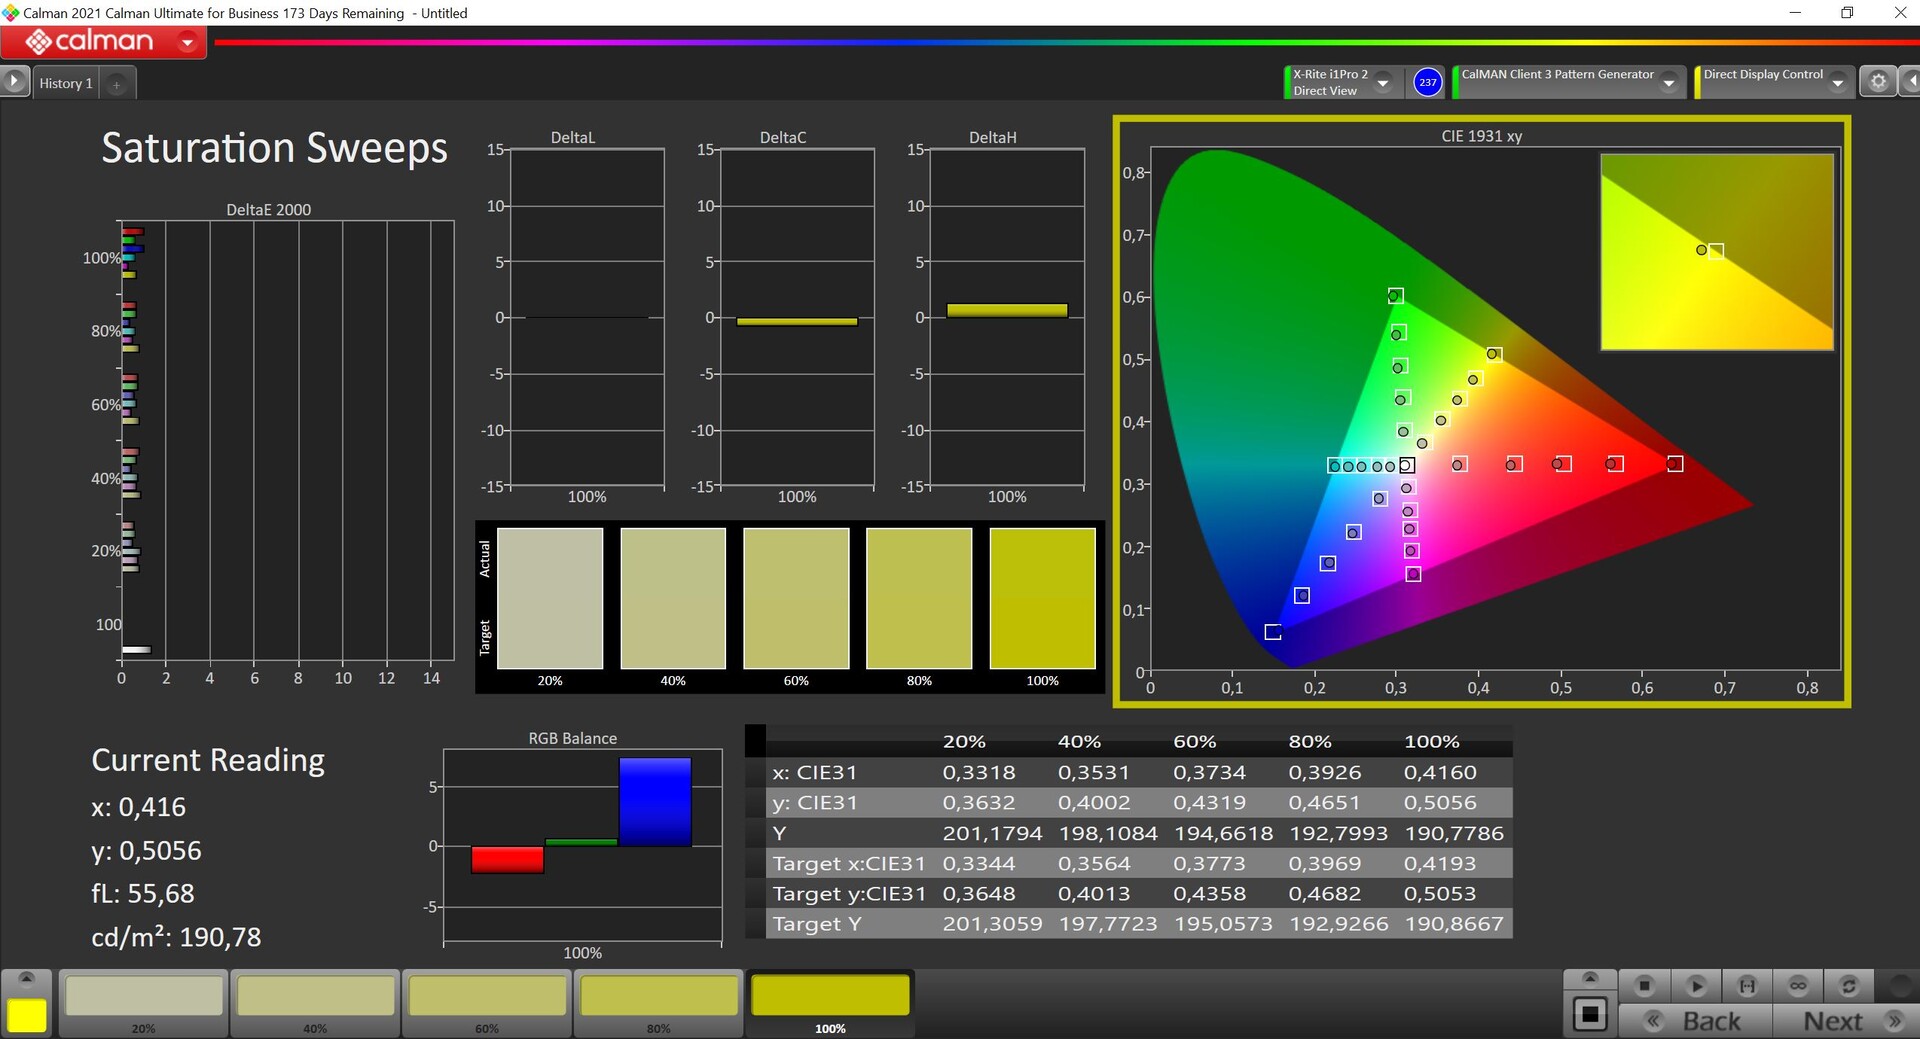
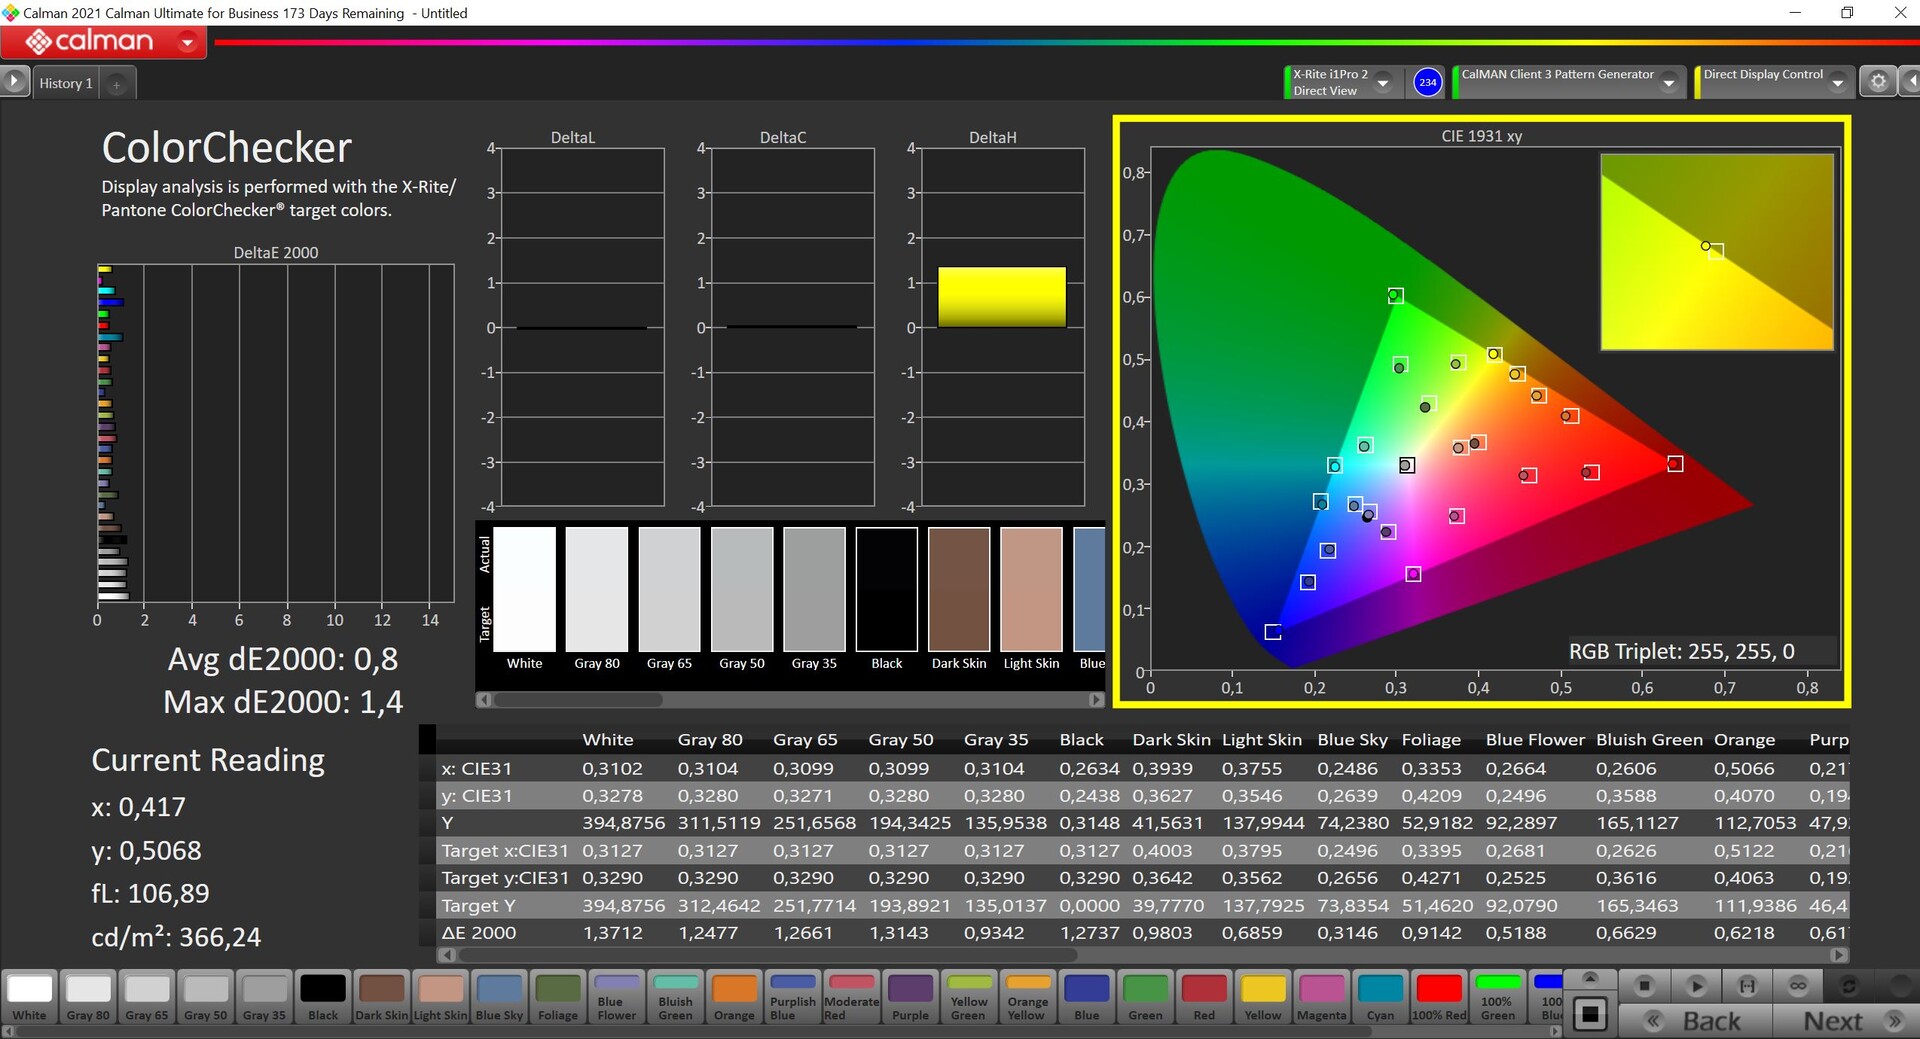

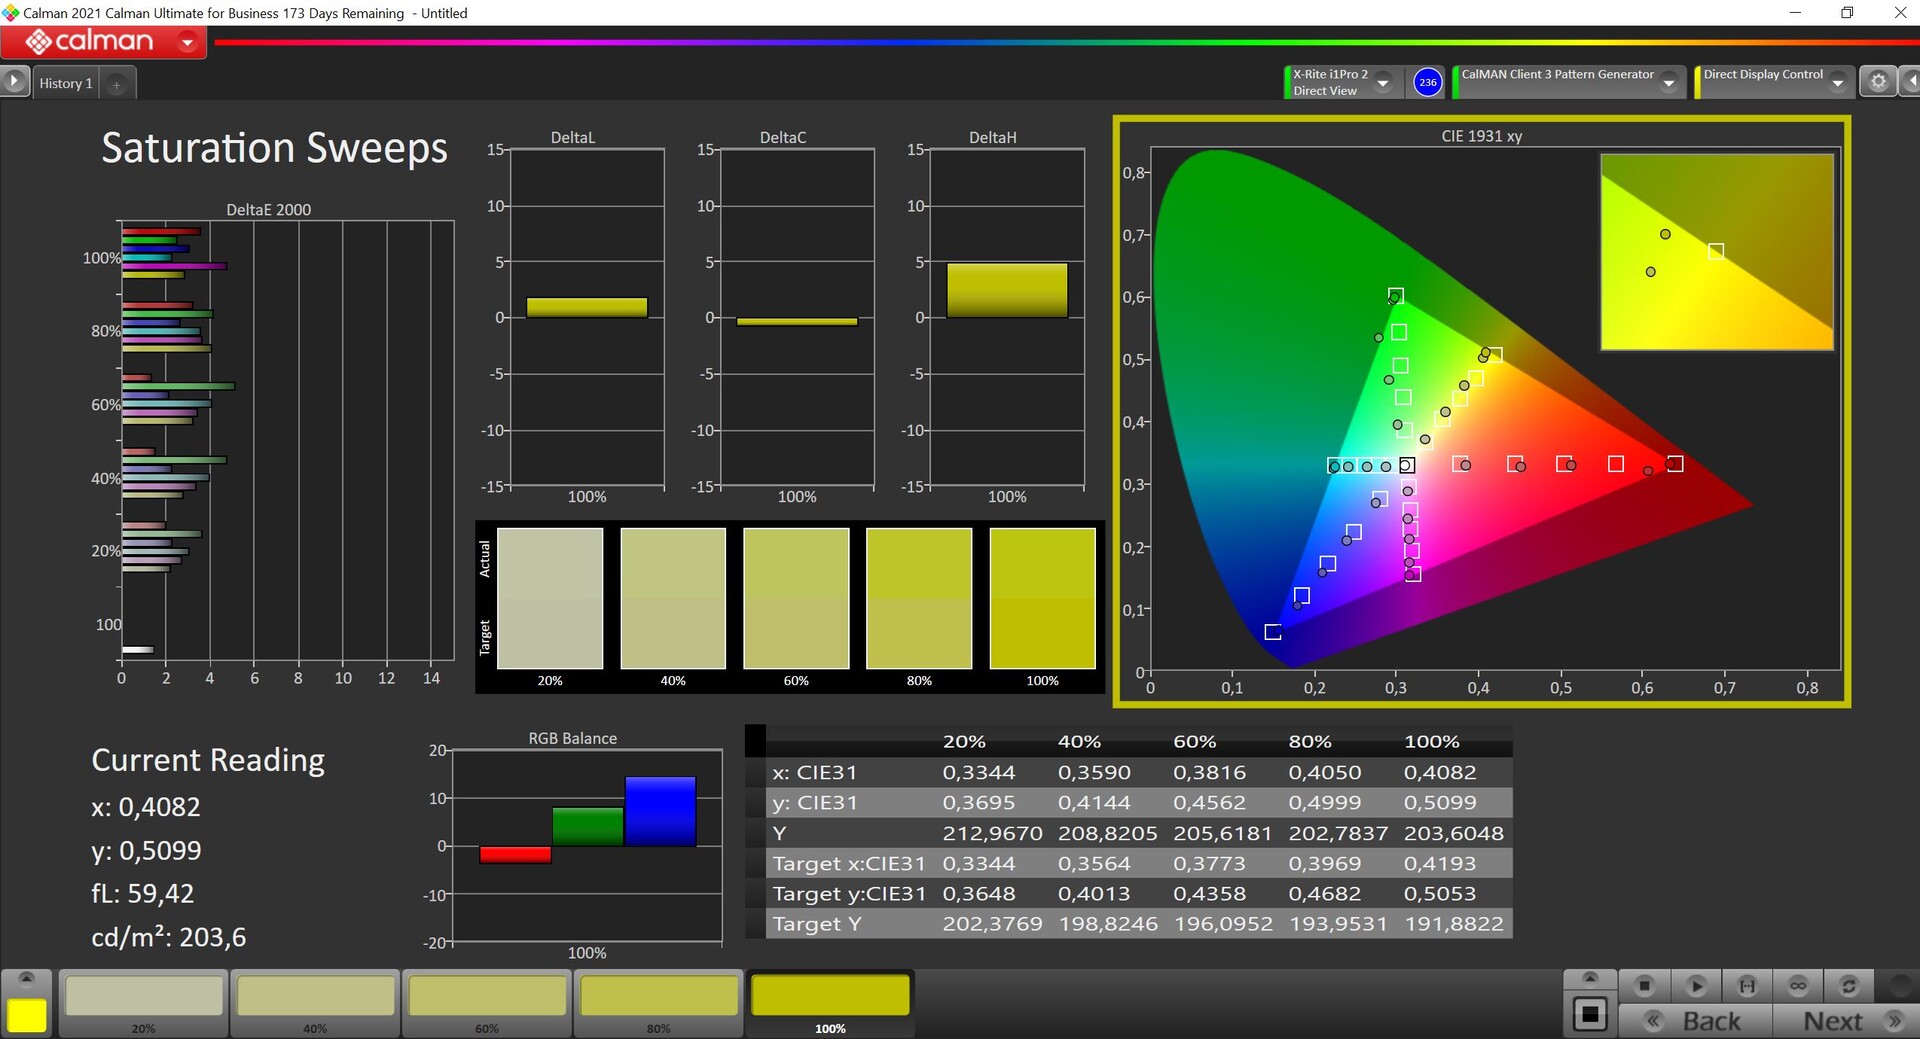
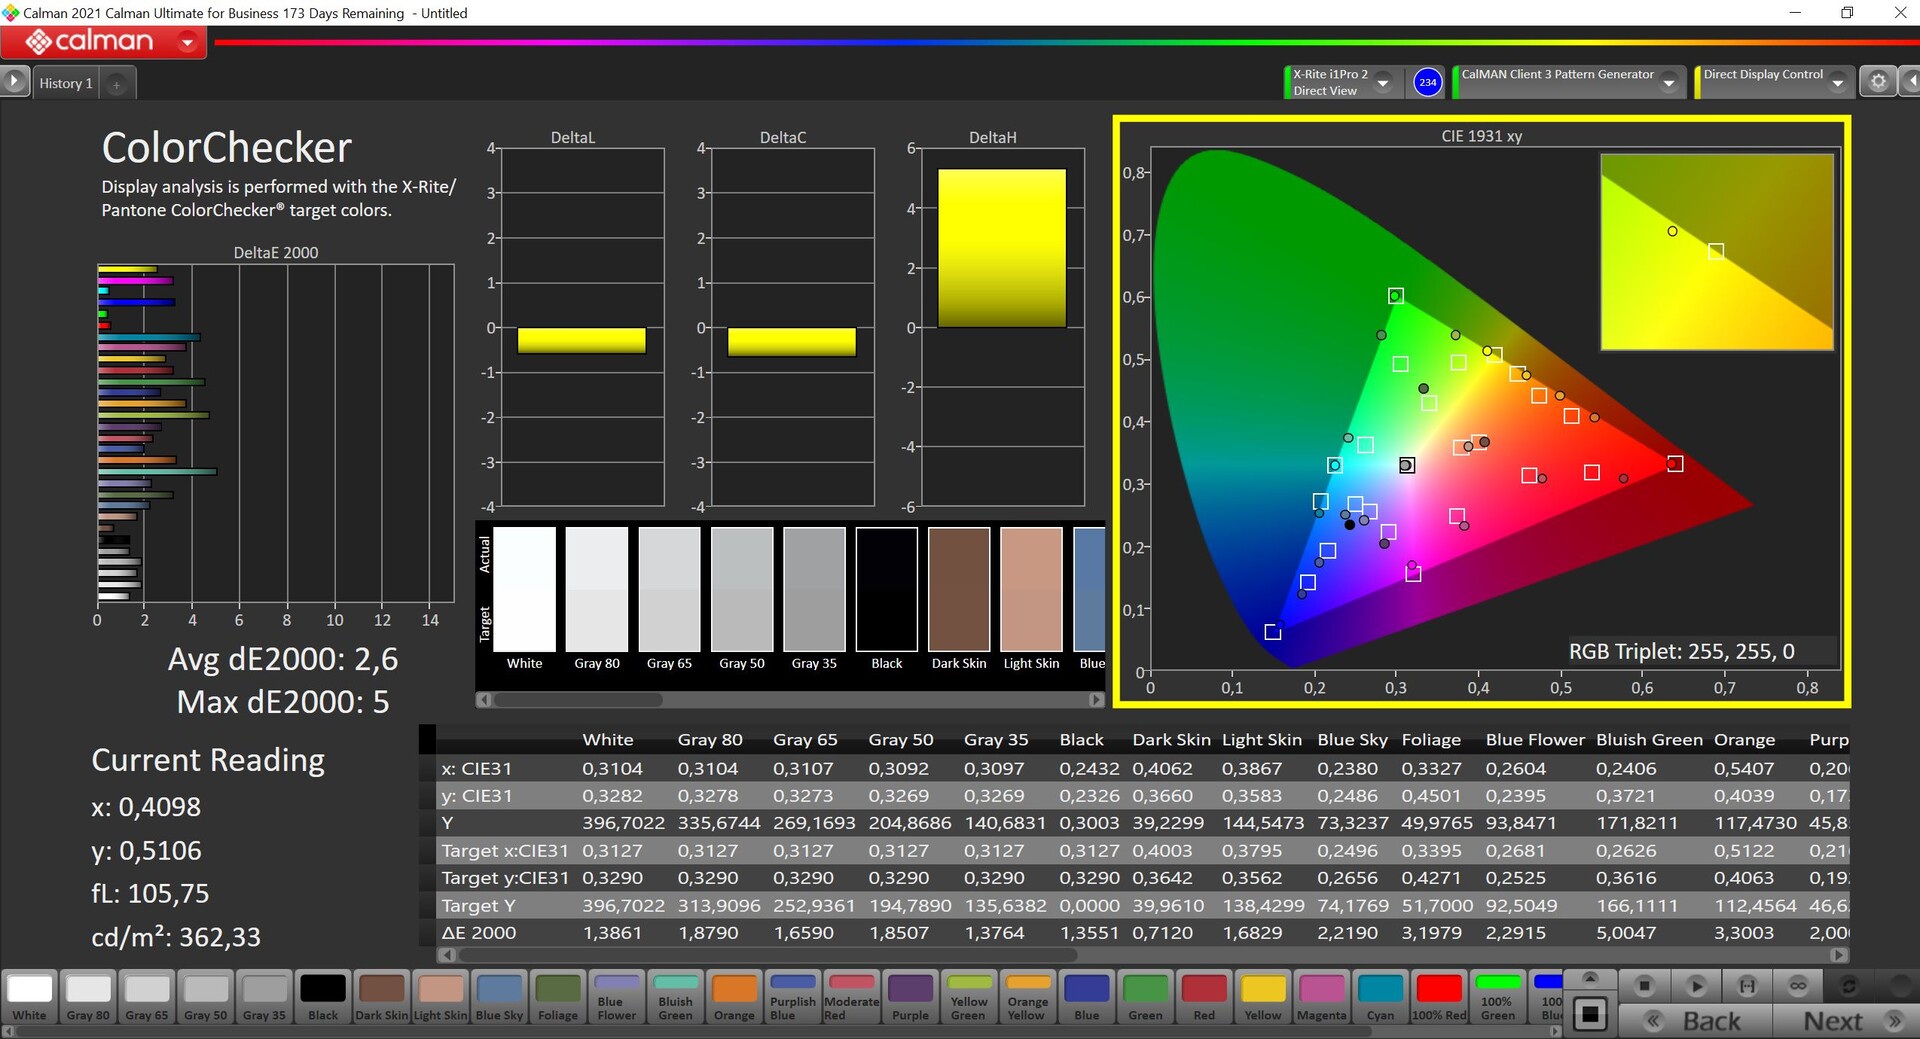
我们使用专业的CalMAN软件(X-Rite i1 Pro 2)对面板进行了分析,该设备配备了两种不同的配置文件。默认情况下,启用了增强型配置文件,颜色看起来更鲜艳、更饱和--但这也导致了更高的颜色偏差。sRGB配置文件主观上看起来有点苍白,但它在我们的分析中做得很好,在灰度和色彩描述中都提供了非常准确的数值,没有任何异常值。加上完整的sRGB覆盖,它绝对可以直接编辑图片而没有任何问题。我们无法通过自己的校准来进一步改善显示器,这就是为什么我们没有在这里提供可下载的配置文件。
Display Response Times
| ↔ Response Time Black to White | ||
|---|---|---|
| 28.7 ms ... rise ↗ and fall ↘ combined | ↗ 13 ms rise | 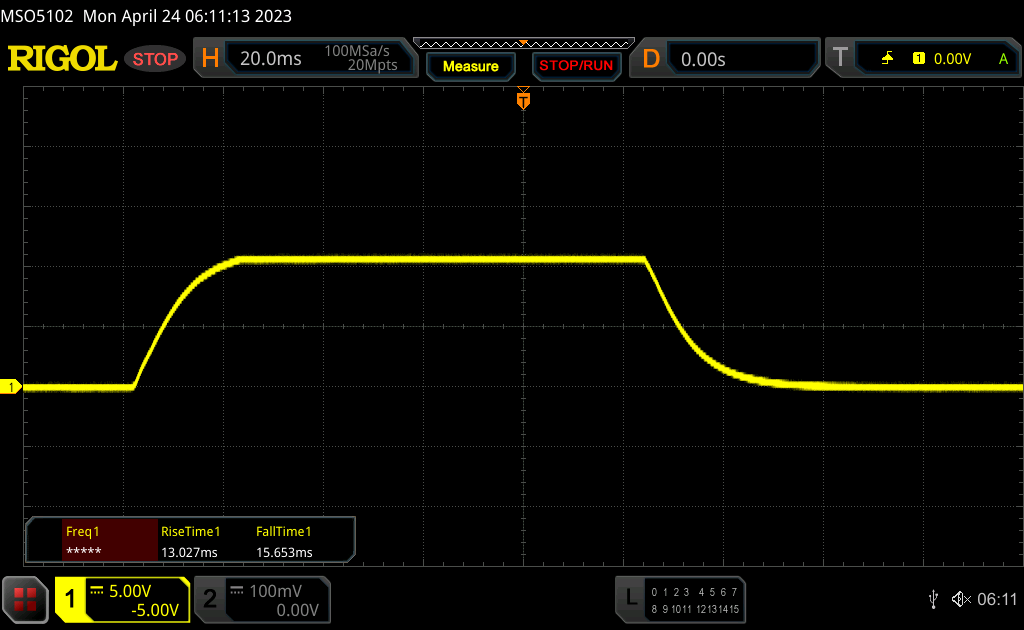 |
| ↘ 15.7 ms fall | ||
| The screen shows relatively slow response rates in our tests and may be too slow for gamers. In comparison, all tested devices range from 0.1 (minimum) to 240 (maximum) ms. » 76 % of all devices are better. This means that the measured response time is worse than the average of all tested devices (19.8 ms). | ||
| ↔ Response Time 50% Grey to 80% Grey | ||
| 52.4 ms ... rise ↗ and fall ↘ combined | ↗ 24.4 ms rise | 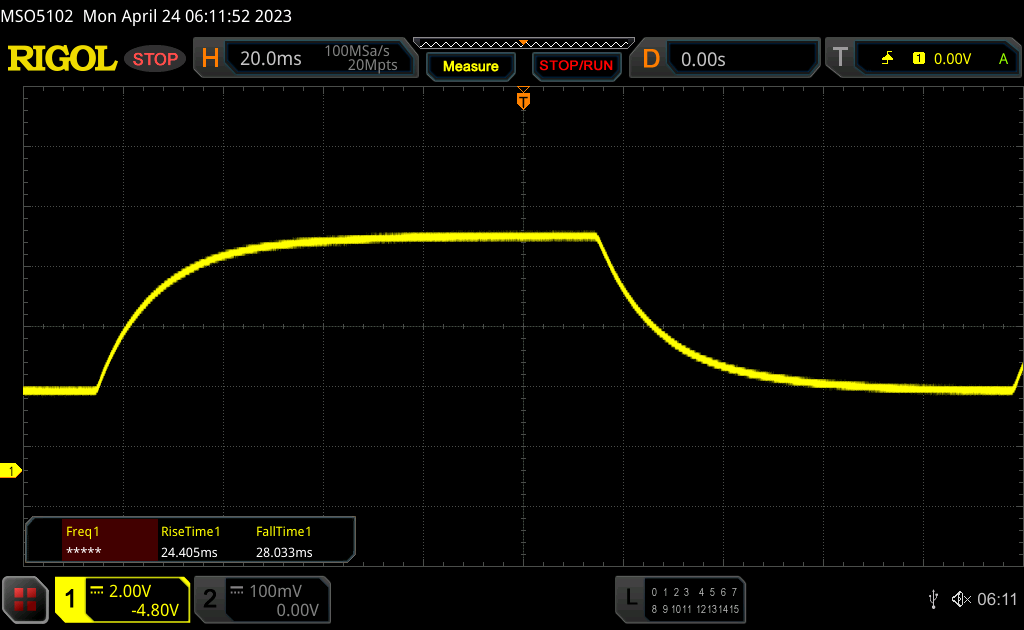 |
| ↘ 28 ms fall | ||
| The screen shows slow response rates in our tests and will be unsatisfactory for gamers. In comparison, all tested devices range from 0.165 (minimum) to 636 (maximum) ms. » 89 % of all devices are better. This means that the measured response time is worse than the average of all tested devices (31 ms). | ||
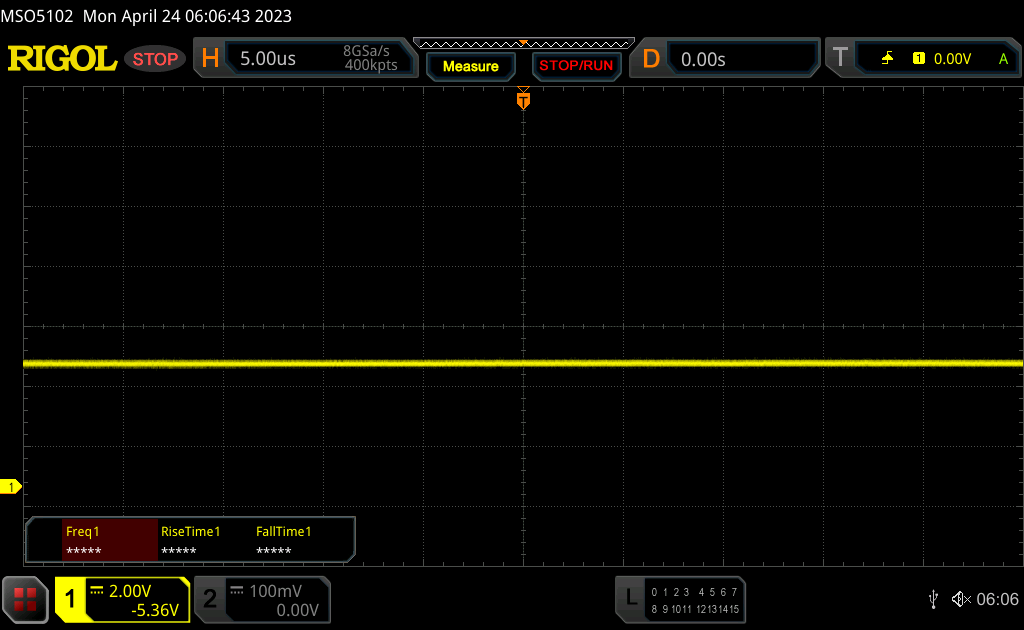
Screen Flickering / PWM (Pulse-Width Modulation)
| Screen flickering / PWM detected | 22000 Hz | ≤ 50 % brightness setting | 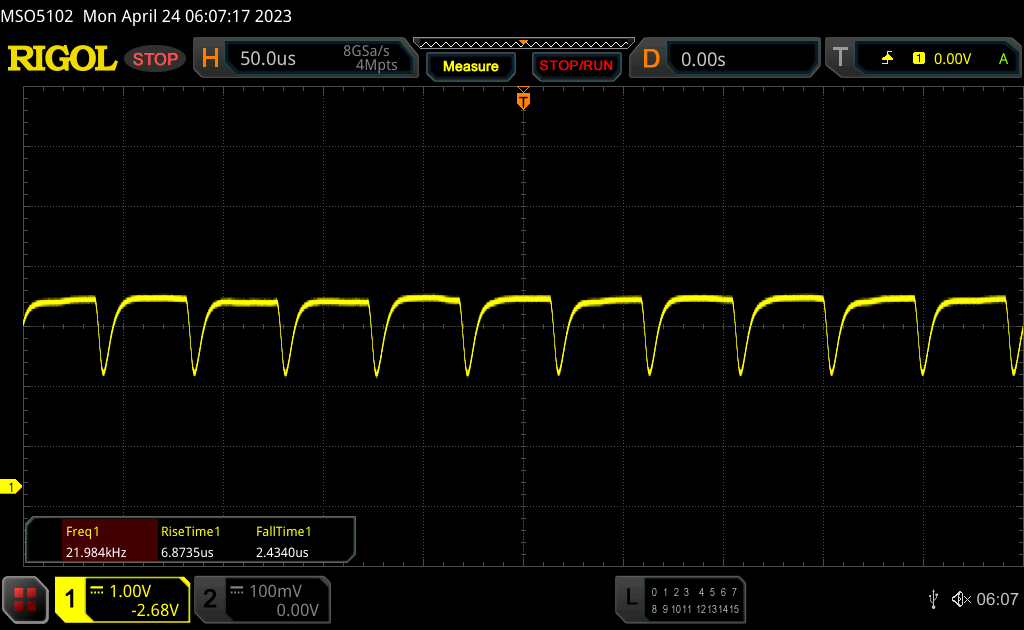 |
The display backlight flickers at 22000 Hz (worst case, e.g., utilizing PWM) Flickering detected at a brightness setting of 50 % and below. There should be no flickering or PWM above this brightness setting. The frequency of 22000 Hz is quite high, so most users sensitive to PWM should not notice any flickering. In comparison: 52 % of all tested devices do not use PWM to dim the display. If PWM was detected, an average of 7757 (minimum: 5 - maximum: 343500) Hz was measured. | |||
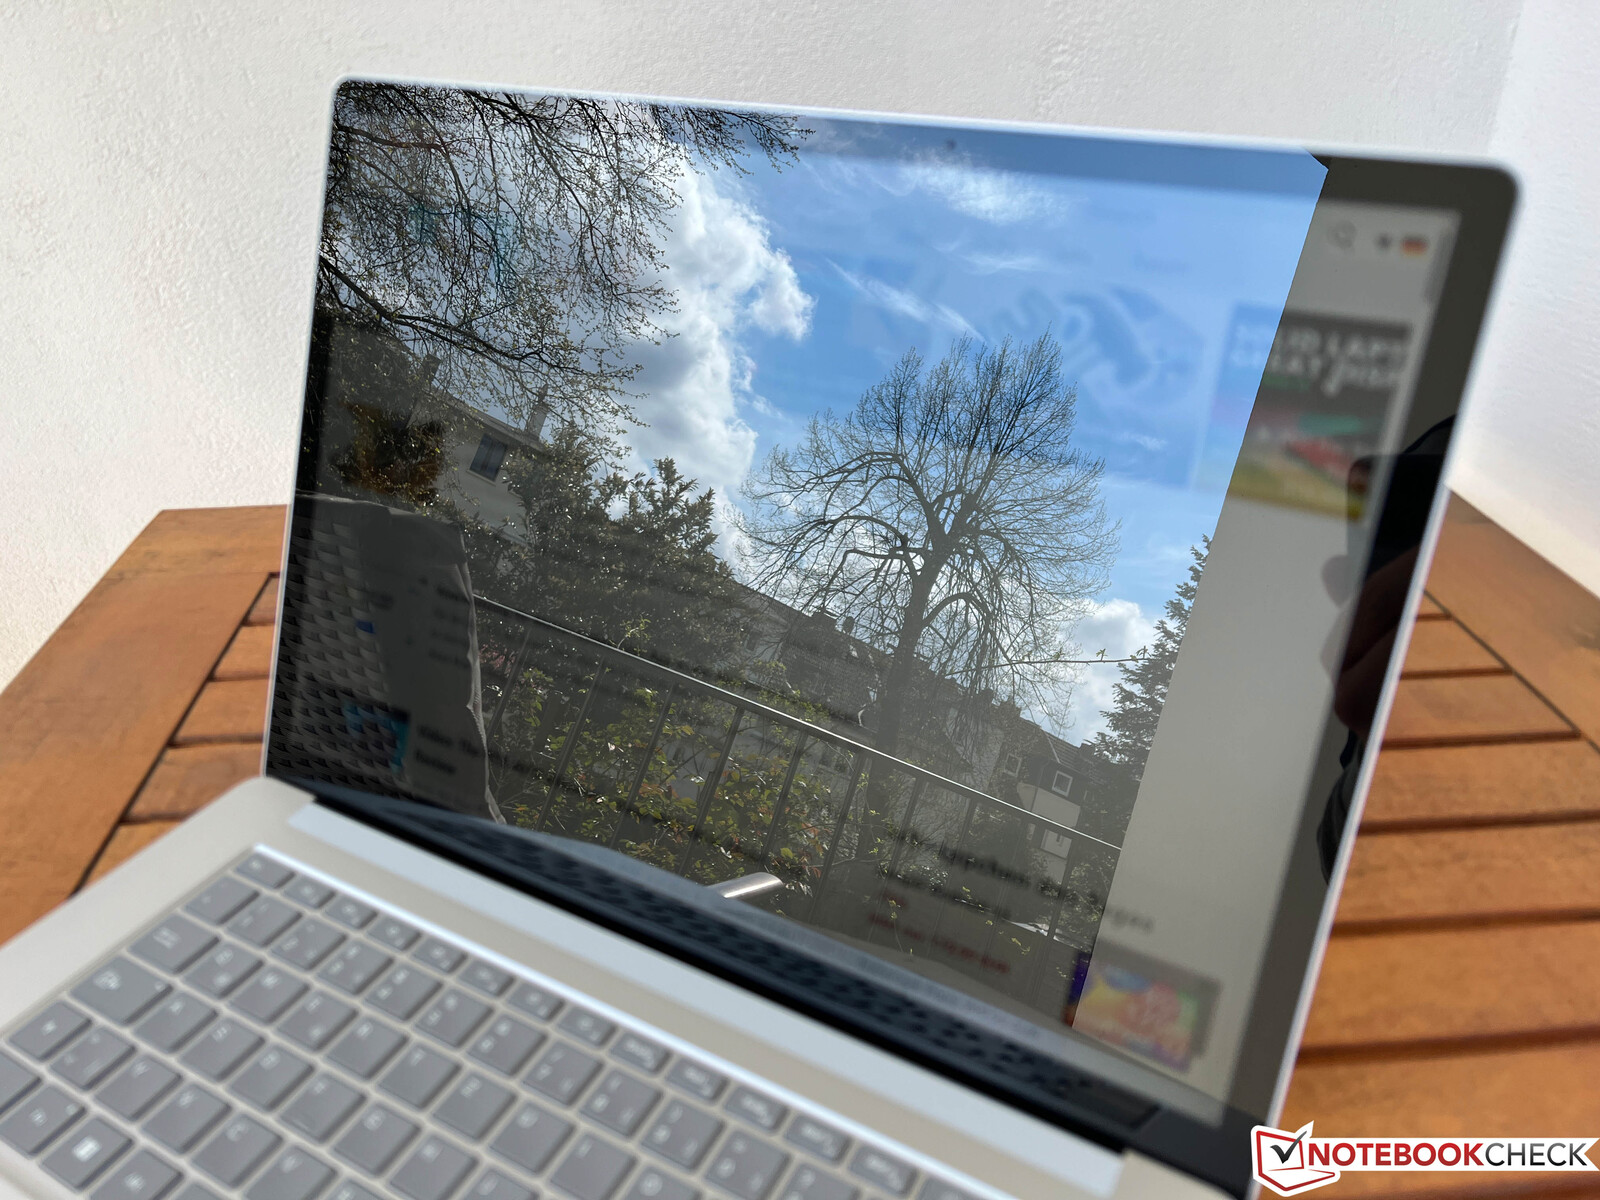
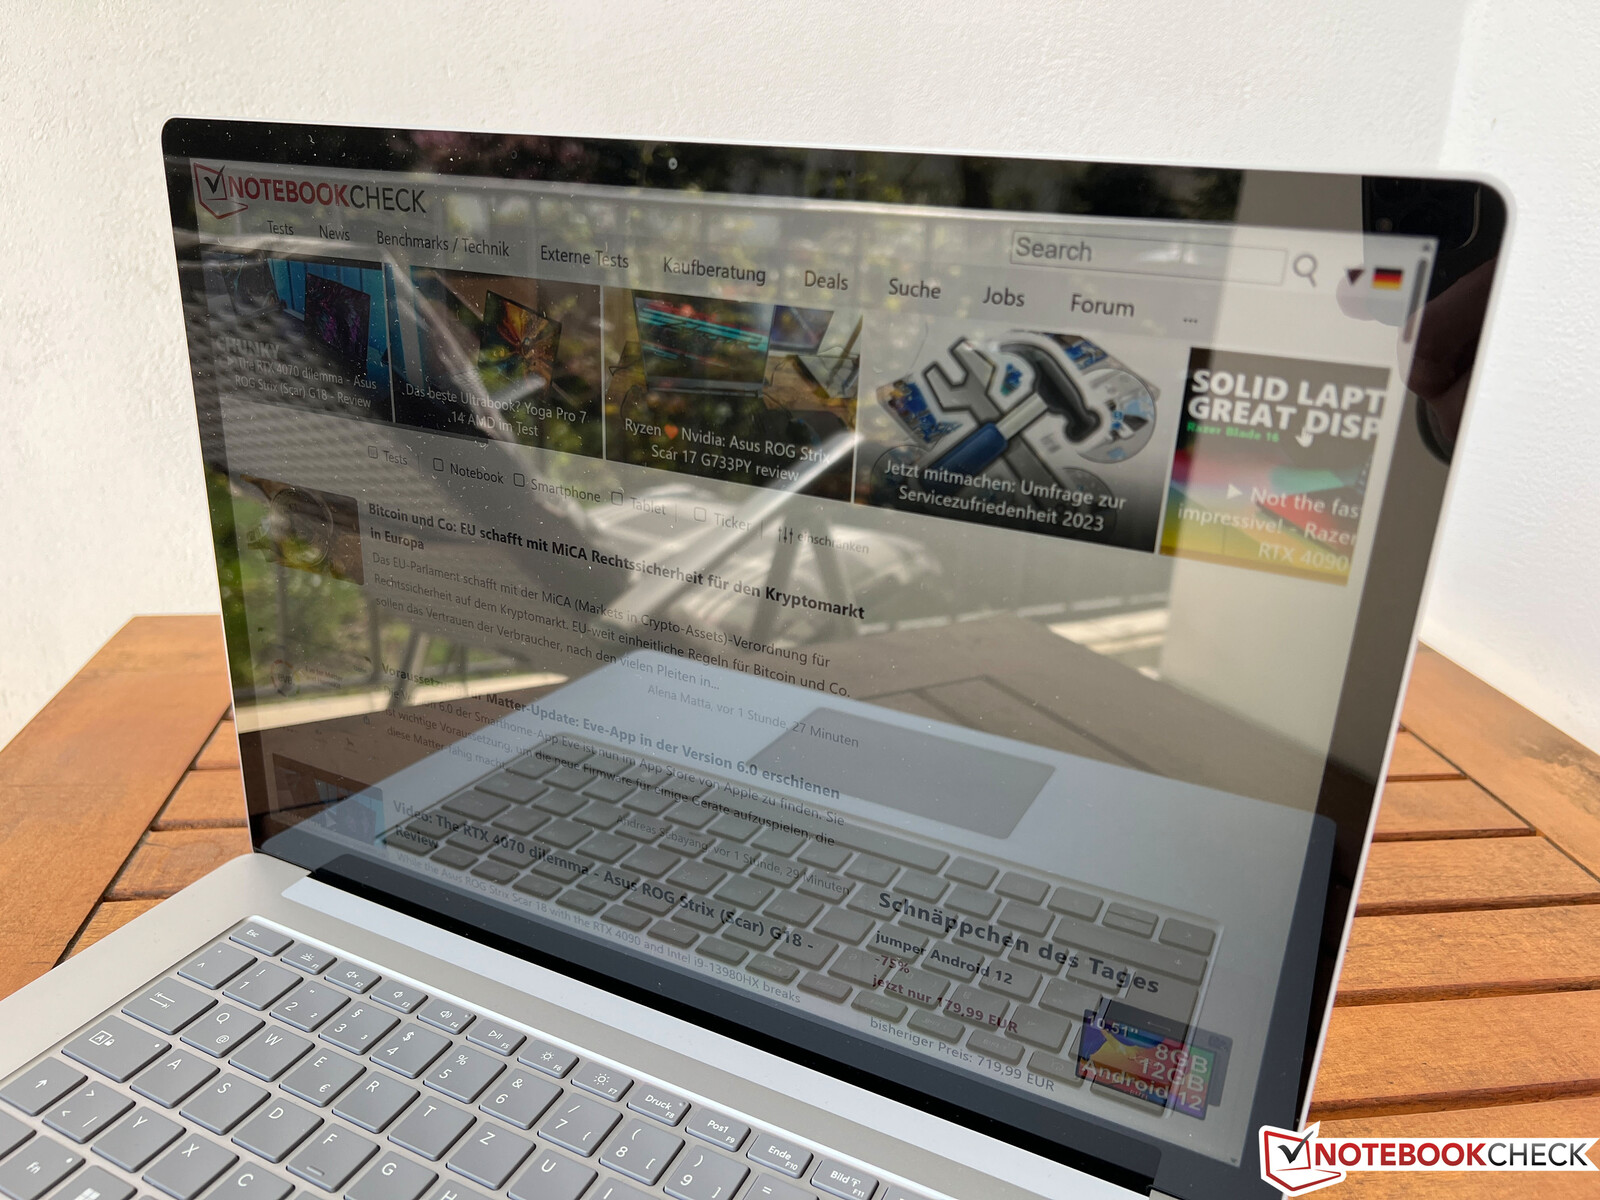
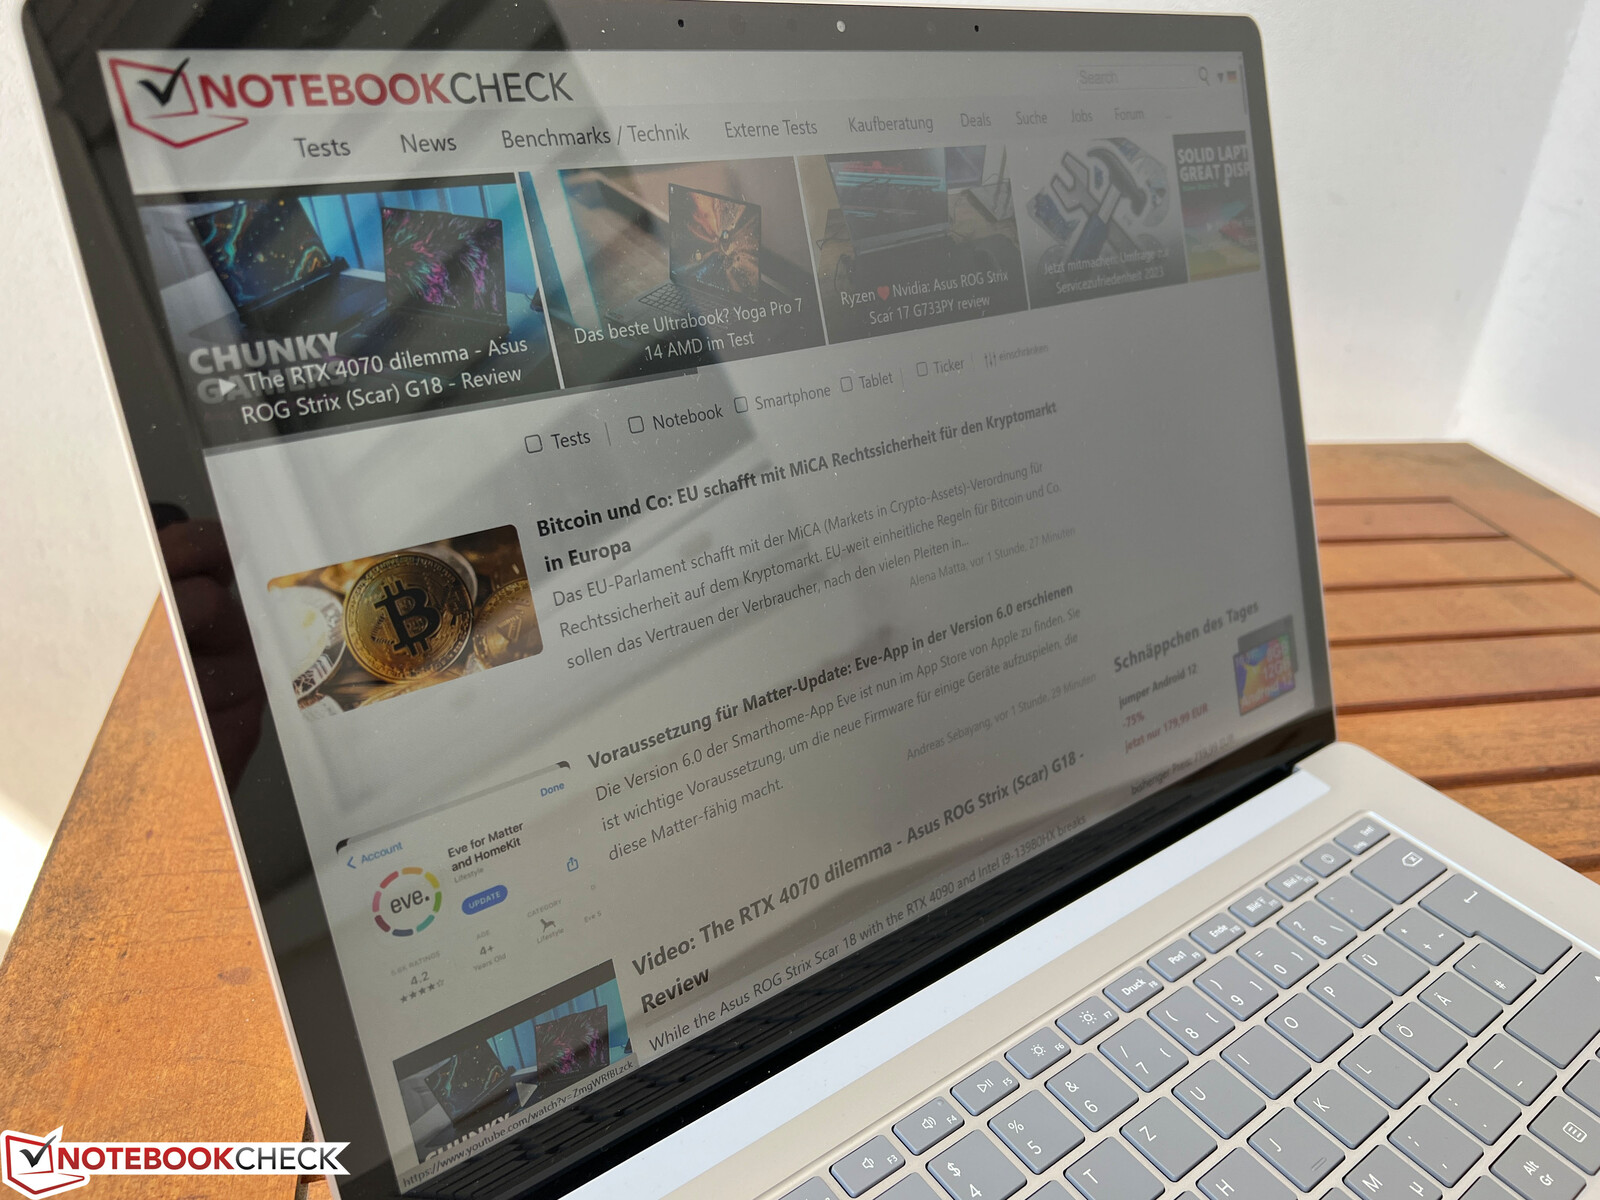
在户外使用Surface Laptop 5变得很困难,因为它的触摸屏非常反光--在明亮的日子里,笔记本几乎像一面镜子。这意味着你在阴凉处工作会有更多运气。它的视角稳定性非常好,但在较大的角度下,反射又成为一个问题。
性能 - 微软已经使用Alder Lake-U
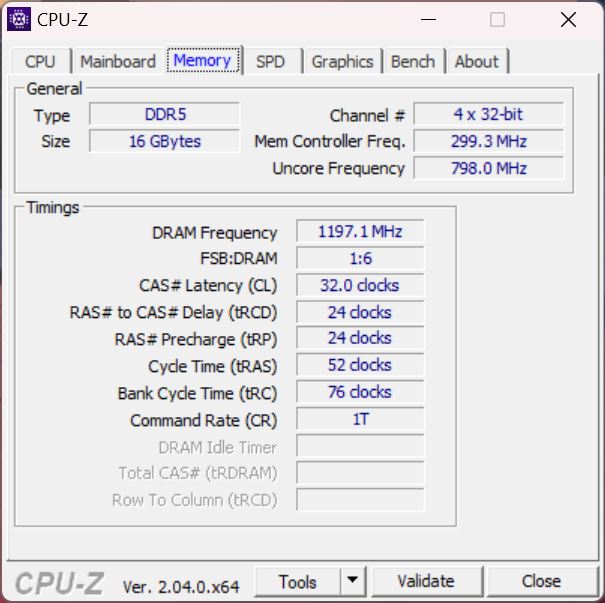
微软已经抛弃了AMD版本的Surface笔记本电脑,现在只依靠英特尔CPU。这就是U系列Alder Lake型号发挥作用的地方。他们还没有使用Raptor Lake CPU(第13代),这不是一个问题,因为它们的性能只是稍微好一点。内存是焊接的,不能升级,但微软至少提供了高达32GB的内存选择。
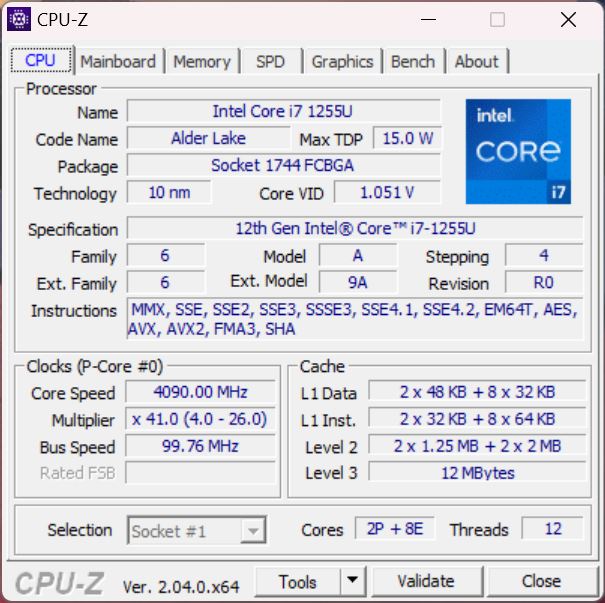
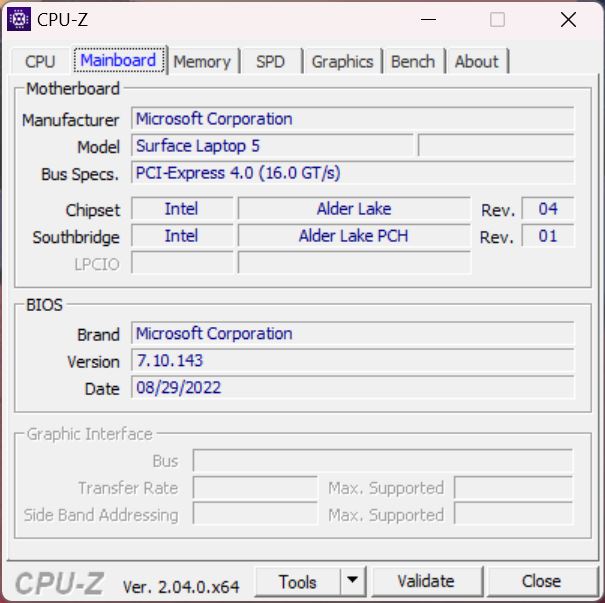

处理器 - 酷睿i7-1255U
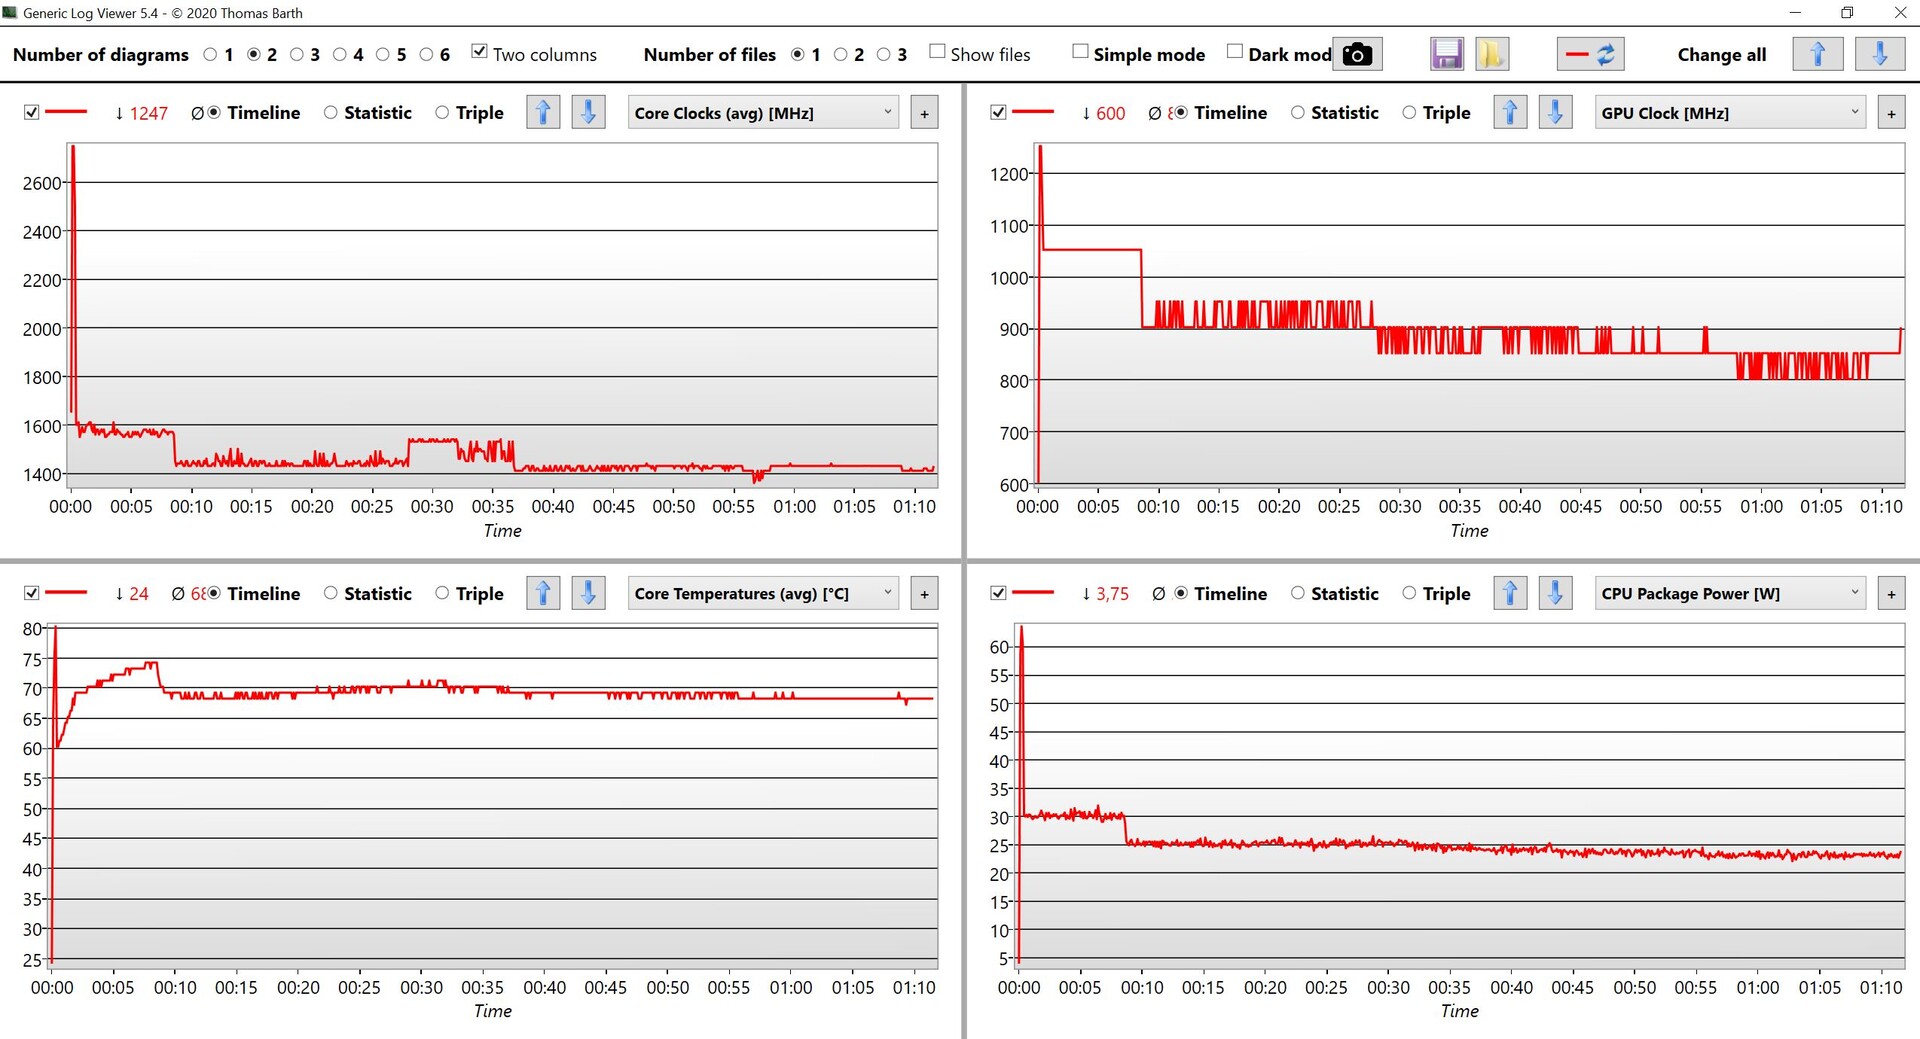
Alder Lake系列(第12代) 英特尔酷睿i7-1255U具有两个快速性能核心,包括超线程,与8个效率核心相结合--这意味着总共可以同时处理12个线程。Surface Laptop 5的处理器在大约1-2秒内消耗了60瓦,然后稳定在30瓦的水平。看看这些速率,我们不太明白为什么微软不选择Alder Lake P芯片来代替。
与Surface Laptop 4 13与 酷睿i7-1185G7相比,较新的型号平均快33%,特别是其单核性能非常好。与它的 前代产品的AMD处理器相比然而,它的多核性能更差--在这里,我们将其与Ryzen 7 4980U进行比较。 Ryzen 7 4980U.这台笔记本电脑的CPU性能对于日常任务来说绝对是足够的,但鉴于其较高的价格,我们对其性能水平有更高的期望。
当用电池供电时,该设备的多核性能下降了约8%。在这里,处理器消耗的最大功率为35/25瓦。然而,由于温度没有上升得那么快,CPU设法在35瓦的水平上保持了更长时间--然后下降到25瓦。这也表明其TDP配置不是特别好,60瓦的限制也没有什么意义。更多的CPU基准测试可在我们的技术部分。
Cinebench R15 Multi continuous test
Cinebench R23: Multi Core | Single Core
Cinebench R20: CPU (Multi Core) | CPU (Single Core)
Cinebench R15: CPU Multi 64Bit | CPU Single 64Bit
Blender: v2.79 BMW27 CPU
7-Zip 18.03: 7z b 4 | 7z b 4 -mmt1
Geekbench 5.5: Multi-Core | Single-Core
HWBOT x265 Benchmark v2.2: 4k Preset
LibreOffice : 20 Documents To PDF
R Benchmark 2.5: Overall mean
| CPU Performance rating | |
| Dell XPS 15 9520 RTX 3050 Ti | |
| Asus Zenbook Pro 15 OLED UM535Q | |
| Average of class Office | |
| Microsoft Surface Laptop 5 15, i7-1255U | |
| Average Intel Core i7-1255U | |
| LG Gram 15Z90Q | |
| Microsoft Surface Laptop 4 15 AMD TFF_00028 | |
| Microsoft Surface Laptop 4 13 i7 | |
| Samsung Galaxy Book Pro 15 NP950XDB-KC5US | |
| Cinebench R23 / Multi Core | |
| Dell XPS 15 9520 RTX 3050 Ti | |
| Asus Zenbook Pro 15 OLED UM535Q | |
| Average of class Office (1673 - 22808, n=76, last 2 years) | |
| Microsoft Surface Laptop 4 15 AMD TFF_00028 | |
| Microsoft Surface Laptop 5 15, i7-1255U | |
| LG Gram 15Z90Q | |
| Average Intel Core i7-1255U (5269 - 9628, n=11) | |
| Microsoft Surface Laptop 4 13 i7 | |
| Samsung Galaxy Book Pro 15 NP950XDB-KC5US | |
| Cinebench R23 / Single Core | |
| Dell XPS 15 9520 RTX 3050 Ti | |
| Average of class Office (708 - 2130, n=76, last 2 years) | |
| Microsoft Surface Laptop 5 15, i7-1255U | |
| Average Intel Core i7-1255U (1408 - 1775, n=11) | |
| Microsoft Surface Laptop 4 13 i7 | |
| LG Gram 15Z90Q | |
| Asus Zenbook Pro 15 OLED UM535Q | |
| Samsung Galaxy Book Pro 15 NP950XDB-KC5US | |
| Microsoft Surface Laptop 4 15 AMD TFF_00028 | |
| Cinebench R20 / CPU (Multi Core) | |
| Dell XPS 15 9520 RTX 3050 Ti | |
| Asus Zenbook Pro 15 OLED UM535Q | |
| Average of class Office (648 - 8840, n=75, last 2 years) | |
| Microsoft Surface Laptop 4 15 AMD TFF_00028 | |
| Microsoft Surface Laptop 5 15, i7-1255U | |
| LG Gram 15Z90Q | |
| Average Intel Core i7-1255U (2095 - 3702, n=11) | |
| Samsung Galaxy Book Pro 15 NP950XDB-KC5US | |
| Microsoft Surface Laptop 4 13 i7 | |
| Cinebench R20 / CPU (Single Core) | |
| Dell XPS 15 9520 RTX 3050 Ti | |
| Average of class Office (345 - 816, n=75, last 2 years) | |
| Microsoft Surface Laptop 5 15, i7-1255U | |
| Average Intel Core i7-1255U (550 - 682, n=11) | |
| Microsoft Surface Laptop 4 13 i7 | |
| Asus Zenbook Pro 15 OLED UM535Q | |
| LG Gram 15Z90Q | |
| Samsung Galaxy Book Pro 15 NP950XDB-KC5US | |
| Microsoft Surface Laptop 4 15 AMD TFF_00028 | |
| Cinebench R15 / CPU Multi 64Bit | |
| Dell XPS 15 9520 RTX 3050 Ti | |
| Asus Zenbook Pro 15 OLED UM535Q | |
| Average of class Office (250 - 3380, n=77, last 2 years) | |
| Microsoft Surface Laptop 4 15 AMD TFF_00028 | |
| Microsoft Surface Laptop 5 15, i7-1255U | |
| LG Gram 15Z90Q | |
| Average Intel Core i7-1255U (919 - 1577, n=11) | |
| Microsoft Surface Laptop 4 13 i7 | |
| Samsung Galaxy Book Pro 15 NP950XDB-KC5US | |
| Cinebench R15 / CPU Single 64Bit | |
| Dell XPS 15 9520 RTX 3050 Ti | |
| Average of class Office (99.5 - 316, n=77, last 2 years) | |
| Microsoft Surface Laptop 5 15, i7-1255U | |
| Asus Zenbook Pro 15 OLED UM535Q | |
| Average Intel Core i7-1255U (161 - 251, n=12) | |
| Microsoft Surface Laptop 4 13 i7 | |
| LG Gram 15Z90Q | |
| Microsoft Surface Laptop 4 15 AMD TFF_00028 | |
| Samsung Galaxy Book Pro 15 NP950XDB-KC5US | |
| Blender / v2.79 BMW27 CPU | |
| Microsoft Surface Laptop 4 13 i7 | |
| Samsung Galaxy Book Pro 15 NP950XDB-KC5US | |
| LG Gram 15Z90Q | |
| Average Intel Core i7-1255U (372 - 601, n=11) | |
| Microsoft Surface Laptop 5 15, i7-1255U | |
| Average of class Office (158 - 1940, n=76, last 2 years) | |
| Microsoft Surface Laptop 4 15 AMD TFF_00028 | |
| Asus Zenbook Pro 15 OLED UM535Q | |
| Dell XPS 15 9520 RTX 3050 Ti | |
| 7-Zip 18.03 / 7z b 4 | |
| Dell XPS 15 9520 RTX 3050 Ti | |
| Asus Zenbook Pro 15 OLED UM535Q | |
| Average of class Office (7098 - 76886, n=77, last 2 years) | |
| Microsoft Surface Laptop 4 15 AMD TFF_00028 | |
| Microsoft Surface Laptop 5 15, i7-1255U | |
| Average Intel Core i7-1255U (24126 - 37365, n=11) | |
| LG Gram 15Z90Q | |
| Microsoft Surface Laptop 4 13 i7 | |
| Samsung Galaxy Book Pro 15 NP950XDB-KC5US | |
| 7-Zip 18.03 / 7z b 4 -mmt1 | |
| Dell XPS 15 9520 RTX 3050 Ti | |
| Asus Zenbook Pro 15 OLED UM535Q | |
| Average of class Office (3387 - 6469, n=77, last 2 years) | |
| Average Intel Core i7-1255U (5059 - 5529, n=11) | |
| Microsoft Surface Laptop 5 15, i7-1255U | |
| Microsoft Surface Laptop 4 13 i7 | |
| Samsung Galaxy Book Pro 15 NP950XDB-KC5US | |
| LG Gram 15Z90Q | |
| Microsoft Surface Laptop 4 15 AMD TFF_00028 | |
| Geekbench 5.5 / Multi-Core | |
| Dell XPS 15 9520 RTX 3050 Ti | |
| Average of class Office (1483 - 16999, n=73, last 2 years) | |
| Microsoft Surface Laptop 5 15, i7-1255U | |
| LG Gram 15Z90Q | |
| Asus Zenbook Pro 15 OLED UM535Q | |
| Average Intel Core i7-1255U (4463 - 8821, n=12) | |
| Microsoft Surface Laptop 4 15 AMD TFF_00028 | |
| Microsoft Surface Laptop 4 13 i7 | |
| Samsung Galaxy Book Pro 15 NP950XDB-KC5US | |
| Geekbench 5.5 / Single-Core | |
| Average of class Office (811 - 2175, n=73, last 2 years) | |
| Dell XPS 15 9520 RTX 3050 Ti | |
| Microsoft Surface Laptop 5 15, i7-1255U | |
| Average Intel Core i7-1255U (1560 - 1712, n=12) | |
| LG Gram 15Z90Q | |
| Samsung Galaxy Book Pro 15 NP950XDB-KC5US | |
| Microsoft Surface Laptop 4 13 i7 | |
| Asus Zenbook Pro 15 OLED UM535Q | |
| Microsoft Surface Laptop 4 15 AMD TFF_00028 | |
| HWBOT x265 Benchmark v2.2 / 4k Preset | |
| Asus Zenbook Pro 15 OLED UM535Q | |
| Dell XPS 15 9520 RTX 3050 Ti | |
| Average of class Office (2.21 - 26, n=76, last 2 years) | |
| Microsoft Surface Laptop 5 15, i7-1255U | |
| Microsoft Surface Laptop 4 15 AMD TFF_00028 | |
| Average Intel Core i7-1255U (6.31 - 10.1, n=11) | |
| LG Gram 15Z90Q | |
| Samsung Galaxy Book Pro 15 NP950XDB-KC5US | |
| Microsoft Surface Laptop 4 13 i7 | |
| LibreOffice / 20 Documents To PDF | |
| Microsoft Surface Laptop 4 15 AMD TFF_00028 | |
| Average of class Office (39.9 - 102.3, n=76, last 2 years) | |
| LG Gram 15Z90Q | |
| Samsung Galaxy Book Pro 15 NP950XDB-KC5US | |
| Microsoft Surface Laptop 4 13 i7 | |
| Asus Zenbook Pro 15 OLED UM535Q | |
| Average Intel Core i7-1255U (35.6 - 52.5, n=11) | |
| Microsoft Surface Laptop 5 15, i7-1255U | |
| Dell XPS 15 9520 RTX 3050 Ti | |
| R Benchmark 2.5 / Overall mean | |
| Microsoft Surface Laptop 4 15 AMD TFF_00028 | |
| Samsung Galaxy Book Pro 15 NP950XDB-KC5US | |
| Microsoft Surface Laptop 4 13 i7 | |
| LG Gram 15Z90Q | |
| Average of class Office (0.393 - 0.888, n=76, last 2 years) | |
| Asus Zenbook Pro 15 OLED UM535Q | |
| Average Intel Core i7-1255U (0.4688 - 0.558, n=11) | |
| Microsoft Surface Laptop 5 15, i7-1255U | |
| Dell XPS 15 9520 RTX 3050 Ti | |
* ... smaller is better
AIDA64: FP32 Ray-Trace | FPU Julia | CPU SHA3 | CPU Queen | FPU SinJulia | FPU Mandel | CPU AES | CPU ZLib | FP64 Ray-Trace | CPU PhotoWorxx
| Performance rating | |
| Asus Zenbook Pro 15 OLED UM535Q | |
| Average of class Office | |
| Microsoft Surface Laptop 4 15 AMD TFF_00028 | |
| Dell XPS 15 9520 RTX 3050 Ti | |
| Microsoft Surface Laptop 5 15, i7-1255U | |
| LG Gram 15Z90Q | |
| Average Intel Core i7-1255U | |
| Samsung Galaxy Book Pro 15 NP950XDB-KC5US | |
| AIDA64 / FP32 Ray-Trace | |
| Asus Zenbook Pro 15 OLED UM535Q | |
| Average of class Office (2083 - 31245, n=83, last 2 years) | |
| Microsoft Surface Laptop 4 15 AMD TFF_00028 | |
| Dell XPS 15 9520 RTX 3050 Ti | |
| Microsoft Surface Laptop 5 15, i7-1255U | |
| Average Intel Core i7-1255U (4313 - 8127, n=11) | |
| LG Gram 15Z90Q | |
| Samsung Galaxy Book Pro 15 NP950XDB-KC5US | |
| AIDA64 / FPU Julia | |
| Asus Zenbook Pro 15 OLED UM535Q | |
| Microsoft Surface Laptop 4 15 AMD TFF_00028 | |
| Average of class Office (8191 - 125394, n=83, last 2 years) | |
| Microsoft Surface Laptop 5 15, i7-1255U | |
| LG Gram 15Z90Q | |
| Dell XPS 15 9520 RTX 3050 Ti | |
| Average Intel Core i7-1255U (19813 - 41353, n=11) | |
| Samsung Galaxy Book Pro 15 NP950XDB-KC5US | |
| AIDA64 / CPU SHA3 | |
| Asus Zenbook Pro 15 OLED UM535Q | |
| Average of class Office (433 - 5755, n=83, last 2 years) | |
| Dell XPS 15 9520 RTX 3050 Ti | |
| Microsoft Surface Laptop 4 15 AMD TFF_00028 | |
| Microsoft Surface Laptop 5 15, i7-1255U | |
| Average Intel Core i7-1255U (1325 - 2135, n=11) | |
| LG Gram 15Z90Q | |
| Samsung Galaxy Book Pro 15 NP950XDB-KC5US | |
| AIDA64 / CPU Queen | |
| Asus Zenbook Pro 15 OLED UM535Q | |
| Dell XPS 15 9520 RTX 3050 Ti | |
| Microsoft Surface Laptop 4 15 AMD TFF_00028 | |
| LG Gram 15Z90Q | |
| Average of class Office (22784 - 115197, n=67, last 2 years) | |
| Microsoft Surface Laptop 5 15, i7-1255U | |
| Average Intel Core i7-1255U (61375 - 65892, n=11) | |
| Samsung Galaxy Book Pro 15 NP950XDB-KC5US | |
| AIDA64 / FPU SinJulia | |
| Microsoft Surface Laptop 4 15 AMD TFF_00028 | |
| Asus Zenbook Pro 15 OLED UM535Q | |
| Dell XPS 15 9520 RTX 3050 Ti | |
| Average of class Office (1378 - 18321, n=83, last 2 years) | |
| Microsoft Surface Laptop 5 15, i7-1255U | |
| LG Gram 15Z90Q | |
| Average Intel Core i7-1255U (3577 - 5095, n=11) | |
| Samsung Galaxy Book Pro 15 NP950XDB-KC5US | |
| AIDA64 / FPU Mandel | |
| Asus Zenbook Pro 15 OLED UM535Q | |
| Microsoft Surface Laptop 4 15 AMD TFF_00028 | |
| Average of class Office (4601 - 66922, n=83, last 2 years) | |
| Dell XPS 15 9520 RTX 3050 Ti | |
| Microsoft Surface Laptop 5 15, i7-1255U | |
| Average Intel Core i7-1255U (11759 - 20187, n=11) | |
| LG Gram 15Z90Q | |
| Samsung Galaxy Book Pro 15 NP950XDB-KC5US | |
| AIDA64 / CPU AES | |
| Asus Zenbook Pro 15 OLED UM535Q | |
| Dell XPS 15 9520 RTX 3050 Ti | |
| Average of class Office (4854 - 155900, n=83, last 2 years) | |
| Microsoft Surface Laptop 4 15 AMD TFF_00028 | |
| Average Intel Core i7-1255U (27900 - 67458, n=11) | |
| Microsoft Surface Laptop 5 15, i7-1255U | |
| LG Gram 15Z90Q | |
| Samsung Galaxy Book Pro 15 NP950XDB-KC5US | |
| AIDA64 / CPU ZLib | |
| Dell XPS 15 9520 RTX 3050 Ti | |
| Asus Zenbook Pro 15 OLED UM535Q | |
| Microsoft Surface Laptop 4 15 AMD TFF_00028 | |
| Average of class Office (114.6 - 1366, n=83, last 2 years) | |
| Microsoft Surface Laptop 5 15, i7-1255U | |
| Average Intel Core i7-1255U (393 - 640, n=11) | |
| LG Gram 15Z90Q | |
| Samsung Galaxy Book Pro 15 NP950XDB-KC5US | |
| AIDA64 / FP64 Ray-Trace | |
| Asus Zenbook Pro 15 OLED UM535Q | |
| Average of class Office (1109 - 17834, n=83, last 2 years) | |
| Microsoft Surface Laptop 4 15 AMD TFF_00028 | |
| Dell XPS 15 9520 RTX 3050 Ti | |
| Microsoft Surface Laptop 5 15, i7-1255U | |
| Average Intel Core i7-1255U (2474 - 4400, n=11) | |
| Samsung Galaxy Book Pro 15 NP950XDB-KC5US | |
| LG Gram 15Z90Q | |
| AIDA64 / CPU PhotoWorxx | |
| LG Gram 15Z90Q | |
| Microsoft Surface Laptop 5 15, i7-1255U | |
| Average of class Office (11090 - 65229, n=83, last 2 years) | |
| Samsung Galaxy Book Pro 15 NP950XDB-KC5US | |
| Dell XPS 15 9520 RTX 3050 Ti | |
| Average Intel Core i7-1255U (13899 - 44054, n=11) | |
| Microsoft Surface Laptop 4 15 AMD TFF_00028 | |
| Asus Zenbook Pro 15 OLED UM535Q | |
系统性能
Surface Laptop 5是一个反应灵敏的日常使用伙伴,我们在测试中没有发现任何问题。
CrossMark: Overall | Productivity | Creativity | Responsiveness
| PCMark 10 / Score | |
| Dell XPS 15 9520 RTX 3050 Ti | |
| Asus Zenbook Pro 15 OLED UM535Q | |
| Average of class Office (2601 - 9298, n=68, last 2 years) | |
| Microsoft Surface Laptop 5 15, i7-1255U | |
| Average Intel Core i7-1255U, Intel Iris Xe Graphics G7 96EUs (4676 - 5523, n=9) | |
| Microsoft Surface Laptop 4 15 AMD TFF_00028 | |
| LG Gram 15Z90Q | |
| Samsung Galaxy Book Pro 15 NP950XDB-KC5US | |
| PCMark 10 / Essentials | |
| Dell XPS 15 9520 RTX 3050 Ti | |
| Average Intel Core i7-1255U, Intel Iris Xe Graphics G7 96EUs (9381 - 11654, n=9) | |
| Asus Zenbook Pro 15 OLED UM535Q | |
| Microsoft Surface Laptop 5 15, i7-1255U | |
| Average of class Office (3245 - 11594, n=68, last 2 years) | |
| Samsung Galaxy Book Pro 15 NP950XDB-KC5US | |
| LG Gram 15Z90Q | |
| Microsoft Surface Laptop 4 15 AMD TFF_00028 | |
| PCMark 10 / Productivity | |
| Average of class Office (5336 - 17243, n=68, last 2 years) | |
| Asus Zenbook Pro 15 OLED UM535Q | |
| Dell XPS 15 9520 RTX 3050 Ti | |
| Microsoft Surface Laptop 5 15, i7-1255U | |
| Microsoft Surface Laptop 4 15 AMD TFF_00028 | |
| Average Intel Core i7-1255U, Intel Iris Xe Graphics G7 96EUs (6530 - 7418, n=9) | |
| Samsung Galaxy Book Pro 15 NP950XDB-KC5US | |
| LG Gram 15Z90Q | |
| PCMark 10 / Digital Content Creation | |
| Dell XPS 15 9520 RTX 3050 Ti | |
| Average of class Office (2049 - 13541, n=68, last 2 years) | |
| Asus Zenbook Pro 15 OLED UM535Q | |
| Microsoft Surface Laptop 5 15, i7-1255U | |
| LG Gram 15Z90Q | |
| Microsoft Surface Laptop 4 15 AMD TFF_00028 | |
| Average Intel Core i7-1255U, Intel Iris Xe Graphics G7 96EUs (4498 - 6203, n=9) | |
| Samsung Galaxy Book Pro 15 NP950XDB-KC5US | |
| CrossMark / Overall | |
| Dell XPS 15 9520 RTX 3050 Ti | |
| Average of class Office (381 - 2010, n=75, last 2 years) | |
| Microsoft Surface Laptop 5 15, i7-1255U | |
| Average Intel Core i7-1255U, Intel Iris Xe Graphics G7 96EUs (1329 - 1573, n=9) | |
| Asus Zenbook Pro 15 OLED UM535Q | |
| CrossMark / Productivity | |
| Dell XPS 15 9520 RTX 3050 Ti | |
| Microsoft Surface Laptop 5 15, i7-1255U | |
| Average of class Office (464 - 1880, n=75, last 2 years) | |
| Average Intel Core i7-1255U, Intel Iris Xe Graphics G7 96EUs (1364 - 1554, n=9) | |
| Asus Zenbook Pro 15 OLED UM535Q | |
| CrossMark / Creativity | |
| Dell XPS 15 9520 RTX 3050 Ti | |
| Average of class Office (319 - 2361, n=75, last 2 years) | |
| Microsoft Surface Laptop 5 15, i7-1255U | |
| Average Intel Core i7-1255U, Intel Iris Xe Graphics G7 96EUs (1372 - 1660, n=9) | |
| Asus Zenbook Pro 15 OLED UM535Q | |
| CrossMark / Responsiveness | |
| Dell XPS 15 9520 RTX 3050 Ti | |
| Average Intel Core i7-1255U, Intel Iris Xe Graphics G7 96EUs (1117 - 1434, n=9) | |
| Average of class Office (360 - 1820, n=75, last 2 years) | |
| Microsoft Surface Laptop 5 15, i7-1255U | |
| Asus Zenbook Pro 15 OLED UM535Q | |
| PCMark 10 Score | 5472 points | |
Help | ||
| AIDA64 / Memory Copy | |
| LG Gram 15Z90Q | |
| Average of class Office (20075 - 110930, n=80, last 2 years) | |
| Microsoft Surface Laptop 5 15, i7-1255U | |
| Dell XPS 15 9520 RTX 3050 Ti | |
| Samsung Galaxy Book Pro 15 NP950XDB-KC5US | |
| Average Intel Core i7-1255U (22846 - 67017, n=11) | |
| Asus Zenbook Pro 15 OLED UM535Q | |
| Microsoft Surface Laptop 4 15 AMD TFF_00028 | |
| AIDA64 / Memory Read | |
| LG Gram 15Z90Q | |
| Microsoft Surface Laptop 5 15, i7-1255U | |
| Average of class Office (10084 - 128030, n=81, last 2 years) | |
| Dell XPS 15 9520 RTX 3050 Ti | |
| Samsung Galaxy Book Pro 15 NP950XDB-KC5US | |
| Average Intel Core i7-1255U (22877 - 67398, n=11) | |
| Microsoft Surface Laptop 4 15 AMD TFF_00028 | |
| Asus Zenbook Pro 15 OLED UM535Q | |
| AIDA64 / Memory Write | |
| Average of class Office (20073 - 119858, n=81, last 2 years) | |
| LG Gram 15Z90Q | |
| Microsoft Surface Laptop 5 15, i7-1255U | |
| Samsung Galaxy Book Pro 15 NP950XDB-KC5US | |
| Dell XPS 15 9520 RTX 3050 Ti | |
| Average Intel Core i7-1255U (22883 - 65839, n=11) | |
| Asus Zenbook Pro 15 OLED UM535Q | |
| Microsoft Surface Laptop 4 15 AMD TFF_00028 | |
| AIDA64 / Memory Latency | |
| Microsoft Surface Laptop 5 15, i7-1255U | |
| Microsoft Surface Laptop 4 15 AMD TFF_00028 | |
| LG Gram 15Z90Q | |
| Average of class Office (7.6 - 162.9, n=76, last 2 years) | |
| Samsung Galaxy Book Pro 15 NP950XDB-KC5US | |
| Dell XPS 15 9520 RTX 3050 Ti | |
| Asus Zenbook Pro 15 OLED UM535Q | |
| Average Intel Core i7-1255U (76 - 163.2, n=11) | |
* ... smaller is better
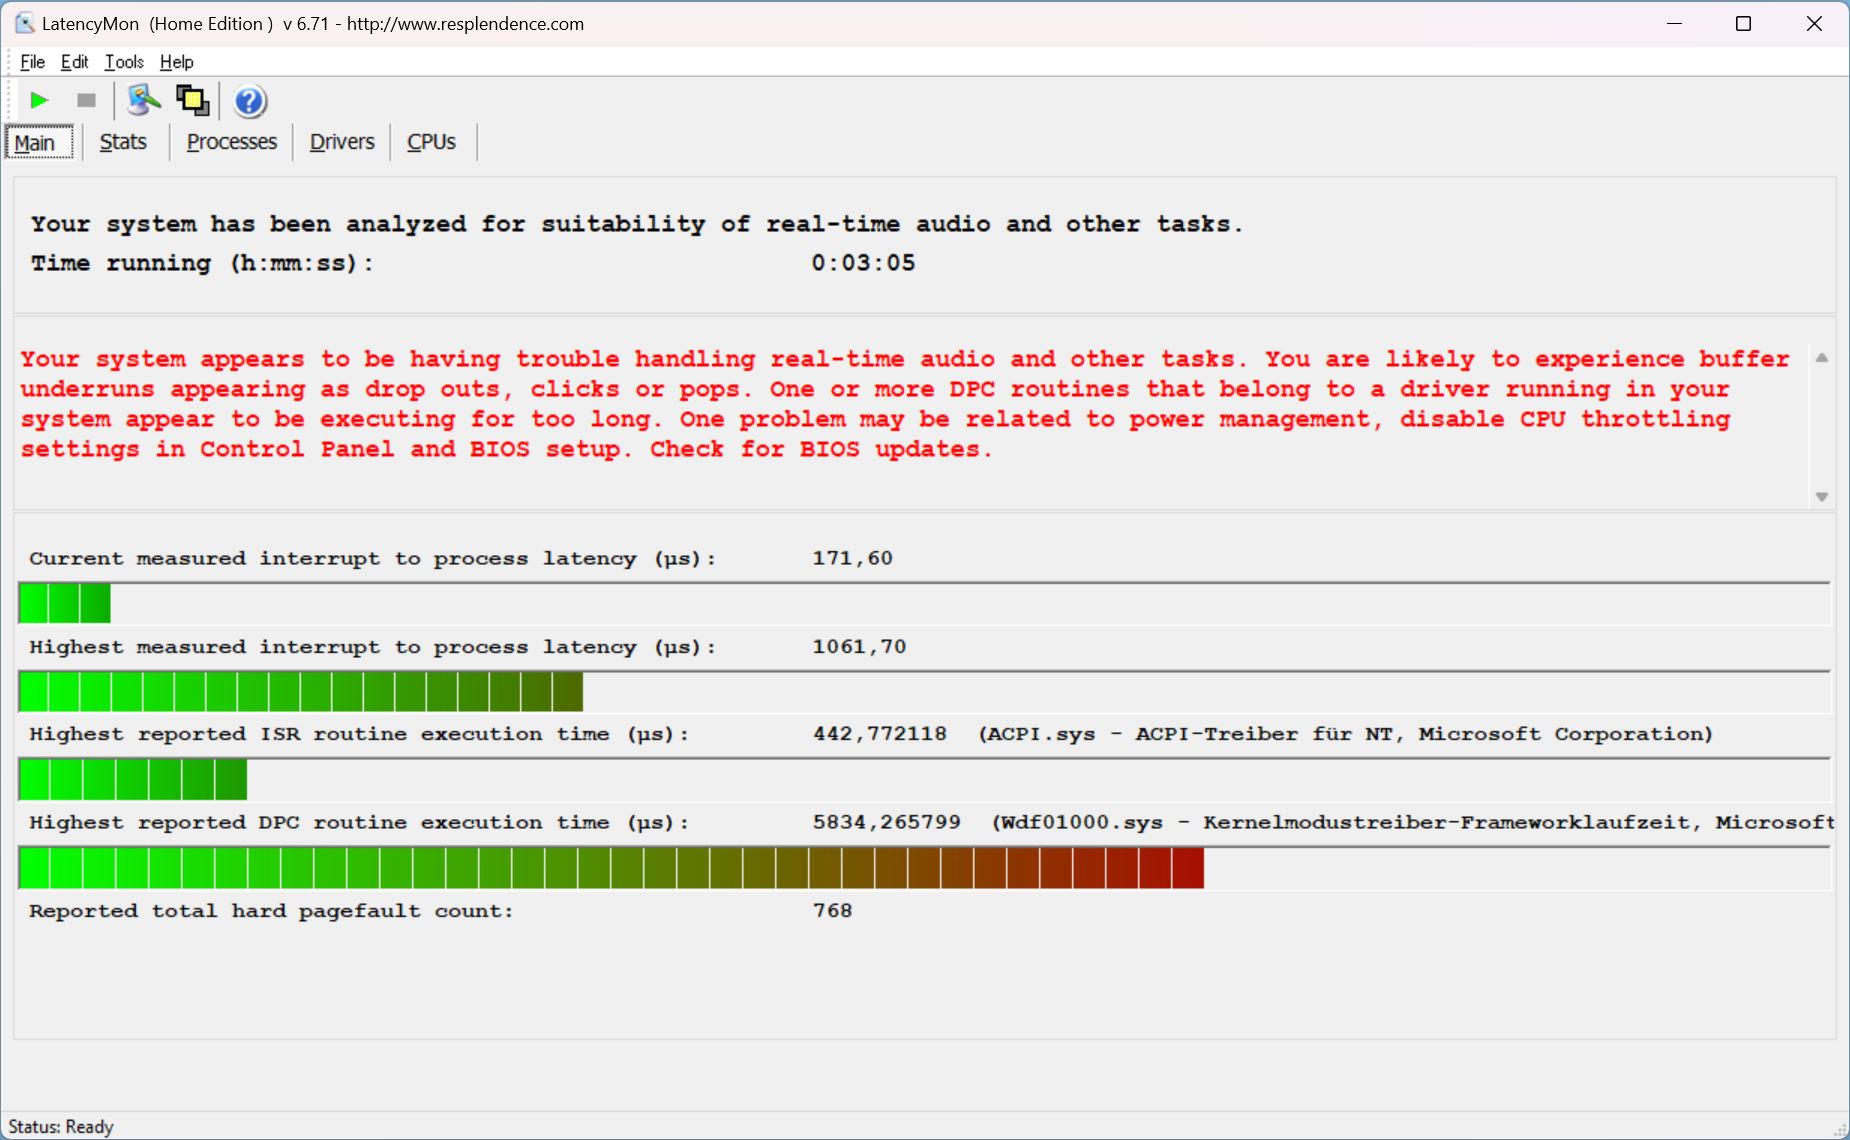
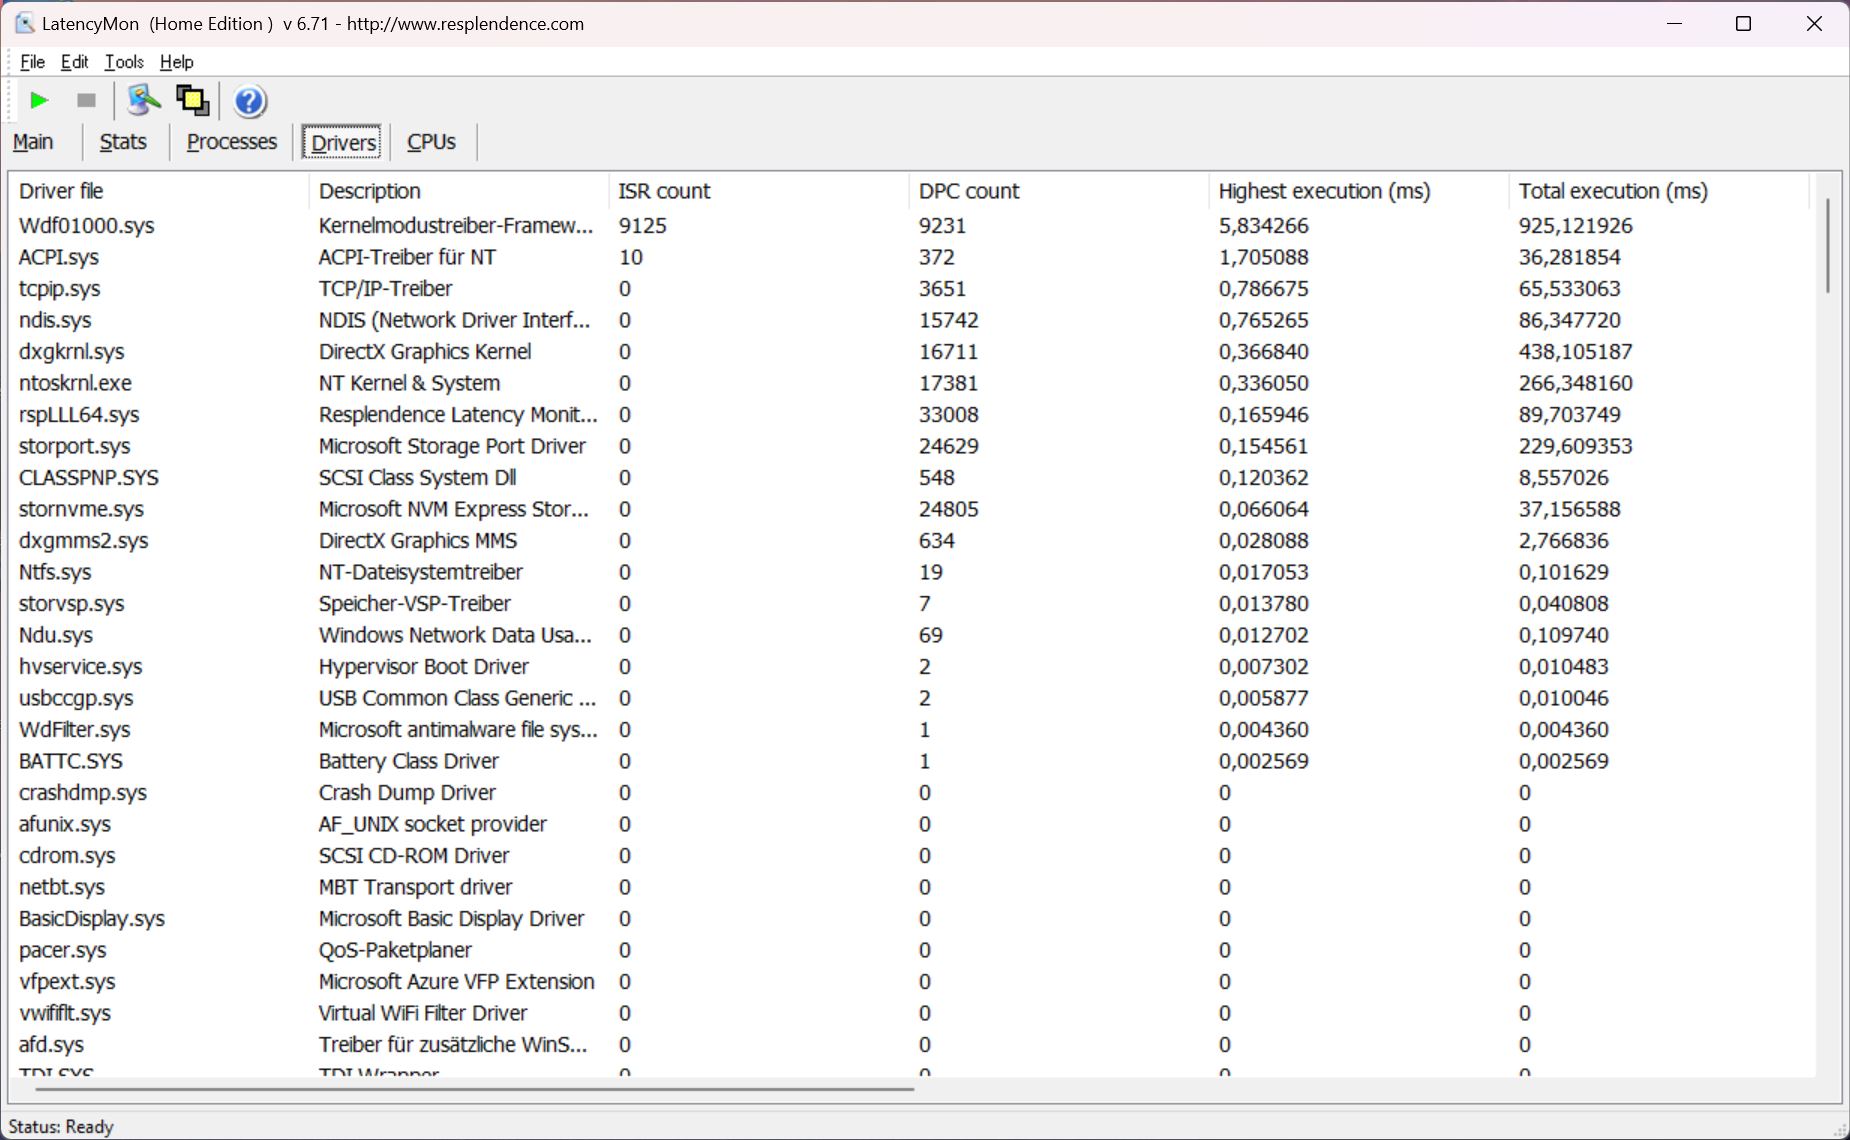
DPC延时
在目前的BIOS版本中,我们的测试设备在我们的标准化延迟测试中显示了一些限制。
| DPC Latencies / LatencyMon - interrupt to process latency (max), Web, Youtube, Prime95 | |
| Microsoft Surface Laptop 5 15, i7-1255U | |
| Dell XPS 15 9520 RTX 3050 Ti | |
| LG Gram 15Z90Q | |
| Microsoft Surface Laptop 4 15 AMD TFF_00028 | |
| Samsung Galaxy Book Pro 15 NP950XDB-KC5US | |
| Asus Zenbook Pro 15 OLED UM535Q | |
* ... smaller is better
存储设备
这台笔记本电脑安装了SK hynix的NVMe SSD(BC711),存储容量为512GB,其中415GB在第一次启动后仍然可用。该驱动器通过PCIe 3.0连接--Surface Laptop 5还不支持更新的4.0接口。该设备的传输速率总体上完全够用,最高为3.5GB/s,即使在较长时间的负载下,其性能也完全稳定。更多的SSD基准测试可以在 这里.

* ... smaller is better
Reading continuous performance: DiskSpd Read Loop, Queue Depth 8
图形卡
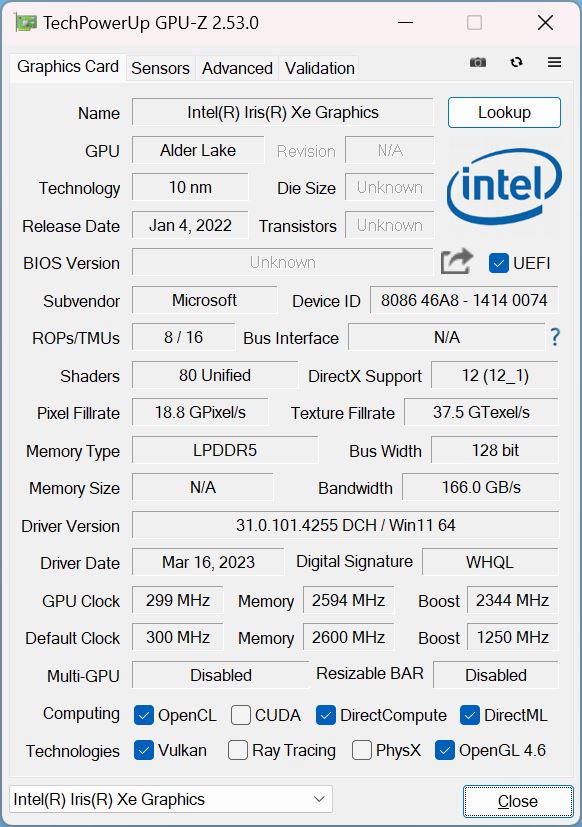
Alder Lake处理器使用了一个集成的 Iris Xe Graphics G7,有96个EUs。这一点我们已经知道有一段时间了--目前的猛禽湖CPU仍在使用。没有专用的显卡。对于包括高分辨率视频播放在内的简单任务,Iris Xe Graphics G7表现充分,比其AMD前辈中的旧Vega 8领先约40%--但我们仍在谈论整体的低性能水平。它的15英寸竞争对手的专用显卡,如RTX 3050 Ti提供了明显更多的性能,即使是在游戏方面。对于Surface Laptop 5,你必须满足于玩较老的或要求不高的游戏,并减少细节。
它的GPU性能在较长的负载下保持稳定,但在电池模式下有大约15%的轻微亏损(1359分@Time Spy Graphics)。更多的GPU基准测试可在 这里.
| 3DMark 11 Performance | 6844 points | |
| 3DMark Fire Strike Score | 4739 points | |
| 3DMark Time Spy Score | 1782 points | |
Help | ||
| Blender / v3.3 Classroom CPU | |
| LG Gram 15Z90Q | |
| Microsoft Surface Laptop 5 15, i7-1255U | |
| Average Intel Iris Xe Graphics G7 96EUs (336 - 1259, n=109) | |
| Average of class Office (245 - 3219, n=75, last 2 years) | |
* ... smaller is better
| The Witcher 3 - 1920x1080 Ultra Graphics & Postprocessing (HBAO+) | |
| Asus Zenbook Pro 15 OLED UM535Q | |
| Dell XPS 15 9520 RTX 3050 Ti | |
| Average of class Office (14.8 - 28.1, n=3, last 2 years) | |
| Samsung Galaxy Book Pro 15 NP950XDB-KC5US | |
| Microsoft Surface Laptop 4 15 AMD TFF_00028 | |
| Microsoft Surface Laptop 5 15, i7-1255U | |
| LG Gram 15Z90Q | |
| GTA V - 1920x1080 Highest AA:4xMSAA + FX AF:16x | |
| Asus Zenbook Pro 15 OLED UM535Q | |
| Dell XPS 15 9520 RTX 3050 Ti | |
| Average of class Office (5.77 - 45.3, n=69, last 2 years) | |
| Samsung Galaxy Book Pro 15 NP950XDB-KC5US | |
| Microsoft Surface Laptop 5 15, i7-1255U | |
| Final Fantasy XV Benchmark - 1920x1080 High Quality | |
| Asus Zenbook Pro 15 OLED UM535Q | |
| Dell XPS 15 9520 RTX 3050 Ti | |
| Samsung Galaxy Book Pro 15 NP950XDB-KC5US | |
| Average of class Office (8.09 - 79.5, n=71, last 2 years) | |
| Microsoft Surface Laptop 5 15, i7-1255U | |
| LG Gram 15Z90Q | |
| Strange Brigade - 1920x1080 ultra AA:ultra AF:16 | |
| Asus Zenbook Pro 15 OLED UM535Q | |
| Dell XPS 15 9520 RTX 3050 Ti | |
| Average of class Office (12.9 - 142.1, n=53, last 2 years) | |
| Samsung Galaxy Book Pro 15 NP950XDB-KC5US | |
| Microsoft Surface Laptop 5 15, i7-1255U | |
Witcher 3 FPS diagram
| low | med. | high | ultra | |
|---|---|---|---|---|
| GTA V (2015) | 98.5 | 87.9 | 22.7 | 9.87 |
| The Witcher 3 (2015) | 88 | 56 | 31 | 12.4 |
| Dota 2 Reborn (2015) | 105.4 | 79.8 | 61.2 | 55.2 |
| Final Fantasy XV Benchmark (2018) | 42.9 | 23.8 | 16.4 | |
| X-Plane 11.11 (2018) | 42.5 | 35 | 28.8 | |
| Strange Brigade (2018) | 87.2 | 38 | 30 | 24.3 |
| F1 2021 (2021) | 101.7 | 50.3 | 39.4 | 27.1 |
| F1 22 (2022) | 45 | 41.4 | 29.6 | 22.3 |
排放与动力
噪声排放
就像它的 前代产品一样,Surface Laptop 5 15的风扇曲线极富防御性,即使在满负荷的情况下,也需要大约一分钟时间,风扇才会启动。它的噪音水平总体上有所下降--我们在游戏和压力测试中测得38.1分贝(A)。噪音从未达到令人讨厌的水平(或变得高亢),但考虑到笔记本的低性能水平和它的大箱子,这些结果仍然不突出。然而,该设备在日常使用中经常保持沉默,听不到其他电子噪音。
Noise level
| Idle |
| 23.3 / 23.3 / 23.3 dB(A) |
| Load |
| 35 / 38.1 dB(A) |
 | ||
30 dB silent 40 dB(A) audible 50 dB(A) loud |
||
min: | ||
| Microsoft Surface Laptop 5 15, i7-1255U Iris Xe G7 96EUs, i7-1255U, SK Hynix BC711 512GB HFM512GD3GX013N | Microsoft Surface Laptop 4 15 AMD TFF_00028 Vega 8, R7 4980U, SK Hynix BC511 HFM512GDJTNI | LG Gram 15Z90Q Iris Xe G7 80EUs, i5-1240P, Samsung PM9A1 MZVL21T0HCLR | Dell XPS 15 9520 RTX 3050 Ti GeForce RTX 3050 Ti Laptop GPU, i7-12700H, WDC PC SN810 512GB | Samsung Galaxy Book Pro 15 NP950XDB-KC5US Iris Xe G7 96EUs, i7-1165G7, Samsung PM991a MZ9LQ1T0HBLB-00BKN | Asus Zenbook Pro 15 OLED UM535Q GeForce RTX 3050 Ti Laptop GPU, R9 5900HX, WDC PC SN730 SDBPNTY-1T00 | |
|---|---|---|---|---|---|---|
| Noise | -6% | -8% | 1% | -3% | -7% | |
| off / environment * (dB) | 23.3 | 24.2 -4% | 25 -7% | 22.8 2% | 23 1% | 22.8 2% |
| Idle Minimum * (dB) | 23.3 | 24.2 -4% | 26 -12% | 22.9 2% | 23.2 -0% | 22.9 2% |
| Idle Average * (dB) | 23.3 | 24.2 -4% | 27 -16% | 22.9 2% | 23.2 -0% | 22.9 2% |
| Idle Maximum * (dB) | 23.3 | 24.2 -4% | 28 -20% | 22.9 2% | 23.2 -0% | 22.9 2% |
| Load Average * (dB) | 35 | 39.9 -14% | 37 -6% | 30.9 12% | 35.8 -2% | 33.2 5% |
| Witcher 3 ultra * (dB) | 38.1 | 39.9 -5% | 37 3% | 37.8 1% | 41.9 -10% | 47.3 -24% |
| Load Maximum * (dB) | 38.1 | 39.9 -5% | 37 3% | 44.7 -17% | 41.9 -10% | 52.8 -39% |
* ... smaller is better
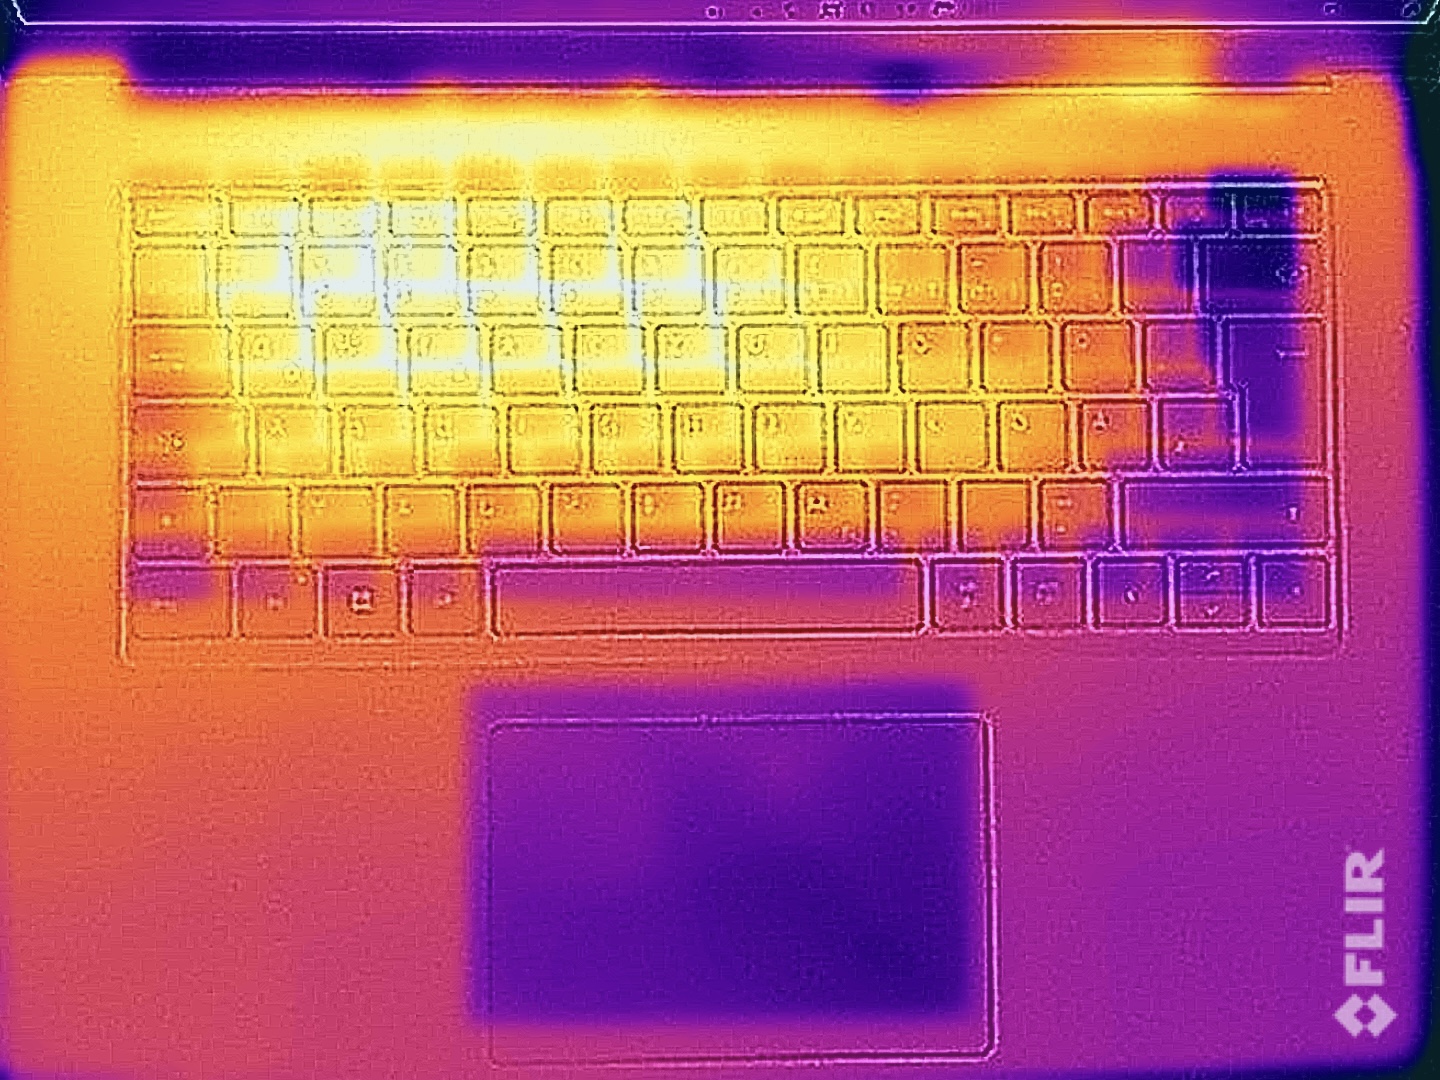
温度
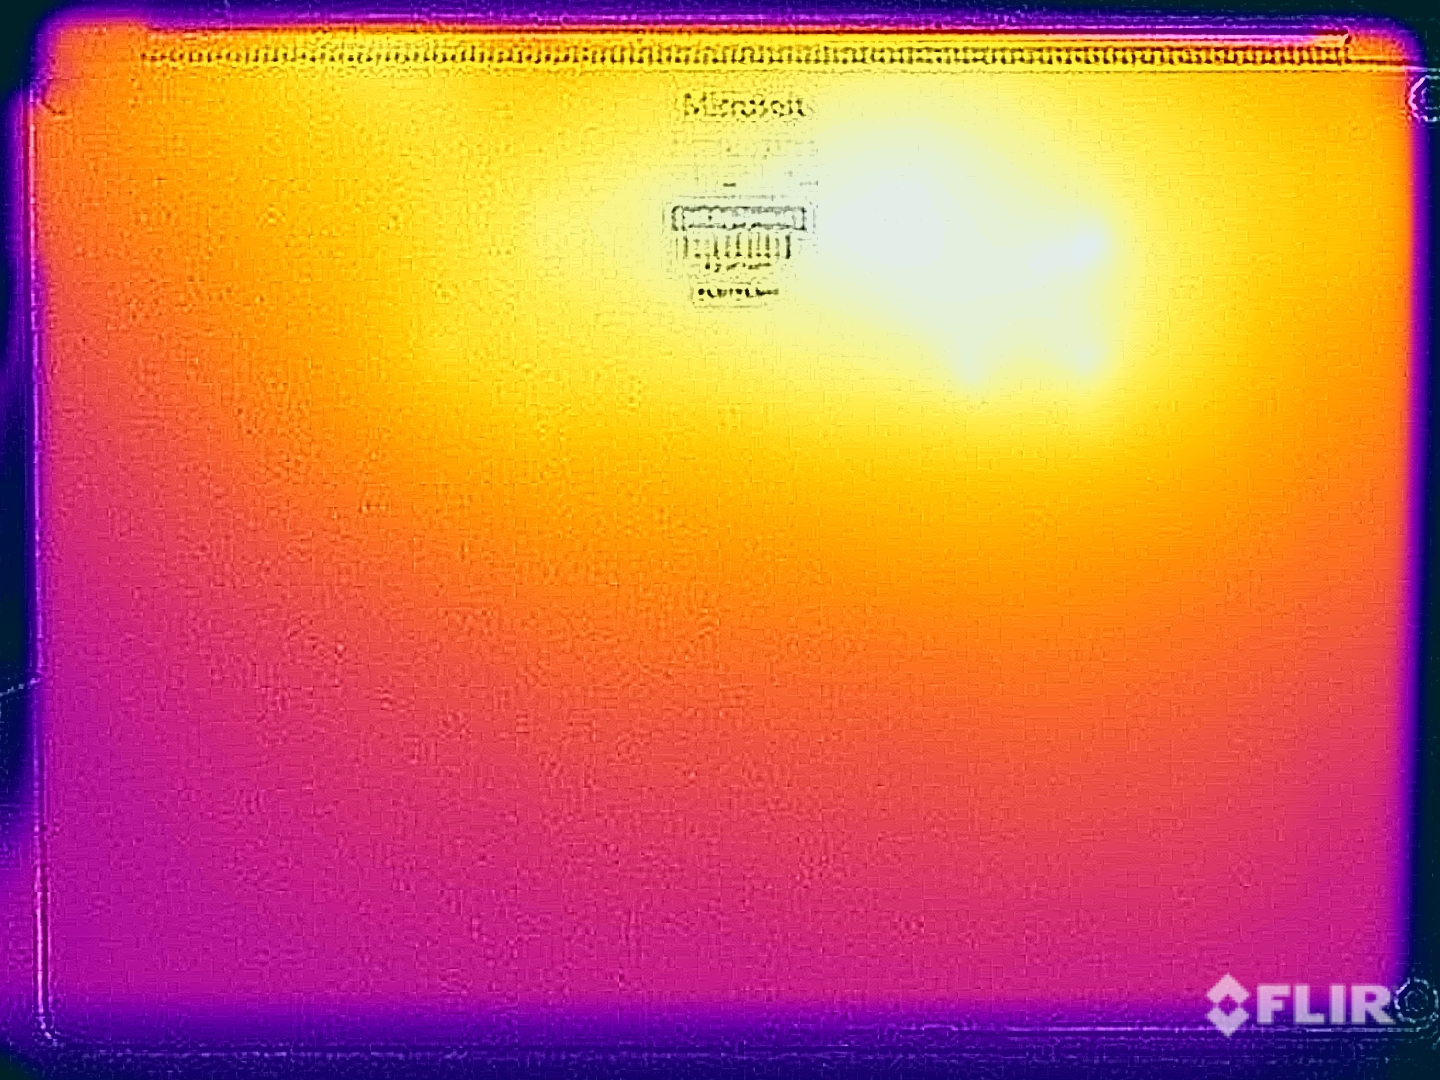
在简单的任务中,机箱几乎没有升温,但我们在负载情况下在机箱底部测量到高达47℃。由于其金属表面,这个温度已经被证明是不舒服的,所以我们建议在这种情况下不要把设备放在你的大腿上。
这些高温有点令人惊讶,因为在我们的压力测试中,设备的功耗在几分钟后才稳定在25瓦,但在30分钟后进一步下降到23瓦左右,考虑到机箱的尺寸,这不是特别好。然而,在压力测试之后,我们没有注意到功率的直接减少。
(±) The maximum temperature on the upper side is 44.6 °C / 112 F, compared to the average of 34.3 °C / 94 F, ranging from 21.2 to 62.5 °C for the class Office.
(-) The bottom heats up to a maximum of 47.4 °C / 117 F, compared to the average of 36.8 °C / 98 F
(+) In idle usage, the average temperature for the upper side is 22.2 °C / 72 F, compared to the device average of 29.5 °C / 85 F.
(±) Playing The Witcher 3, the average temperature for the upper side is 37.8 °C / 100 F, compared to the device average of 29.5 °C / 85 F.
(±) The palmrests and touchpad can get very hot to the touch with a maximum of 36.5 °C / 97.7 F.
(-) The average temperature of the palmrest area of similar devices was 27.5 °C / 81.5 F (-9 °C / -16.2 F).
| Microsoft Surface Laptop 5 15, i7-1255U Intel Core i7-1255U, Intel Iris Xe Graphics G7 96EUs | Microsoft Surface Laptop 4 15 AMD TFF_00028 AMD Ryzen 7 4980U, AMD Radeon RX Vega 8 (Ryzen 4000/5000) | LG Gram 15Z90Q Intel Core i5-1240P, Intel Iris Xe Graphics G7 80EUs | Dell XPS 15 9520 RTX 3050 Ti Intel Core i7-12700H, NVIDIA GeForce RTX 3050 Ti Laptop GPU | Samsung Galaxy Book Pro 15 NP950XDB-KC5US Intel Core i7-1165G7, Intel Iris Xe Graphics G7 96EUs | Asus Zenbook Pro 15 OLED UM535Q AMD Ryzen 9 5900HX, NVIDIA GeForce RTX 3050 Ti Laptop GPU | |
|---|---|---|---|---|---|---|
| Heat | 2% | -3% | -25% | 5% | -28% | |
| Maximum Upper Side * (°C) | 44.6 | 41.8 6% | 46 -3% | 51.4 -15% | 37.2 17% | 36 19% |
| Maximum Bottom * (°C) | 47.4 | 44.8 5% | 45 5% | 51 -8% | 47 1% | 47.2 -0% |
| Idle Upper Side * (°C) | 22.6 | 23 -2% | 25 -11% | 30 -33% | 22 3% | 37 -64% |
| Idle Bottom * (°C) | 23.3 | 23.6 -1% | 24 -3% | 33 -42% | 23.6 -1% | 39.2 -68% |
* ... smaller is better
发言人
没有可见的扬声器格栅,因为声音是通过键盘的开口发出的。这在实践中效果很好,因为尽管外面肯定有更大的模块,但整体质量非常好,外部扬声器并不是真的需要。
Microsoft Surface Laptop 5 15, i7-1255U audio analysis
(±) | speaker loudness is average but good (78.1 dB)
Bass 100 - 315 Hz
(±) | reduced bass - on average 14% lower than median
(±) | linearity of bass is average (9.3% delta to prev. frequency)
Mids 400 - 2000 Hz
(+) | balanced mids - only 2.3% away from median
(+) | mids are linear (4.1% delta to prev. frequency)
Highs 2 - 16 kHz
(+) | balanced highs - only 2.8% away from median
(+) | highs are linear (3.2% delta to prev. frequency)
Overall 100 - 16.000 Hz
(+) | overall sound is linear (12.9% difference to median)
Compared to same class
» 6% of all tested devices in this class were better, 2% similar, 91% worse
» The best had a delta of 7%, average was 21%, worst was 53%
Compared to all devices tested
» 12% of all tested devices were better, 3% similar, 85% worse
» The best had a delta of 4%, average was 23%, worst was 134%
Dell XPS 15 9520 RTX 3050 Ti audio analysis
(+) | speakers can play relatively loud (83.1 dB)
Bass 100 - 315 Hz
(+) | good bass - only 4.4% away from median
(+) | bass is linear (6.8% delta to prev. frequency)
Mids 400 - 2000 Hz
(+) | balanced mids - only 2.6% away from median
(+) | mids are linear (4.1% delta to prev. frequency)
Highs 2 - 16 kHz
(+) | balanced highs - only 1.9% away from median
(+) | highs are linear (5.4% delta to prev. frequency)
Overall 100 - 16.000 Hz
(+) | overall sound is linear (6.4% difference to median)
Compared to same class
» 4% of all tested devices in this class were better, 1% similar, 95% worse
» The best had a delta of 5%, average was 17%, worst was 45%
Compared to all devices tested
» 1% of all tested devices were better, 0% similar, 99% worse
» The best had a delta of 4%, average was 23%, worst was 134%
消耗功率
消耗量的测量结果没有显示出任何意外,最大的空闲消耗量(全亮度)为8.4瓦特。在CPU高负荷时,该设备有几秒钟进入了电源的极限,由于目前英特尔CPU的高功率限制,这几乎是现在的常态。在我们的压力测试中,消耗量很快平息在45瓦,65瓦的电源,还提供另一个USB-A输出用于充电,总体上是足够的。
| Off / Standby | |
| Idle | |
| Load |
|
Key:
min: | |
Power consumption Witcher 3 / stress test
Power consumption with external monitor
运行时间
电池容量保持不变,为47.4瓦特小时,运行时间与前代相比全面恶化。 前代产品采用AMD处理器。我们注意到,在150cd/m²(相当于测试设备最大亮度的64%)的WLAN测试中,运行时间略高于8.5小时,在全亮度下运行时间为6.5小时。而AMD的前辈则分别达到了10.5小时和7小时左右。英特尔型号在视频测试中表现也较差,只有9:44小时,而AMD的Surface Laptop 4则为15小时左右。
| Microsoft Surface Laptop 5 15, i7-1255U i7-1255U, Iris Xe G7 96EUs, 47.4 Wh | Microsoft Surface Laptop 4 15 AMD TFF_00028 R7 4980U, Vega 8, 47.4 Wh | LG Gram 15Z90Q i5-1240P, Iris Xe G7 80EUs, 80 Wh | Dell XPS 15 9520 RTX 3050 Ti i7-12700H, GeForce RTX 3050 Ti Laptop GPU, 86 Wh | Samsung Galaxy Book Pro 15 NP950XDB-KC5US i7-1165G7, Iris Xe G7 96EUs, 68 Wh | Asus Zenbook Pro 15 OLED UM535Q R9 5900HX, GeForce RTX 3050 Ti Laptop GPU, 96 Wh | Average of class Office | |
|---|---|---|---|---|---|---|---|
| Battery runtime | 28% | 32% | 21% | -5% | 53% | 31% | |
| H.264 (h) | 9.7 | 14.8 53% | 15.5 ? 60% | ||||
| WiFi v1.3 (h) | 8.6 | 10.4 21% | 11.9 38% | 8.8 2% | 10.1 17% | 12.8 49% | 13.2 ? 53% |
| Load (h) | 2.3 | 2.5 9% | 2.9 26% | 3.2 39% | 1.7 -26% | 3.6 57% | 1.808 ? -21% |
Pros
Cons
结论--Surface Laptop 5亟需更大的更新
Surface笔记本电脑的第五代产品显然已经开始显示出其年龄。我们说的不是去年的Alder-Lake处理器,因为最新的Raptor-Lake型号只提供了少量的性能,而是关于设备的设计本身。对于一个现代设备来说,屏幕的边缘简直太宽了,720p的网络摄像头也不再是最新的了,更强大的冷却系统也会派上用场。对于一个15英寸的机箱来说,它的整体性能是相当一般的,而且它显然缺乏维护选项。
我们理解微软由于供应情况而取消了AMD版本,其较低的多核性能对于办公笔记本电脑来说可能不会是一个大问题,但是我们也注意到电池运行时间明显缩短。因此,新的Surface Laptop 5并不是真正向正确的方向迈出了一步。
微软Surface Laptop 5亟需进行广泛的更新--多年来,你似乎只是一次又一次地得到相同的产品。通常情况下,其竞争对手提供更多的功能和更好的性能--价格也更低。在2023年,所提供的软件包根本不足以证明其高价的合理性。
该设备的3:2格式显示屏仍然很适合生产性工作,也有良好的主观画质,但微软在规格方面显然落后了。如果有更高的频率和更大的色彩空间覆盖,这里会有更大的潜力。
除了评测样品的外壳有点吱吱作响之外,Surface Laptop 5实际上是一个坚实的设备;最大的问题是价格。我们的测试设备配备16GB内存和512GB固态硬盘(所以绝不是高端型号)的建议零售价约为4,000美元,而微软至今仍在收取这一价格。这对于所提供的产品来说显然是太多了,甚至目前1699美元的高价也是太高了,如果你看看最近评论的 联想Yoga Pro 7 14例如,该产品在几乎所有方面的得分都高得多,而且价格只有1449美元左右。
价格和可用性
你可以在亚马逊上找到比MRSP便宜很多的Surface Laptop 5 15,价格为1699美元。
Microsoft Surface Laptop 5 15, i7-1255U
- 04/24/2023 v7 (old)
Andreas Osthoff
Transparency
The selection of devices to be reviewed is made by our editorial team. The test sample was provided to the author as a loan by the manufacturer or retailer for the purpose of this review. The lender had no influence on this review, nor did the manufacturer receive a copy of this review before publication. There was no obligation to publish this review. As an independent media company, Notebookcheck is not subjected to the authority of manufacturers, retailers or publishers.
This is how Notebookcheck is testing
Every year, Notebookcheck independently reviews hundreds of laptops and smartphones using standardized procedures to ensure that all results are comparable. We have continuously developed our test methods for around 20 years and set industry standards in the process. In our test labs, high-quality measuring equipment is utilized by experienced technicians and editors. These tests involve a multi-stage validation process. Our complex rating system is based on hundreds of well-founded measurements and benchmarks, which maintains objectivity. Further information on our test methods can be found here.
Price comparison

