Acer Swift 3 SF316-51 in review:这款笔记本电脑是否对得起它的名字?
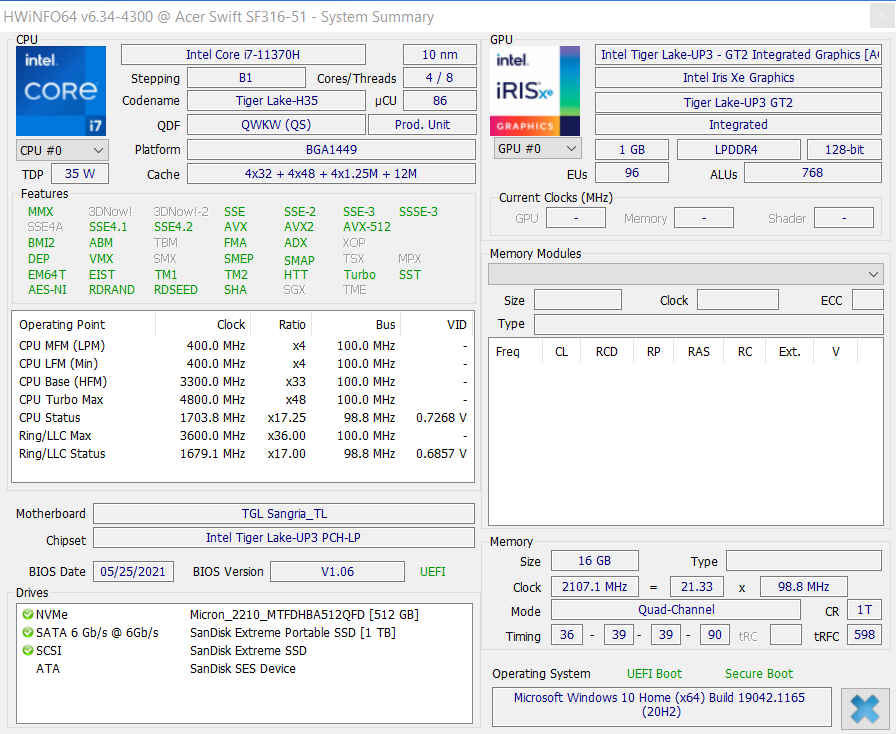
宏碁提供不同版本的Swift 3。对于16.1英寸机型,我们有SF316-51-75MK旗舰机型供审查。它配备了Intel Core i7-11370H及其板载Intel Iris Xe Graphics G7 96EUs ,配以四通道模式的16GB LPDDR4x内存和512GB SSD。
宏碁Swift 3 SF316-51-75MK不仅要在我们的测试中证明其在各个类别的价值,而且还要面对竞争。我们的评论显示了该设备与配备相同CPU的小米RedmiBook Pro 15,或与配备较弱的Intel Tiger Lake i5-11300H 笔记本处理器 i5-11300H联想IdeaPad 5 Pro 16IHU6的回顾。16英寸全能型产品,电池寿命良好的联想IdeaPad 5 Pro 16IHU6相比较,这两款产品都配备了 MX450GeForce 。
Possible contenders in comparison
Rating | Date | Model | Weight | Height | Size | Resolution | Price |
|---|---|---|---|---|---|---|---|
| 86.4 % v7 (old) | 10 / 2021 | Acer Swift 3 SF316-51 i7-11370H, Iris Xe G7 96EUs | 1.7 kg | 15.9 mm | 16.10" | 1920x1080 | |
| 83.2 % v7 (old) | Xiaomi RedmiBook Pro 15 i7-11370H, GeForce MX450 | 1.7 kg | 16 mm | 15.60" | 3200x2000 | ||
| 82.3 % v7 (old) | 09 / 2021 | Dell Inspiron 15 5518-2X3JR i5-11300H, GeForce MX450 | 1.8 kg | 18 mm | 15.60" | 1920x1080 | |
| 86 % v7 (old) | 08 / 2021 | Lenovo IdeaPad 5 Pro 16IHU6 i5-11300H, GeForce MX450 | 1.9 kg | 18.4 mm | 16.00" | 2560x1600 | |
| 82.1 % v7 (old) | Asus VivoBook S15 D533UA R7 5700U, Vega 8 | 1.8 kg | 16.1 mm | 15.60" | 1920x1080 | ||
| 86 % v7 (old) | 04 / 2021 | Huawei MateBook D 16-53011VFJ R5 4600H, Vega 6 | 1.7 kg | 18.4 mm | 16.10" | 1920x1080 |
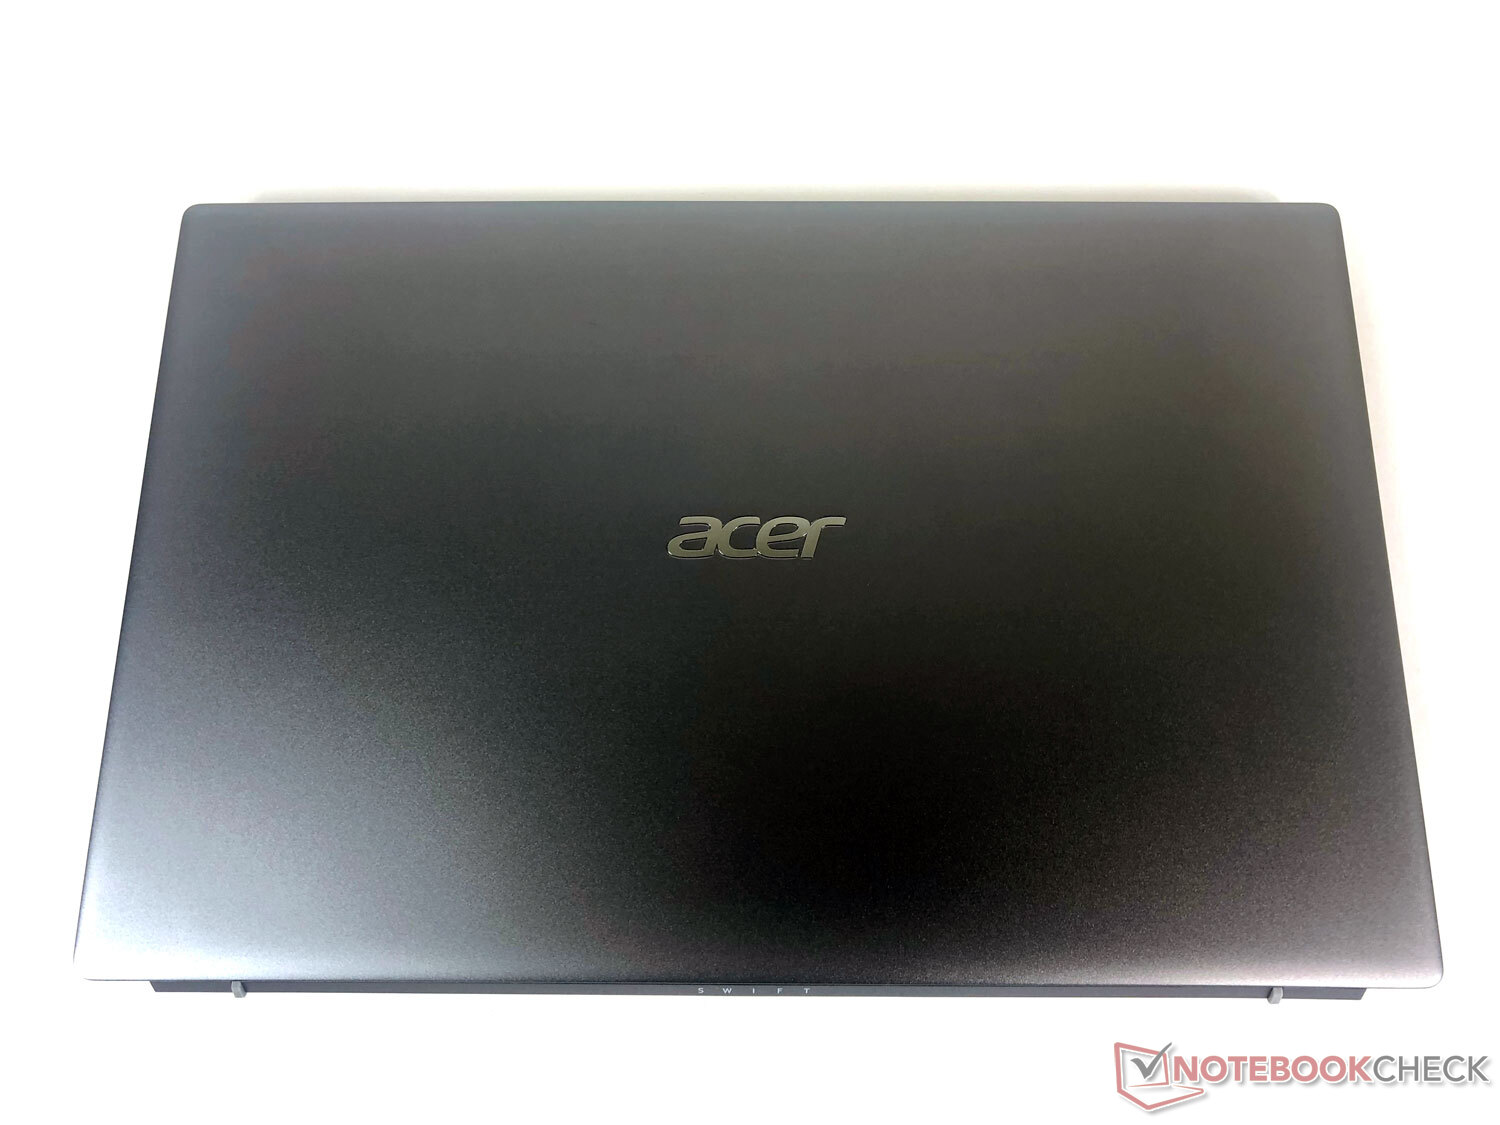
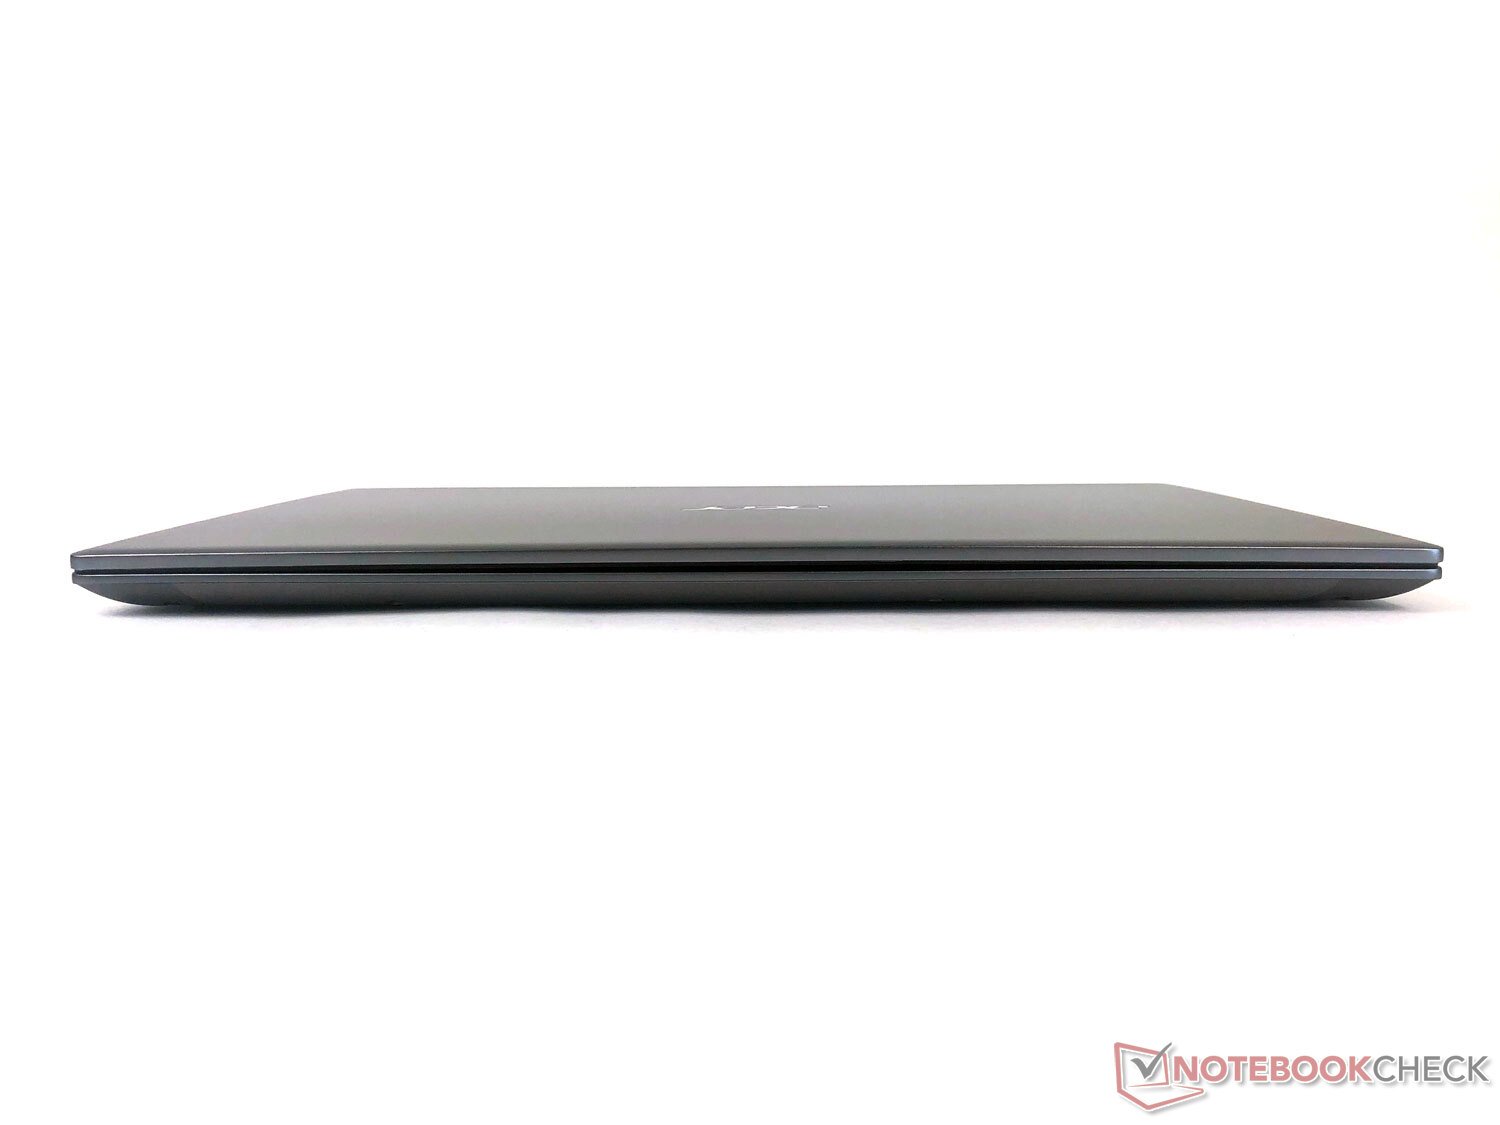
金属外壳在测试中得了分
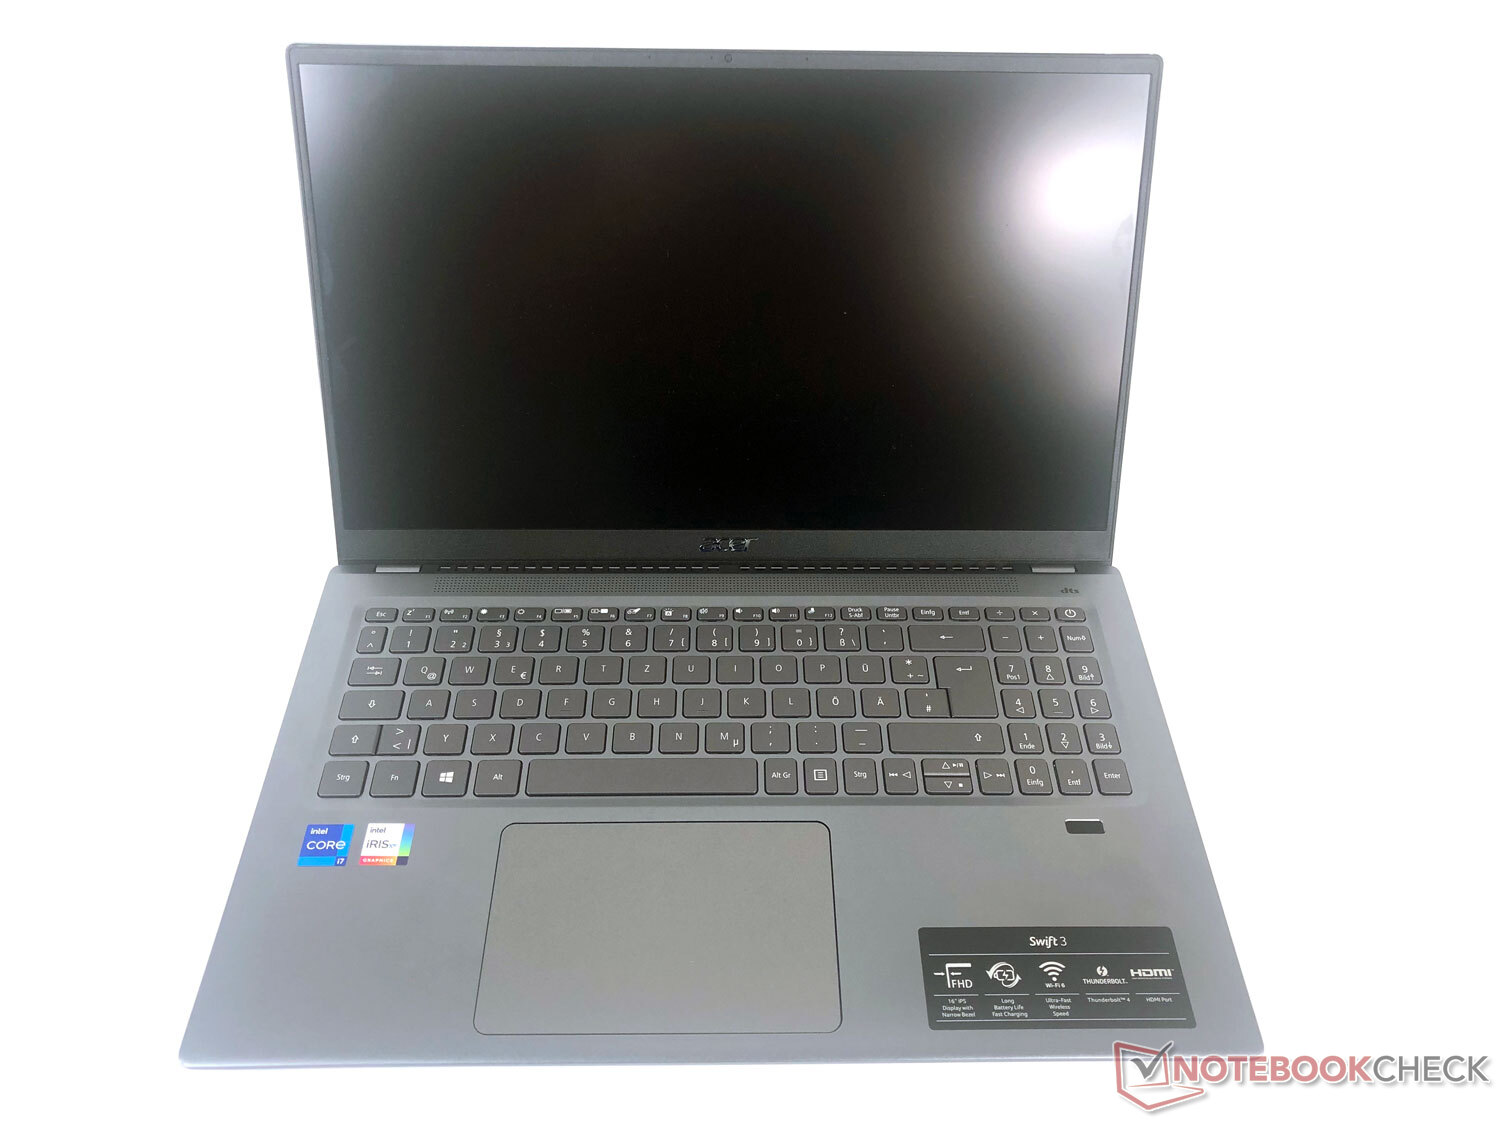
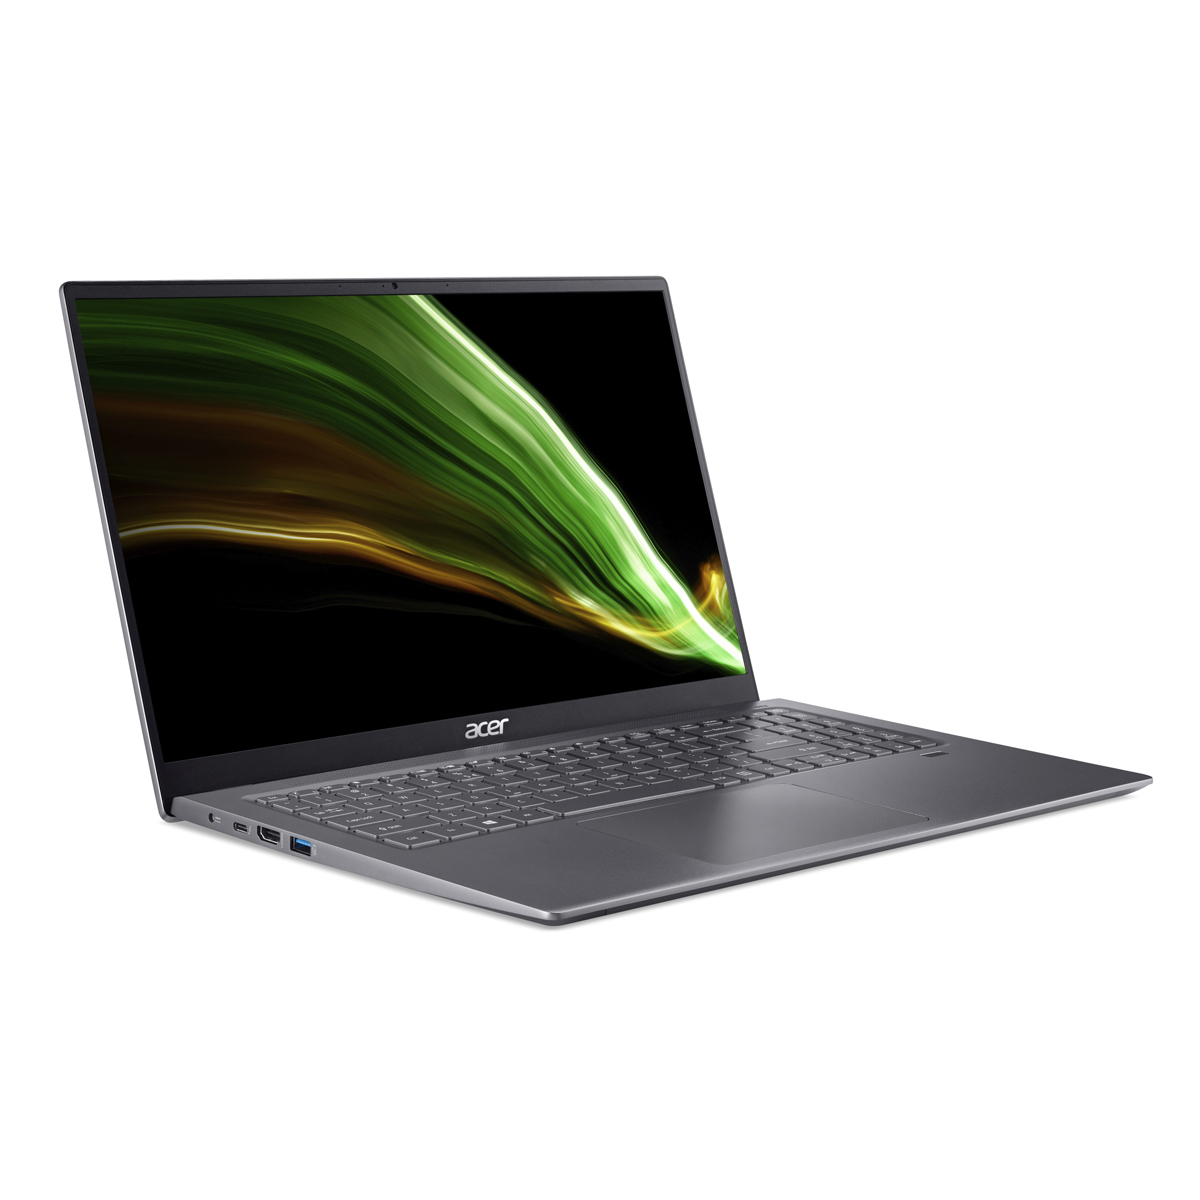
宏碁Swift 3 SF316-51采用灰色金属外壳,给人留下高质量和优雅的印象,同时触感也很好。
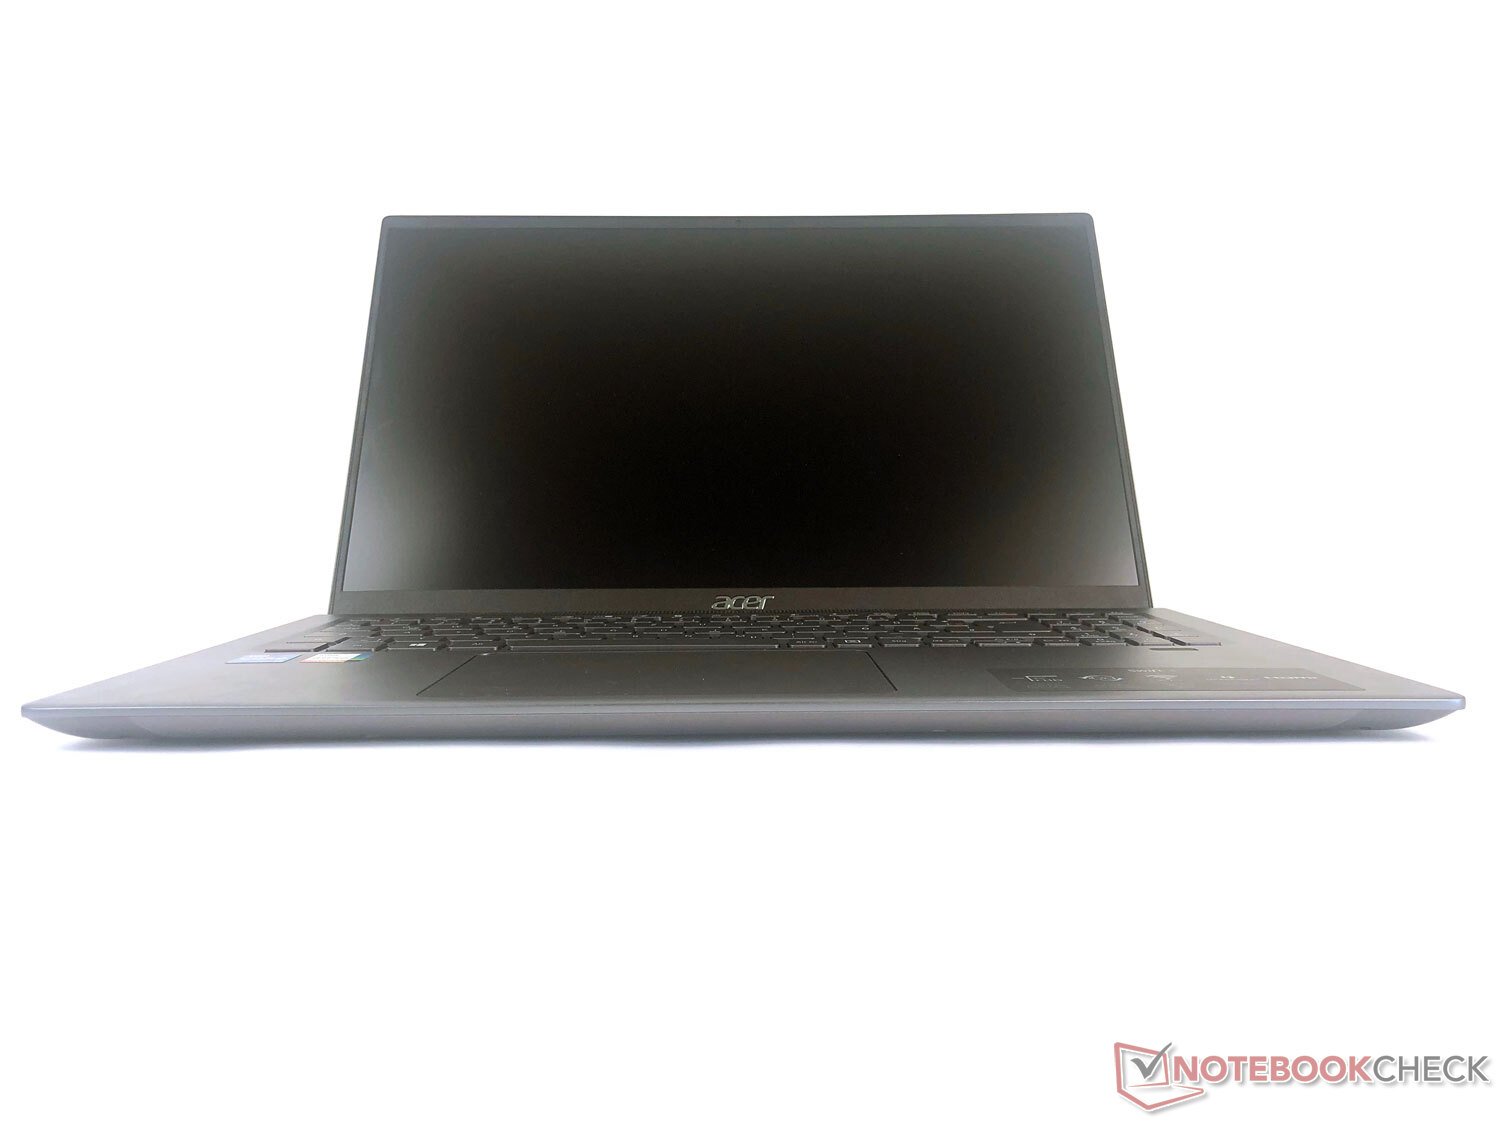
固定屏幕的两个铰链被调整得相当紧。因此,打开的屏幕在移动时有些晃动,但仍然可以用一只手打开和定位。
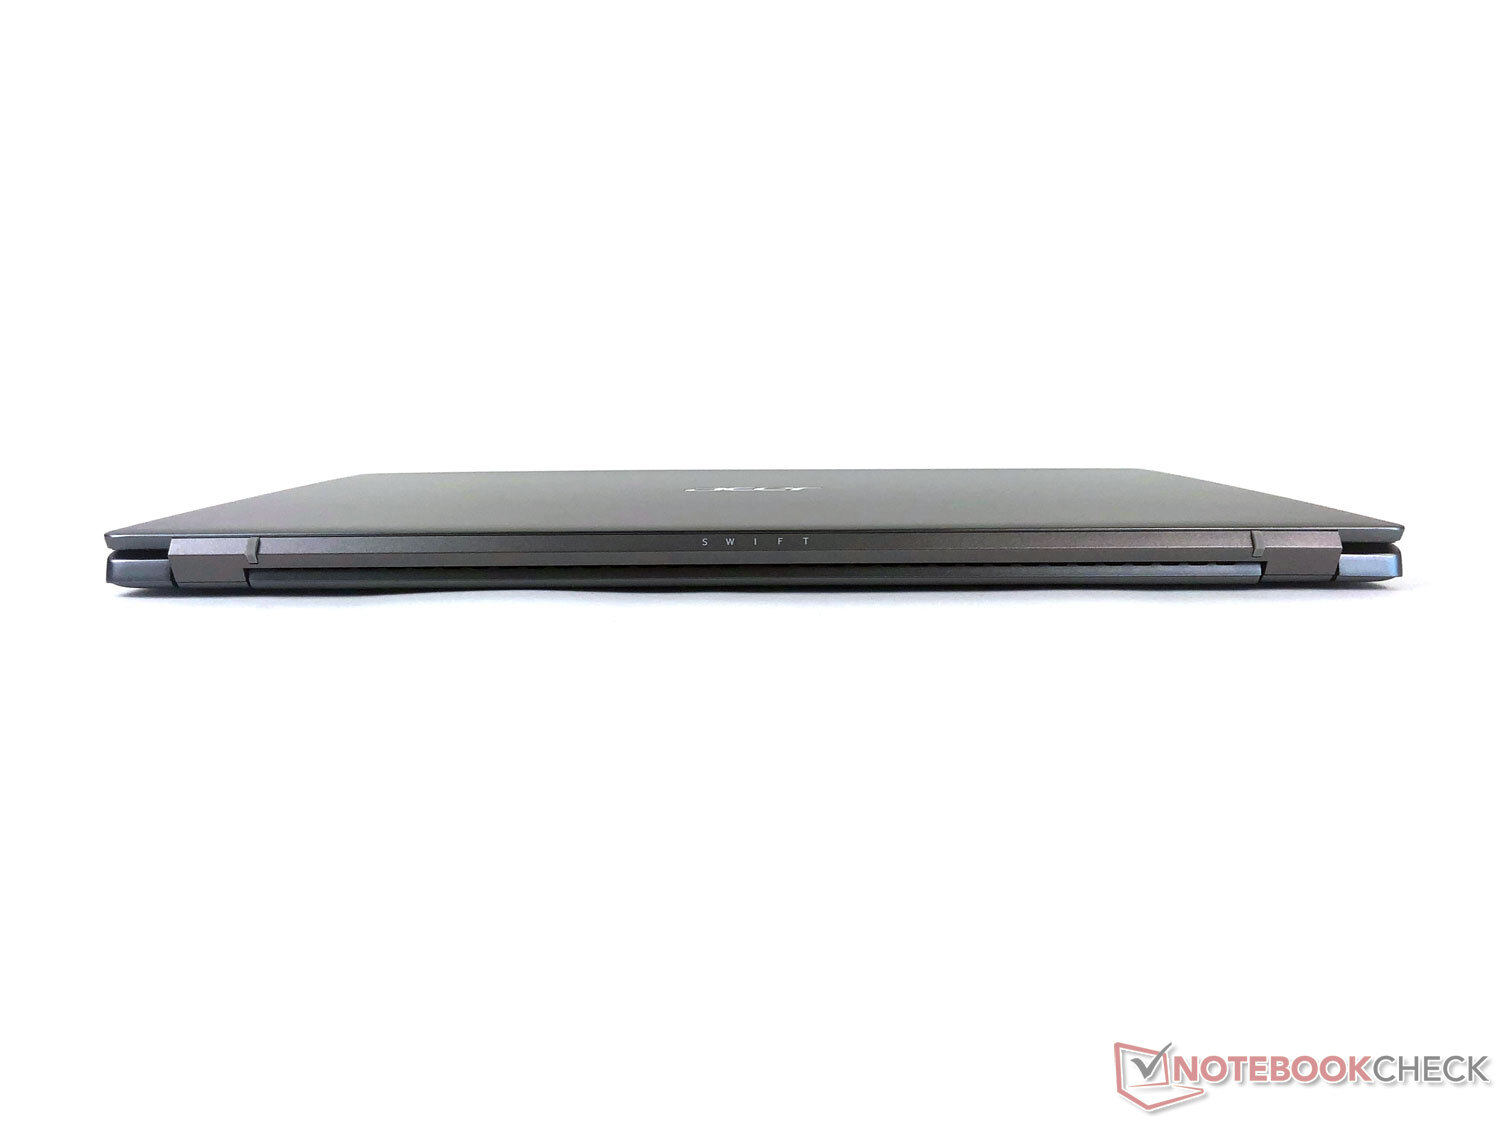
大多数对比机型都配备了15.6英寸显示屏,比宏碁Swift 3 SF316-51-75MK的16.1英寸显示屏略小。尽管如此,由于显示器边框较窄,该设备除了几毫米之外几乎没有更大的尺寸。
我们的评测样本不需要不避讳面对华为MateBook D 16-53011VFJ 和联想IdeaPad 5 Pro 16IHU6 ,它们也都有16英寸显示屏。MateBook D 16的尺寸几乎相同,但它更厚一点,重量也相同,约为1.7公斤。IdeaPad 5更窄一些,但更长、更厚。因此,Swift 3给人留下了很好的印象,其紧凑的尺寸和令人愉快的轻量,甚至是15.6英寸的对比设备都无法超越。包括电源适配器在内,它的重量不到2公斤。
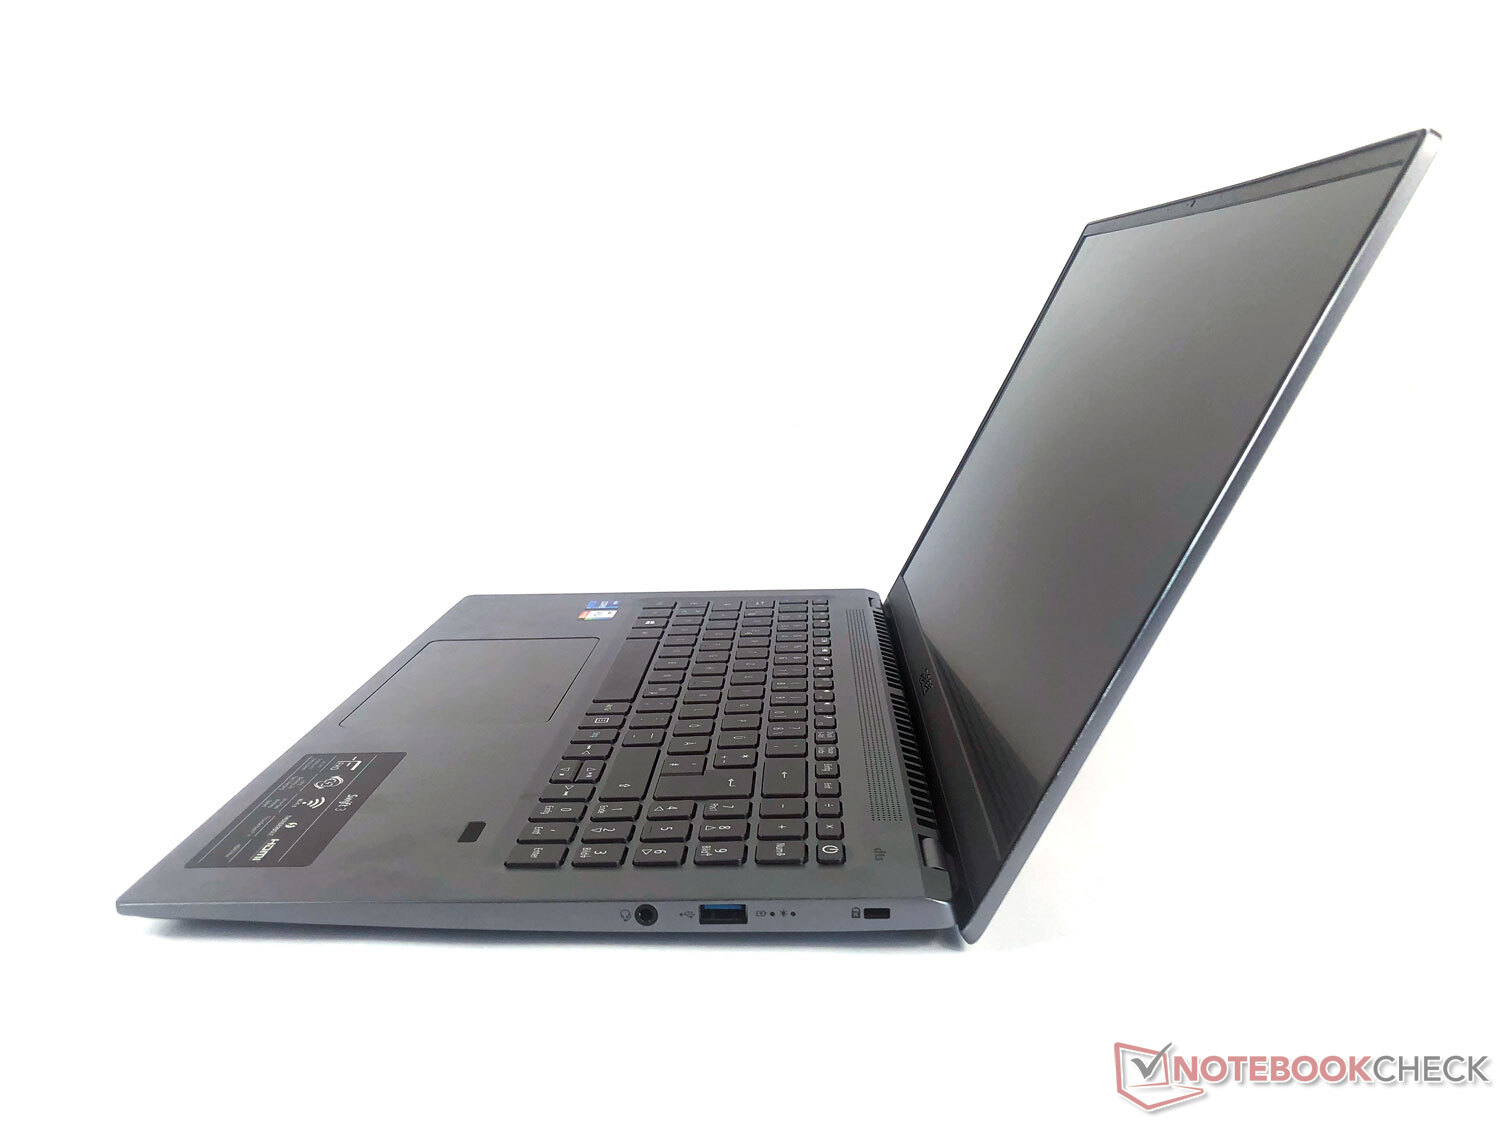
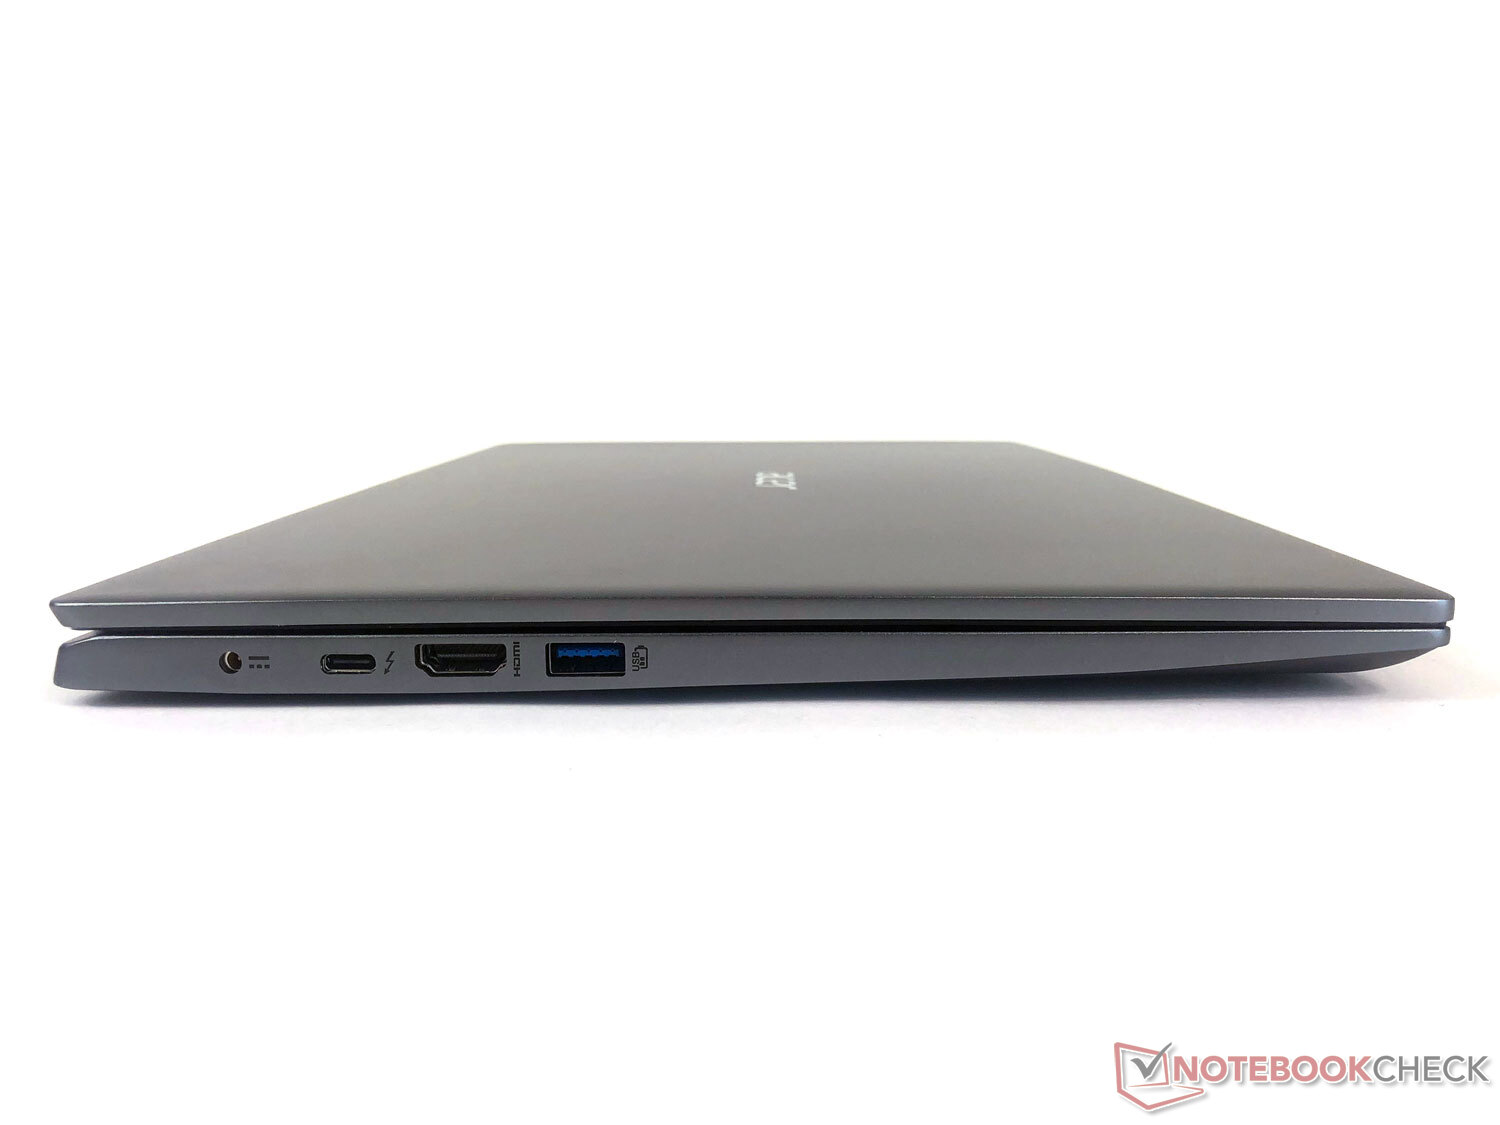
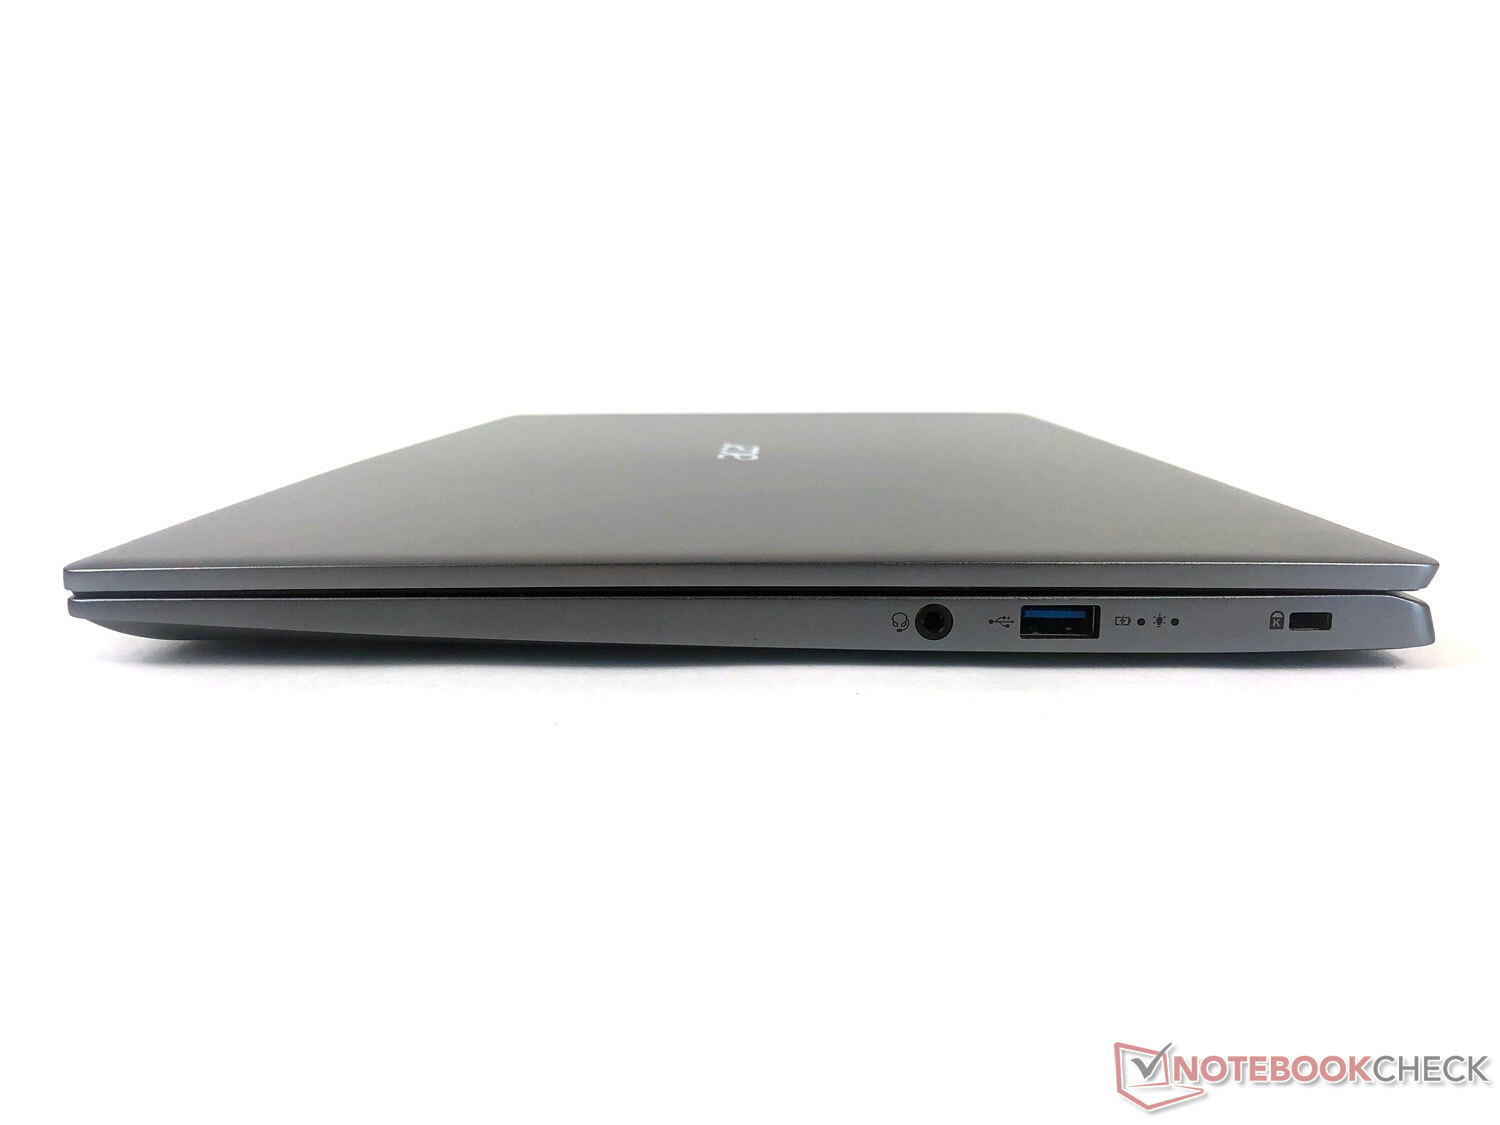
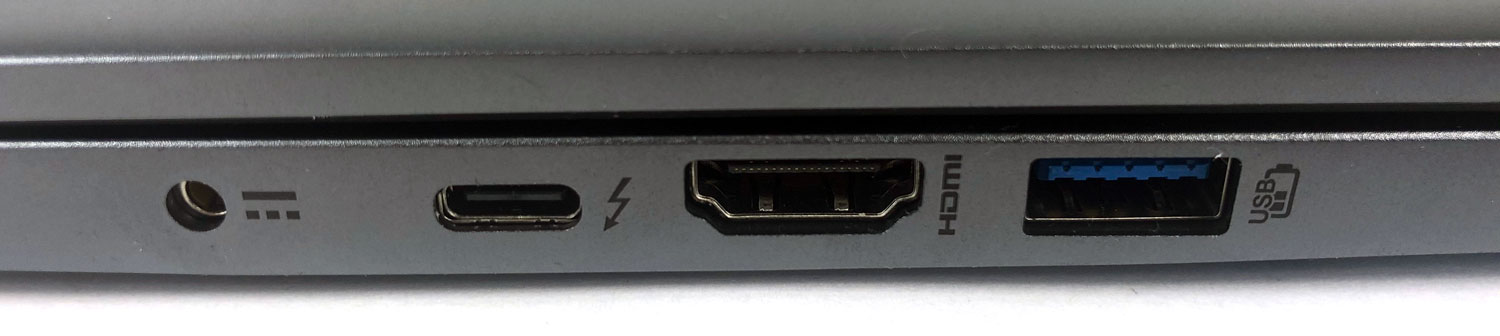
连接性。笔记本电脑有雷电4,但没有SD读卡器
所有的端口都分布在机箱的左侧和右侧。由于侧面的形状,这些端口都位于后部区域,朝前的部分比较窄。然而,它们之间有足够的空间,所以它们不会相互干扰。
有一个HDMI输出,以及一个通过USB Type-C提供的Thunderbolt 4端口,用于连接外部显示器。然而,没有网络连接。

沟通
内置的英特尔Wi-Fi 6 AX201在测试中表现稳定,但在发送数据时仍低于平均水平。蓝牙5.1版可用于额外的无线连接。
| Networking | |
| iperf3 transmit AX12 | |
| Xiaomi RedmiBook Pro 15 | |
| Lenovo IdeaPad 5 Pro 16IHU6 | |
| Average Intel Wi-Fi 6 AX201 (49.8 - 1775, n=324) | |
| Acer Swift 3 SF316-51 | |
| Huawei MateBook D 16-53011VFJ | |
| iperf3 receive AX12 | |
| Xiaomi RedmiBook Pro 15 | |
| Lenovo IdeaPad 5 Pro 16IHU6 | |
| Acer Swift 3 SF316-51 | |
| Average Intel Wi-Fi 6 AX201 (136 - 1743, n=324) | |
| Huawei MateBook D 16-53011VFJ | |
网络摄像头
由于平均DeltaE为10.6,720p网络摄像头在色彩再现方面表现得很好。对于视频通话等来说,这绝对是足够的。


安全问题
在设备的右侧集成了一个用于Kensington锁的插槽。没有额外的安全功能。
辅料
盒子里只包括大小适中的65瓦充电器。更多的配件没有包括在内,但它们可以直接从制造商那里购买,形式包括通用的外壳、适配器等等。
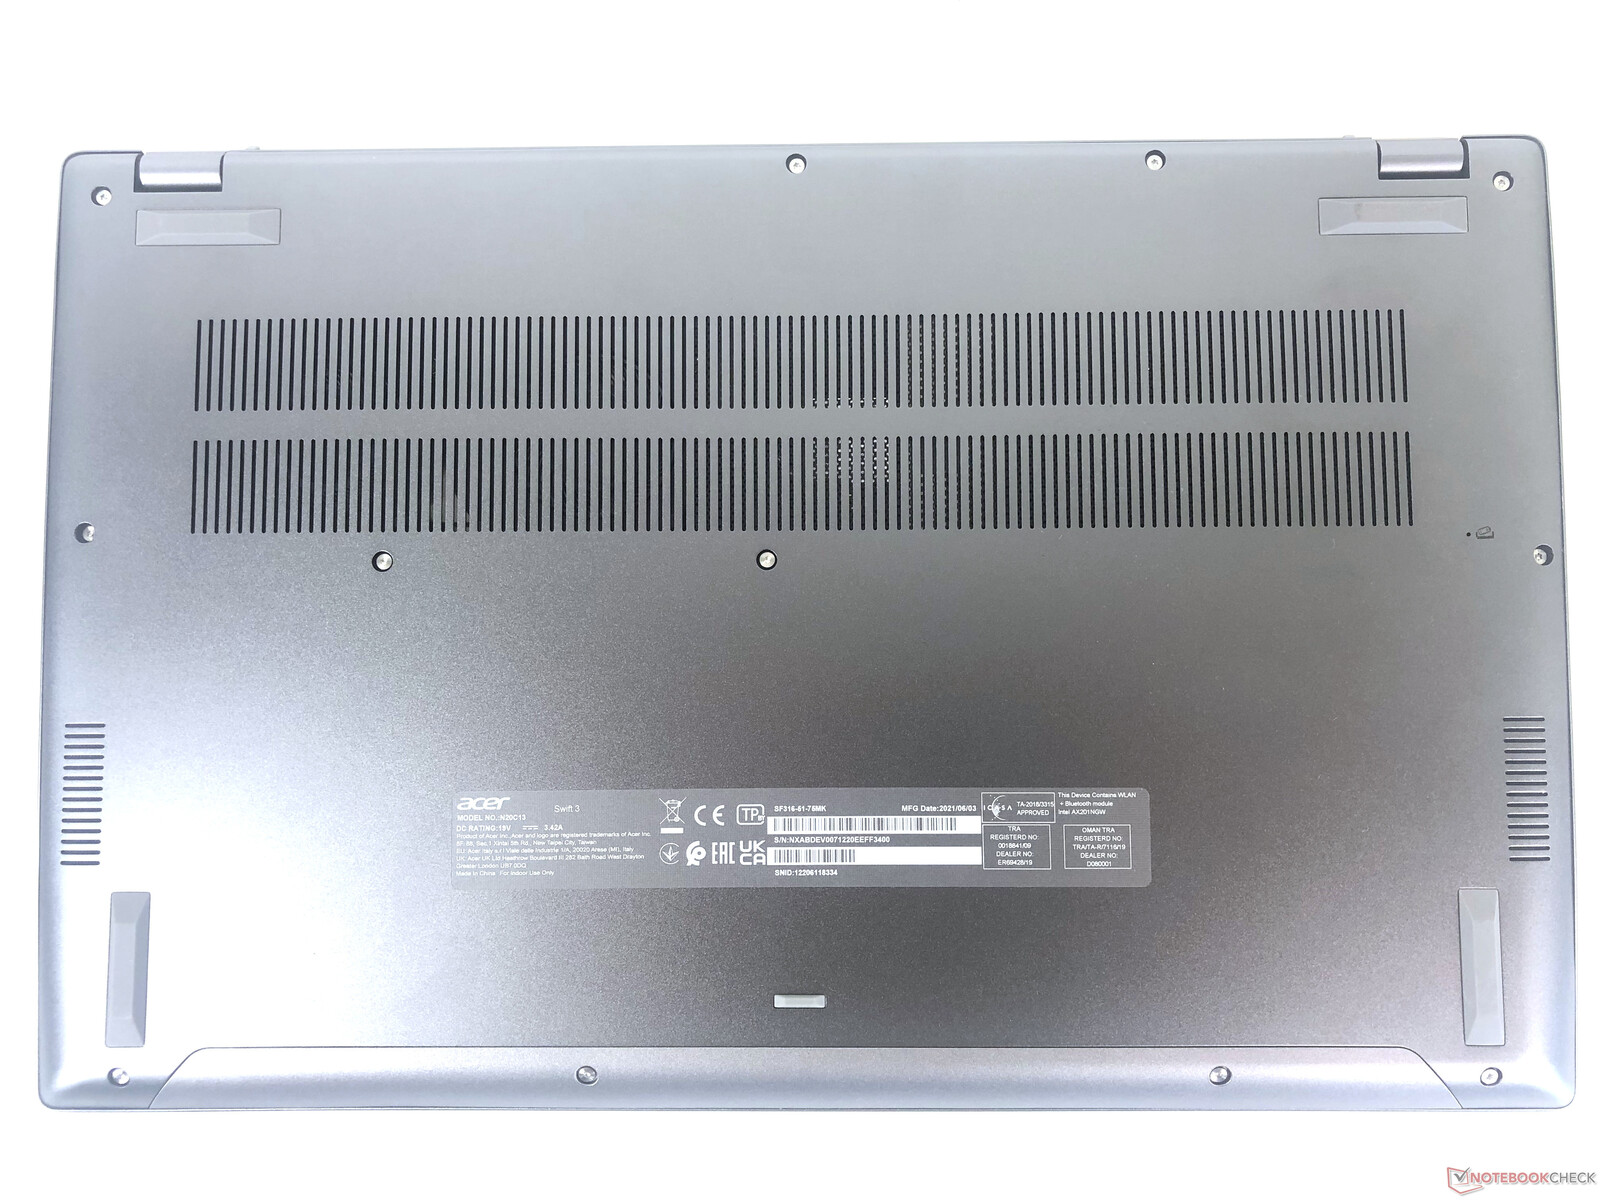
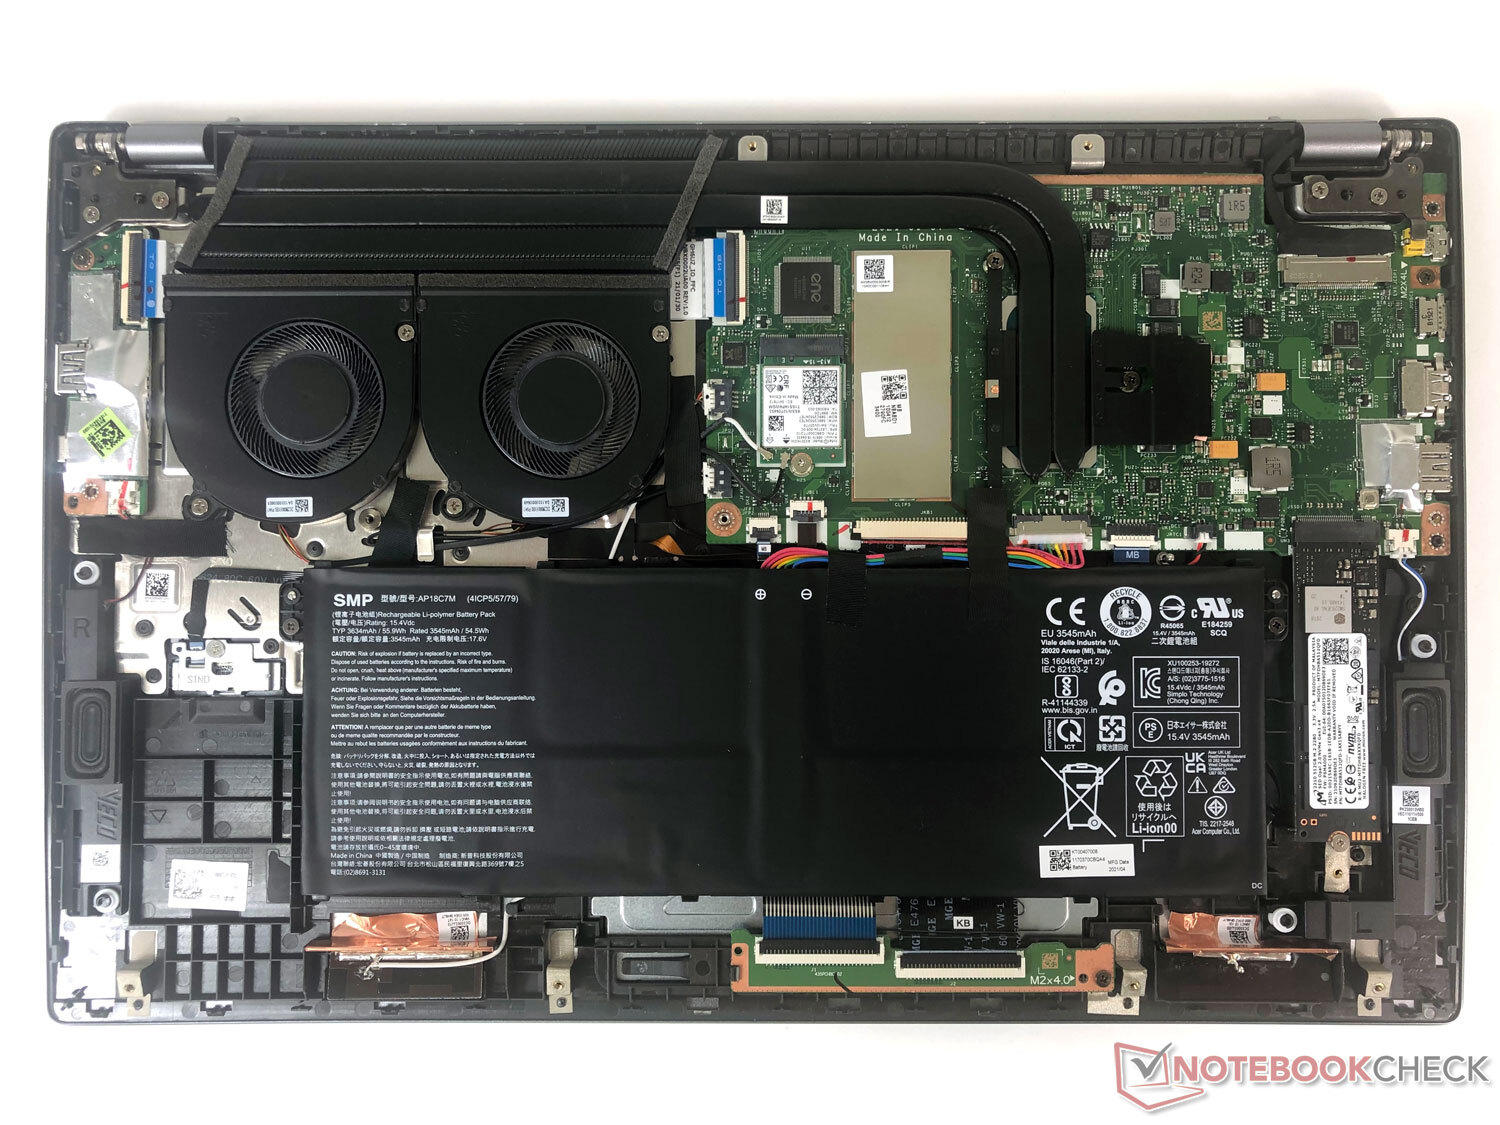
维护
进入内部的通道被12颗小的Torx螺丝挡住了。清洁两个风扇,安装不同的固态硬盘,或更换电池,都可以轻松完成。
担保
宏碁在德国为Swift笔记本电脑提供通常的24个月制造商保修,并提供送检和退货服务。可以选择购买第三年的服务延期,以换取50至150欧元(约58至约173美元)。
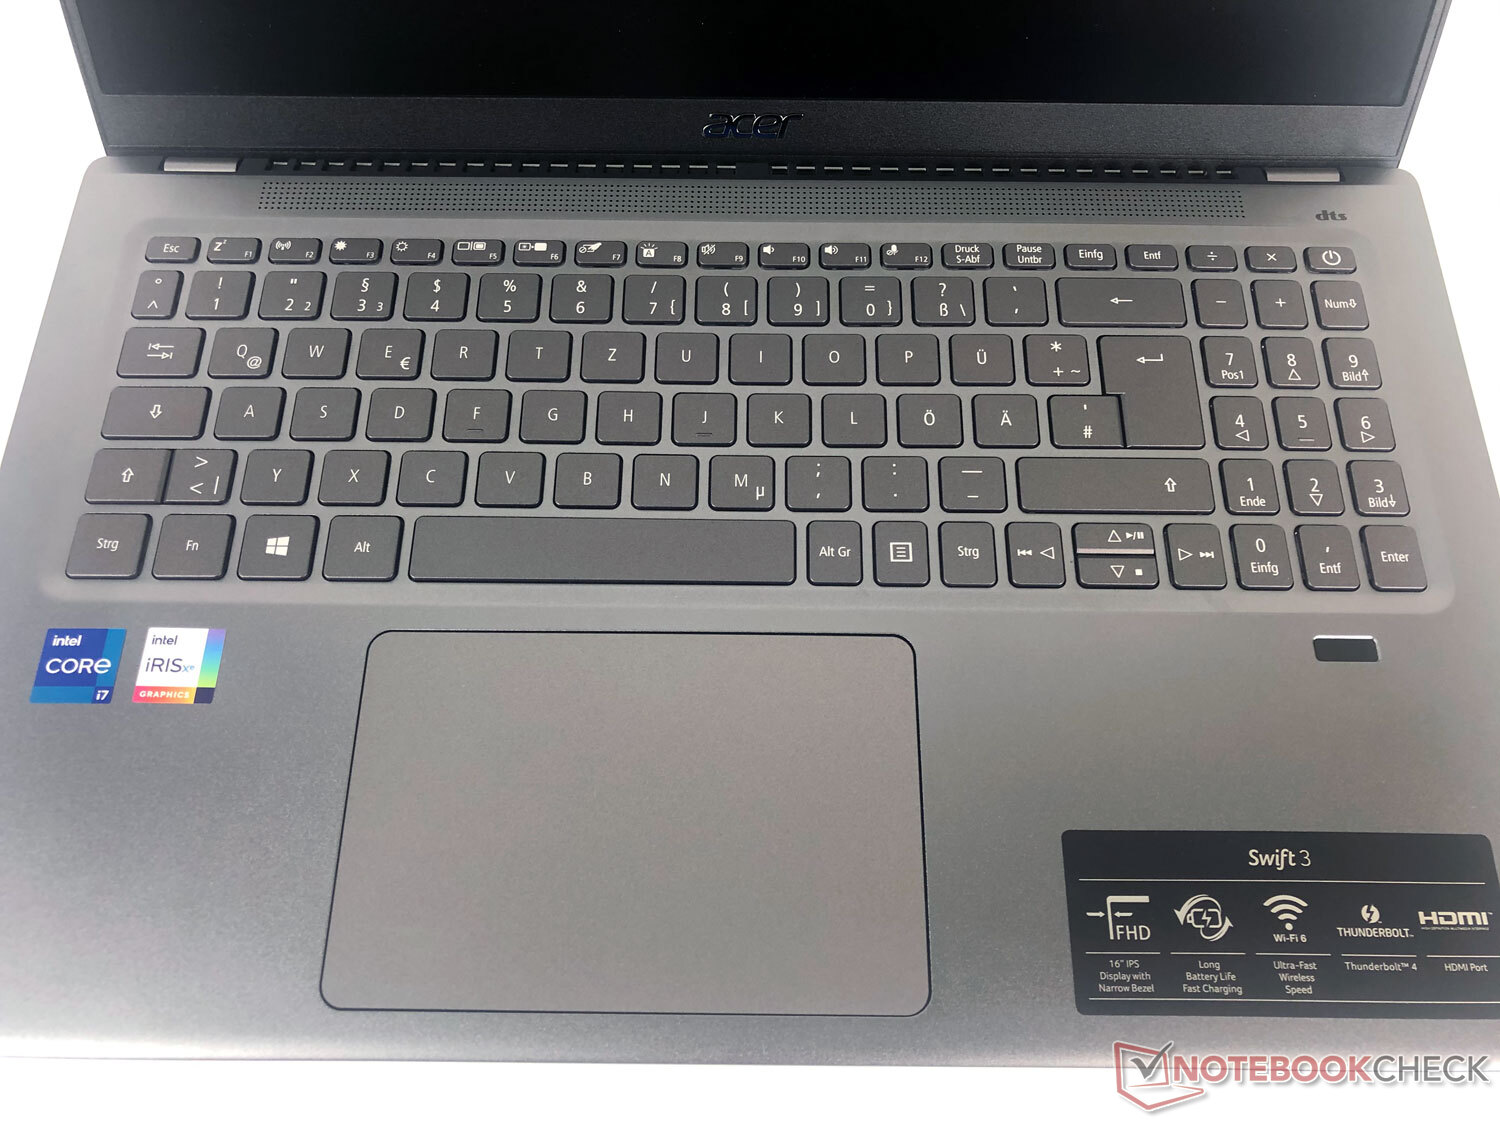
输入设备。宏碁Swift 3很适合在上面打字
键盘
除了具有坚实的按键尺寸的键盘外,宏碁还在16.1英寸的机箱中集成了一个极其紧凑的数字键盘。除了左右两边2厘米宽的边框外,制造商利用了设备的整个宽度。
打字体验很好,噪音发展也很适中。这使得它很容易快速打字,特别是由于背光的作用,即使在黑暗中按键也非常清晰。
指纹传感器的位置有点缺乏新意;它位于键盘下方的中心位置,在掌托的上边缘。拇指很难触及,但可以用中指舒适地使用它。
触摸板
触摸板略微偏向机箱左侧,位于空格键下方。它非常大,约12.5 x 8厘米。在触觉和功能方面没有任何抱怨。我们唯一可以批评的是两个 "鼠标按钮 "的点击噪音,它们没有显示出明显的分离,因为它们可以更安静一点,听起来更高质量。
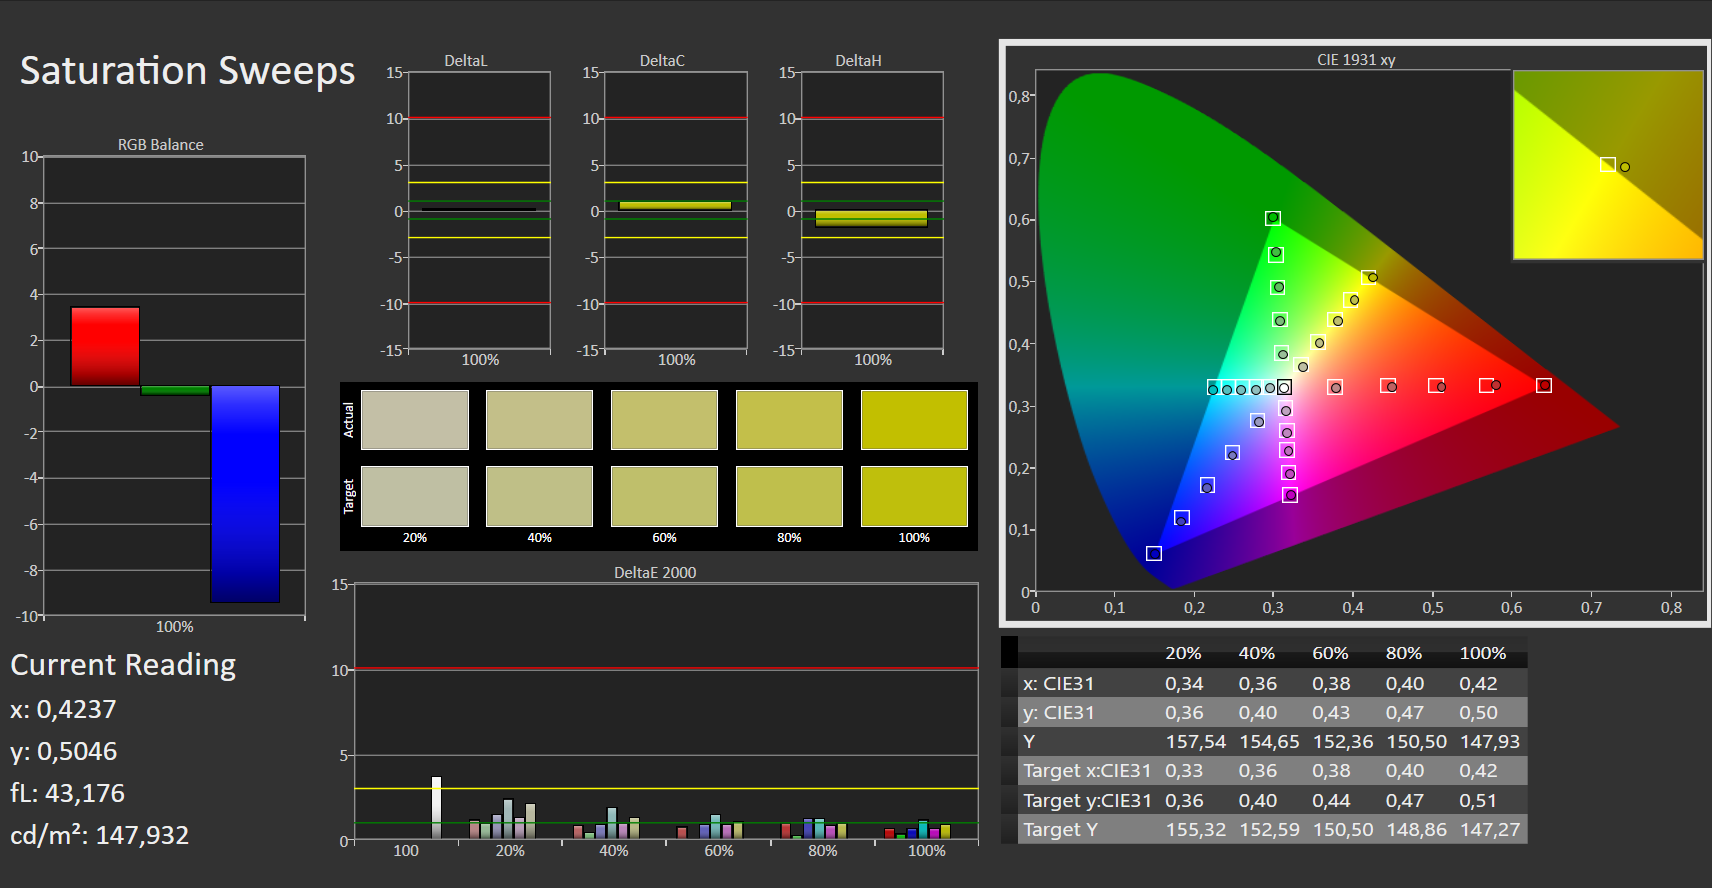
斯威夫特3的显示屏是对比笔记本电脑中最好的。

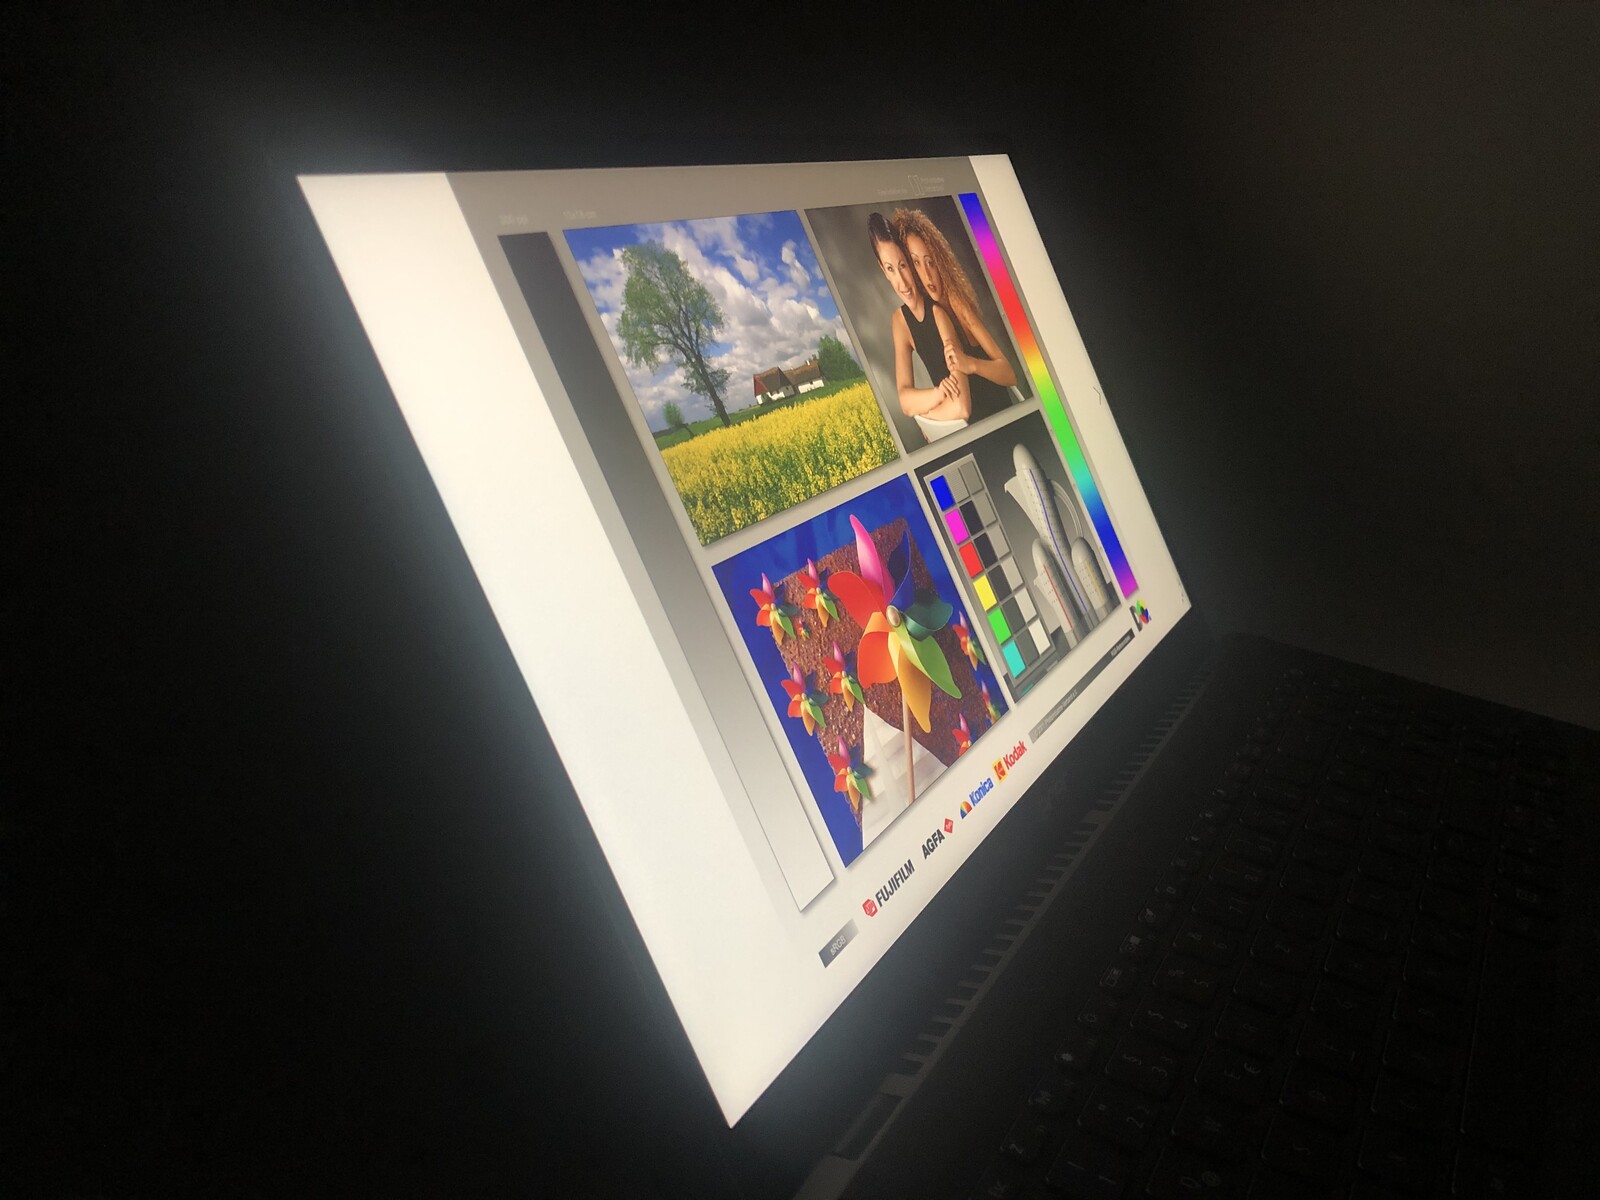
宏碁在Swift 3 SF316-51-75MK中安装了一块带有LED背光的16.1英寸磨砂IPS面板。我们审查样本中的面板来自奇美。分辨率为1920x1080像素,相当于全高清。在这种尺寸下,更高的分辨率将是可取的,因为图像有时看起来略微有些冲淡。这就是说,全高清是这个价格范围内的通常标准。
在其他方面,与所选择的竞争者进行直接比较时,该显示器有许多加分项。它在许多方面都超过了竞争对手。只有当它的亮度略低于300cd/m²和它的响应时间时,它才不得不让位于一些竞争对手。作为回报,它几乎没有屏幕出血现象。
| |||||||||||||||||||||||||
Brightness Distribution: 88 %
Center on Battery: 257 cd/m²
Contrast: 1842:1 (Black: 0.165 cd/m²)
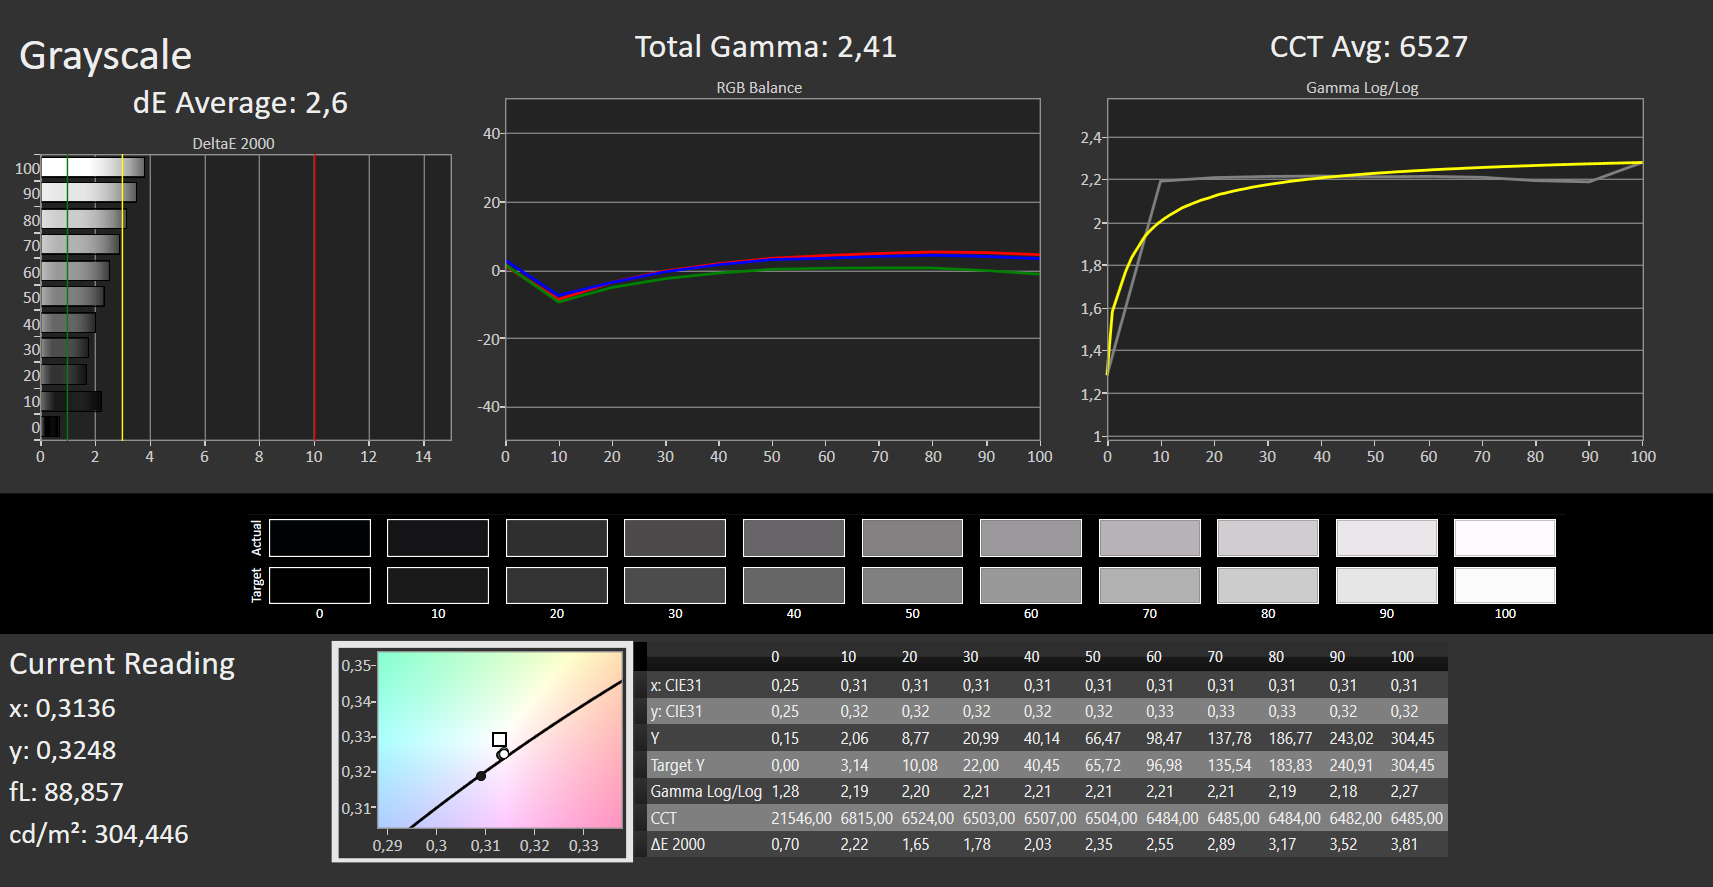
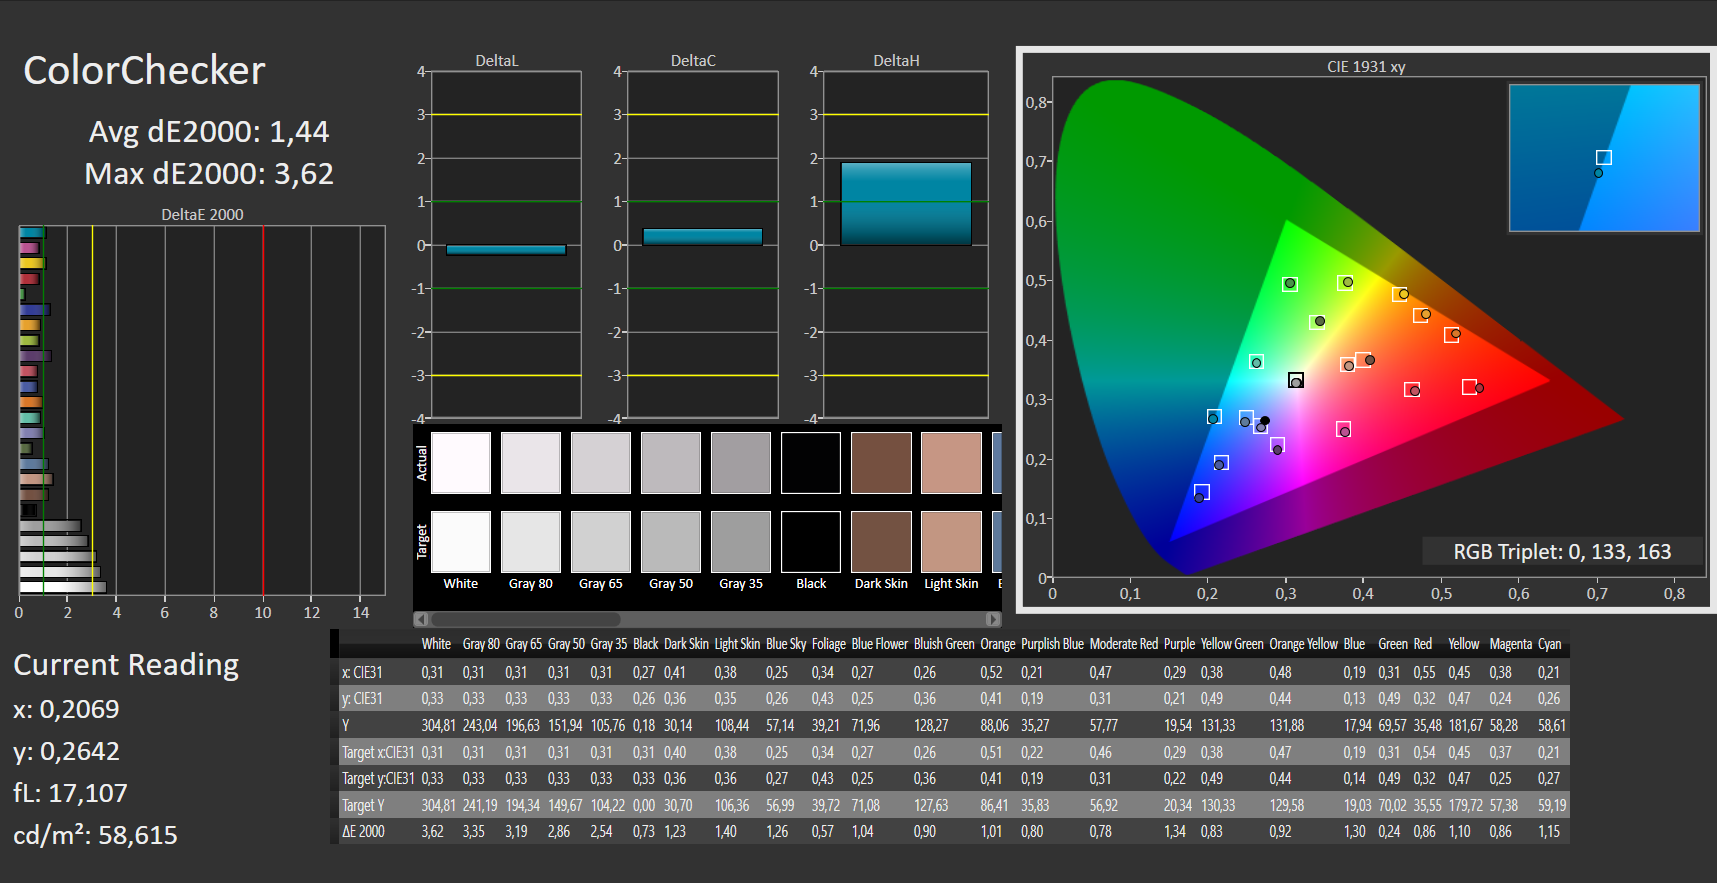
ΔE ColorChecker Calman: 1.44 | ∀{0.5-29.43 Ø4.71}
ΔE Greyscale Calman: 2.6 | ∀{0.09-98 Ø4.96}
99.5% sRGB (Argyll 1.6.3 3D)
68.5% AdobeRGB 1998 (Argyll 1.6.3 3D)
68.5% AdobeRGB 1998 (Argyll 3D)
99.5% sRGB (Argyll 3D)
66.6% Display P3 (Argyll 3D)
Gamma: 2.41
CCT: 6527 K
| Acer Swift 3 SF316-51 Chi Mei CMN160B, IPS, 1920x1080, 16.1" | Xiaomi RedmiBook Pro 15 IPS, 3200x2000, 15.6" | Dell Inspiron 15 5518-2X3JR BOE NV15N4V, IPS, 1920x1080, 15.6" | Lenovo IdeaPad 5 Pro 16IHU6 Lenovo LEN160WQXGA, IPS, 2560x1600, 16" | Asus VivoBook S15 D533UA Chi Mei N156HCA-EAB, IPS, 1920x1080, 15.6" | Huawei MateBook D 16-53011VFJ N161HCA-EA3, IPS, 1920x1080, 16.1" | |
|---|---|---|---|---|---|---|
| Display | -1% | -40% | 6% | -34% | 0% | |
| Display P3 Coverage (%) | 66.6 | 66.7 0% | 39.92 -40% | 74 11% | 43.6 -35% | 66.8 0% |
| sRGB Coverage (%) | 99.5 | 96.3 -3% | 58.8 -41% | 98.7 -1% | 65.2 -34% | 99 -1% |
| AdobeRGB 1998 Coverage (%) | 68.5 | 68.5 0% | 41.24 -40% | 74.5 9% | 45 -34% | 69 1% |
| Response Times | -15% | -42% | 60% | 25% | 6% | |
| Response Time Grey 50% / Grey 80% * (ms) | 32 ? | 34.8 ? -9% | 41 ? -28% | 13 ? 59% | 18 ? 44% | 25 ? 22% |
| Response Time Black / White * (ms) | 20 ? | 24 ? -20% | 31 ? -55% | 8 ? 60% | 19 ? 5% | 22 ? -10% |
| PWM Frequency (Hz) | 2500 ? | 1000 ? | 2500 ? | |||
| Screen | -60% | -55% | -21% | -69% | -2% | |
| Brightness middle (cd/m²) | 304 | 312 3% | 286 -6% | 356 17% | 289 -5% | 352 16% |
| Brightness (cd/m²) | 284 | 298 5% | 268 -6% | 322 13% | 267 -6% | 330 16% |
| Brightness Distribution (%) | 88 | 87 -1% | 87 -1% | 80 -9% | 85 -3% | 89 1% |
| Black Level * (cd/m²) | 0.165 | 0.18 -9% | 0.275 -67% | 0.27 -64% | 0.56 -239% | 0.28 -70% |
| Contrast (:1) | 1842 | 1733 -6% | 1040 -44% | 1319 -28% | 516 -72% | 1257 -32% |
| Colorchecker dE 2000 * | 1.44 | 5.39 -274% | 4.74 -229% | 2.4 -67% | 3.96 -175% | 1.35 6% |
| Colorchecker dE 2000 max. * | 3.62 | 9.95 -175% | 8.27 -128% | 4.42 -22% | 6.76 -87% | 2.58 29% |
| Greyscale dE 2000 * | 2.6 | 6.3 -142% | 1.57 40% | 2.81 -8% | 3.43 -32% | 2.02 22% |
| Gamma | 2.41 91% | 2.192 100% | 2.24 98% | 2.4 92% | 2.28 96% | 2.49 88% |
| CCT | 6527 100% | 7473 87% | 6348 102% | 6294 103% | 7191 90% | 6445 101% |
| Color Space (Percent of AdobeRGB 1998) (%) | 68.5 | 69 1% | 42 -39% | 63 -8% | ||
| Color Space (Percent of sRGB) (%) | 99.5 | 96 -4% | 65 -35% | 99 -1% | ||
| Colorchecker dE 2000 calibrated * | 3.15 | |||||
| Total Average (Program / Settings) | -25% /
-42% | -46% /
-50% | 15% /
-2% | -26% /
-50% | 1% /
-1% |
* ... smaller is better
该显示器几乎完全覆盖了较小的sRGB色彩空间,达到99.5%。较大的AdobeRGB仍然覆盖了近69%。然而,这对于专业图形编辑来说是不够的。但是,宏碁Swift 3并不是针对这个目标群体的。
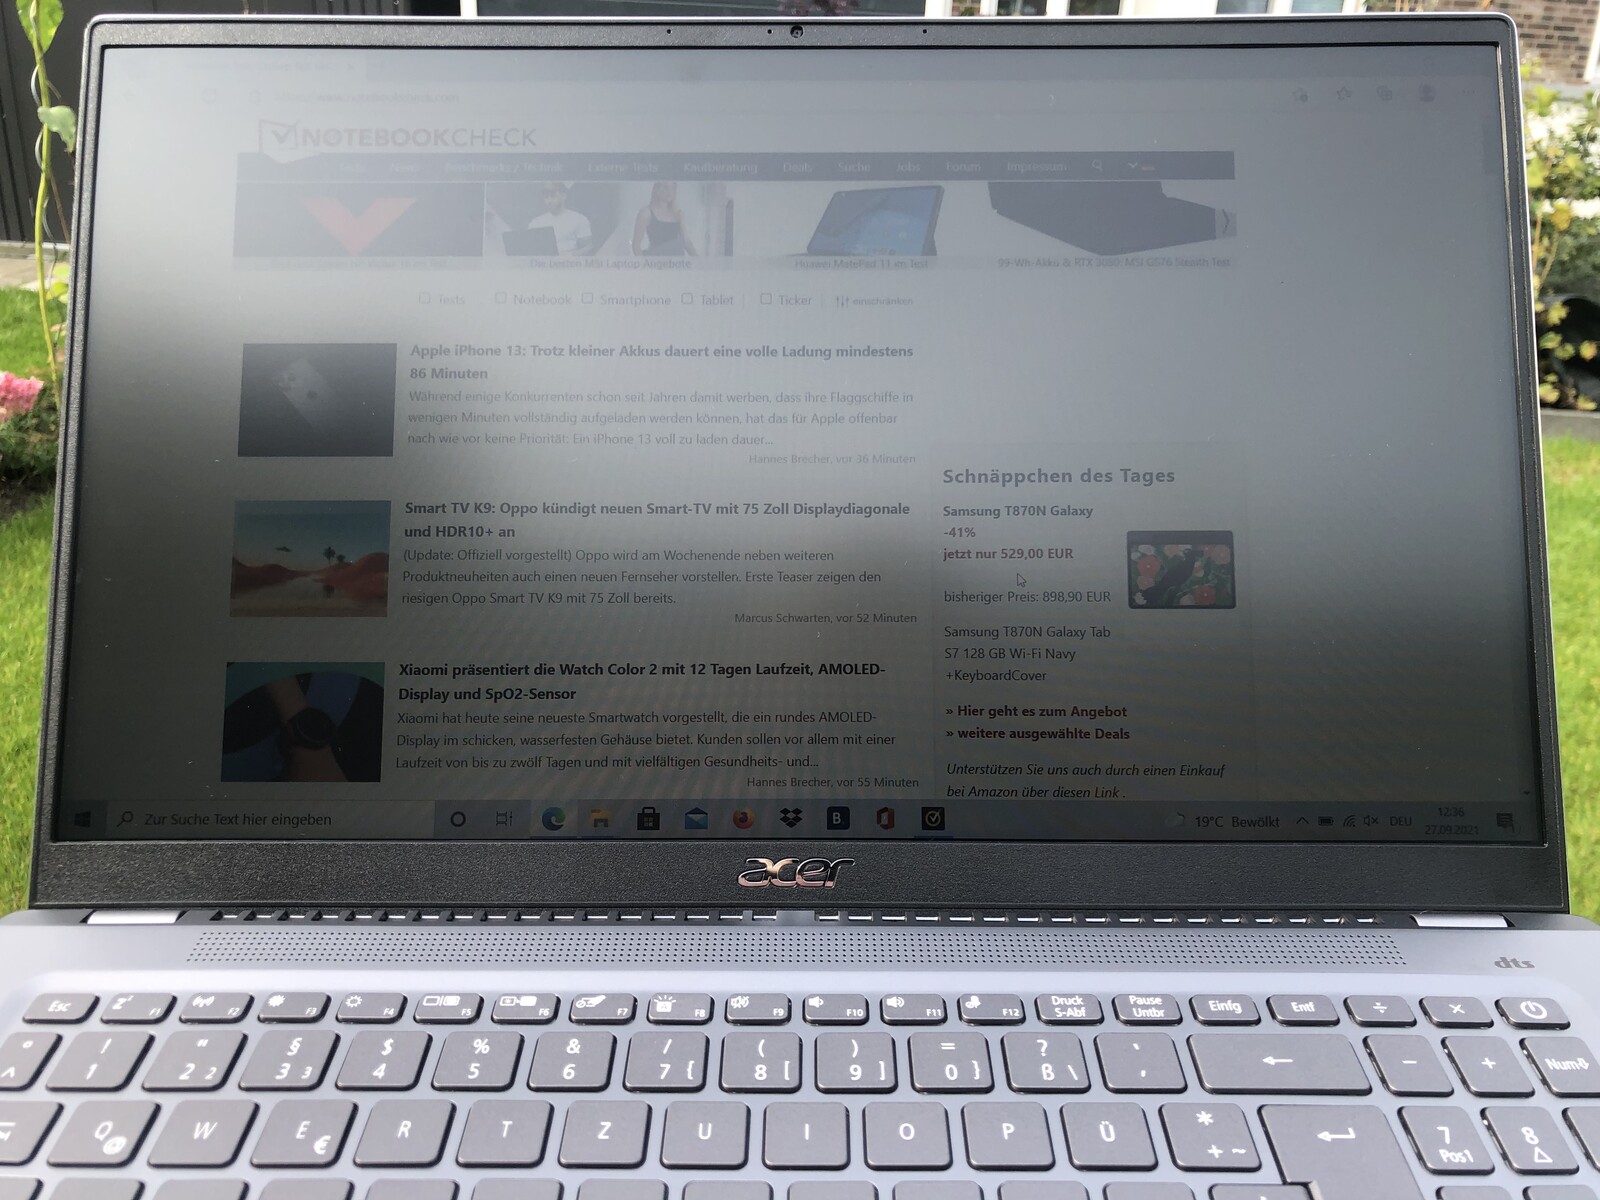
在DeltaE、对比度和黑度方面,我们的评测样本在某些情况下明显超过了一些竞争对手。总的来说,该设备配备了一个良好的显示屏,但我们希望它能更亮一些。
这将使该设备更适合于户外使用。然而,只要阳光不完全照射到显示屏上,宏碁Swift 3也可以在户外很好地使用,其亮度略低于260 cd/m²,特别是由于采用了磨砂显示屏。此外,图像的视角非常稳定,虽然所有的IPS面板都是如此,但也是如此。
Display Response Times
| ↔ Response Time Black to White | ||
|---|---|---|
| 20 ms ... rise ↗ and fall ↘ combined | ↗ 11 ms rise |  |
| ↘ 9 ms fall | ||
| The screen shows good response rates in our tests, but may be too slow for competitive gamers. In comparison, all tested devices range from 0.1 (minimum) to 240 (maximum) ms. » 44 % of all devices are better. This means that the measured response time is similar to the average of all tested devices (19.8 ms). | ||
| ↔ Response Time 50% Grey to 80% Grey | ||
| 32 ms ... rise ↗ and fall ↘ combined | ↗ 15 ms rise |  |
| ↘ 17 ms fall | ||
| The screen shows slow response rates in our tests and will be unsatisfactory for gamers. In comparison, all tested devices range from 0.165 (minimum) to 636 (maximum) ms. » 43 % of all devices are better. This means that the measured response time is similar to the average of all tested devices (30.9 ms). | ||
Screen Flickering / PWM (Pulse-Width Modulation)
| Screen flickering / PWM detected | 2500 Hz | ≤ 10 % brightness setting | 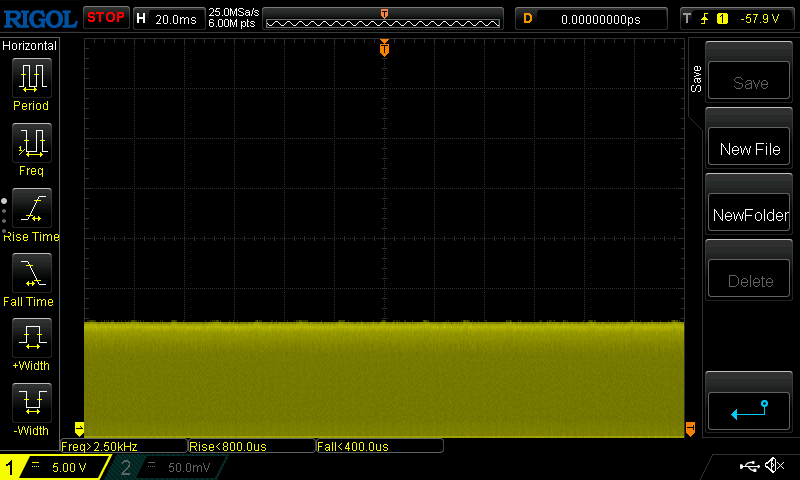 |
The display backlight flickers at 2500 Hz (worst case, e.g., utilizing PWM) Flickering detected at a brightness setting of 10 % and below. There should be no flickering or PWM above this brightness setting. The frequency of 2500 Hz is quite high, so most users sensitive to PWM should not notice any flickering. In comparison: 52 % of all tested devices do not use PWM to dim the display. If PWM was detected, an average of 7741 (minimum: 5 - maximum: 343500) Hz was measured. | |||
性能。快速的四核CPU,集成GPU
这款型号为SF316-51-75MK的宏碁Swift 3配备了强大的英特尔酷睿i7-11370H及其集成英特尔Iris Xe Graphics G7 96EUs 。此外,制造商还为其配备了四通道模式的16GB LPDDR4x内存,以及通过PCI Express连接的512GB SSD。
除了型号为SF316-51-75MK(NX.ABDEV.007)的配置外,宏碁还提供配有Intel Core i5-11300H和8 GB LPDDR4x内存的SF316-51-54R8(NX.ABDEG.002)的Swift 3。这个功能较弱的版本的建议零售价为899欧元(约合1,039美元),比我们测试机型的价格低100欧元(约合116美元)。
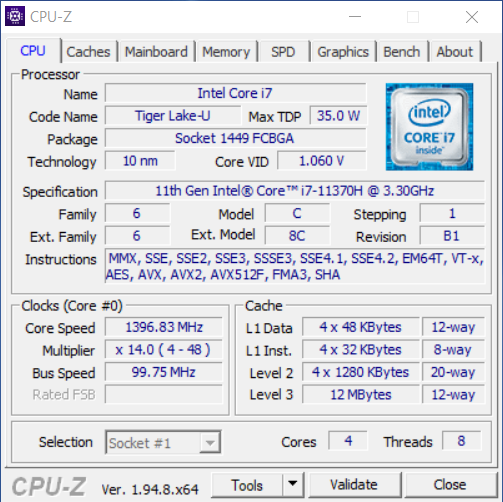
处理器
内置的英特尔酷睿i7-11370H是来自英特尔目前的Tiger Lake 系列,今年才推出。目前,它只能在相对较少的设备中找到,如RedmiBook Pro 15比较模型。该CPU与更普遍的英特尔酷睿i7-1185G7 ,但它允许制造商将TDP设定在28至35瓦之间。在这种情况下,宏碁选择了35瓦,从而充分利用了该CPU的性能。在Boost模式下,四核处理器的运行速度高达4.8GHz,而基本时钟速度为3.3GHz。
由于高TDP配置,英特尔酷睿i7-11370H在基准测试中表现积极,在Cinebench的单核得分中处于领先地位。像往常一样,它不得不在多核测试中让位于基于AMD最新Ryzen CPU的竞争者。
在短暂的初始下降之后,该处理器在耐久性测试中表现稳定,与配备相同CPU(PL1可变)的小米红米书Pro 15的水平相当。
Cinebench R15 Multi endurance test
Cinebench R20: CPU (Single Core) | CPU (Multi Core)
Cinebench R15: CPU Single 64Bit | CPU Multi 64Bit
Blender: v2.79 BMW27 CPU
7-Zip 18.03: 7z b 4 -mmt1 | 7z b 4
Geekbench 5.5: Single-Core | Multi-Core
HWBOT x265 Benchmark v2.2: 4k Preset
LibreOffice : 20 Documents To PDF
R Benchmark 2.5: Overall mean
| Cinebench R23 / Single Core | |
| Average of class Multimedia (1128 - 2459, n=64, last 2 years) | |
| Acer Swift 3 SF316-51 | |
| Xiaomi RedmiBook Pro 15 | |
| Average Intel Core i7-11370H (1081 - 1556, n=11) | |
| Lenovo IdeaPad 5 Pro 16IHU6 | |
| Dell Inspiron 15 5518-2X3JR | |
| Asus VivoBook S15 D533UA | |
| Huawei MateBook D 16-53011VFJ | |
| Cinebench R23 / Multi Core | |
| Average of class Multimedia (4861 - 33362, n=65, last 2 years) | |
| Asus VivoBook S15 D533UA | |
| Huawei MateBook D 16-53011VFJ | |
| Lenovo IdeaPad 5 Pro 16IHU6 | |
| Acer Swift 3 SF316-51 | |
| Xiaomi RedmiBook Pro 15 | |
| Xiaomi RedmiBook Pro 15 | |
| Average Intel Core i7-11370H (3696 - 6646, n=12) | |
| Dell Inspiron 15 5518-2X3JR | |
| Cinebench R20 / CPU (Single Core) | |
| Average of class Multimedia (425 - 853, n=56, last 2 years) | |
| Acer Swift 3 SF316-51 | |
| Xiaomi RedmiBook Pro 15 | |
| Average Intel Core i7-11370H (475 - 601, n=11) | |
| Lenovo IdeaPad 5 Pro 16IHU6 | |
| Dell Inspiron 15 5518-2X3JR | |
| Asus VivoBook S15 D533UA | |
| Huawei MateBook D 16-53011VFJ | |
| Cinebench R20 / CPU (Multi Core) | |
| Average of class Multimedia (1887 - 12912, n=56, last 2 years) | |
| Asus VivoBook S15 D533UA | |
| Huawei MateBook D 16-53011VFJ | |
| Lenovo IdeaPad 5 Pro 16IHU6 | |
| Acer Swift 3 SF316-51 | |
| Xiaomi RedmiBook Pro 15 | |
| Average Intel Core i7-11370H (1438 - 2578, n=11) | |
| Dell Inspiron 15 5518-2X3JR | |
| Cinebench R15 / CPU Single 64Bit | |
| Average of class Multimedia (184.8 - 326, n=58, last 2 years) | |
| Xiaomi RedmiBook Pro 15 | |
| Xiaomi RedmiBook Pro 15 | |
| Acer Swift 3 SF316-51 | |
| Average Intel Core i7-11370H (162.9 - 233, n=15) | |
| Asus VivoBook S15 D533UA | |
| Huawei MateBook D 16-53011VFJ | |
| Lenovo IdeaPad 5 Pro 16IHU6 | |
| Dell Inspiron 15 5518-2X3JR | |
| Cinebench R15 / CPU Multi 64Bit | |
| Average of class Multimedia (856 - 5224, n=60, last 2 years) | |
| Asus VivoBook S15 D533UA | |
| Huawei MateBook D 16-53011VFJ | |
| Xiaomi RedmiBook Pro 15 | |
| Xiaomi RedmiBook Pro 15 | |
| Xiaomi RedmiBook Pro 15 | |
| Acer Swift 3 SF316-51 | |
| Lenovo IdeaPad 5 Pro 16IHU6 | |
| Average Intel Core i7-11370H (606 - 1086, n=17) | |
| Dell Inspiron 15 5518-2X3JR | |
| Blender / v2.79 BMW27 CPU | |
| Dell Inspiron 15 5518-2X3JR | |
| Lenovo IdeaPad 5 Pro 16IHU6 | |
| Xiaomi RedmiBook Pro 15 | |
| Average Intel Core i7-11370H (432 - 762, n=11) | |
| Acer Swift 3 SF316-51 | |
| Huawei MateBook D 16-53011VFJ | |
| Asus VivoBook S15 D533UA | |
| Average of class Multimedia (100 - 557, n=57, last 2 years) | |
| 7-Zip 18.03 / 7z b 4 -mmt1 | |
| Average of class Multimedia (3666 - 7545, n=55, last 2 years) | |
| Xiaomi RedmiBook Pro 15 | |
| Acer Swift 3 SF316-51 | |
| Average Intel Core i7-11370H (5074 - 5550, n=11) | |
| Lenovo IdeaPad 5 Pro 16IHU6 | |
| Dell Inspiron 15 5518-2X3JR | |
| Asus VivoBook S15 D533UA | |
| Huawei MateBook D 16-53011VFJ | |
| 7-Zip 18.03 / 7z b 4 | |
| Average of class Multimedia (26062 - 130368, n=54, last 2 years) | |
| Asus VivoBook S15 D533UA | |
| Huawei MateBook D 16-53011VFJ | |
| Acer Swift 3 SF316-51 | |
| Xiaomi RedmiBook Pro 15 | |
| Lenovo IdeaPad 5 Pro 16IHU6 | |
| Average Intel Core i7-11370H (18961 - 28520, n=11) | |
| Dell Inspiron 15 5518-2X3JR | |
| Geekbench 5.5 / Single-Core | |
| Average of class Multimedia (805 - 2974, n=55, last 2 years) | |
| Acer Swift 3 SF316-51 | |
| Xiaomi RedmiBook Pro 15 | |
| Average Intel Core i7-11370H (1376 - 1607, n=10) | |
| Lenovo IdeaPad 5 Pro 16IHU6 | |
| Dell Inspiron 15 5518-2X3JR | |
| Asus VivoBook S15 D533UA | |
| Huawei MateBook D 16-53011VFJ | |
| Geekbench 5.5 / Multi-Core | |
| Average of class Multimedia (4652 - 20422, n=55, last 2 years) | |
| Asus VivoBook S15 D533UA | |
| Acer Swift 3 SF316-51 | |
| Huawei MateBook D 16-53011VFJ | |
| Average Intel Core i7-11370H (3828 - 6115, n=10) | |
| Xiaomi RedmiBook Pro 15 | |
| Lenovo IdeaPad 5 Pro 16IHU6 | |
| Dell Inspiron 15 5518-2X3JR | |
| HWBOT x265 Benchmark v2.2 / 4k Preset | |
| Average of class Multimedia (5.26 - 36.1, n=55, last 2 years) | |
| Asus VivoBook S15 D533UA | |
| Huawei MateBook D 16-53011VFJ | |
| Acer Swift 3 SF316-51 | |
| Average Intel Core i7-11370H (4.98 - 8.82, n=11) | |
| Lenovo IdeaPad 5 Pro 16IHU6 | |
| Xiaomi RedmiBook Pro 15 | |
| Dell Inspiron 15 5518-2X3JR | |
| LibreOffice / 20 Documents To PDF | |
| Huawei MateBook D 16-53011VFJ | |
| Asus VivoBook S15 D533UA | |
| Lenovo IdeaPad 5 Pro 16IHU6 | |
| Average of class Multimedia (23.9 - 146.7, n=56, last 2 years) | |
| Xiaomi RedmiBook Pro 15 | |
| Dell Inspiron 15 5518-2X3JR | |
| Average Intel Core i7-11370H (23.6 - 56.5, n=11) | |
| Acer Swift 3 SF316-51 | |
| R Benchmark 2.5 / Overall mean | |
| Dell Inspiron 15 5518-2X3JR | |
| Huawei MateBook D 16-53011VFJ | |
| Lenovo IdeaPad 5 Pro 16IHU6 | |
| Asus VivoBook S15 D533UA | |
| Average Intel Core i7-11370H (0.544 - 0.596, n=11) | |
| Xiaomi RedmiBook Pro 15 | |
| Acer Swift 3 SF316-51 | |
| Average of class Multimedia (0.3604 - 0.947, n=55, last 2 years) | |
* ... smaller is better
系统性能
在实际测试中,即使在重载情况下,系统也能愉快地平稳运行。各种PCMark 10基准测试显示了良好的性能,其中宏碁Swift 3 SF316-51通常被定位在顶部,与RedmiBook Pro 15直接竞争。配备酷睿i5-11300H和类似CPU的对手一般没有机会接近这一性能水平。
PCMark 8: Storage Score v2 | Work Score Accelerated v2 | Creative Score Accelerated v2 | Home Score Accelerated v2
| PCMark 10 / Score | |
| Average of class Multimedia (4325 - 10386, n=51, last 2 years) | |
| Xiaomi RedmiBook Pro 15 | |
| Acer Swift 3 SF316-51 | |
| Asus VivoBook S15 D533UA | |
| Average Intel Core i7-11370H, Intel Iris Xe Graphics G7 96EUs (5199 - 5459, n=6) | |
| Lenovo IdeaPad 5 Pro 16IHU6 | |
| Huawei MateBook D 16-53011VFJ | |
| Dell Inspiron 15 5518-2X3JR | |
| PCMark 10 / Essentials | |
| Average of class Multimedia (8025 - 11664, n=50, last 2 years) | |
| Average Intel Core i7-11370H, Intel Iris Xe Graphics G7 96EUs (9996 - 10650, n=6) | |
| Acer Swift 3 SF316-51 | |
| Asus VivoBook S15 D533UA | |
| Huawei MateBook D 16-53011VFJ | |
| Lenovo IdeaPad 5 Pro 16IHU6 | |
| Xiaomi RedmiBook Pro 15 | |
| Dell Inspiron 15 5518-2X3JR | |
| PCMark 10 / Productivity | |
| Average of class Multimedia (7323 - 18233, n=50, last 2 years) | |
| Xiaomi RedmiBook Pro 15 | |
| Lenovo IdeaPad 5 Pro 16IHU6 | |
| Dell Inspiron 15 5518-2X3JR | |
| Asus VivoBook S15 D533UA | |
| Huawei MateBook D 16-53011VFJ | |
| Acer Swift 3 SF316-51 | |
| Average Intel Core i7-11370H, Intel Iris Xe Graphics G7 96EUs (6911 - 7388, n=6) | |
| PCMark 10 / Digital Content Creation | |
| Average of class Multimedia (3651 - 16240, n=50, last 2 years) | |
| Xiaomi RedmiBook Pro 15 | |
| Acer Swift 3 SF316-51 | |
| Average Intel Core i7-11370H, Intel Iris Xe Graphics G7 96EUs (5483 - 5838, n=6) | |
| Asus VivoBook S15 D533UA | |
| Lenovo IdeaPad 5 Pro 16IHU6 | |
| Huawei MateBook D 16-53011VFJ | |
| Dell Inspiron 15 5518-2X3JR | |
| PCMark 8 / Storage Score v2 | |
| Huawei MateBook D 16-53011VFJ | |
| Xiaomi RedmiBook Pro 15 | |
| Acer Swift 3 SF316-51 | |
| Average Intel Core i7-11370H, Intel Iris Xe Graphics G7 96EUs (n=1) | |
| PCMark 8 / Work Score Accelerated v2 | |
| Xiaomi RedmiBook Pro 15 | |
| Asus VivoBook S15 D533UA | |
| Huawei MateBook D 16-53011VFJ | |
| Lenovo IdeaPad 5 Pro 16IHU6 | |
| Acer Swift 3 SF316-51 | |
| Average Intel Core i7-11370H, Intel Iris Xe Graphics G7 96EUs (2996 - 3234, n=2) | |
| PCMark 8 / Creative Score Accelerated v2 | |
| Xiaomi RedmiBook Pro 15 | |
| Acer Swift 3 SF316-51 | |
| Average Intel Core i7-11370H, Intel Iris Xe Graphics G7 96EUs (n=1) | |
| Huawei MateBook D 16-53011VFJ | |
| Lenovo IdeaPad 5 Pro 16IHU6 | |
| Asus VivoBook S15 D533UA | |
| PCMark 8 / Home Score Accelerated v2 | |
| Acer Swift 3 SF316-51 | |
| Average of class Multimedia (n=1last 2 years) | |
| Average Intel Core i7-11370H, Intel Iris Xe Graphics G7 96EUs (5025 - 5575, n=2) | |
| Xiaomi RedmiBook Pro 15 | |
| Huawei MateBook D 16-53011VFJ | |
| Asus VivoBook S15 D533UA | |
| Lenovo IdeaPad 5 Pro 16IHU6 | |
| PCMark 8 Home Score Accelerated v2 | 5575 points | |
| PCMark 8 Creative Score Accelerated v2 | 7666 points | |
| PCMark 8 Work Score Accelerated v2 | 3234 points | |
| PCMark 10 Score | 5459 points | |
Help | ||
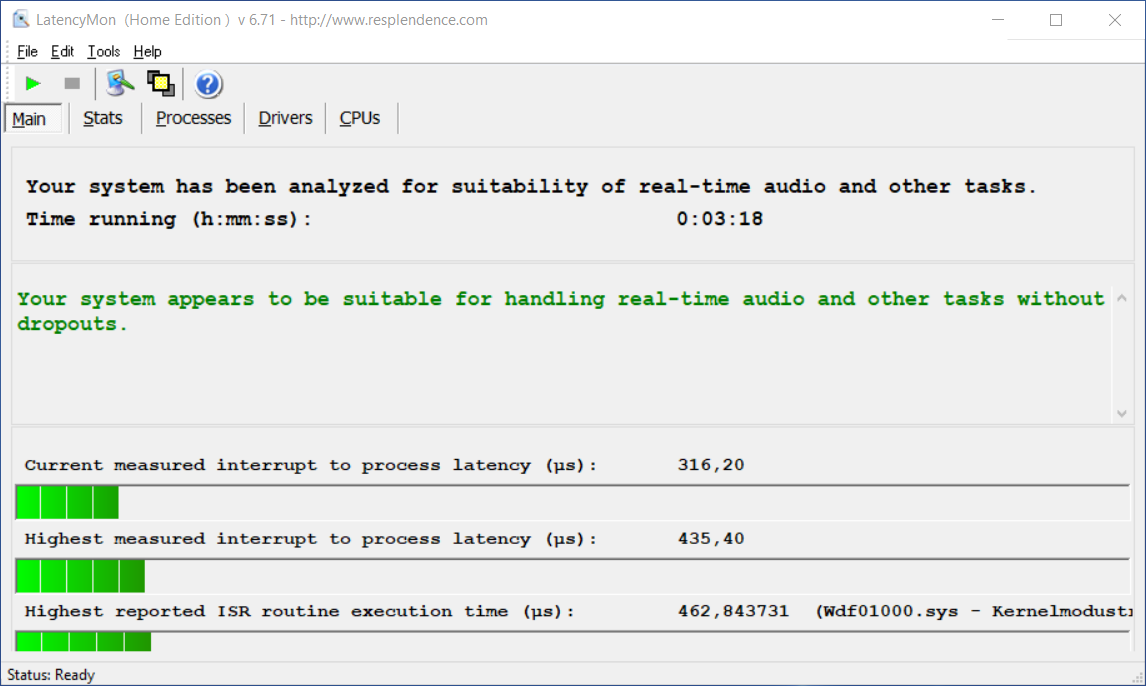
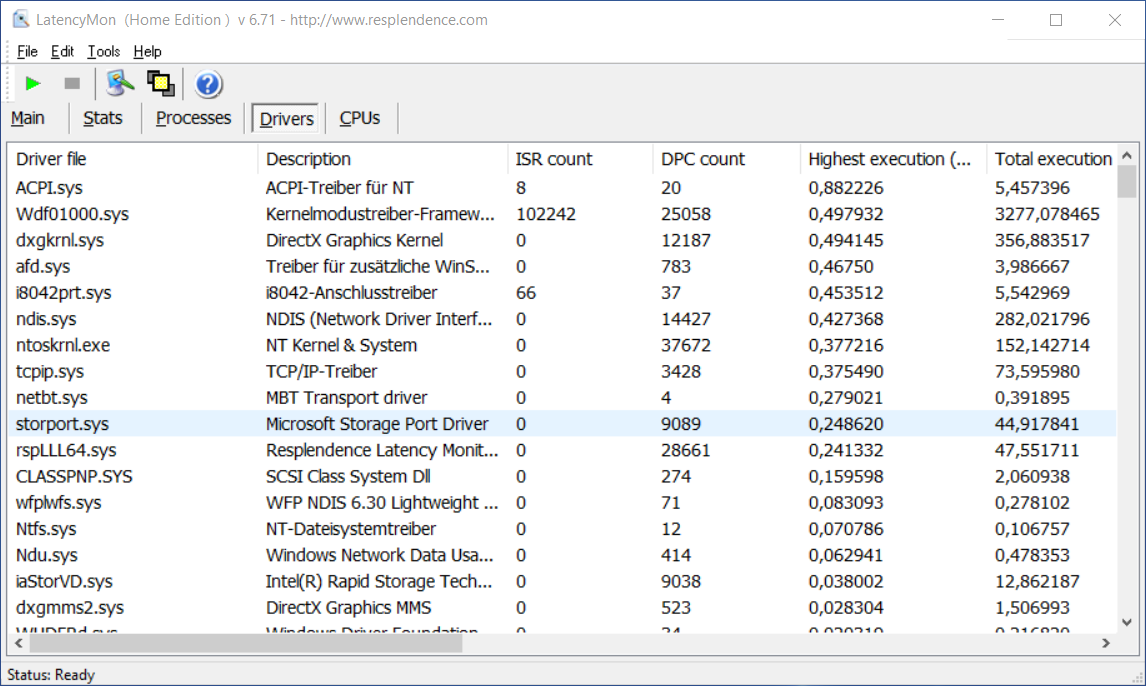
DPC延迟
Swift 3在我们的延迟测试中表现非常好,这是每个被评测的笔记本电脑都必须面对的任务。在所有提到的对比型号中,它的延迟是最低的。因此,在这方面,实时音频和视频编辑的问题应该不会出现,尽管这始终只是一个瞬间的快照。
| DPC Latencies / LatencyMon - interrupt to process latency (max), Web, Youtube, Prime95 | |
| Xiaomi RedmiBook Pro 15 | |
| Dell Inspiron 15 5518-2X3JR | |
| Huawei MateBook D 16-53011VFJ | |
| Lenovo IdeaPad 5 Pro 16IHU6 | |
| Asus VivoBook S15 D533UA | |
| Acer Swift 3 SF316-51 | |
* ... smaller is better
储存
称512GB固态硬盘为阿基里斯之踵可能有点夸张。但总的来说,大多数其他比较设备在各种读取和写入基准测试中显示出更好的结果。因此,在长期读取测试中,它在其他类别中排在最后。
然而,由于默认情况下SSD的速度相当快,通常不再像当时的HDD那样成为PC系统中的大瓶颈,所以最终这只是一个题外话,因为在日常工作中没有明显的问题。毕竟,该设备仍然能够领先于配备相同SSD的设备的平均值。
| Acer Swift 3 SF316-51 Micron 2210 MTFDHBA512QFD | Xiaomi RedmiBook Pro 15 Toshiba KBG40ZNV512G | Dell Inspiron 15 5518-2X3JR Toshiba KBG40ZNS512G NVMe | Lenovo IdeaPad 5 Pro 16IHU6 Samsung SSD PM981a MZVLB512HBJQ | Asus VivoBook S15 D533UA WDC PC SN530 SDBPNPZ-1T00 | Huawei MateBook D 16-53011VFJ Samsung SSD PM981a MZVLB512HBJQ | Average Micron 2210 MTFDHBA512QFD | |
|---|---|---|---|---|---|---|---|
| CrystalDiskMark 5.2 / 6 | 1% | 13% | 48% | 10% | 46% | -8% | |
| Write 4K (MB/s) | 171.8 | 136 -21% | 207.3 21% | 203 18% | 116.8 -32% | 147 -14% | 153.1 ? -11% |
| Read 4K (MB/s) | 79.4 | 60.4 -24% | 61.3 -23% | 52.3 -34% | 43.92 -45% | 65.5 -18% | 64.6 ? -19% |
| Write Seq (MB/s) | 1099 | 1447 32% | 1499 36% | 2138 95% | 1990 81% | 2680 144% | 1125 ? 2% |
| Read Seq (MB/s) | 1847 | 1507 -18% | 1858 1% | 1974 7% | 1959 6% | 2556 38% | 1808 ? -2% |
| Write 4K Q32T1 (MB/s) | 539 | 235.6 -56% | 510 -5% | 640 19% | 373.3 -31% | 413.4 -23% | 367 ? -32% |
| Read 4K Q32T1 (MB/s) | 555 | 737 33% | 640 15% | 707 27% | 524 -6% | 500 -10% | 507 ? -9% |
| Write Seq Q32T1 (MB/s) | 1095 | 1529 40% | 1521 39% | 2973 172% | 1985 81% | 2978 172% | 1138 ? 4% |
| Read Seq Q32T1 (MB/s) | 1988 | 2357 19% | 2316 16% | 3559 79% | 2456 24% | 3567 79% | 1997 ? 0% |
| AS SSD | -100% | -36% | 56% | 15% | 39% | -15% | |
| Seq Read (MB/s) | 2015 | 1972 -2% | 2086 4% | 2541 26% | 2082 3% | 2829 40% | 1885 ? -6% |
| Seq Write (MB/s) | 1055 | 981 -7% | 1124 7% | 2555 142% | 1844 75% | 2423 130% | 998 ? -5% |
| 4K Read (MB/s) | 73.9 | 55.8 -24% | 54.1 -27% | 56 -24% | 44.33 -40% | 42.06 -43% | 62.2 ? -16% |
| 4K Write (MB/s) | 223.2 | 133.5 -40% | 138.1 -38% | 129.6 -42% | 157.5 -29% | 126.1 -44% | 162 ? -27% |
| 4K-64 Read (MB/s) | 589 | 1277 117% | 1295 120% | 1633 177% | 1039 76% | 1481 151% | 585 ? -1% |
| 4K-64 Write (MB/s) | 1029 | 313.9 -69% | 750 -27% | 1863 81% | 1556 51% | 2009 95% | 863 ? -16% |
| Access Time Read * (ms) | 0.056 | 0.15 -168% | 0.141 -152% | 0.077 -38% | 0.05 11% | 0.079 -41% | 0.07329 ? -31% |
| Access Time Write * (ms) | 0.039 | 0.513 -1215% | 0.169 -333% | 0.029 26% | 0.065 -67% | 0.029 26% | 0.04957 ? -27% |
| Score Read (Points) | 865 | 1530 77% | 1558 80% | 1944 125% | 1292 49% | 1806 109% | 836 ? -3% |
| Score Write (Points) | 1358 | 546 -60% | 1001 -26% | 2248 66% | 1898 40% | 2377 75% | 1125 ? -17% |
| Score Total (Points) | 2644 | 2819 7% | 3316 25% | 5192 96% | 3845 45% | 5087 92% | 2366 ? -11% |
| Copy ISO MB/s (MB/s) | 1186 | 1105 -7% | 678 -43% | 2246 89% | 1441 22% | 1358 15% | 1191 ? 0% |
| Copy Program MB/s (MB/s) | 782 | 799 2% | 364.8 -53% | 861 10% | 484.9 -38% | 407.1 -48% | 477 ? -39% |
| Copy Game MB/s (MB/s) | 1028 | 957 -7% | 557 -46% | 1552 51% | 1098 7% | 918 -11% | 857 ? -17% |
| Total Average (Program / Settings) | -50% /
-63% | -12% /
-19% | 52% /
53% | 13% /
13% | 43% /
42% | -12% /
-13% |
* ... smaller is better

Continuous load read: DiskSpd Read Loop, Queue Depth 8
图形卡
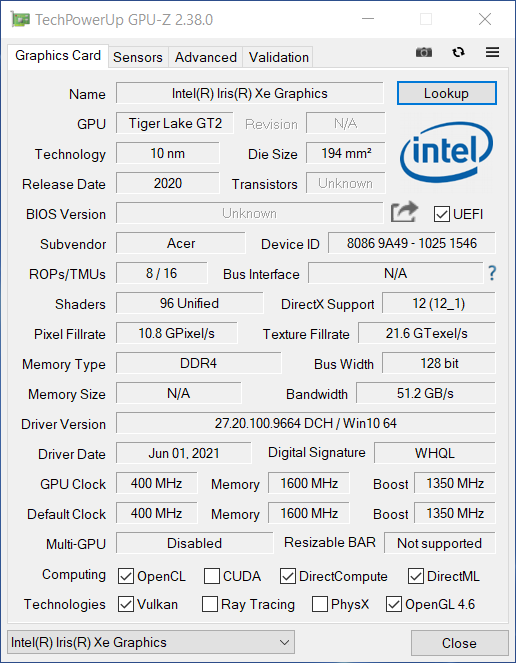
宏碁没有在Swift 3中实施一个专门的图形解决方案。相反,它依靠处理器的能力Intel Iris Xe Graphics G7 96EUsGPU。配有1GB内存的图形引擎的基本时钟速度为400MHz。当它处于负载状态时,它在Boost模式下可以运行到1350MHz。
没有独立显卡的一个好处是,该设备消耗的能量较少,我们将在下面看到更多细节。尽管如此,该GPU为许多应用目的提供了足够的性能。毕竟,众所周知,它在许多方面与GeForce MX350笔记本电脑相当,在某些情况下,它甚至可以跟上GeForce MX450。
该设备在电池供电的情况下,在3DMark 11中取得了6436分的成绩。这意味着不连接电源适配器时的可用性能只比使用外部电源时低5%左右。
| 3DMark 11 - 1280x720 Performance GPU | |
| Average of class Multimedia (3749 - 60002, n=54, last 2 years) | |
| Lenovo IdeaPad 5 Pro 16IHU6 | |
| Dell Inspiron 15 5518-2X3JR | |
| Xiaomi RedmiBook Pro 15 | |
| Acer Swift 3 SF316-51 | |
| Average Intel Iris Xe Graphics G7 96EUs (2867 - 7676, n=209) | |
| Asus VivoBook S15 D533UA | |
| Huawei MateBook D 16-53011VFJ | |
| 3DMark | |
| 1280x720 Cloud Gate Standard Graphics | |
| Average of class Multimedia (16765 - 143501, n=32, last 2 years) | |
| Lenovo IdeaPad 5 Pro 16IHU6 | |
| Acer Swift 3 SF316-51 | |
| Dell Inspiron 15 5518-2X3JR | |
| Average Intel Iris Xe Graphics G7 96EUs (13162 - 39880, n=187) | |
| Xiaomi RedmiBook Pro 15 | |
| Huawei MateBook D 16-53011VFJ | |
| 1920x1080 Fire Strike Graphics | |
| Average of class Multimedia (2328 - 48907, n=57, last 2 years) | |
| Acer Swift 3 SF316-51 | |
| Lenovo IdeaPad 5 Pro 16IHU6 | |
| Average Intel Iris Xe Graphics G7 96EUs (2286 - 6624, n=222) | |
| Dell Inspiron 15 5518-2X3JR | |
| Xiaomi RedmiBook Pro 15 | |
| Asus VivoBook S15 D533UA | |
| Huawei MateBook D 16-53011VFJ | |
| 2560x1440 Time Spy Graphics | |
| Average of class Multimedia (696 - 19403, n=57, last 2 years) | |
| Lenovo IdeaPad 5 Pro 16IHU6 | |
| Dell Inspiron 15 5518-2X3JR | |
| Acer Swift 3 SF316-51 | |
| Average Intel Iris Xe Graphics G7 96EUs (707 - 1890, n=218) | |
| Asus VivoBook S15 D533UA | |
| Huawei MateBook D 16-53011VFJ | |
| 3DMark 11 Performance | 7431 points | |
| 3DMark Cloud Gate Standard Score | 22314 points | |
| 3DMark Fire Strike Score | 5300 points | |
| 3DMark Time Spy Score | 1917 points | |
Help | ||
游戏性能
眼前的宏碁Swift 3绝对不是一款游戏设备,仅从缺乏专用的图形解决方案就可以看出这一点。尽管如此,它在基准测试中的表现还是绰绰有余的,尤其是在涉及到老游戏的时候。例如, Witcher 3 ,在中等图形设置下可以没有问题,甚至在高图形设置下也有轻微的限制。
总的来说,该设备在测试领域排名居中--尽管大多数其他对比机型都配备了专用GPU。例如,戴尔Inspiron 15 5518-2X3JR,配备了NvidiaGeForce MX450落后。此外,Swift 3的性能总是远远高于平均Intel Iris Xe Graphics G7 96EUsGPU。
CPU的集成显卡显示它们有相当大的能力,所以偶尔的游戏环节对评测样本来说应该不是问题。当然,前提是用户对性能和图形的期望值不要太高。
| Rise of the Tomb Raider | |
| 1024x768 Lowest Preset | |
| Acer Swift 3 SF316-51 | |
| Average Intel Iris Xe Graphics G7 96EUs (46 - 85.5, n=5) | |
| 1366x768 Medium Preset AF:2x | |
| Acer Swift 3 SF316-51 | |
| Average Intel Iris Xe Graphics G7 96EUs (35.1 - 49, n=5) | |
| 1920x1080 High Preset AA:FX AF:4x | |
| Acer Swift 3 SF316-51 | |
| Average Intel Iris Xe Graphics G7 96EUs (19.9 - 28.2, n=5) | |
| 1920x1080 Very High Preset AA:FX AF:16x | |
| Acer Swift 3 SF316-51 | |
| Average Intel Iris Xe Graphics G7 96EUs (16.4 - 22.7, n=5) | |
| low | med. | high | ultra | |
|---|---|---|---|---|
| The Witcher 3 (2015) | 101 | 62.6 | 33.3 | 17 |
| Dota 2 Reborn (2015) | 139 | 87.1 | 59 | 55.6 |
| Rise of the Tomb Raider (2016) | 81.1 | 49 | 28.2 | 22.7 |
| X-Plane 11.11 (2018) | 46.4 | 38.2 | 35.7 | |
| Strange Brigade (2018) | 90.8 | 40.3 | 32.5 | 26.4 |
排放物。愉快的安静的笔记本电脑,只有在满负荷的情况下才会有点热。
噪声排放
在空闲状态下,宏碁Swift 3在26 dB(A)和正常环境噪音水平下几乎听不见。即使在满负荷的情况下,该设备甚至没有超过40dB(A)的标志,所以考虑到这是一个带有主动式风扇的设备,它可以正确地被描述为安静。其他噪音,如线圈啸叫或类似的声音,在我们的测试设备中没有出现。
Noise level
| Idle |
| 26 / 26 / 27.7 dB(A) |
| Load |
| 32.7 / 39 dB(A) |
 | ||
30 dB silent 40 dB(A) audible 50 dB(A) loud |
||
min: | ||
温度
尽管噪音发展很低,但温度仍然相对适中。在空闲使用时,所有顶部和底部区域保持在最高32°C(约90°F)。即使在满负荷的情况下,顶部的温度也只上升到40°C(约104°F),最热的区域就在显示屏前面,这也是经常出现的情况。另一方面,触摸板和掌托的区域几乎没有比空闲时的温度高。
唯一真正值得关注的区域是底部的右角,因为当温度高达47℃(约117°F)时,直接放在腿上会变得有点不舒服。然而,这实际上只是在满负荷情况下的情况,这应该很少是该设备的典型用途之一。
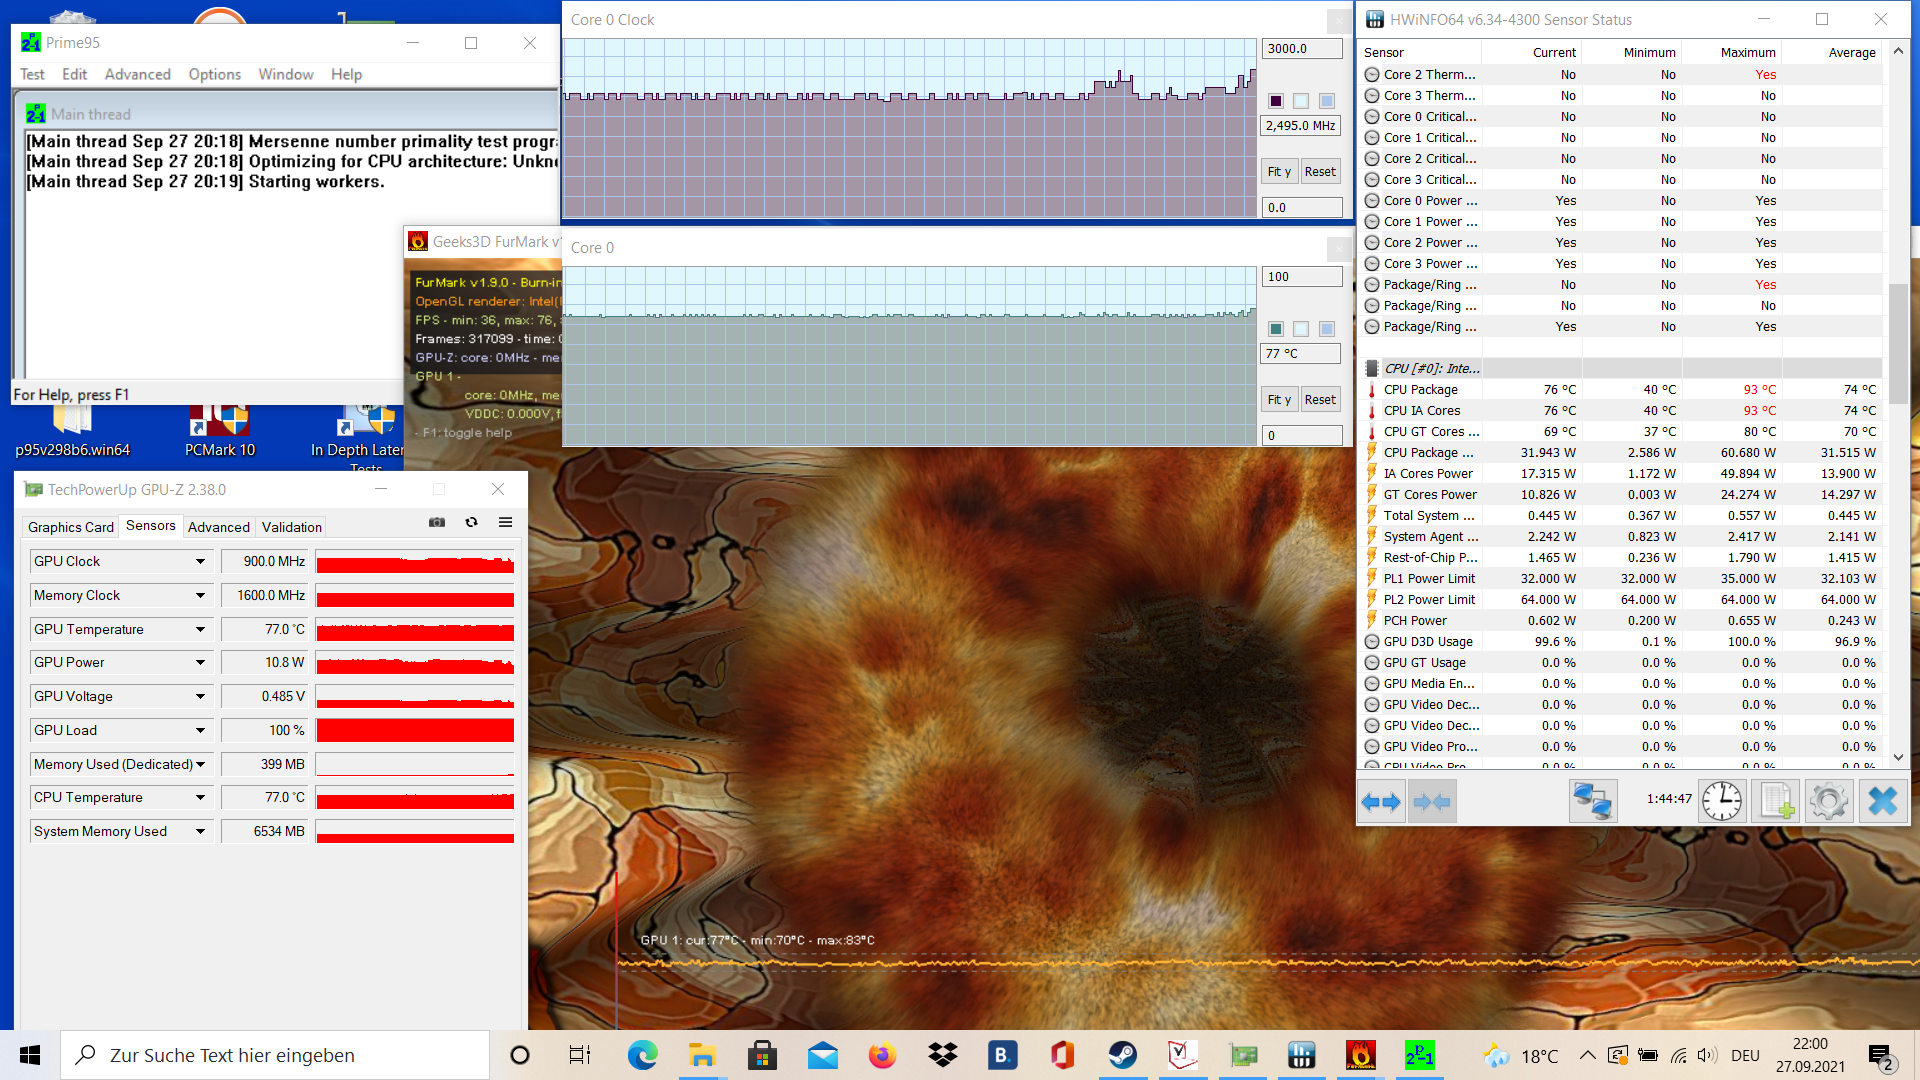
宏碁Swift 3在我们的标准化压力测试中没有表现出任何不正常的情况。经过短暂的提升,CPU稳定在2000MHz左右的时钟频率,温度刚刚超过70℃(约158°F)。GPU也保持在这个温度范围内,并在1100MHz左右持续运行。在测试中没有出现节流现象,所以这里没有任何性能损失可以抱怨。此外,即使在压力测试中,风扇也保持着令人愉快的安静。
(±) The maximum temperature on the upper side is 40 °C / 104 F, compared to the average of 36.8 °C / 98 F, ranging from 21 to 71 °C for the class Multimedia.
(-) The bottom heats up to a maximum of 47 °C / 117 F, compared to the average of 39.1 °C / 102 F
(+) In idle usage, the average temperature for the upper side is 28.2 °C / 83 F, compared to the device average of 31.3 °C / 88 F.
(+) The palmrests and touchpad are reaching skin temperature as a maximum (32.6 °C / 90.7 F) and are therefore not hot.
(-) The average temperature of the palmrest area of similar devices was 28.7 °C / 83.7 F (-3.9 °C / -7 F).
发言人
宏碁Swift 3在音频测试中显示出有些单薄的声音。这主要是由于相对较弱的低音,这显然低于所有测试的笔记本电脑的平均水平。相比之下,该设备以非常平衡的方式再现了中音和高音,因此至少没有明显的失真。
简而言之:对于音乐来说,缺少一点冲击力。这里建议通过音频插孔或蓝牙使用耳机。否则,由于其平衡性,声音再现是令人愉快的,而且对于视频通话等也是足够的。
Acer Swift 3 SF316-51 audio analysis
(±) | speaker loudness is average but good (75.2 dB)
Bass 100 - 315 Hz
(-) | nearly no bass - on average 25.5% lower than median
(±) | linearity of bass is average (12.1% delta to prev. frequency)
Mids 400 - 2000 Hz
(+) | balanced mids - only 2.7% away from median
(+) | mids are linear (5.2% delta to prev. frequency)
Highs 2 - 16 kHz
(+) | balanced highs - only 3.8% away from median
(+) | highs are linear (2.9% delta to prev. frequency)
Overall 100 - 16.000 Hz
(±) | linearity of overall sound is average (17.7% difference to median)
Compared to same class
» 51% of all tested devices in this class were better, 7% similar, 42% worse
» The best had a delta of 5%, average was 17%, worst was 45%
Compared to all devices tested
» 35% of all tested devices were better, 8% similar, 56% worse
» The best had a delta of 4%, average was 23%, worst was 134%
Apple MacBook 12 (Early 2016) 1.1 GHz audio analysis
(+) | speakers can play relatively loud (83.6 dB)
Bass 100 - 315 Hz
(±) | reduced bass - on average 11.3% lower than median
(±) | linearity of bass is average (14.2% delta to prev. frequency)
Mids 400 - 2000 Hz
(+) | balanced mids - only 2.4% away from median
(+) | mids are linear (5.5% delta to prev. frequency)
Highs 2 - 16 kHz
(+) | balanced highs - only 2% away from median
(+) | highs are linear (4.5% delta to prev. frequency)
Overall 100 - 16.000 Hz
(+) | overall sound is linear (10.2% difference to median)
Compared to same class
» 7% of all tested devices in this class were better, 2% similar, 90% worse
» The best had a delta of 5%, average was 18%, worst was 53%
Compared to all devices tested
» 5% of all tested devices were better, 1% similar, 94% worse
» The best had a delta of 4%, average was 23%, worst was 134%
能源管理。节俭的笔记本电脑,电池寿命长
能源消耗
宏碁Swift 3在能源消耗方面表现出色。在这方面,它可以或多或少地将自己与所有的对比设备区分开来。由于其内部的GPU,它的消耗量平均比竞争对手少5%到60%,而且也仅低于GPU的平均水平。65瓦的电源适配器的尺寸绰绰有余,最大消耗量略高于50瓦。
| Off / Standby | |
| Idle | |
| Load |
|
Key:
min: | |
| Acer Swift 3 SF316-51 i7-11370H, Iris Xe G7 96EUs, Micron 2210 MTFDHBA512QFD, IPS, 1920x1080, 16.1" | Xiaomi RedmiBook Pro 15 i7-11370H, GeForce MX450, Toshiba KBG40ZNV512G, IPS, 3200x2000, 15.6" | Dell Inspiron 15 5518-2X3JR i5-11300H, GeForce MX450, Toshiba KBG40ZNS512G NVMe, IPS, 1920x1080, 15.6" | Lenovo IdeaPad 5 Pro 16IHU6 i5-11300H, GeForce MX450, Samsung SSD PM981a MZVLB512HBJQ, IPS, 2560x1600, 16" | Asus VivoBook S15 D533UA R7 5700U, Vega 8, WDC PC SN530 SDBPNPZ-1T00, IPS, 1920x1080, 15.6" | Huawei MateBook D 16-53011VFJ R5 4600H, Vega 6, Samsung SSD PM981a MZVLB512HBJQ, IPS, 1920x1080, 16.1" | Average Intel Iris Xe Graphics G7 96EUs | Average of class Multimedia | |
|---|---|---|---|---|---|---|---|---|
| Power Consumption | -62% | -18% | -56% | -18% | -14% | -23% | -60% | |
| Idle Minimum * (Watt) | 4.8 | 6 -25% | 4 17% | 5 -4% | 5 -4% | 5.2 -8% | 5.51 ? -15% | 5.62 ? -17% |
| Idle Average * (Watt) | 7.4 | 9 -22% | 7.6 -3% | 9 -22% | 7.7 -4% | 8.2 -11% | 8.66 ? -17% | 10.2 ? -38% |
| Idle Maximum * (Watt) | 9 | 12 -33% | 10.2 -13% | 9.4 -4% | 12.2 -36% | 9.4 -4% | 10.9 ? -21% | 12.5 ? -39% |
| Load Average * (Watt) | 34.9 | 74 -112% | 49.4 -42% | 71 -103% | 41 -17% | 40 -15% | 45.6 ? -31% | 65 ? -86% |
| Witcher 3 ultra * (Watt) | 34.9 | 70.7 -103% | 49.4 -42% | 72.4 -107% | 43 -23% | 40.5 -16% | ||
| Load Maximum * (Watt) | 51.4 | 91 -77% | 63.4 -23% | 99 -93% | 65 -26% | 67 -30% | 67.8 ? -32% | 111.9 ? -118% |
* ... smaller is better
Energy consumption during The Witcher 3 / stress test
电池寿命
宏碁Swift 3 SF316-51实际上在纸面上与所选对比机型相比,地位较弱。除了华硕VivoBook S15 ,它的电池是最小的。
然而,由于已经提到的低消耗,该设备仍然能够在电池运行时间方面将所有对手甩在后面。在我们的Wi-Fi浏览测试中,该设备持续了近10个小时,而在观看本地存储的视频时,它甚至可以持续10个小时。即使在满负荷的情况下,该设备也能运行超过1.5小时而不需要外部电源。
| Acer Swift 3 SF316-51 i7-11370H, Iris Xe G7 96EUs, 56 Wh | Xiaomi RedmiBook Pro 15 i7-11370H, GeForce MX450, 70 Wh | Dell Inspiron 15 5518-2X3JR i5-11300H, GeForce MX450, 54 Wh | Lenovo IdeaPad 5 Pro 16IHU6 i5-11300H, GeForce MX450, 75 Wh | Asus VivoBook S15 D533UA R7 5700U, Vega 8, 50 Wh | Huawei MateBook D 16-53011VFJ R5 4600H, Vega 6, 56 Wh | Average of class Multimedia | |
|---|---|---|---|---|---|---|---|
| Battery runtime | -35% | -4% | -7% | -8% | -31% | 28% | |
| Reader / Idle (h) | 20.1 | 10.8 -46% | 19.4 -3% | 11.8 -41% | 24.9 ? 24% | ||
| H.264 (h) | 10.3 | 5.4 -48% | 10.4 1% | 8.5 -17% | 16.8 ? 63% | ||
| WiFi v1.3 (h) | 9.8 | 8.2 -16% | 9.4 -4% | 9.1 -7% | 9 -8% | 9 -8% | 12.3 ? 26% |
| Witcher 3 ultra (h) | 2.2 | 1 -55% | |||||
| Load (h) | 1.7 | 1.2 -29% | 1.4 -18% | 1.1 -35% | 1.645 ? -3% |
Pros
Cons
结论:宏碁Swift 3在测试中给我们留下深刻印象

宏碁Swift 3 SF316-51-75MK在我们的测试中留下了全面的印象。
宏碁Swift 3的性能对于这个级别的笔记本电脑的常见应用来说是绰绰有余的,如网页浏览、办公任务和流媒体。CPU还能处理一些要求较高的应用。你还可以玩一些游戏,即使大多数时候只是在中等图形设置下。
事实证明,Swift 3在能源消耗方面具有出色的性能,因此在电池寿命方面也是如此--尽管其电池相当小。我们选择的竞争对手在这方面几乎没有机会。高对比度和生动的显示屏也很吸引人,但它本可以更亮一些。
以大约1,000欧元(约合1,116美元)的价格,买家将得到一台均衡的笔记本电脑,在测试中没有显示出任何主要的弱点,而且不需要在这个价格范围内避开其竞争对手。它是一个很好的全能型产品,既适合工作也适合娱乐。
在列出的对比型号中,它的性能最好,但在某些情况下,它也比竞争对手贵100至200欧元(约116至231美元)。一些在性能方面接近的替代品是采用相同CPU的小米RedmiBook Pro 15 ,或采用较弱的Intel Tiger Lake i5-11300H 笔记本处理器i5-11300H联想IdeaPad 5 Pro 16IHU6的回顾。16英寸全能型产品,电池寿命良好的联想IdeaPad 5 Pro 16IHU6 ,这两款产品都配备了 MX450 作为其专用图形解决方案GeForce。
价格和可用性
在撰写本文时,你可以在亚马逊 ,找到宏碁Swift 3(Intel Core i7-11370H,Intel Iris Xe Graphics G7 96EUs, 16 GB DDR4x RAM, 512 GB SSD) ,价格约为999美元。
Acer Swift 3 SF316-51
- 10/01/2021 v7 (old)
Marcus Schwarten
Price comparison

