


华硕ROG Zephyrus G14 GA402R游戏笔记本回顾。AMD二代
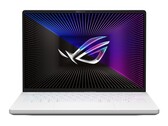
华硕ROG Zephyrus G14的目标不仅是手机游戏,而且是内容创作者。尽管这款14英寸的笔记本体积小巧,但却提供了出色的性能和各种功能。是时候让我们仔细看看这款笔记本的新GA402R版本了。
AMD Ryzen 9 6900HS, Radeon RX 6800S, 14", 1.7 kg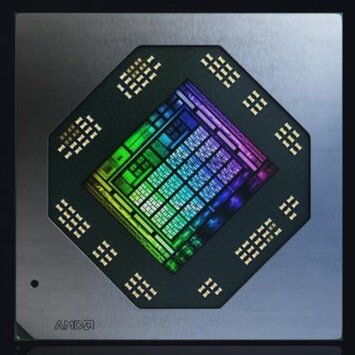
AMD Radeon RX 6800S是一款用于游戏笔记本电脑的移动高端显卡。它使用基于新的RDNA 2架构的Navi 23芯片。它使用了所有的2,048个着色器(=32 CUs),128个TMU和64个ROP,因此与桌面的Radeon RX 6700 XT相似。128位内存系统连接8GB GDDR6,内存时钟为2GHz。此外,RX6800S还包括32MB Infinity Cache。RX 6800S是RX 6800M的省电变体,具有较慢的时钟速度和较低的TDP。
由于时钟速度较低,性能应该比RX 6800M低。AMD指定了RTX 3070(80-100W)和RTX 3080(80-100W,原Max-Q)的低功耗变体之间的性能。
Navi 22芯片是在台积电以现代7纳米工艺制造的。由于降低了TDP,6800S适用于薄型游戏笔记本电脑。
Radeon RX 6000M Series
| ||||||||||||||||||||||||||||||||||||||||||||||
| Codename | Navi 23 | |||||||||||||||||||||||||||||||||||||||||||||
| Architecture | RDNA 2 | |||||||||||||||||||||||||||||||||||||||||||||
| Pipelines | 2048 - unified | |||||||||||||||||||||||||||||||||||||||||||||
| Core Speed | 1800 - 1975 (Boost) MHz | |||||||||||||||||||||||||||||||||||||||||||||
| Memory Speed | 16000 MHz | |||||||||||||||||||||||||||||||||||||||||||||
| Memory Bus Width | 128 Bit | |||||||||||||||||||||||||||||||||||||||||||||
| Memory Type | GDDR6 | |||||||||||||||||||||||||||||||||||||||||||||
| Max. Amount of Memory | 8 GB | |||||||||||||||||||||||||||||||||||||||||||||
| Shared Memory | no | |||||||||||||||||||||||||||||||||||||||||||||
| API | DirectX 12, Shader 6.4, OpenGL 4.6 | |||||||||||||||||||||||||||||||||||||||||||||
| Power Consumption | 100 Watt | |||||||||||||||||||||||||||||||||||||||||||||
| Transistor Count | 17.2 Billion | |||||||||||||||||||||||||||||||||||||||||||||
| Man. Technology | 7 nm | |||||||||||||||||||||||||||||||||||||||||||||
| Features | DisplayPort 1.4 w/DFSC, HDMI 2.0b, Radeon Media Engine (H.264 4K150 decode, 4K90 encode / H.265 4K90 decode, 4K60 encode / VP9 4K90 decode) | |||||||||||||||||||||||||||||||||||||||||||||
| Notebook Size | medium sized | |||||||||||||||||||||||||||||||||||||||||||||
| Date of Announcement | 01.06.2021 | |||||||||||||||||||||||||||||||||||||||||||||
| Link to Manufacturer Page | www.amd.com | |||||||||||||||||||||||||||||||||||||||||||||
The following benchmarks stem from our benchmarks of review laptops. The performance depends on the used graphics memory, clock rate, processor, system settings, drivers, and operating systems. So the results don't have to be representative for all laptops with this GPU. For detailed information on the benchmark results, click on the fps number.


| low | med. | high | ultra | QHD | 4K | |
|---|---|---|---|---|---|---|
| Alan Wake 2 | 58.3 | 51.6 | 46.5 | |||
| Lords of the Fallen | 70.8 | 55.6 | 38.1 | 26.8 | ||
| Total War Pharaoh | 236 | 164 | 111 | 91.5 | ||
| Assassin's Creed Mirage | 97 | 87 | 82 | 66 | ||
| EA Sports FC 24 | 181.5 | 162.4 | 138.4 | 126.2 | ||
| Cyberpunk 2077 | 114 | 86.4 | 71.6 | 65.9 | ||
| Baldur's Gate 3 | 119.2 | 95.6 | 78.5 | 76.7 | ||
| Lies of P | 147.8 | 127.4 | 109 | 99.6 | ||
| The Crew Motorfest | 60 | 60 | 60 | 58 | ||
| Starfield | 63.9 | 54.6 | 44.6 | 39.4 | ||
| Armored Core 6 | 95.4 | 90.4 | 84.7 | 71.8 | ||
| Immortals of Aveum | 64.3 | 52.2 | 39.1 | |||
| Atlas Fallen | 121.7 | 113.5 | 102.9 | 86.3 | ||
| Ratchet & Clank Rift Apart | 71.5 | 62.9 | 44.7 | 37.8 | ||
| F1 23 | 219 | 199 | 149 | 32 | ||
| Diablo 4 | 206 | 182.3 | 163.9 | 133.8 | ||
| Star Wars Jedi Survivor | 68.6 | 66 | 61.2 | 51.2 | ||
| Dead Island 2 | 177.4 | 162.5 | 134.3 | 122.9 | ||
| High On Life | 170.1 | 125 | 101.6 | 76.1 | ||
| The Quarry | 88.1 | 68 | 49.9 | 32.6 | 15.9 | |
| Vampire Bloodhunt | 204 | 191.4 | 182.7 | 114.5 | 54.9 | |
| Cyberpunk 2077 1.6 | 140.8 | 111 | 82 | 74 | 39 | 15.9 |
| Elex 2 | 63.8 | 61.7 | 58.1 | 45.1 | 25.6 | |
| GRID Legends | 202 | 166 | 129 | 100 | 64.4 | |
| Elden Ring | 58 | 58 | 57.8 | 57.8 | 38.7 | |
| Dying Light 2 | 89.7 | 73.8 | 48.7 | 23.6 | ||
| Rainbow Six Extraction | 172 | 167 | 133 | 81 | 27 | |
| God of War | 91.9 | 78.7 | 57.4 | 46.2 | 29.4 | |
| Halo Infinite | 114 | 93.5 | 88.3 | 61.4 | 30.4 | |
| Farming Simulator 22 | 156 | 137 | 129 | 124 | 76.8 | |
| Battlefield 2042 | 140 | 121 | 102 | 74.3 | 40.6 | |
| Forza Horizon 5 | 133 | 131 | 76 | 62 | 39 | |
| Riders Republic | 105 | 98 | 92 | 71 | 35 | |
| Guardians of the Galaxy | 125 | 123 | 115 | 82 | 44 | |
| Back 4 Blood | 230 | 198 | 182 | 119 | 58.9 | |
| Far Cry 6 | 120 | 106 | 95 | 72 | ||
| Alan Wake Remastered | 141 | 133 | 94.9 | 51.6 | ||
| New World | 96.3 | 85.2 | 75.8 | 55.7 | 28.2 | |
| Deathloop | 121 | 98.1 | 71.4 | 48.9 | 24.4 | |
| F1 2021 | 315 | 246 | 114 | 75 | 38 | |
| Days Gone | 124 | 114 | 86.5 | 61 | 32.7 | |
| Mass Effect Legendary Edition | 99.3 | 98.2 | 70.1 | |||
| Resident Evil Village | 212 | 193 | 163 | 105 | 51.3 | |
| Outriders | 122 | 114 | 106 | 66.8 | 38.2 | |
| Hitman 3 | 197 | 178 | 166 | 108 | 54.6 | |
| Yakuza Like a Dragon | 111 | 109 | 96.8 | 62.7 | 30 | |
| Assassin´s Creed Valhalla | 128 | 107 | 90 | 62 | 32 | |
| Dirt 5 | 140 | 113 | 91.5 | 70.8 | 44.1 | |
| Watch Dogs Legion | 117 | 104 | 66 | 48 | 25 | |
| Star Wars Squadrons | 328 | 291 | 276 | 174 | 89.6 | |
| Mafia Definitive Edition | 104 | 94.7 | 63.9 | 32.7 | ||
| Serious Sam 4 | 112 | 103 | 88.3 | 70.1 | 44.8 | |
| Crysis Remastered | 196 | 65.1 | 54.7 | 36 | 19 | |
| Death Stranding | 155 | 144 | 144 | 95.9 | 51.4 | |
| Gears Tactics | 226 | 155 | 101 | 65.2 | 35.2 | |
| Doom Eternal | 249 | 218 | 214 | 150 | 73.2 | |
| Hunt Showdown | 137 | 112 | 70.8 | 33.9 | ||
| Strange Brigade | 363 | 247 | 199 | 174 | 111.4 | |
| Far Cry 5 | 120 | 112 | 104 | |||
| X-Plane 11.11 | 75 | 61 | 51 | |||
| Final Fantasy XV Benchmark | 177.9 | 121 | 89 | 62.1 | ||
| Dota 2 Reborn | 149 | 128.4 | 130 | 108 | ||
| The Witcher 3 | 338.9 | 248 | 164 | 92 | ||
| GTA V | 178.7 | 173 | 161 | 89 | 66.1 | |
| low | med. | high | ultra | QHD | 4K | < 30 fps < 60 fps < 120 fps ≥ 120 fps | 1 11 14 | 4 21 37 | 7 32 24 | 1 11 31 14 | 10 28 3 | 10 22 5 |
For more games that might be playable and a list of all games and graphics cards visit our Gaming List
Lenovo Legion S7 16ARHA7: AMD Ryzen 9 6900HX, 16.00", 2.2 kg
External Review » Lenovo Legion S7 16ARHA7
Asus ROG Zephyrus G14 GA402RK: AMD Ryzen 9 6900HS, 14.00", 1.7 kg
External Review » Asus ROG Zephyrus G14 GA402R
External Review » Asus ROG Zephyrus G14 GA402RK
Asus ROG Zephyrus G14 GA402RK-L8093W: AMD Ryzen 9 6900HS, 14.00", 1.7 kg
External Review » Asus ROG Zephyrus G14 GA402RK-L8093W
» Comparison of GPUs
Detailed list of all laptop GPUs sorted by class and performance.
» Benchmark List
Sort and restrict laptop GPUs based on performance in synthetic benchmarks.
» Notebook Gaming List
Playable games for each graphics card and their average FPS results.
* Approximate position of the graphics adapter
» Notebookcheck多媒体笔记本电脑Top 10排名
» Notebookcheck游戏笔记本电脑Top 10排名
» Notebookcheck低价办公/商务笔记本电脑Top 10排名
» Notebookcheck高端办公/商务笔记本电脑Top 10排名
» Notebookcheck工作站笔记本电脑Top 10排名
» Notebookcheck亚笔记本电脑Top 10排名
» Notebookcheck超级本产品Top 10排名
» Notebookcheck变形本产品Top 10排名
» Notebookcheck平板电脑Top 10排名
» Notebookcheck智能手机Top 10排名
» Notebookcheck评测过最出色的笔记本电脑屏幕
» Notebookcheck售价500欧元以下笔记本电脑Top 10排名
» Notebookcheck售价300欧元以下笔记本电脑Top 10排名