Notebookcheck Logo

NVIDIA GeForce GTX 970M SLI

NVIDIA GeForce GTX 970M SLI

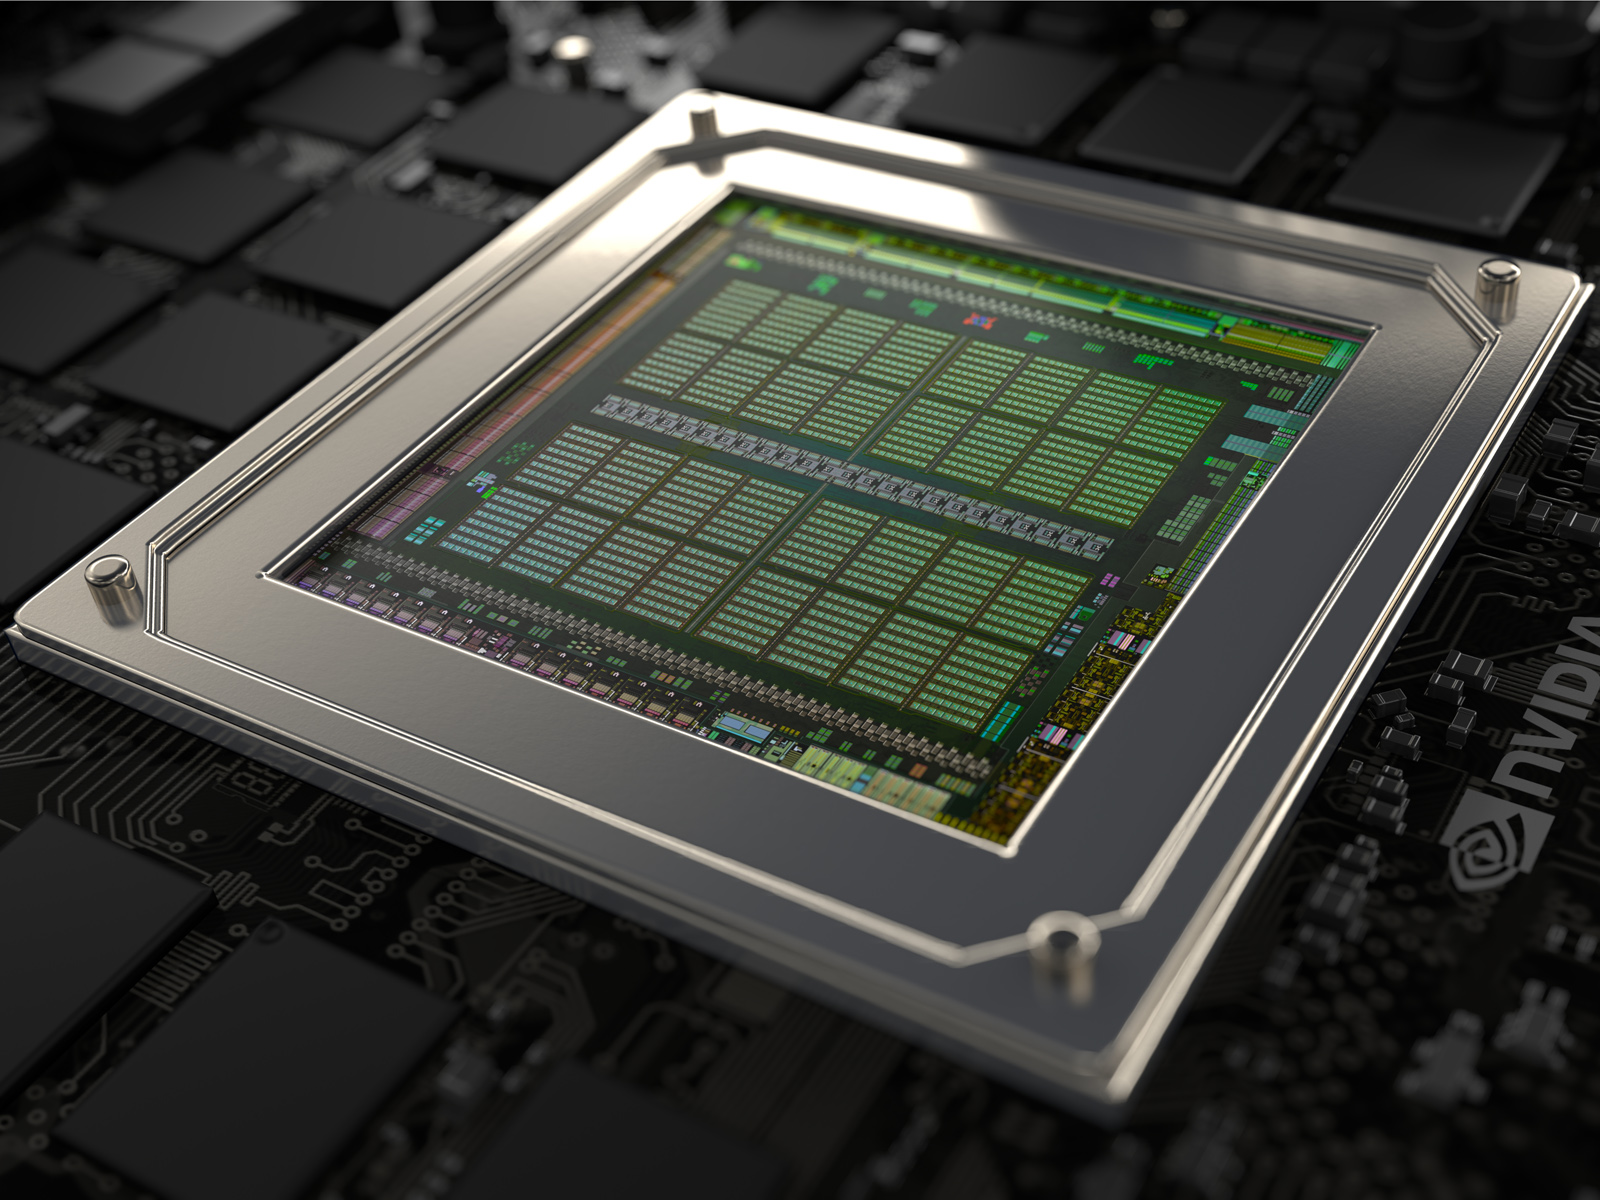
NVIDIA GeForce GTX 970M SLI是一款支持DirectX 11的高端笔记本显卡,由两块GeForce GTX 970M组成。每块显卡有一颗基于Maxwell架构的28纳米GM204核心,与在GTX 980M和一些桌面显卡中的芯片相同。它在SLI模式下的时钟频率与GTX 970M单显卡模式下相同(核心频率924MHz,显存频率1250MHz)。


在SLI设置下,每块显卡交替负责渲染一个单独的帧(在AFR模式下)。因此,它可能在较低帧数下(30fps)有“微卡帧”的情况。这个现象源自两个相邻帧间的时间间隔出现误差(例如在帧序列间出现的不规则延迟)。


架构


GM204核心基于Nvidia的Maxwell架构,用于替代前代的Kepler架构。在众多的改进中,Nvidia着重于重新设计流处理器(SMM),以提高工作负载和功效。现在每个SMM仅包含128个着色器单元和8个TMU单元,相对于前代Kepler架构中有了大幅降低。GM204核心包含四个GPC,每个运算核心由四个SMM组成。但是,在GeForce GTX 970M中,Nvidia禁用了16个SMM中的6个。因此,它只有1280个着色器ALU和80个TMU单元处于激活状态。另外,它还配备了48个ROP,分布与四个区块内,每个包含16个单元。


它的每个处理器的显存界面位宽为192位(3x64位)。由于采用了改进的压缩算法,它与GDDR5显存的单位MHz传输效率应该有了显著的提升。再加上显著提高的L1(每个SMM核心96KB)和L2缓存(2MB),它运行中所需的数据带宽也会有所降低。相对中端的GM107,更新更大的GM204核心有了一些新的功能和改变。除了改进了的SMM变形引擎,它也成为了第一块支持DirectX 11.2 API的Nvidia芯片。


性能


在优秀的驱动支持下,SLI模式的性能几乎可以达到单显卡性能的两倍。GTX 970M SLI的性能超出GeForce GTX 880M SLI约10%,是2014年底第二快的移动显卡。只有更贵的GTX 980M SLI可以提供更强的3D性能,更快约30%。不论如何,GTX 970M SLI的性能足以在最高细节设定,开启AA/AF和在超过全高清的分辨率下运行目前最复杂的大型游戏。


特性


它的大部分功能与GeForce GTX 800M系列相同。使用GTX 970M可以最多连接4个外接显示器,不过这可能会因为使用Optimus技术而有所减少。显示器可以通过DisplayPort 1.2或HDMI 2.0 (在4K分辨率下不支持HDCP)连接,最大分辨率支持3840 x 2160像素。高清的音频编码,例如杜比TrueHD和DTS-HD,可以通过比特流模式由HDMI接口传输。和前代型号相同,3D Vision与Optimus不相兼容。


最新的视频处理器VP6支持常见的编码如H.264,通过NVENC API,也支持最高4K分辨率的H.265视频的编码和解码。它也支持平行多视频流解码,使得蓝光电影级别的画中画功能成为了可能。


更多GTX 900M系列的功能,较老的显卡也支持其中的一部分,包括Battery Boost (帮助电池实现更长的游戏运行时间), Shadowplay (最大支持4K60p和130 Mbit/s的游戏视频录制) 和 Gamestream (实现在Shield掌机上流播放游戏功能)。更多功能的介绍请参考这里。


功耗


包含MXM主板和显存的每块GeForce GTX 970M显卡的功耗应与GTX 870M相当,设计热功耗为100W,总TDP约200W。由于显著提高的性能,这可以理解为它有更高的单位功率性能。不论如何,它的SLI模式只适合于在大型、沉重,配备强劲的散热系统的游戏笔记本中使用。在低负载情况下,动态的时钟频率调整可以帮助显卡节能。

GeForce GTX 900M Series

GeForce GTX 980M SLI 3072 @ 1.04 - 1.13 GHz2x 256 Bit @ 5000 MHz
GeForce GTX 970M SLI 2560 @ 0.92 - 1.04 GHz2x 192 Bit @ 5000 MHz
GeForce GTX 965M SLI 2048 @ 0.92 - 0.95 GHz128 Bit @ 5000 MHz
GeForce GTX 980M 1536 @ 1.04 - 1.13 GHz256 Bit @ 5000 MHz
GeForce GTX 970M 1280 @ 0.92 - 1.04 GHz192 Bit @ 5000 MHz
GeForce GTX 965M 1024 @ 0.92 - 0.95 GHz128 Bit @ 5000 MHz
GeForce GTX 960M 640 @ 1.1 - 1.2 GHz128 Bit @ 5000 MHz
GeForce GTX 950M 640 @ 0.91 - 1.12 GHz128 Bit @ 1800 - 5000 MHz
ArchitectureMaxwell
Pipelines2560 - unified
Core Speed924 - 1038 (Boost) MHz
Memory Speed5000 MHz
Memory Bus Width2x 192 Bit
Memory TypeGDDR5
Max. Amount of Memory2x 6144 MB
Shared Memoryno
APIDirectX 12_1, Shader 5.0
Power Consumption162 Watt
Transistor Count0 Billion
technology28 nm
FeaturesBattery Boost, GameStream, ShadowPlay, GPU Boost 2.0, Optimus, PhysX, CUDA, SLI, GeForce Experience
Notebook Sizelarge
Date of Announcement07.10.2014

Benchmarks

Performance Rating - 3DMark 11 + Fire Strike + Time Spy
6.7 pt (20%)
AMD Radeon HD 8180
0.06605 -99%
...
5.59 -17%
NVIDIA Quadro P3200
5.72 -15%
NVIDIA GeForce GTX 980 (Laptop)
5.94 -12%
5.99 -11%
6.08 -10%
6.09 -9%
NVIDIA Quadro RTX 3000 Max-Q
6.2 -8%
6.68 -1%
6.69 0%
NVIDIA GeForce GTX 970M SLI
6.72
6.75 0%
6.76 1%
6.79 1%
7.44 11%
NVIDIA Quadro RTX 4000 Max-Q
7.77 16%
7.85 17%
7.9 18%
8.04 20%
8.29 23%
...
21.1 214%
max:
33.3 396%
0%
100%
3DMark - 3DMark Ice Storm Unlimited Graphics
256573 Points (29%)
3DMark - 3DMark Ice Storm Extreme Graphics
256080 Points (33%)
3DMark - 3DMark Cloud Gate Score
min: 23191     avg: 25745     median: 25556.5 (27%)     max: 28674 Points
3DMark - 3DMark Cloud Gate Graphics
min: 88044     avg: 96257     median: 96943.5 (25%)     max: 103095 Points
3DMark - 3DMark Fire Strike Standard Score
min: 10621     avg: 10865     median: 10741 (19%)     max: 11358 Points
3DMark - 3DMark Fire Strike Standard Graphics
min: 14231     avg: 14776     median: 14759.5 (17%)     max: 15354 Points
3DMark - 3DMark Ice Storm Graphics
min: 157047     avg: 276540     median: 303556 (36%)     max: 342001 Points
3DMark 11 - 3DM11 Performance Score
min: 14203     avg: 14633     median: 14514.5 (20%)     max: 15300 Points
3DMark 11 - 3DM11 Performance GPU
min: 18249     avg: 19109     median: 18870 (16%)     max: 20447 Points
3DMark Vantage
3DM Vant. Perf. total +
3DMark Vantage - 3DM Vant. Perf. total
min: 35318     avg: 36119     median: 36119 (10%)     max: 36920 Points
3DM Vant. Perf. GPU no PhysX +
3DMark Vantage - 3DM Vant. Perf. GPU no PhysX
min: 42916     avg: 44188     median: 44187.5 (25%)     max: 45459 Points
ATI Radeon HD 3200
62 -100%
...
38910 -12%
AMD Radeon HD 8970M Crossfire
39191 -11%
39213 -11%
40134 -9%
40643 -8%
NVIDIA Quadro P4000
42370 -4%
42967 -3%
NVIDIA GeForce GTX 780M SLI
43525 -2%
43587 -1%
NVIDIA GeForce GTX 970M SLI
44188
NVIDIA GeForce GTX 980 (Laptop)
45346 3%
45988 4%
NVIDIA Quadro P3200
46624 6%
46945 6%
47209 7%
47227 7%
49207 11%
51344 16%
51396 16%
...
132443 200%
max:
170928 287%
0%
100%
3DMark 06 3DMark 06 - Standard 1280x1024 +
3DMark 06
min: 27179     avg: 28183     median: 28182.5 (37%)     max: 29186 Points
Unigine Heaven 3.0 - Unigine Heaven 3.0 DX 11
168.5 fps (56%)
SPECviewperf 12
specvp12 sw-03 +
SPECviewperf 12 - specvp12 sw-03
34 fps (8%)
specvp12 snx-02 +
SPECviewperf 12 - specvp12 snx-02
4.3 fps (1%)
specvp12 showcase-01 +
SPECviewperf 12 - specvp12 showcase-01
36.8 fps (8%)
specvp12 mediacal-01 +
SPECviewperf 12 - specvp12 mediacal-01
18.9 fps (5%)
specvp12 maya-04 +
SPECviewperf 12 - specvp12 maya-04
63.8 fps (17%)
specvp12 energy-01 +
SPECviewperf 12 - specvp12 energy-01
3.8 fps (3%)
specvp12 creo-01 +
SPECviewperf 12 - specvp12 creo-01
23 fps (9%)
specvp12 catia-04 +
SPECviewperf 12 - specvp12 catia-04
31.4 fps (5%)
Cinebench R10 Cinebench R10 Shading (32bit) +
Cinebench R10 - Cinebench R10 Shading (32bit)
min: 6823     avg: 7587     median: 7587 (5%)     max: 8351 points
Cinebench R11.5 Cinebench R11.5 OpenGL 64 Bit +
Cinebench R11.5 - Cinebench R11.5 OpenGL 64 Bit
min: 66.8     avg: 67.9     median: 67.8 (23%)     max: 69.3 fps
Cinebench R15
Cinebench R15 OpenGL 64 Bit +
Cinebench R15 - Cinebench R15 OpenGL 64 Bit
min: 107.8     avg: 122.6     median: 119.6 (7%)     max: 143.3 fps
Cinebench R15 OpenGL Ref. Match 64 Bit +
Cinebench R15 - Cinebench R15 OpenGL Ref. Match 64 Bit
99.6 % (100%)
GFXBench 3.0 - GFXBench 3.0 Manhattan Offscreen
259 fps (15%)
LuxMark v2.0 64Bit - LuxMark v2.0 Room GPU
min: 2163     avg: 2187     median: 2187 (10%)     max: 2211 Samples/s
LuxMark v2.0 64Bit - LuxMark v2.0 Sala GPU
min: 3744     avg: 3819     median: 3818.5 (7%)     max: 3893 Samples/s
ComputeMark v2.1 - ComputeMark v2.1 Result
min: 5307     avg: 5328     median: 5327.5 (6%)     max: 5348 points
- Range of benchmark values for this graphics card
- Average benchmark values for this graphics card
* Smaller numbers mean a higher performance

Game Benchmarks

The following benchmarks stem from our benchmarks of review laptops. The performance depends on the used graphics memory, clock rate, processor, system settings, drivers, and operating systems. So the results don't have to be representative for all laptops with this GPU. For detailed information on the benchmark results, click on the fps number.

low 1280x720
107.6  fps    + Compare
med. 1366x768
102.5  fps    + Compare
high 1920x1080
90.7  fps    + Compare
ultra 1920x1080
68.1  fps    + Compare
4K 3840x2160
37.1  fps    + Compare
» With all tested laptops playable in detail settings ultra.
Additional Benchmarks
Medium / Off 1920x1080
102.1
low 1280x720
60.7  fps    + Compare
med. 1366x768
60.3  fps    + Compare
high 1920x1080
52.2  fps    + Compare
ultra 1920x1080
50.2  fps    + Compare
4K 3840x2160
25.1  fps    + Compare
» With all tested laptops playable in detail settings ultra.
Additional Benchmarks
Medium / Off 4xAF 1920x1080
59.6
low 1280x720
161.3  fps    + Compare
med. 1366x768
129.4  fps    + Compare
high 1920x1080
71.9  fps    + Compare
ultra 1920x1080
54.9  fps    + Compare
4K 3840x2160
26.2  fps    + Compare
» With all tested laptops playable in detail settings ultra.
Additional Benchmarks
Medium Preset 4xAF 1920x1080
93.5
low 1280x720
69  fps    + Compare
med. 1920x1080
64  fps    + Compare
high 1920x1080
63  fps    + Compare
ultra 1920x1080
60  fps    + Compare
4K 3840x2160
27  fps    + Compare
» With all tested laptops playable in detail settings ultra.
Additional Benchmarks
Low Preset 1920x1080
66
XCOM 2

XCOM 2

2016
low 1280x720
94.6  fps    + Compare
med. 1920x1080
80.2  fps    + Compare
high 1920x1080
67.2  fps    + Compare
ultra 1920x1080
31.7  fps    + Compare
» With all tested laptops playable in detail settings high.
Additional Benchmarks
Low Preset TrilinearAF 1920x1080
93.8
low 1024x768
78.7  fps    + Compare
med. 1366x768
72.4  fps    + Compare
high 1920x1080
71.4  fps    + Compare
ultra 1920x1080
68  fps    + Compare
4K 3840x2160
31.9  fps    + Compare
» With all tested laptops playable in detail settings ultra.
low 1024x768
234.5  fps    + Compare
med. 1366x768
185.5  fps    + Compare
high 1920x1080
110.7  fps    + Compare
ultra 1920x1080
94.6  fps    + Compare
4K 3840x2160
33.5  fps    + Compare
» With all tested laptops playable in detail settings ultra.
low 1024x768
127.6  fps    + Compare
med. 1366x768
104.5  fps    + Compare
high 1920x1080
60.1  fps    + Compare
ultra 1920x1080
51.7  fps    + Compare
4K 3840x2160
21.3  fps    + Compare
» With all tested laptops playable in detail settings ultra.
low 1024x768
199.8  fps    + Compare
med. 1366x768
196.9  fps    + Compare
high 1920x1080
127.1  fps    + Compare
ultra 1920x1080
109.3  fps    + Compare
4K 3840x2160
40.8  fps    + Compare
» With all tested laptops playable in detail settings ultra.
low 1024x768
83.6  fps    + Compare
med. 1366x768
81.4  fps    + Compare
high 1920x1080
76.3  fps    + Compare
ultra 1920x1080
37.6  fps    + Compare
4K 3840x2160
30.8  fps    + Compare
» With all tested laptops playable in detail settings ultra.
Fallout 4

Fallout 4

2015
low 1280x720
145.9  fps    + Compare
med. 1366x768
139.2  fps    + Compare
high 1920x1080
96  fps    + Compare
ultra 1920x1080
78.4  fps    + Compare
4K 3840x2160
32.4  fps    + Compare
» With all tested laptops playable in detail settings ultra.
low 1024x768
141.1  fps    + Compare
med. 1366x768
138.4  fps    + Compare
high 1920x1080
109.2  fps    + Compare
ultra 1920x1080
98.9  fps    + Compare
4K 3840x2160
36  fps    + Compare
» With all tested laptops playable in detail settings ultra.
Anno 2205

Anno 2205

2015
low 1024x768
116.3  fps    + Compare
med. 1366x768
110.3  fps    + Compare
high 1920x1080
55.6  fps    + Compare
ultra 1920x1080
17.5  fps    + Compare
4K 3840x2160
21.4  fps    + Compare
» With all tested laptops playable in detail settings high.
FIFA 16

FIFA 16

2015
low 1280x720
302.4  fps    + Compare
high 1366x768
247  fps    + Compare
ultra 1920x1080
173.1  fps    + Compare
4K 3840x2160
70.8  fps    + Compare
» With all tested laptops playable in detail settings ultra.
Mad Max

Mad Max

2015
med. 1366x768
225  fps    + Compare
high 1920x1080
157.4  fps    + Compare
ultra 1920x1080
145.1  fps    + Compare
4K 3840x2160
49.7  fps    + Compare
» With all tested laptops playable in detail settings ultra.
low 1280x720
119  fps    + Compare
med. 1366x768
108  fps    + Compare
high 1920x1080
59 62 ~ 61 fps    + Compare
ultra 1920x1080
39 44 ~ 42 fps    + Compare
4K 3840x2160
18  fps    + Compare
» With all tested laptops playable in detail settings ultra.
low 1024x768
205.1  fps    + Compare
med. 1366x768
144.7  fps    + Compare
high 1920x1080
84.8  fps    + Compare
ultra 1920x1080
47.6  fps    + Compare
4K 3840x2160
28.4  fps    + Compare
» With all tested laptops playable in detail settings ultra.
low 1024x768
374.4  fps    + Compare
med. 1366x768
168  fps    + Compare
high 1920x1080
135.6  fps    + Compare
ultra 1920x1080
83.3  fps    + Compare
4K 3840x2160
71.4  fps    + Compare
» With all tested laptops playable in detail settings ultra.
low 1024x768
163.1  fps    + Compare
med. 1366x768
155  fps    + Compare
high 1920x1080
102.5 143.1 ~ 123 fps    + Compare
ultra 1920x1080
97.7 101.3 ~ 100 fps    + Compare
» With all tested laptops playable in detail settings ultra.
Evolve

Evolve

2015
low 1024x768
189.3  fps    + Compare
med. 1366x768
178.3  fps    + Compare
high 1920x1080
130.7  fps    + Compare
ultra 1920x1080
117.2  fps    + Compare
» With all tested laptops playable in detail settings ultra.
low 1024x768
161.3  fps    + Compare
med. 1366x768
147.8  fps    + Compare
high 1920x1080
100.3 100.3 ~ 100 fps    + Compare
ultra 1920x1080
69.8 70 ~ 70 fps    + Compare
» With all tested laptops playable in detail settings ultra.
Far Cry 4

Far Cry 4

2014
low 1024x768
117.4  fps    + Compare
med. 1366x768
114.3  fps    + Compare
high 1920x1080
101.7  fps    + Compare
ultra 1920x1080
89.9  fps    + Compare
» With all tested laptops playable in detail settings ultra.
low 1024x768
117.1  fps    + Compare
med. 1366x768
110.5  fps    + Compare
high 1920x1080
83.6  fps    + Compare
ultra 1920x1080
46  fps    + Compare
» With all tested laptops playable in detail settings ultra.
low 1024x768
153.9  fps    + Compare
med. 1366x768
115.4  fps    + Compare
high 1920x1080
106.8  fps    + Compare
ultra 1920x1080
65.6  fps    + Compare
» With all tested laptops playable in detail settings ultra.
low 1024x768
159.4  fps    + Compare
med. 1366x768
150.9  fps    + Compare
high 1920x1080
115.2  fps    + Compare
ultra 1920x1080
104.6  fps    + Compare
» With all tested laptops playable in detail settings ultra.
F1 2014

F1 2014

2014
low 1024x768
118  fps    + Compare
med. 1366x768
118  fps    + Compare
high 1920x1080
118 118 ~ 118 fps    + Compare
ultra 1920x1080
105 118 ~ 112 fps    + Compare
» With all tested laptops playable in detail settings ultra.
low 1024x768
74.8  fps    + Compare
med. 1366x768
73.8  fps    + Compare
high 1920x1080
53.8  fps    + Compare
» With all tested laptops playable in detail settings high.
low 1024x768
63.6  fps    + Compare
med. 1366x768
62.9  fps    + Compare
high 1920x1080
61.6 68.7 ~ 65 fps    + Compare
ultra 1920x1080
61.1 68 ~ 65 fps    + Compare
» With all tested laptops playable in detail settings ultra.
low 1024x768
264.9  fps    + Compare
med. 1366x768
237.9  fps    + Compare
high 1920x1080
153  fps    + Compare
ultra 1920x1080
114.1  fps    + Compare
» With all tested laptops playable in detail settings ultra.
low 1280x720
268.9  fps    + Compare
med. 1344x756
209.4  fps    + Compare
high 1920x1080
105.2 133.5 ~ 119 fps    + Compare
ultra 1920x1080
89.9 106.5 ~ 98 fps    + Compare
» With all tested laptops playable in detail settings ultra.
Fifa 15

Fifa 15

2014
low 1280x720
380.3  fps    + Compare
high 1366x768
288.1  fps    + Compare
ultra 1920x1080
211.7  fps    + Compare
4K 3840x2160
96  fps    + Compare
» With all tested laptops playable in detail settings ultra.
Sims 4

Sims 4

2014
low 1024x768
193.2  fps    + Compare
med. 1366x768
157.7  fps    + Compare
high 1920x1080
119.8  fps    + Compare
ultra 1920x1080
104.8  fps    + Compare
» With all tested laptops playable in detail settings ultra.
low 1024x768
35.2  fps    + Compare
med. 1366x768
35.2  fps    + Compare
high 1920x1080
35  fps    + Compare
ultra 1920x1080
37.6  fps    + Compare
» With all tested laptops playable in detail settings ultra.
low 1024x768
374.1  fps    + Compare
med. 1366x768
207.4  fps    + Compare
high 1920x1080
165.7  fps    + Compare
ultra 1920x1080
118.8  fps    + Compare
» With all tested laptops playable in detail settings ultra.
low 1024x768
103.6  fps    + Compare
med. 1366x768
89.4  fps    + Compare
high 1920x1080
63.9  fps    + Compare
ultra 1920x1080
45.5  fps    + Compare
» With all tested laptops playable in detail settings ultra.
low 1280x720
60  fps    + Compare
med. 1280x720
60  fps    + Compare
high 1920x1080
60  fps    + Compare
ultra 1920x1080
55.7  fps    + Compare
» With all tested laptops playable in detail settings ultra.
Thief

Thief

2014
low 1024x768
125.5  fps    + Compare
med. 1366x768
119.7  fps    + Compare
high 1366x768
98.5 115.1 ~ 107 fps    + Compare
ultra 1920x1080
83.8 86.8 ~ 85 fps    + Compare
» With all tested laptops playable in detail settings ultra.
low 1024x768
238.3  fps    + Compare
med. 1366x768
204.1  fps    + Compare
high 1366x768
140.2  fps    + Compare
ultra 1920x1080
90.2  fps    + Compare
» With all tested laptops playable in detail settings ultra.
low 1024x768
199.6  fps    + Compare
med. 1366x768
199  fps    + Compare
high 1366x768
196.6  fps    + Compare
ultra 1920x1080
104.3  fps    + Compare
4K 3840x2160
48.7  fps    + Compare
» With all tested laptops playable in detail settings ultra.
low 1280x720
76.6  fps    + Compare
med. 1366x768
88.9  fps    + Compare
high 1366x768
90.9  fps    + Compare
ultra 1920x1080
92.5  fps    + Compare
» With all tested laptops playable in detail settings ultra.
Dota 2

Dota 2

2013
low 1024x768
119.7  fps    + Compare
med. 1366x768
119.7  fps    + Compare
ultra 1920x1080
119.4  fps    + Compare
» With all tested laptops playable in detail settings ultra.
low 1024x768
139.7  fps    + Compare
med. 1366x768
137  fps    + Compare
high 1366x768
112.1 120.6 ~ 116 fps    + Compare
ultra 1920x1080
79.2 82.6 ~ 81 fps    + Compare
» With all tested laptops playable in detail settings ultra.
low 1280x720
290.2  fps    + Compare
med. 1366x768
273.1  fps    + Compare
high 1366x768
206.9 233.7 ~ 220 fps    + Compare
ultra 1920x1080
130.1 132 ~ 131 fps    + Compare
» With all tested laptops playable in detail settings ultra.
high 1366x768
138.1  fps    + Compare
ultra 1920x1080
85.9  fps    + Compare
» With all tested laptops playable in detail settings ultra.
low 1024x768
519  fps    + Compare
med. 1366x768
465.4  fps    + Compare
high 1366x768
351.8 363.7 ~ 358 fps    + Compare
ultra 1920x1080
156.5 175.1 ~ 166 fps    + Compare
» With all tested laptops playable in detail settings ultra.
Crysis 3

Crysis 3

2013
low 1024x768
154.4  fps    + Compare
med. 1366x768
138.3  fps    + Compare
high 1366x768
111.7  fps    + Compare
ultra 1920x1080
56.3  fps    + Compare
» With all tested laptops playable in detail settings ultra.
Far Cry 3

Far Cry 3

2012
low 1024x768
145.4  fps    + Compare
med. 1366x768
137.9  fps    + Compare
high 1366x768
117.1  fps    + Compare
ultra 1920x1080
74.5  fps    + Compare
» With all tested laptops playable in detail settings ultra.
low 1024x768
113.1  fps    + Compare
med. 1366x768
108.3  fps    + Compare
high 1366x768
99.3  fps    + Compare
ultra 1920x1080
76.2  fps    + Compare
» With all tested laptops playable in detail settings ultra.
low 1024x768
160.7  fps    + Compare
high 1366x768
66.4 85.6 ~ 76 fps    + Compare
ultra 1920x1080
62.5 78.2 ~ 70 fps    + Compare
» With all tested laptops playable in detail settings ultra.
high 1366x768
182.8  fps    + Compare
ultra 1920x1080
92.5  fps    + Compare
» With all tested laptops playable in detail settings ultra.
lowmed.highultraQHD4K
Need for Speed 2016107.6102.590.768.137.1
Hitman 201660.760.352.250.225.1
The Division161.3129.471.954.926.2
Far Cry Primal6964636027
XCOM 294.680.267.231.7
Rise of the Tomb Raider78.772.471.46831.9
Rainbow Six Siege234.5185.5110.794.633.5
Just Cause 3127.6104.560.151.721.3
Star Wars Battlefront199.8196.9127.1109.340.8
Assassin's Creed Syndicate83.681.476.337.630.8
Fallout 4145.9139.29678.432.4
Call of Duty: Black Ops 3141.1138.4109.298.936
Anno 2205116.3110.355.617.521.4
FIFA 16302.4247173.170.8
Mad Max225157.4145.149.7
Batman: Arkham Knight119108614218
The Witcher 3205.1144.784.847.628.4
Dirt Rally374.4168135.683.371.4
Battlefield Hardline163.1155123100
Evolve189.3178.3130.7117.2
Dragon Age: Inquisition161.3147.810070
Far Cry 4117.4114.3101.789.9
Assassin's Creed Unity117.1110.583.646
Call of Duty: Advanced Warfare153.9115.4106.865.6
Civilization: Beyond Earth159.4150.9115.2104.6
F1 2014118118118112
The Evil Within74.873.853.8
Ryse: Son of Rome63.662.96565
Alien: Isolation264.9237.9153114.1
Middle-earth: Shadow of Mordor268.9209.411998
Fifa 15380.3288.1211.796
Sims 4193.2157.7119.8104.8
Risen 3: Titan Lords35.235.23537.6
GRID: Autosport374.1207.4165.7118.8
Watch Dogs103.689.463.945.5
Wolfenstein: The New Order60606055.7
Thief125.5119.710785
Call of Duty: Ghosts238.3204.1140.290.2
Battlefield 4199.6199196.6104.348.7
Saints Row IV76.688.990.992.5
Dota 2119.7119.7119.4
Metro: Last Light139.713711681
BioShock Infinite290.2273.1220131
StarCraft II: Heart of the Swarm138.185.9
Tomb Raider519465.4358166
Crysis 3154.4138.3111.756.3
Far Cry 3145.4137.9117.174.5
Hitman: Absolution113.1108.399.376.2
Guild Wars 2160.77670
Sleeping Dogs182.892.5
< 30 fps
< 60 fps
< 120 fps
≥ 120 fps

1
18
28

1
21
23

4
30
15
1
12
31
5


7
9
3

For more games that might be playable and a list of all games and graphics cards visit our Gaming List
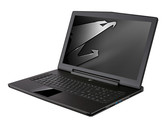
v1.26
log 27. 06:51:26

#0 no ids found in url (should be separated by "_") +0s ... 0s

#1 not redirecting to Ajax server +0s ... 0s

#2 did not recreate cache, as it is less than 5 days old! Created at Thu, 25 Apr 2024 05:40:10 +0200 +0.001s ... 0.001s

#3 no comparison url found in template nbc.compare_page_1 needed +0.045s ... 0.046s

#4 no comparison url found in template nbc.compare_page_1 needed +0s ... 0.047s

#5 no comparison url found in template nbc.compare_page_1 needed +0s ... 0.047s

#6 no comparison url found in template nbc.compare_page_1 needed +0s ... 0.048s

#7 no comparison url found in template nbc.compare_page_1 needed +0s ... 0.048s

#8 no comparison url found in template nbc.compare_page_1 needed +0s ... 0.048s

#9 no comparison url found in template nbc.compare_page_1 needed +0s ... 0.048s

#10 composed specs +0s ... 0.048s

#11 did output specs +0s ... 0.048s

#12 start showIntegratedCPUs +0s ... 0.048s

#13 getting avg benchmarks for device 5998 +0.03s ... 0.078s

#14 got single benchmarks 5998 +0.017s ... 0.094s

#15 got avg benchmarks for devices +0s ... 0.094s

#16 min, max, avg, median took s +0.684s ... 0.778s

#17 before gaming benchmark output +0s ... 0.778s

#18 Got 231 rows for game benchmarks. +0.027s ... 0.805s

#19 composed SQL query for gamebenchmarks +0s ... 0.805s

#20 got data and put it in $dataArray +0.042s ... 0.847s

#21 benchmarks composed for output. +2.12s ... 2.967s

#22 no comparison url found in template nbc.compare_page_1 needed +0.005s ... 2.972s

#23 return log +0s ... 2.972s

Please share our article, every link counts!

» Comparison of GPUs
Detailed list of all laptop GPUs sorted by class and performance.

» Benchmark List
Sort and restrict laptop GPUs based on performance in synthetic benchmarks.

» Notebook Gaming List
Playable games for each graphics card and their average FPS results.

Class 1

GeForce RTX 2080 Super Mobile

Class 2

M1 Max 32-Core GPU *
GeForce RTX 2070 Super Mobile
M1 Max 24-Core GPU *
Quadro RTX 5000 Max-Q
Radeon RX 5700M *
GeForce GTX 1080 Mobile
Quadro RTX 4000 (Laptop)
M1 Pro 16-Core GPU *
Radeon PRO W6600M *
GeForce RTX 2070 Super Max-Q
Quadro RTX 4000 Max-Q *
M1 Pro 14-Core GPU *
Quadro P5200
Quadro RTX 3000 Max-Q *
Quadro P4200
Quadro P5000 Max-Q *
GeForce GTX 980 (Laptop)
Quadro P4000
Quadro P4000 Max-Q
Quadro P3200
Radeon RX 580X (Laptop) *
Radeon RX 580 (Laptop)
Radeon Pro 5300M
Radeon RX 5300M
Quadro P3000 Max-Q *
Quadro T2000 Max-Q *
Radeon Pro WX 7100 *
Radeon RX 570X (Laptop) *
Radeon RX 570 (Laptop) *
Radeon RX 470 (Laptop) *
Quadro T1000 Max-Q *

Class 3

Vega M GH
Quadro M5000M
GeForce GTX 1050 Ti Mobile
Radeon 680M
Quadro P2000
Quadro P2000 Max-Q
Quadro M4000M
T500 Laptop GPU *
Radeon R9 M395X
GeForce GTX 1050 Ti Max-Q *
Radeon Pro Vega 16
WX Vega M GL
Radeon R9 M485X
Quadro M3000M
FirePro W7170M
Radeon R9 M395
GeForce GTX 1050 Max-Q *
Radeon 660M
Radeon Pro WX 4150 *
Radeon RX 560X (Laptop)
Radeon RX 560 (Laptop)
Radeon RX 460 (Laptop)
Quadro P1000
Radeon R9 M390
Xe MAX
Radeon Pro 560X
Radeon Pro 560
Radeon Pro 460
Radeon Pro WX 4130 *
GeForce GTX 960M
Quadro P620 *
Radeon RX 550X (Laptop)
Radeon Pro WX 3200 *
Radeon Pro 555X
Radeon Pro 555
Radeon Pro 455
Quadro P600
Quadro M2000M
Radeon RX 540X *
Radeon Pro WX 2100 *
Radeon Pro WX 3100 *
GeForce GTX 950M
Radeon Pro 450
Radeon 630
Radeon 540X *
Radeon R9 M385X
Quadro P520
Quadro M1000M
GeForce 945M
Quadro P500 *
Iris Plus Graphics G7 (Ice Lake 64 EU) *
Vega 10 *
Iris Pro Graphics 580
FirePro W5170M *
Radeon R9 M370X
Vega 9
FirePro W5130M
UHD Graphics Xe G4 48EUs *
UHD Graphics 32EUs
UHD Graphics Xe 32EUs (Tiger Lake-H) *
UHD Graphics 750
Vega 7
Radeon R7 M465
Iris Pro Graphics 6200
Vega 8
GeForce 940M
Iris Plus Graphics G4 (Ice Lake 48 EU)
Quadro M600M
FirePro W4190M
Radeon R9 M375
Radeon R7 M445
Iris Plus Graphics 650
Iris Graphics 550
Radeon 625
Vega 6 *
Iris Plus Graphics 640
Iris Graphics 540
UHD Graphics 24EUs (Alder Lake-N) *
Radeon R7 M360
GeForce 920M
Radeon 620
Radeon R7 M340
Radeon 610
Radeon 610M *
Vega 6 *
UHD Graphics G1 (Ice Lake 32 EU)
UHD Graphics Xe 16EUs (Tiger Lake-H) *
HD Graphics 530
Radeon R5 (Bristol Ridge)
Adreno 690 *
Adreno 685 *
Adreno 680 *
Radeon R5 M330
GeForce 910M
HD Graphics 520

Class 4

UHD Graphics 730
Radeon R5 M320 *
Radeon R5 M315 *
Radeon R5 M420 *
Vega 2 *
UHD Graphics 617
UHD Graphics 615
HD Graphics 515
UHD Graphics 610
HD Graphics 510
UHD Graphics 605
Radeon R4 (Stoney Ridge)
Radeon R2 (Stoney Ridge)
HD Graphics (Broadwell)
UHD Graphics 600
HD Graphics (Braswell)

Class 5

* Approximate position of the graphics adapter