


英特尔 Arc G3 Extreme 重塑掌机游戏体验——MSI Claw 8 EX AI+ 评测
微星(MSI)的 Claw 8 EX AI+ 是首款搭载英特尔首款专用掌上型 SoC——Arc G3 Extreme 的设备,该芯片配备了性能强劲的 Arc B390 集成显卡。其性能达到了一个全新的高度,轻松超越了 AMD 的专用掌上型芯片 Z2 Extreme。
Intel Arc G3 Extreme, Arc B390 Panther Lake iGPU, 8", 786 g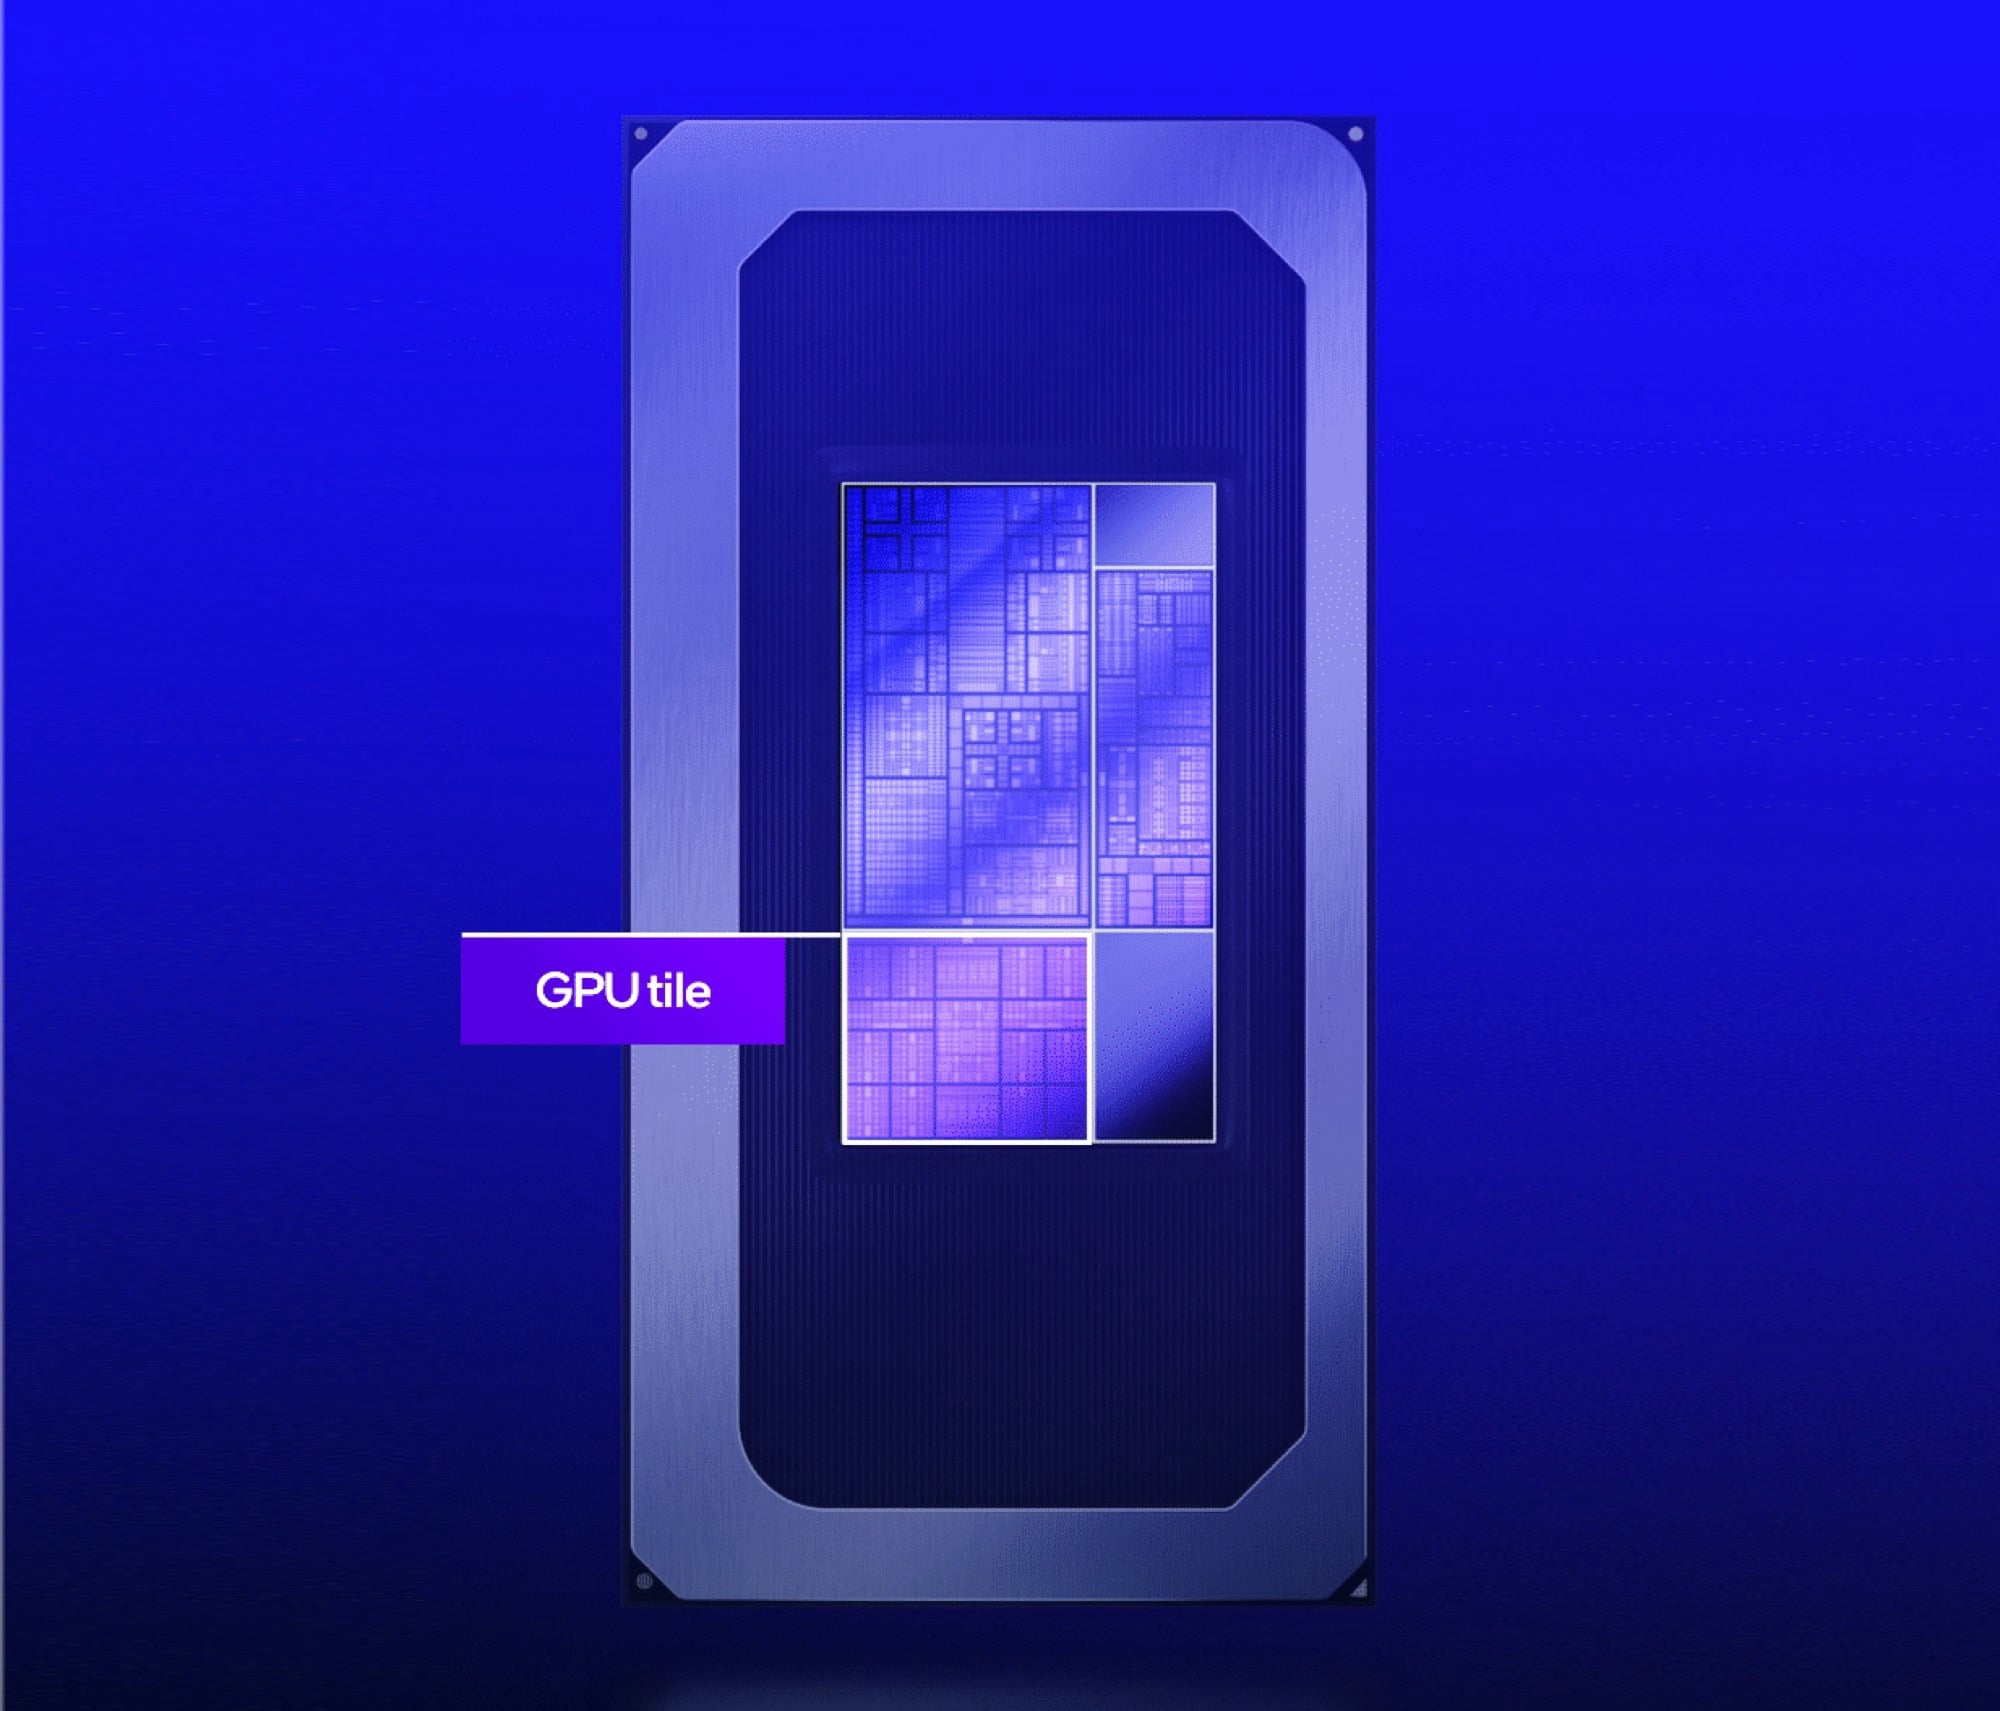
英特尔Arc B390(或Arc Pro B390)是英特尔Panther Lake SoC系列中功能最强大的集成图形单元,提供12个Xe3内核。这相当于 96 个 CU 和 1,536 个 ALU。
在 3DMarkSteel Nomad 等合成基准测试中,Arc B390 达到了 RTX 2060 笔记本电脑 GPU 的水平的水平,但仍明显落后于现代 RTX 4050 笔记本电脑 GPU.不过,在我们的游戏基准测试中,B390 在相关设置下仍明显落后于 2060 Mobile。快速 AMD Radeon 8050S(Strix Halo)也明显更快。较旧的 英特尔 Arc 140T(箭湖)明显落后(如在游戏中落后 75%)。
此外,性能在很大程度上取决于散热和保证的 TDP 限制。不过,即使在要求苛刻的游戏中,如《Anno 117》或《The Outer Worlds 2》,其性能也足以在低设置下达到可玩帧率。
新的媒体引擎现在支持 AV1 编解码、VVC 解码、AVC 10 位和 eDP 1.5。iGPU 通过双通道内存控制器支持快速 LPDDR5-9600(最大 96 GB)或 DDR5-7200(最大 128 GB)。
芯片由台积电采用现代 N3E 工艺制造。
Arc Xe3 Series
| |||||||||||||
| Codename | Panther Lake iGPU | ||||||||||||
| iGPU | Integrated Graphics | ||||||||||||
| Pipelines | 96 - unified | ||||||||||||
| Raytracing Cores | 12 | ||||||||||||
| Core Speed | 2500 (Boost) MHz | ||||||||||||
| AI GPU | 122 TOPS INT8 | ||||||||||||
| Cache | L1: 768 KB, L2: 16 MB | ||||||||||||
| Shared Memory | yes | ||||||||||||
| API | DirectX 12_2, OpenGL 4.6, OpenCL 3.0 | ||||||||||||
| Man. Technology | 3 nm | ||||||||||||
| Displays | 4 Displays (max.), HDMI 2.1 FRL, DisplayPort 2.1 UHBR20 | ||||||||||||
| Date of Announcement | 05.01.2026 | ||||||||||||
| ||||||||||||||||||||||||
The following benchmarks stem from our benchmarks of review laptops. The performance depends on the used graphics memory, clock rate, processor, system settings, drivers, and operating systems. So the results don't have to be representative for all laptops with this GPU. For detailed information on the benchmark results, click on the fps number.


For more games that might be playable and a list of all games and graphics cards visit our Gaming List


Khadas Mind Pro: Intel Core Ultra X7 358H, 0.6 kg
Review » 凯达斯 Mind Pro 评测:配备英特尔酷睿 Ultra X7 和 Arc 图形处理器的高端迷你电脑是 Khadas 生态系统的完美基础
MSI Prestige 14 Flip AI+ 2026: Intel Core Ultra X7 358H, 14.00", 1.4 kg
Review » 豹湖电池带来近 20 小时的续航时间--微星 Prestige 14 Flip AI+ 可折叠机型评测
Dell XPS 14 Core Ultra X7 358H: Intel Core Ultra X7 358H, 14.00", 1.4 kg
Review » 戴尔 XPS 14 2026 评测:搭载英特尔豹湖 X7,全面重生
Asus ZenBook Duo UX8407AA: Intel Core Ultra X9 388H, 14.00", 1.7 kg
Review » 英特尔 Panther Lake Arc B390 性能和效率分析:英特尔新 iGPU 与 NvidiaGeForce RTX 4050 互有胜负
Asus ExpertBook Ultra B9406CAA: Intel Core Ultra X7 358H, 14.00", 1.1 kg
Review » 华硕 ExpertBook Ultra 评测:英特尔豹湖 X7 的精彩首秀
Asus ZenBook Duo UX8407AA: Intel Core Ultra X9 388H, 14.00", 1.7 kg
Review » 华硕 ZenBook Duo UX8407 可折叠笔记本评测--英特尔豹湖改变游戏规则
Review » 英特尔豹湖酷睿™ Ultra X9 388H 性能分析--效率超越 Arrow Lake,超越 Zen 5
Microsoft Surface Laptop 8 13.8, Core X7 368H: Intel Core Ultra X7 368H, 13.80", 1.4 kg
External Review » Microsoft Surface Laptop 8 13.8, Core X7 368H - 评测与配置
MSI Claw 8 EX AI+ CG3EM: Intel Arc G3 Extreme, 8.00", 0.8 kg
External Review » MSI Claw 8 EX AI+ CG3EM - 评测与配置
Lenovo ThinkPad X9-15p: Intel Core Ultra X9 388H, 15.30", 1.5 kg
External Review » Lenovo ThinkPad X9-15p
Xiaomi RedmiBook Pro 14 2026: Intel Core Ultra X7 358H, 14.00", 1.5 kg
External Review » 小米红米笔记本 Pro 14 2026
Dell XPS 16 Core Ultra X7 358H: Intel Core Ultra X7 358H, 16.00", 1.7 kg
External Review » 戴尔 XPS 16 Core Ultra X7 358H
Acer Swift 16 AI SF16-71T-75YX: Intel Core Ultra X7 358H, 16.00", 1.4 kg
External Review » 碁宏 Swift 16 AI SF16-71T-75YX
HP OmniBook X 16 (2026): Intel Core Ultra X7 358H, 16.00", 2.1 kg
External Review » HP OmniBook X 16 (2026)
Acer Swift Go 16 AI SFG16-171: Intel Core Ultra X9 388H, 16.00", 1.3 kg
External Review » Acer Swift Go 16 AI SFG16-171
HP EliteBook X G2i 14 NG AI: Intel Core Ultra X7 358H, 14.00", 1 kg
External Review » HP EliteBook X G2i 14 NG AI
Asus ZenBook Duo UX8407AA: Intel Core Ultra X9 388H, 14.00", 1.7 kg
External Review » 华硕 ZenBook Duo UX8407AA
Acer Swift 16 AI SF16-71T: Intel Core Ultra X9 388H, 16.00", 1.6 kg
External Review » 宏碁 Swift 16 AI SF16-71T
LG gram Pro AI (2026) 16Z90U: Intel Core Ultra X7 358H, 16.00", 1.2 kg
External Review » LG gram Pro AI (2026) 16Z90U
Asus ExpertBook Ultra B9406CAA: Intel Core Ultra X7 358H, 14.00", 1.1 kg
External Review » 华硕 ExpertBook Ultra B9406CAA
MSI Prestige 14 Flip AI+ 2026: Intel Core Ultra X7 358H, 14.00", 1.4 kg
External Review » 微星 Prestige 14 Flip AI+ 2026
Samsung Galaxy Book6 Pro NP960XJG-KG6DE: Intel Core Ultra X7 358H, 16.00", 1.6 kg
External Review » SamsungGalaxy Book6 Pro NP960XJG-KG6DE
MSI Claw 8 EX AI+ CG3EM: Intel Arc G3 Extreme, 8.00", 0.8 kg
» MSI Claw 8 EX AI+ 评测结论——最快的游戏掌机
» 搭载 Arc G3 Extreme 的 MSI Claw 8 EX AI+ 表现非常出色,但谁愿意为一款掌机花 1799 美元呢?
» 在35瓦功耗下,英特尔的Arc G3 Extreme通常比AMD的Ryzen Z2 Extreme快50%以上
HP OmniBook Ultra 14 Core Ultra X9: Intel Core Ultra X9 388H, 14.00", 1.3 kg
» 我们最喜欢惠普 OmniBook Ultra 14 的地方,并不是这台笔记本电脑本身,而是它的充电器
MSI Claw 8 EX AI+ CG3EM: Intel Arc G3 Extreme, 8.00", 0.8 kg
» 微星听取了用户的批评意见,并对新款 MSI Claw 8 EX AI+ 的软件进行了优化
HP OmniBook Ultra 14 Core Ultra X9: Intel Core Ultra X9 388H, 14.00", 1.3 kg
» 新款惠普 OmniBook Ultra 14 相比戴尔 XPS 14 拥有一个关键优势
» 搭载 Core Ultra X9 处理器的 HP OmniBook Ultra 14 是一款令人惊喜的游戏利器
» 最新款惠普 OmniBook Ultra 14 堪称 Spectre 系列的近乎完美的继任者
» 首批跑分显示,Core Ultra X9 388H 的运行速度慢于 Core Ultra X7 386H
Acer Swift 16 AI SF16-71T: Intel Core Ultra X9 388H, 16.00", 1.6 kg
» 宏碁 Swift 16 即使在压力下也能保持凉爽
Acer Swift 16 AI SF16-71T-75YX: Intel Core Ultra X7 358H, 16.00", 1.4 kg
» 宏碁 Swift 16 即使在压力下也能保持凉爽
MSI Prestige 16 AI C3MTG: Intel Core Ultra X7 358H, 16.00", 1.6 kg
» 微星Prestige 16 AI+的65瓦交流适配器会使充电速度遇到瓶颈
» 微星威望 16 C3MTG 是目前市场上最好的 XPS 16 替代品之一
» 2026 Prestige 16 在 1080p 超高画质下运行《赛博朋克 2077》的速度超过 45 FPS,而它甚至不是一台游戏笔记本电脑
» 微星可能不想让你知道的 2026 Prestige 16 的所有变化
» 微星 Prestige 16 AI+ C3MTG 在平衡模式下运行噪音明显降低,但有一个问题
Dell XPS 16 Core Ultra X7 358H: Intel Core Ultra X7 358H, 16.00", 1.7 kg
» 与最新的 XPS 16 相比,选择戴尔 16 Premium 的两大理由
» 戴尔 XPS 16 酷睿 Ultra X7 比酷睿 Ultra 5 声音更大、更耗电
» 戴尔 XPS 配备了比大多数其他笔记本电脑更多的电池充电选项
» 戴尔 XPS 16 OLED 配置带来了一些有趣的优缺点
» 避免选择新的 XPS 16 Core Ultra 7,而直接选择性能更优越的 Core Ultra X7
Khadas Mind Pro: Intel Core Ultra X7 358H, 0.6 kg
» 卡达斯 Mind Pro 迷你电脑价格上涨:预购价格有效期至 3 月 27 日
» 卡达斯 Mind Pro 迷你电脑评测:从办公电脑到配备GeForce RTX GPU 的游戏系统
Asus ZenBook Duo UX8407AA: Intel Core Ultra X9 388H, 14.00", 1.7 kg
» 华硕新款 Zenbook Duo UX8407 堪称最佳双屏可折叠产品
Dell XPS 14 Core Ultra X7 358H: Intel Core Ultra X7 358H, 14.00", 1.4 kg
» 戴尔 XPS 14 Arc B390 与GeForce RTX 4050:3DMark 对比不能说明一切
» 在打开 2026 型之前,请务必阅读戴尔 XPS 14 维修手册
» 2026 戴尔 XPS 14 解决了该系列最令人不满的一些问题
Samsung Galaxy Book6 Pro NP960XJG-KG6DE: Intel Core Ultra X7 358H, 16.00", 1.6 kg
» 三星Galaxy Book6 系列上手体验:所有型号、价格和上市日期
Asus ExpertBook Ultra B9406CAA: Intel Core Ultra X7 358H, 14.00", 1.1 kg
» Core Ultra X7 358H 与 Core Ultra 7 255H:Panther Lake 节流更少,性能更稳定
» Arc B390 与 Radeon 8060S:相同的 14 英寸屏幕尺寸,两款截然不同的 GPU
Asus ZenBook Duo UX8407AA: Intel Core Ultra X9 388H, 14.00", 1.7 kg
» AMD 毫无胜算:英特尔豹湖酷睿 X9 388H 在低功耗下击败 AMD Strix Halo,预示 2026 年掌上游戏的霸主地位
Asus ExpertBook Ultra B9406CAA: Intel Core Ultra X7 358H, 14.00", 1.1 kg
» 华硕 ExpertBook Ultra 的速度与许多入门级游戏笔记本电脑不相上下,体积却只有它们的一半
» Comparison of GPUs
Detailed list of all laptop GPUs sorted by class and performance.
» Benchmark List
Sort and restrict laptop GPUs based on performance in synthetic benchmarks.
» Notebook Gaming List
Playable games for each graphics card and their average FPS results.
* Approximate position of the graphics adapter
» Notebookcheck多媒体笔记本电脑Top 10排名
» Notebookcheck游戏笔记本电脑Top 10排名
» Notebookcheck低价办公/商务笔记本电脑Top 10排名
» Notebookcheck高端办公/商务笔记本电脑Top 10排名
» Notebookcheck工作站笔记本电脑Top 10排名
» Notebookcheck亚笔记本电脑Top 10排名
» Notebookcheck超级本产品Top 10排名
» Notebookcheck变形本产品Top 10排名
» Notebookcheck平板电脑Top 10排名
» Notebookcheck智能手机Top 10排名
» Notebookcheck评测过最出色的笔记本电脑屏幕
» Notebookcheck售价500欧元以下笔记本电脑Top 10排名
» Notebookcheck售价300欧元以下笔记本电脑Top 10排名