松下Toughbook 40笔记本电脑回顾。高度的适应性和模块化
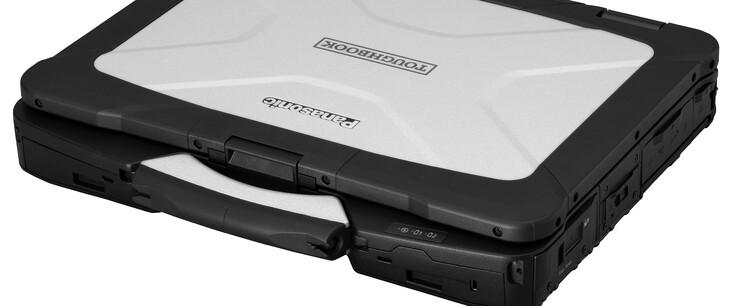
不要与较小的14英寸Toughbook 55混淆,14英寸Toughbook 40是一款完全坚固的笔记本电脑,其设计能够支持多达四个模块化xPAK扩展卡,以适应用户的需求。这些可选的卡有助于将Toughbook 40与竞争机型区分开来,如 Getac S410, DellLatitude 7400 Rugged系列,或 笔记本S14I.
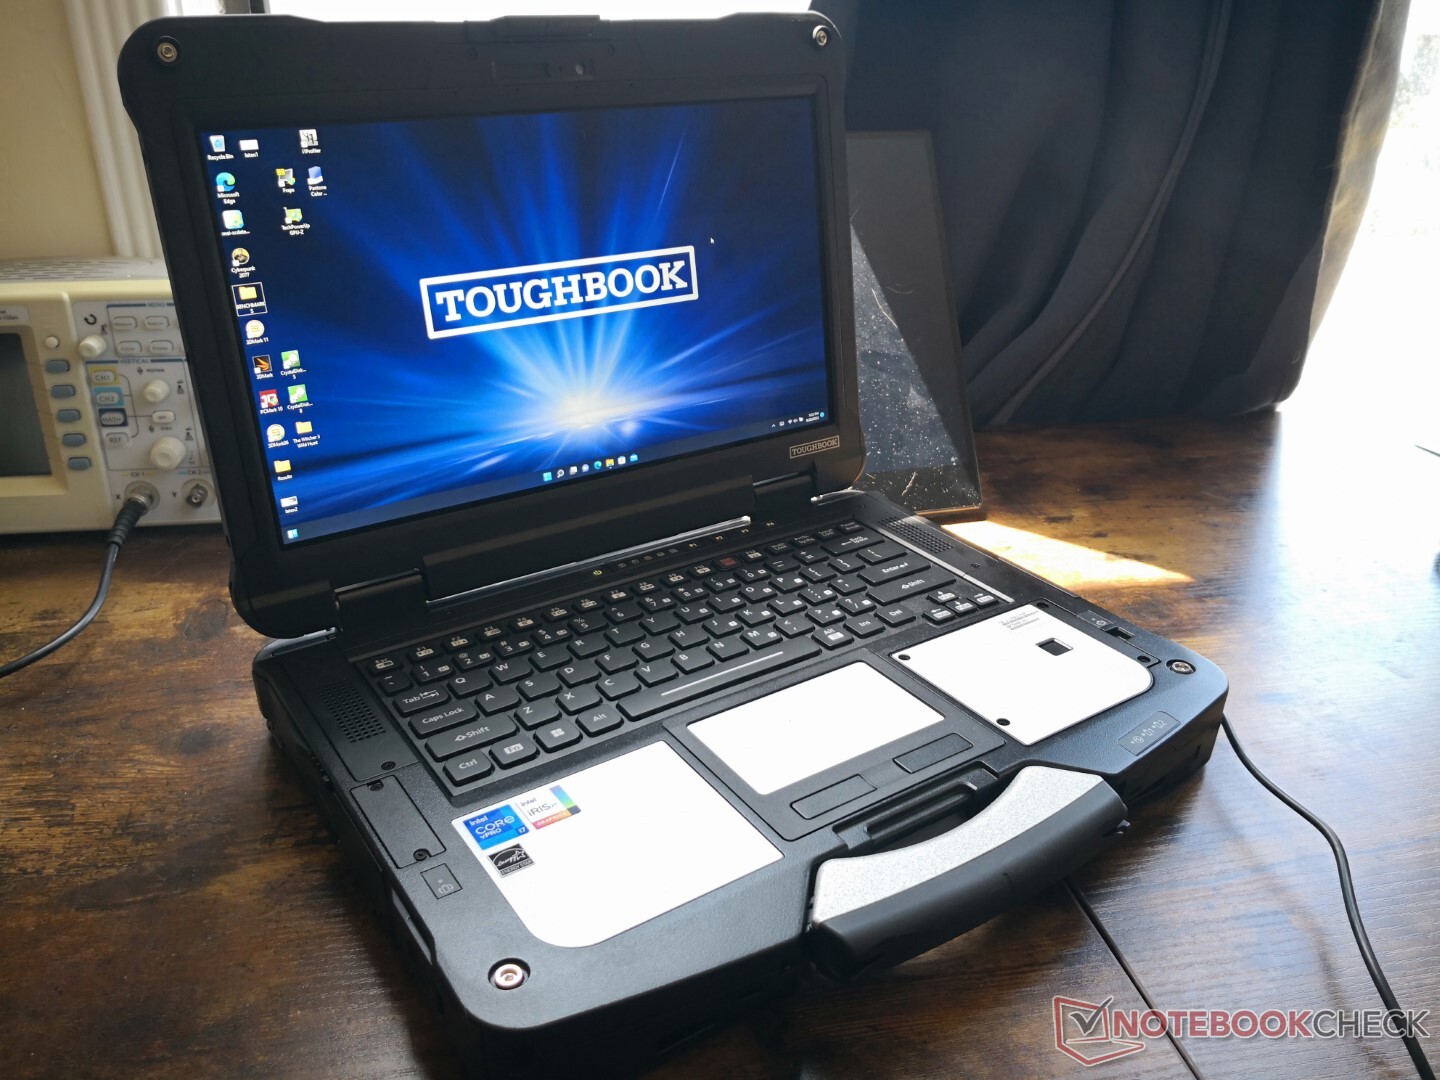
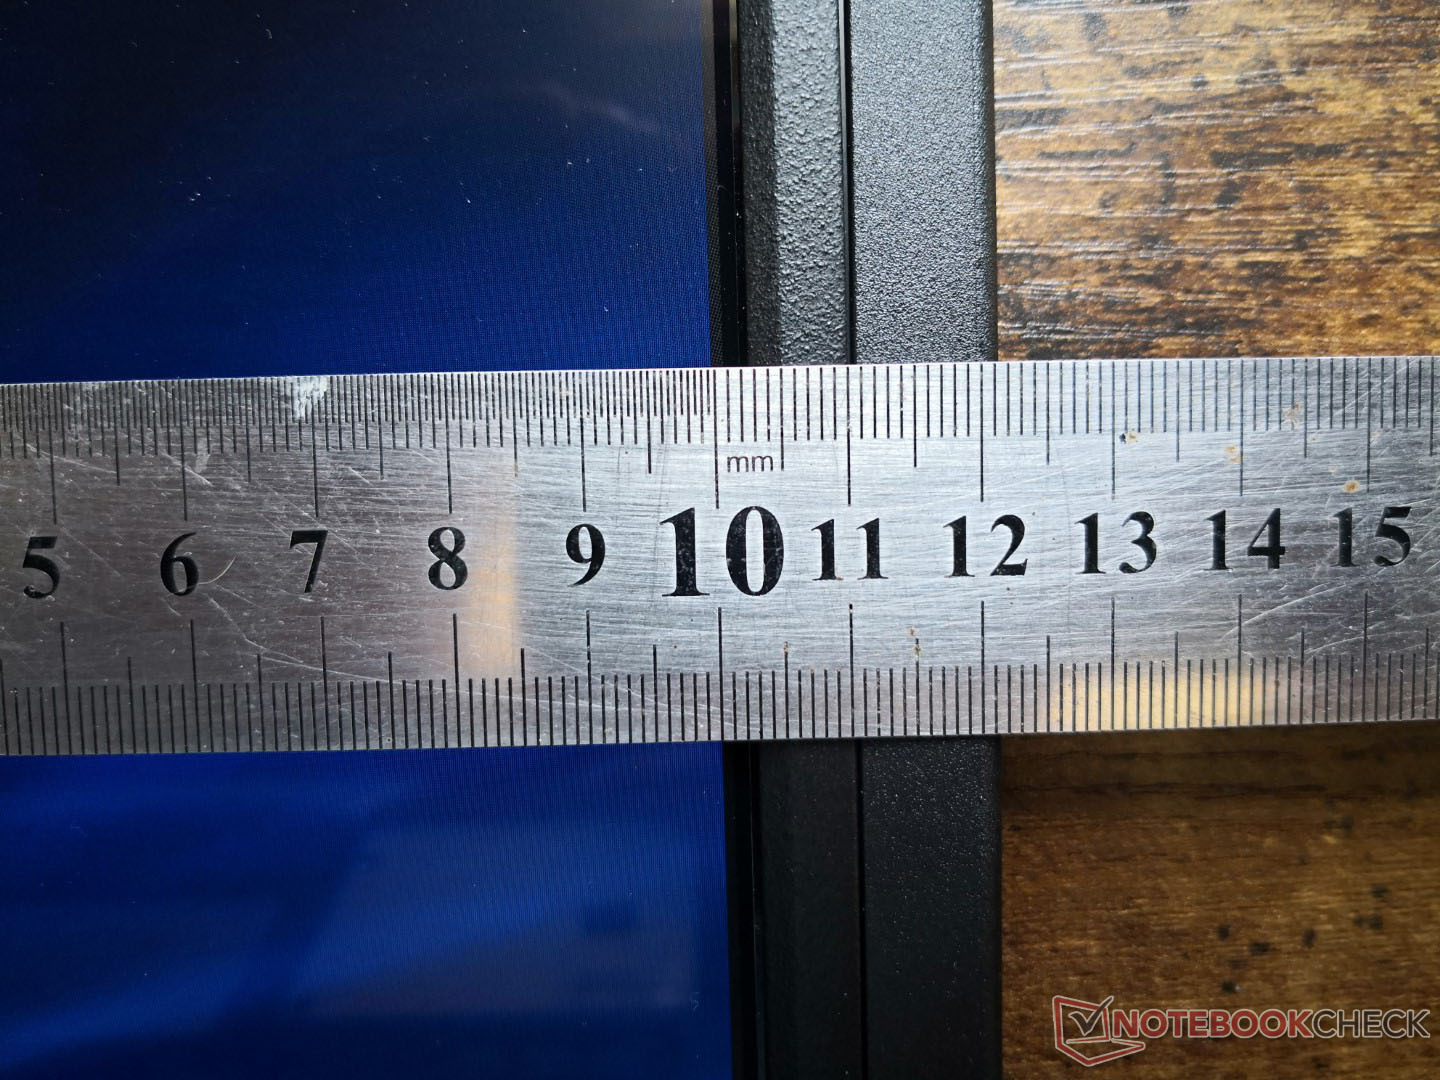
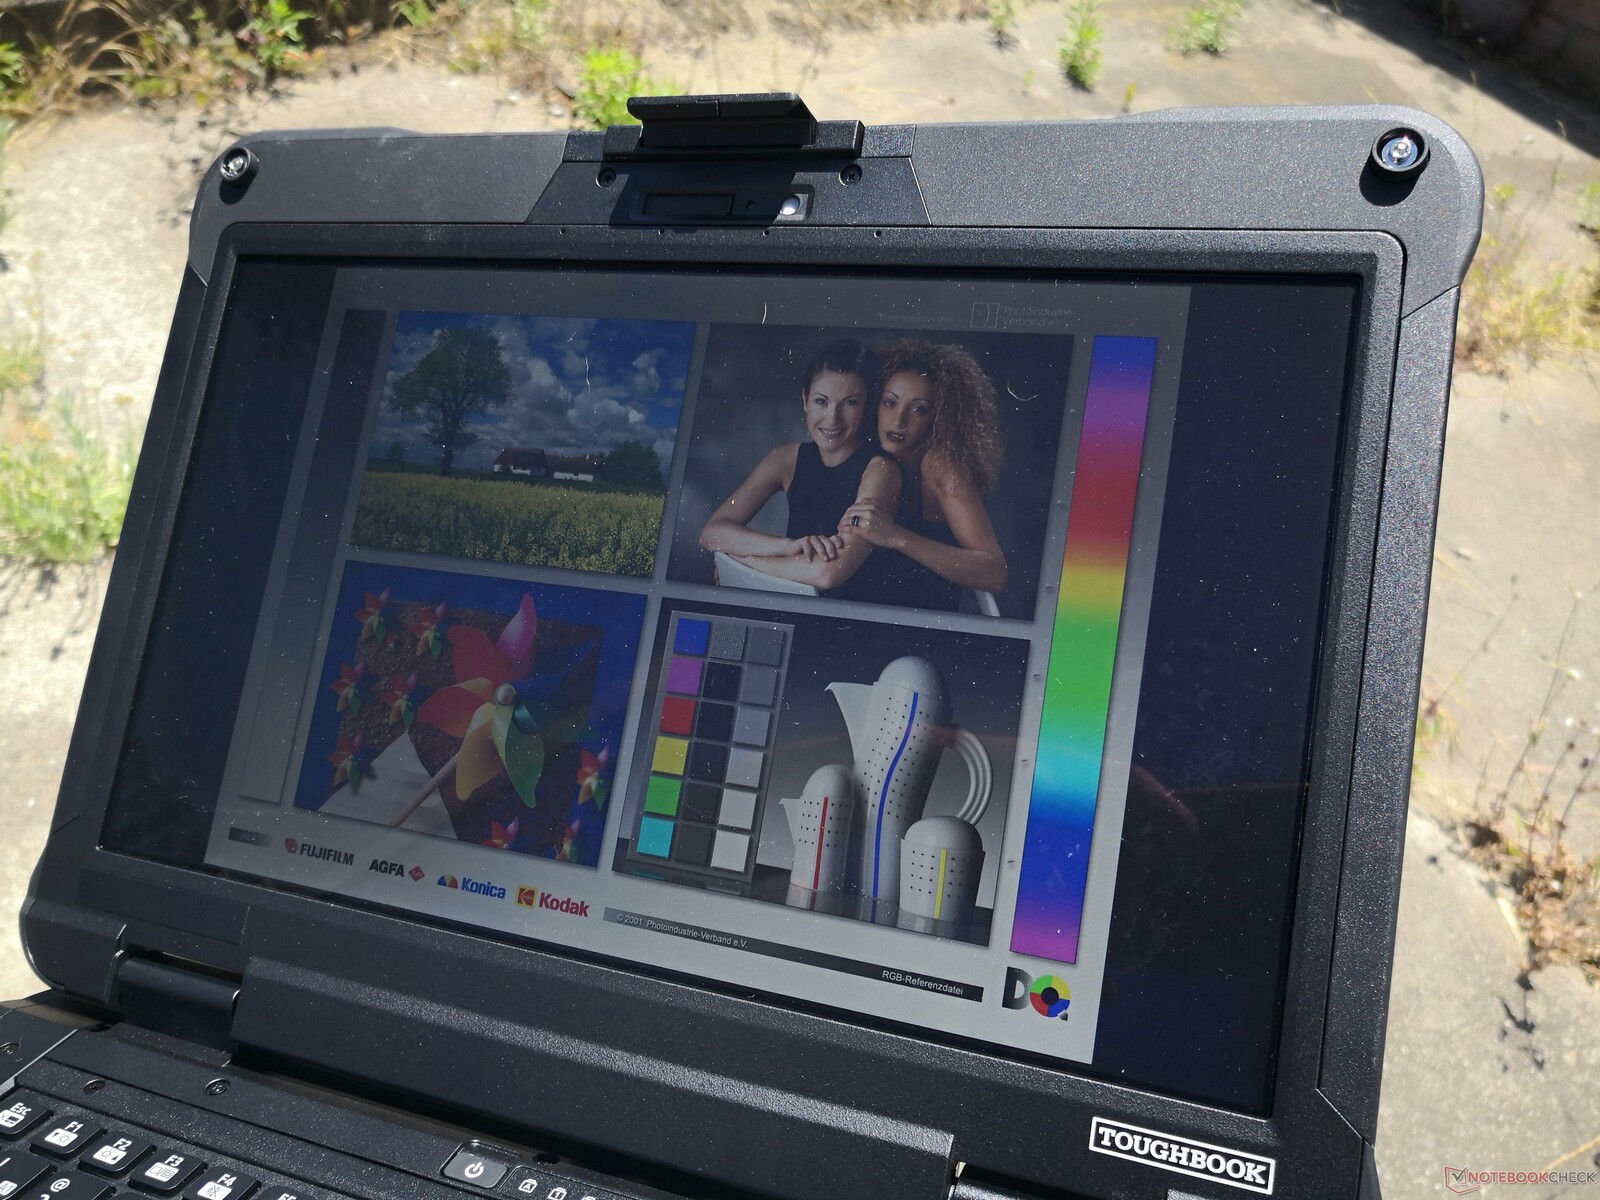
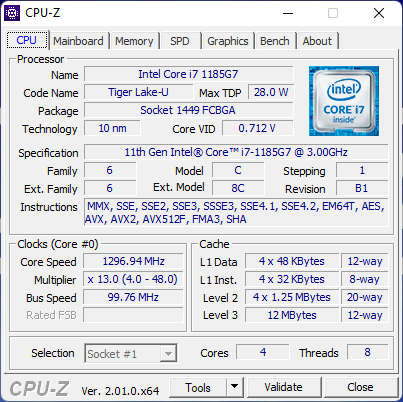
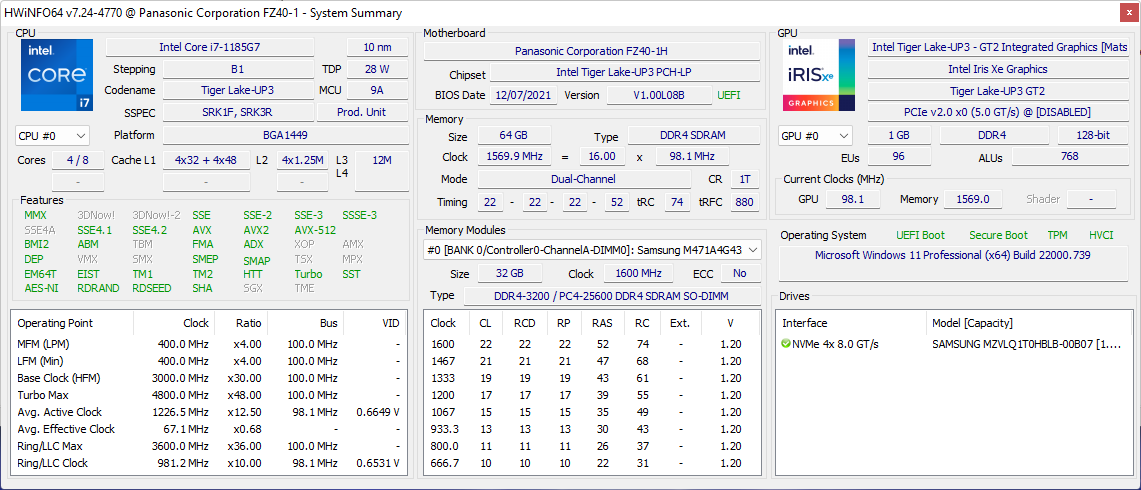
在内部,我们的测试设备配备了第11代Tiger Lake-U Core i7-1185G7 CPU,64GB内存,以及超亮的1080p IPS显示屏。其他配置可以在官方产品页面上找到这里.
更多松下的评论。
- 松下FZ-55 MK2
- 松下FZ-G2
- 松下FZ-S1
- 松下FZ-A3
潜在的竞争对手比较
Rating | Date | Model | Weight | Height | Size | Resolution | Price |
|---|---|---|---|---|---|---|---|
v (old) | 07 / 2022 | Panasonic Toughbook 40 i7-1185G7, Iris Xe G7 96EUs | 3.9 kg | 53.4 mm | 14.00" | 1920x1080 | |
| 83.9 % v7 (old) | 10 / 2021 | Panasonic Toughbook FZ-55 MK2 i7-1185G7, Iris Xe G7 96EUs | 2.3 kg | 33 mm | 14.00" | 1920x1080 | |
| 81.7 % v7 (old) | 05 / 2022 | Getac S410 Gen 4 i7-1185G7, Iris Xe G7 96EUs | 3.2 kg | 34.9 mm | 14.00" | 1920x1080 | |
| 89.2 % v6 (old) | Dell Latitude 5420 Rugged-P85G i7-8650U, Radeon RX 540 | 2.8 kg | 32.9 mm | 14.00" | 1920x1080 | ||
| 82.4 % v7 (old) | 12 / 2021 | Acer Enduro Urban N3 EUN314 i7-1165G7, Iris Xe G7 96EUs | 1.8 kg | 21.95 mm | 14.00" | 1920x1080 | |
v (old) | 09 / 2021 | Durabook S14I i7-1165G7, Iris Xe G7 96EUs | 3 kg | 38.1 mm | 14.00" | 1920x1080 |
案例
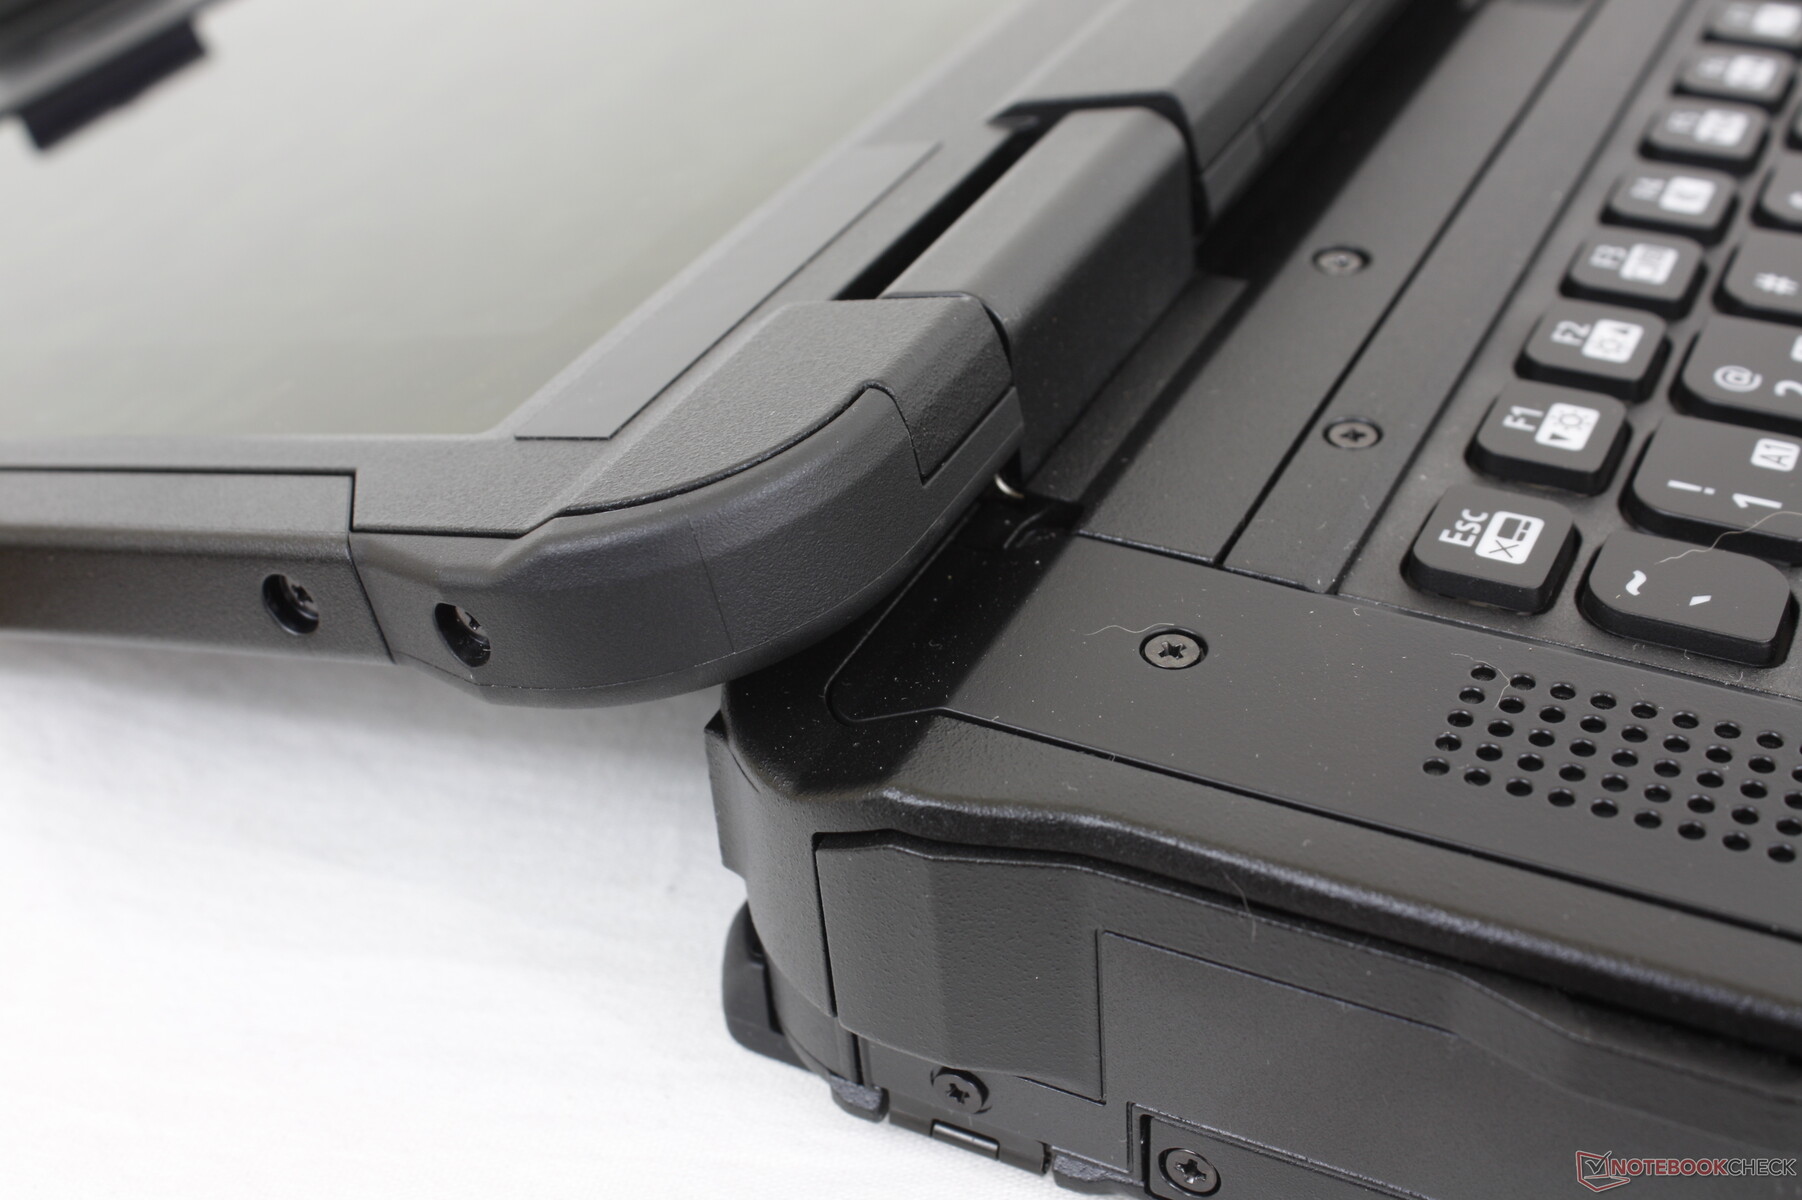
由于是全加固设计,该机型又大又重。例如,半坚固型Durabook S14I提供相同的屏幕尺寸,但它几乎轻了1公斤,同时在所有三个尺寸上都更小。
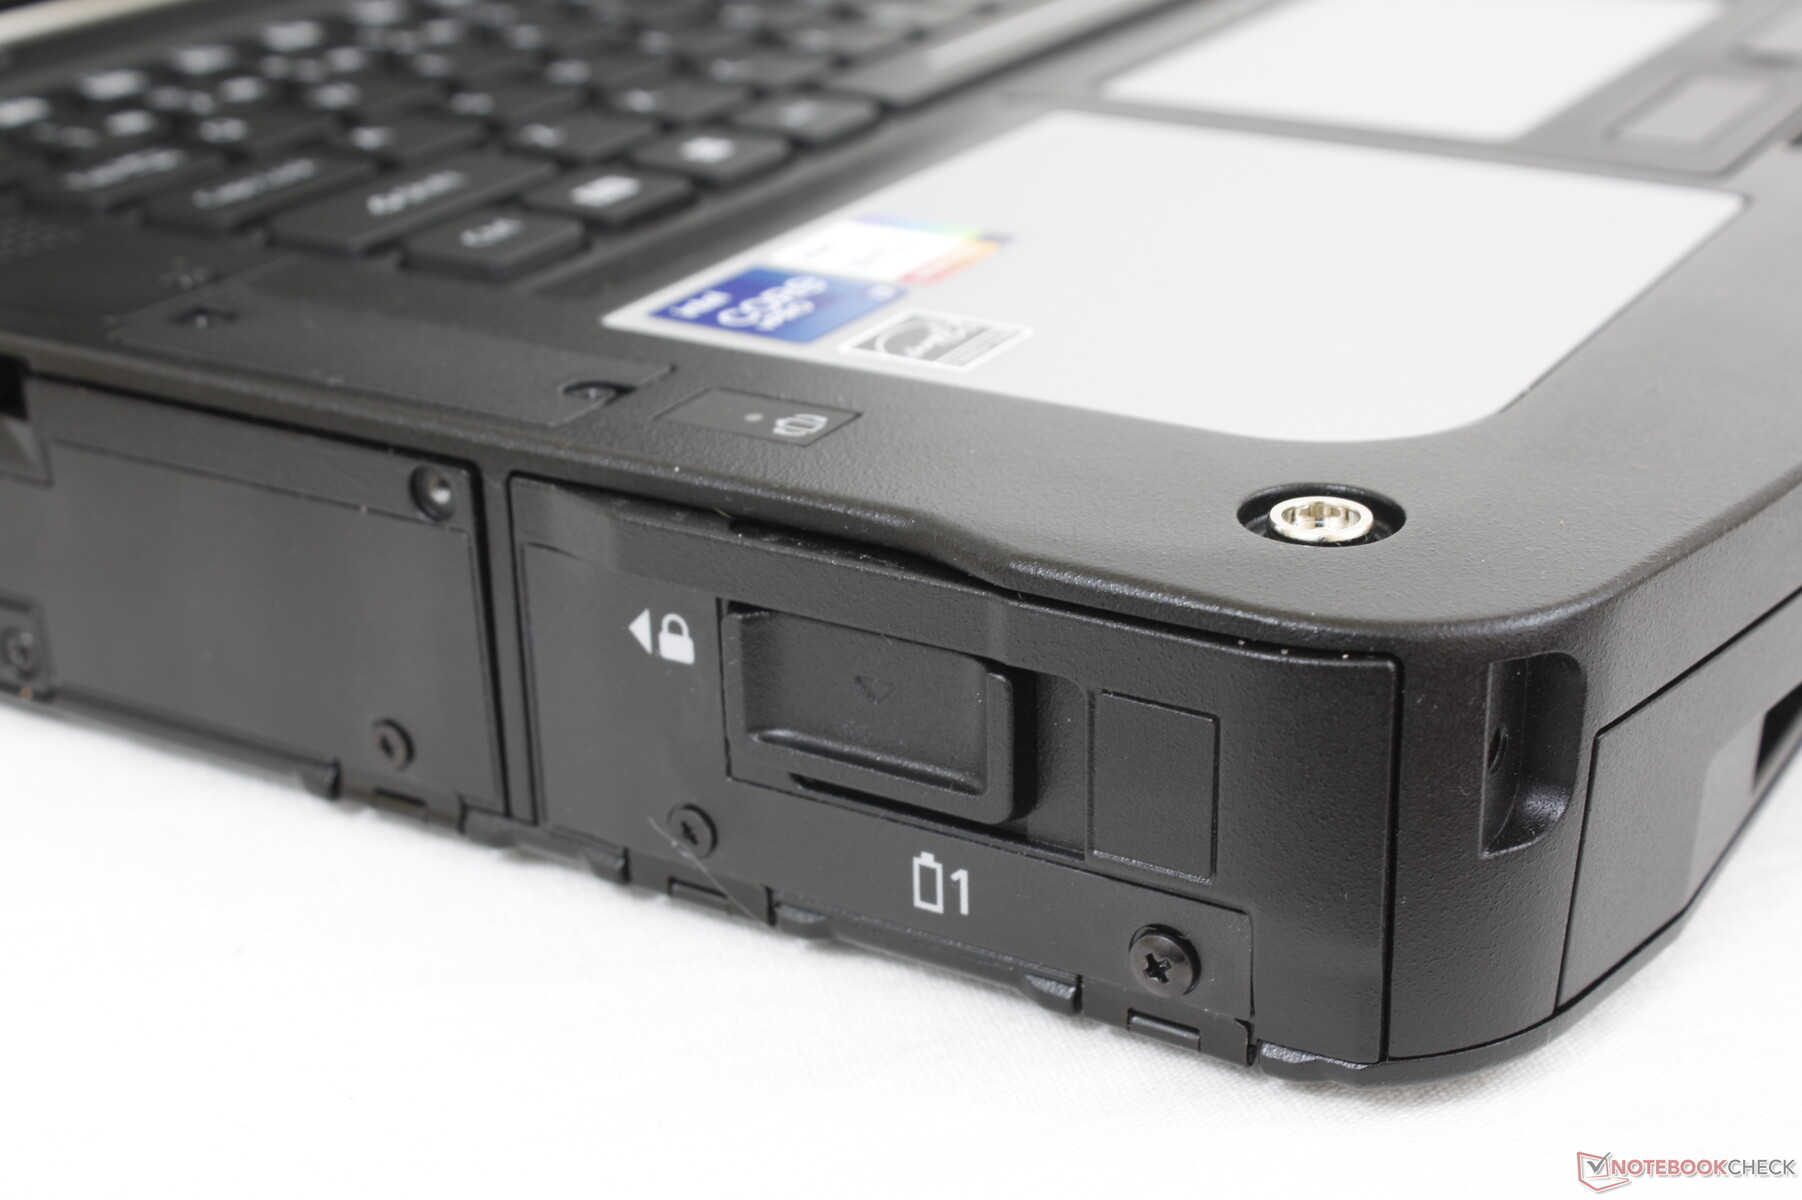
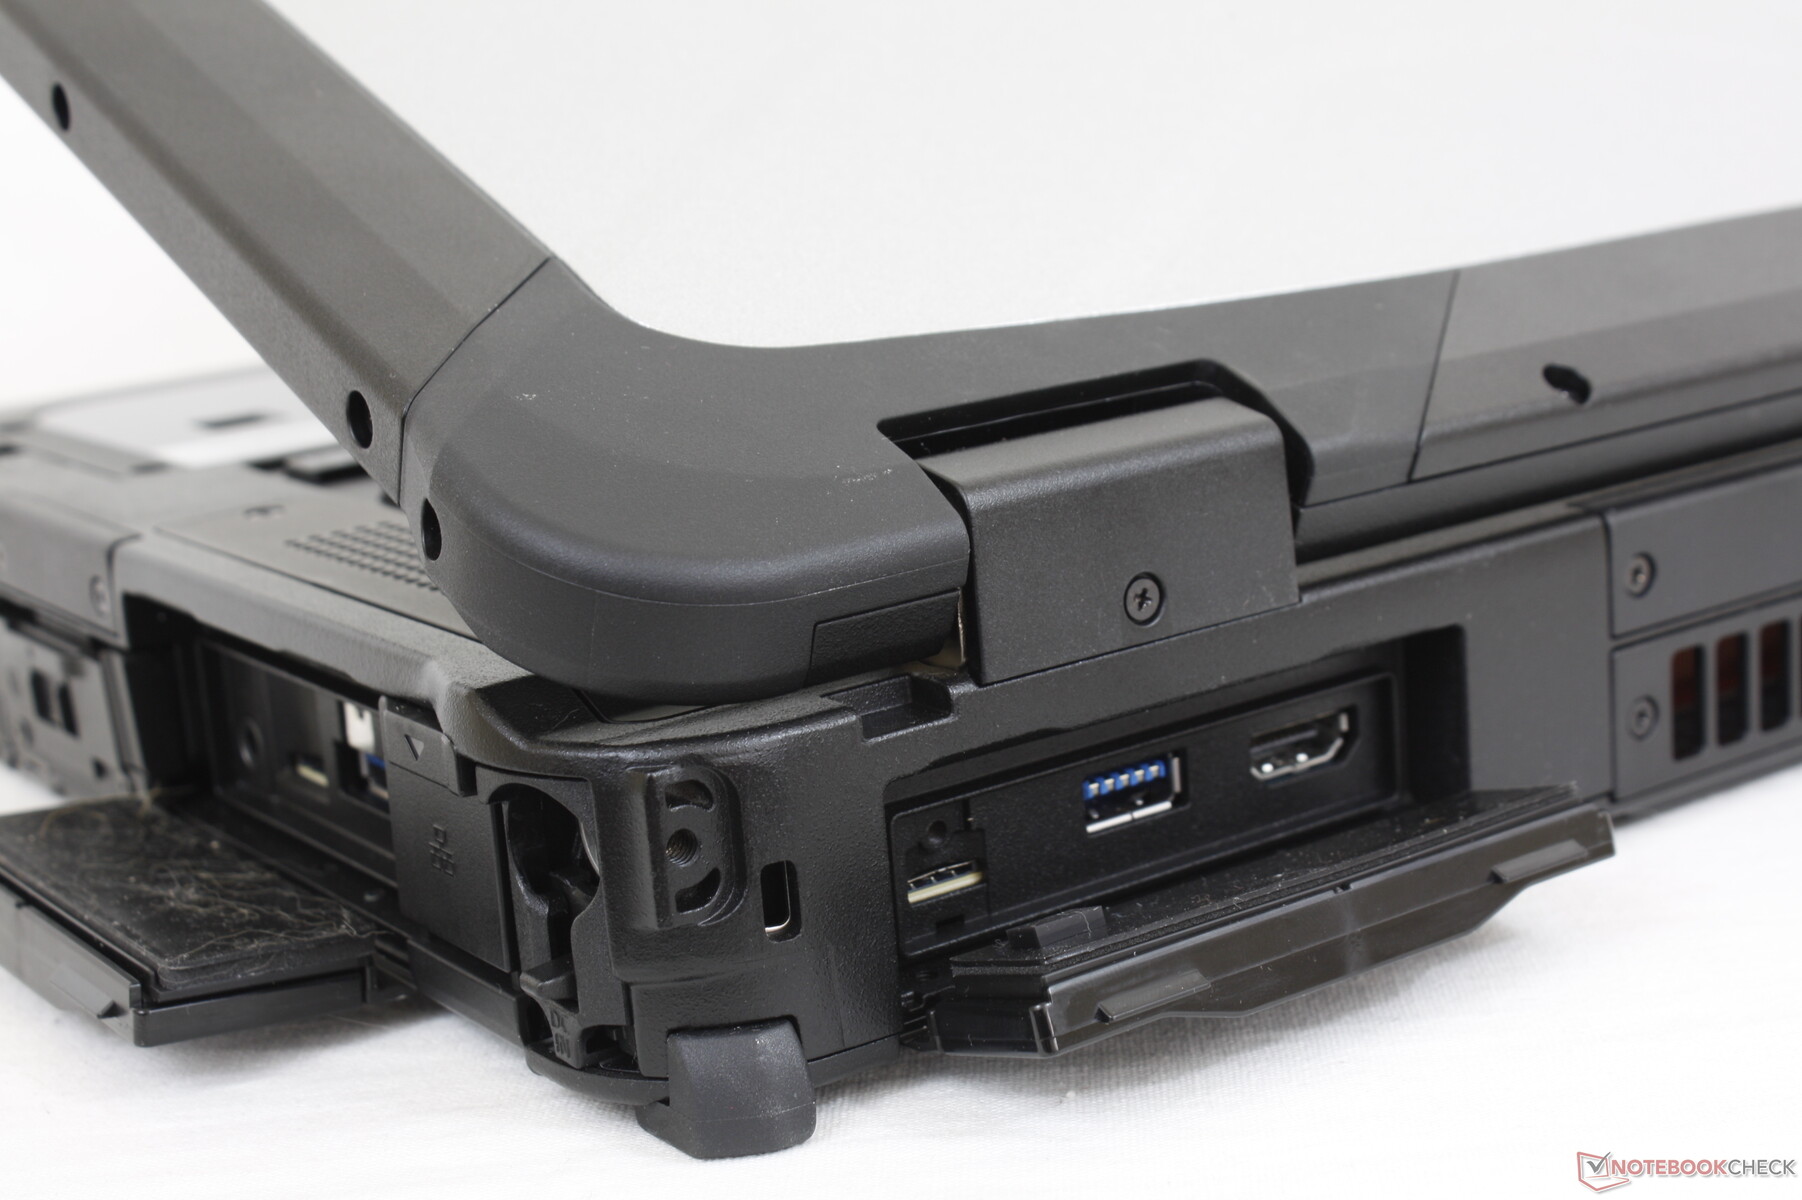
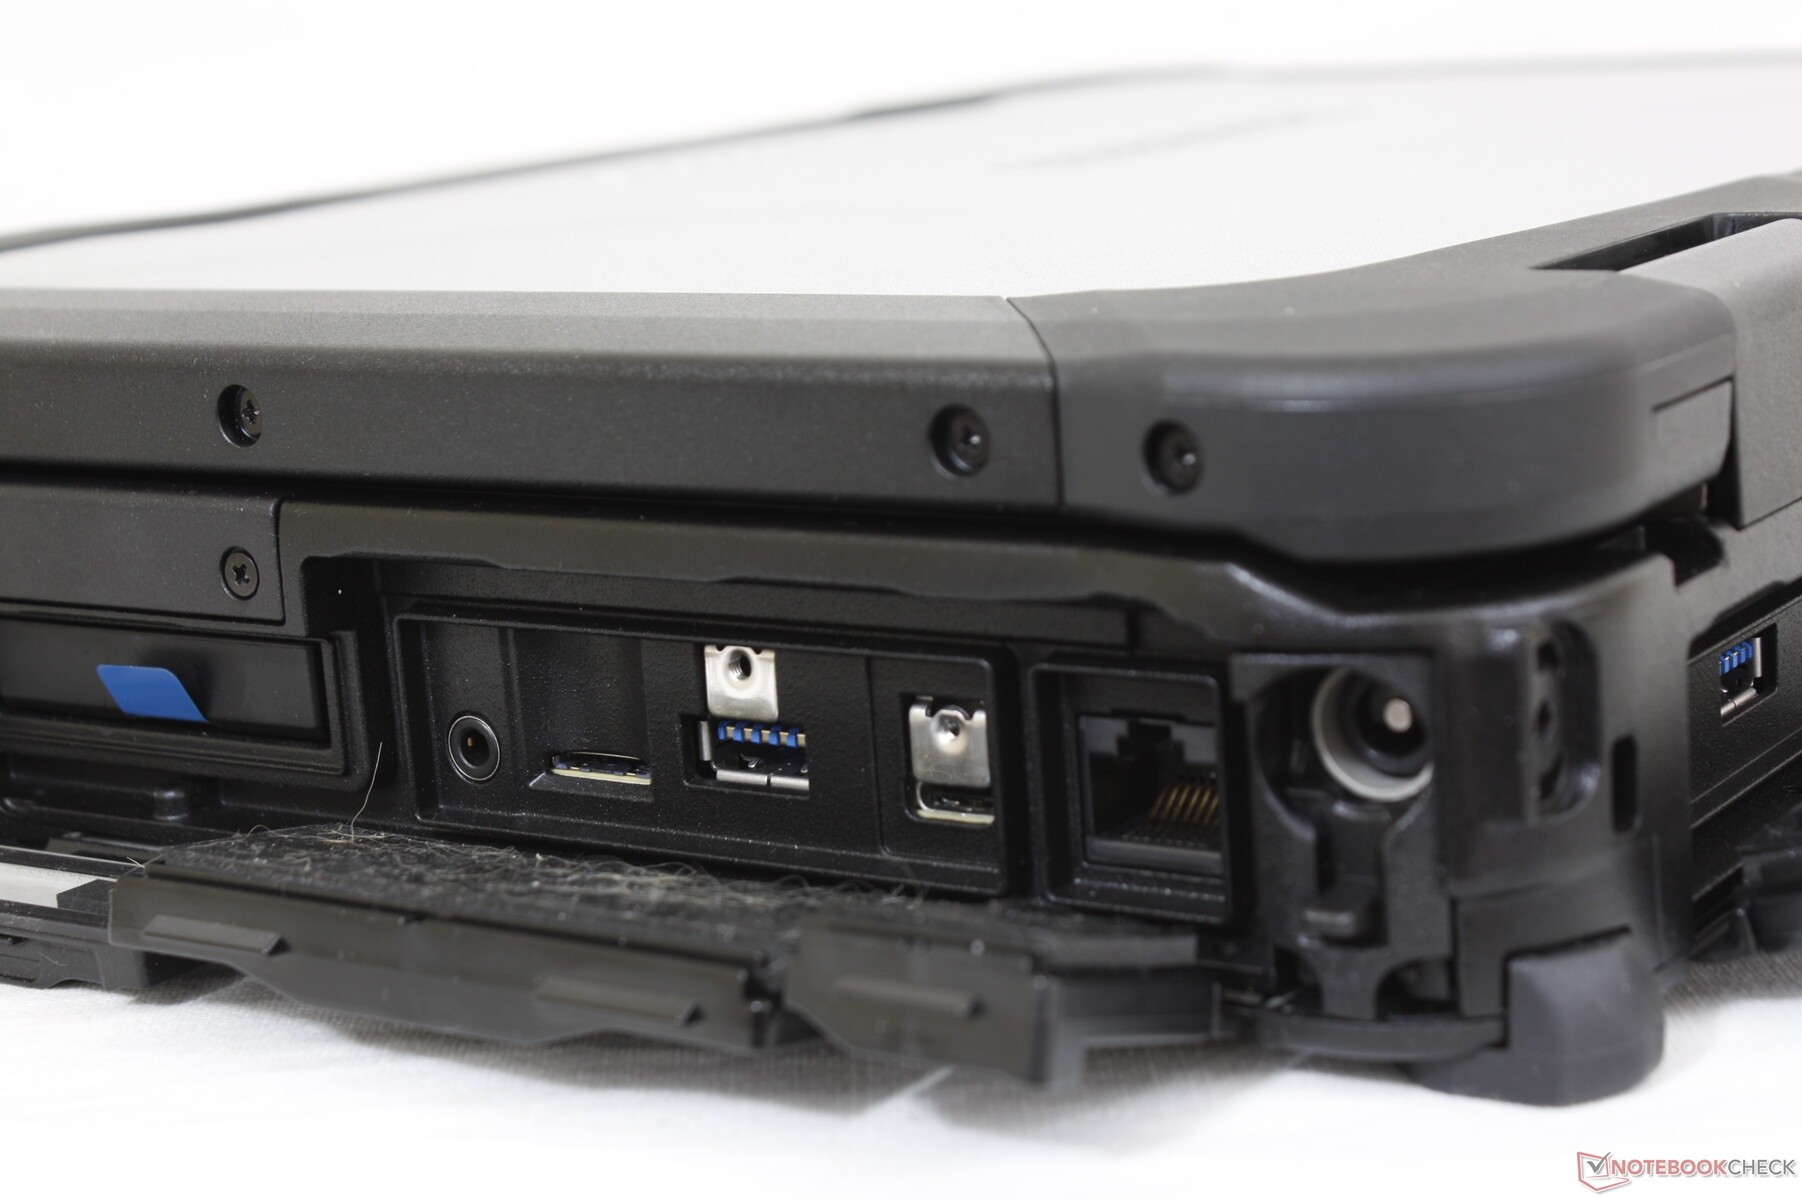
连接性和xPAK扩展
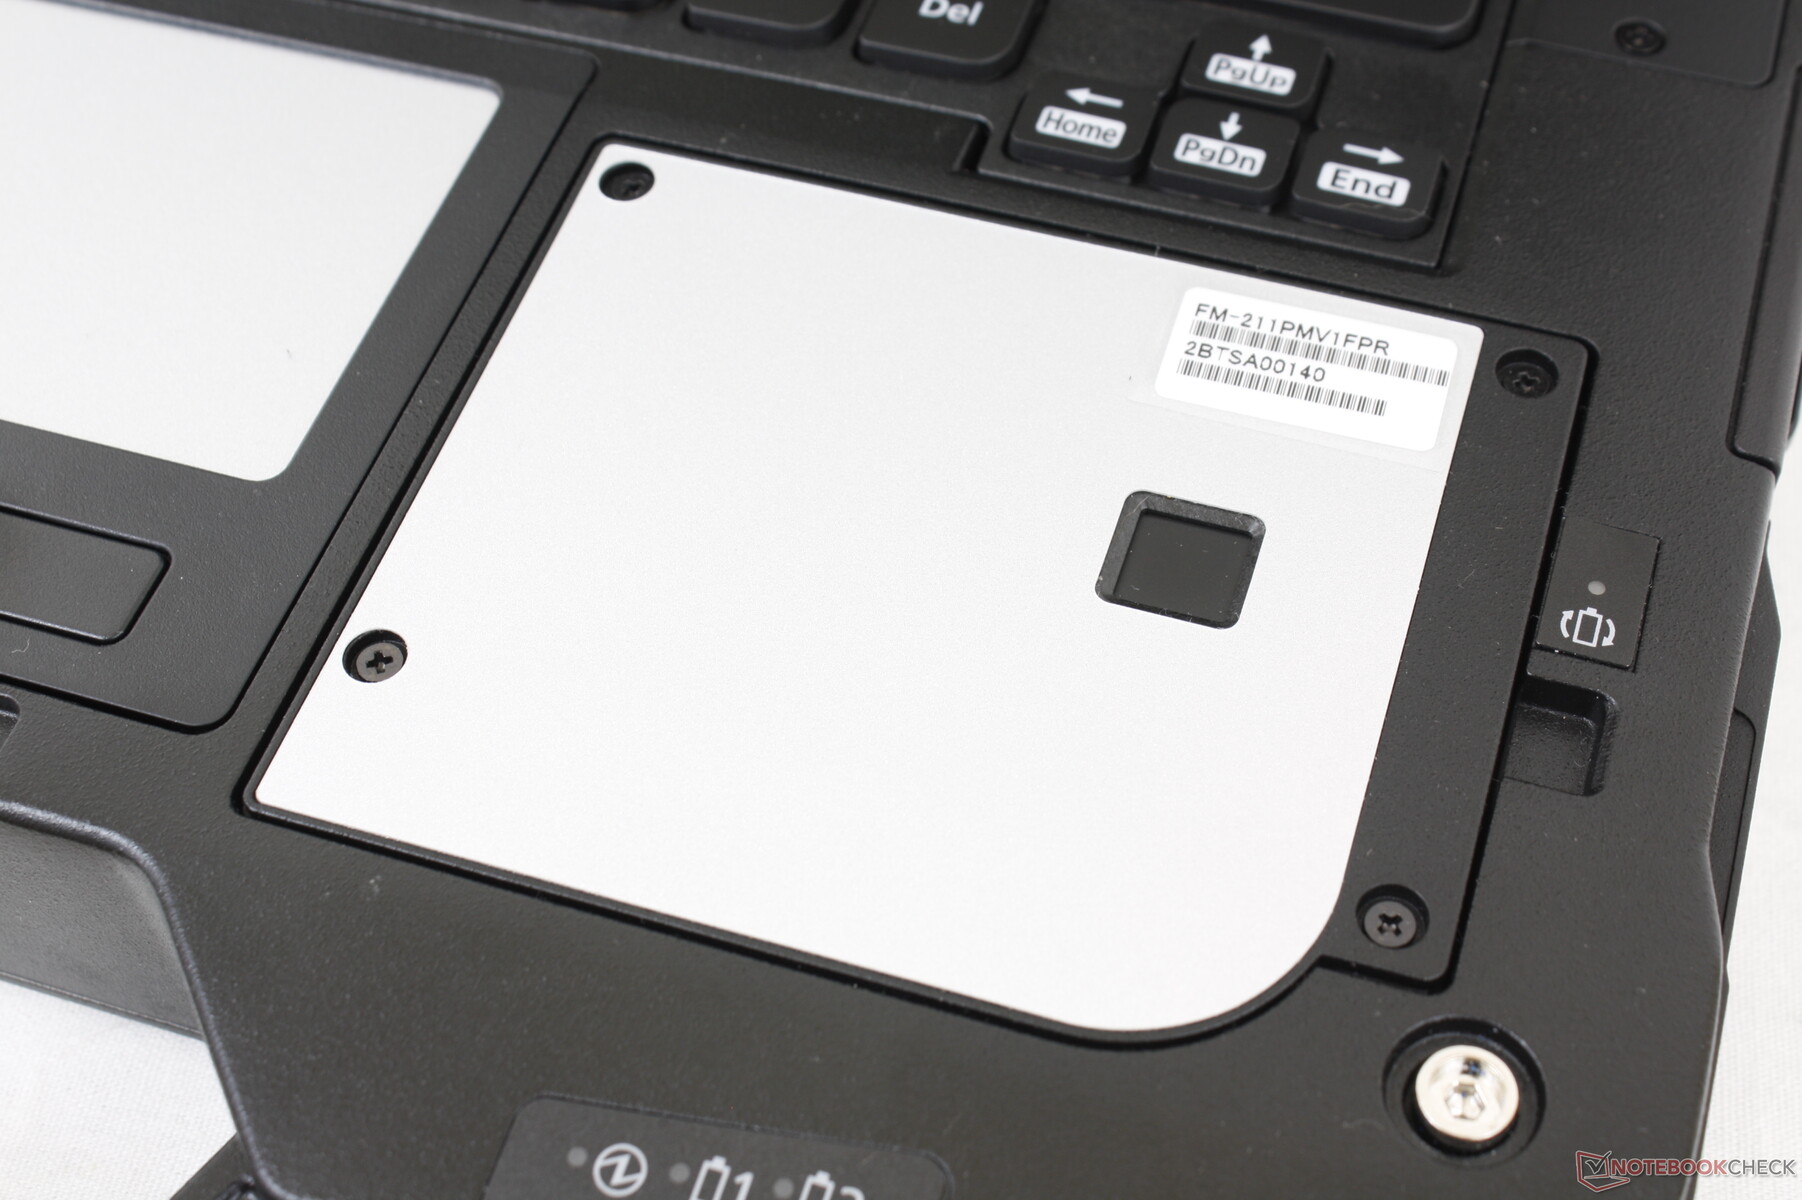
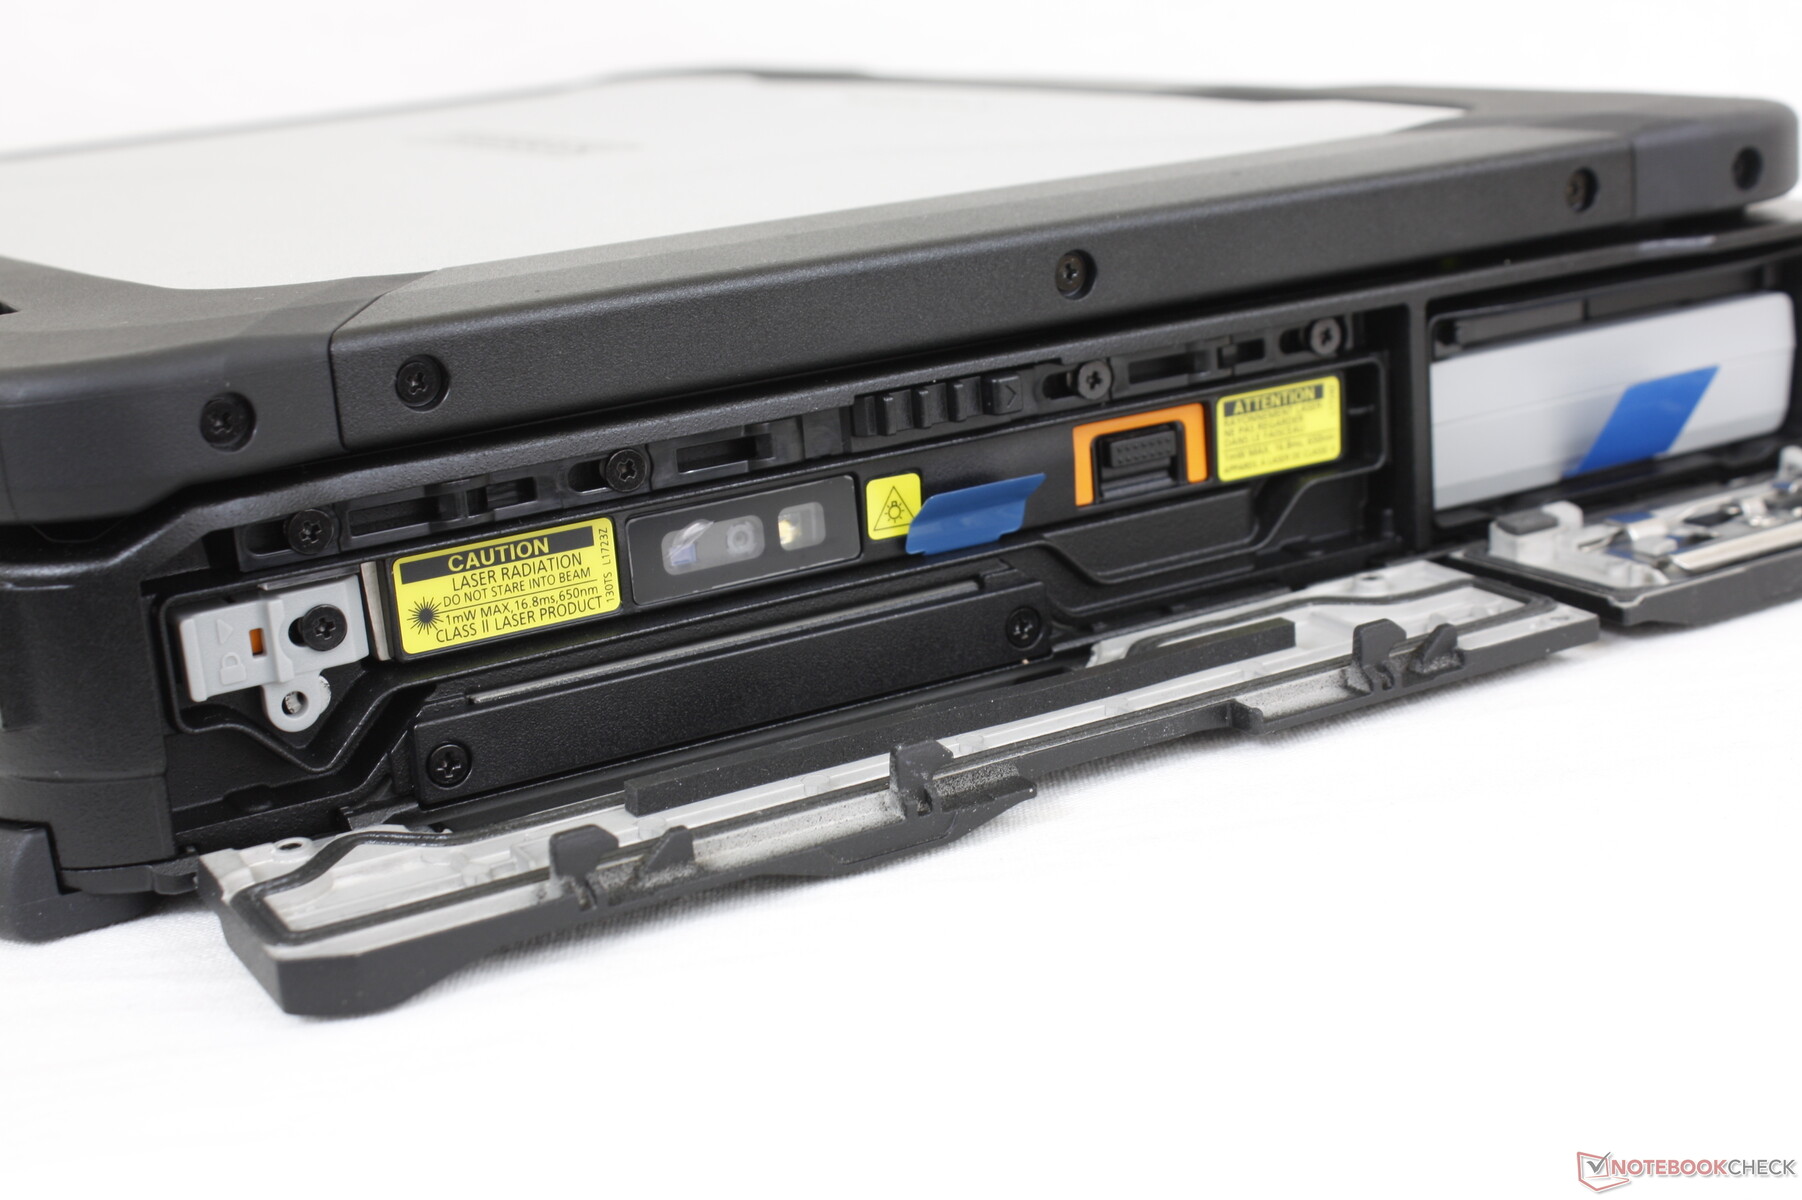
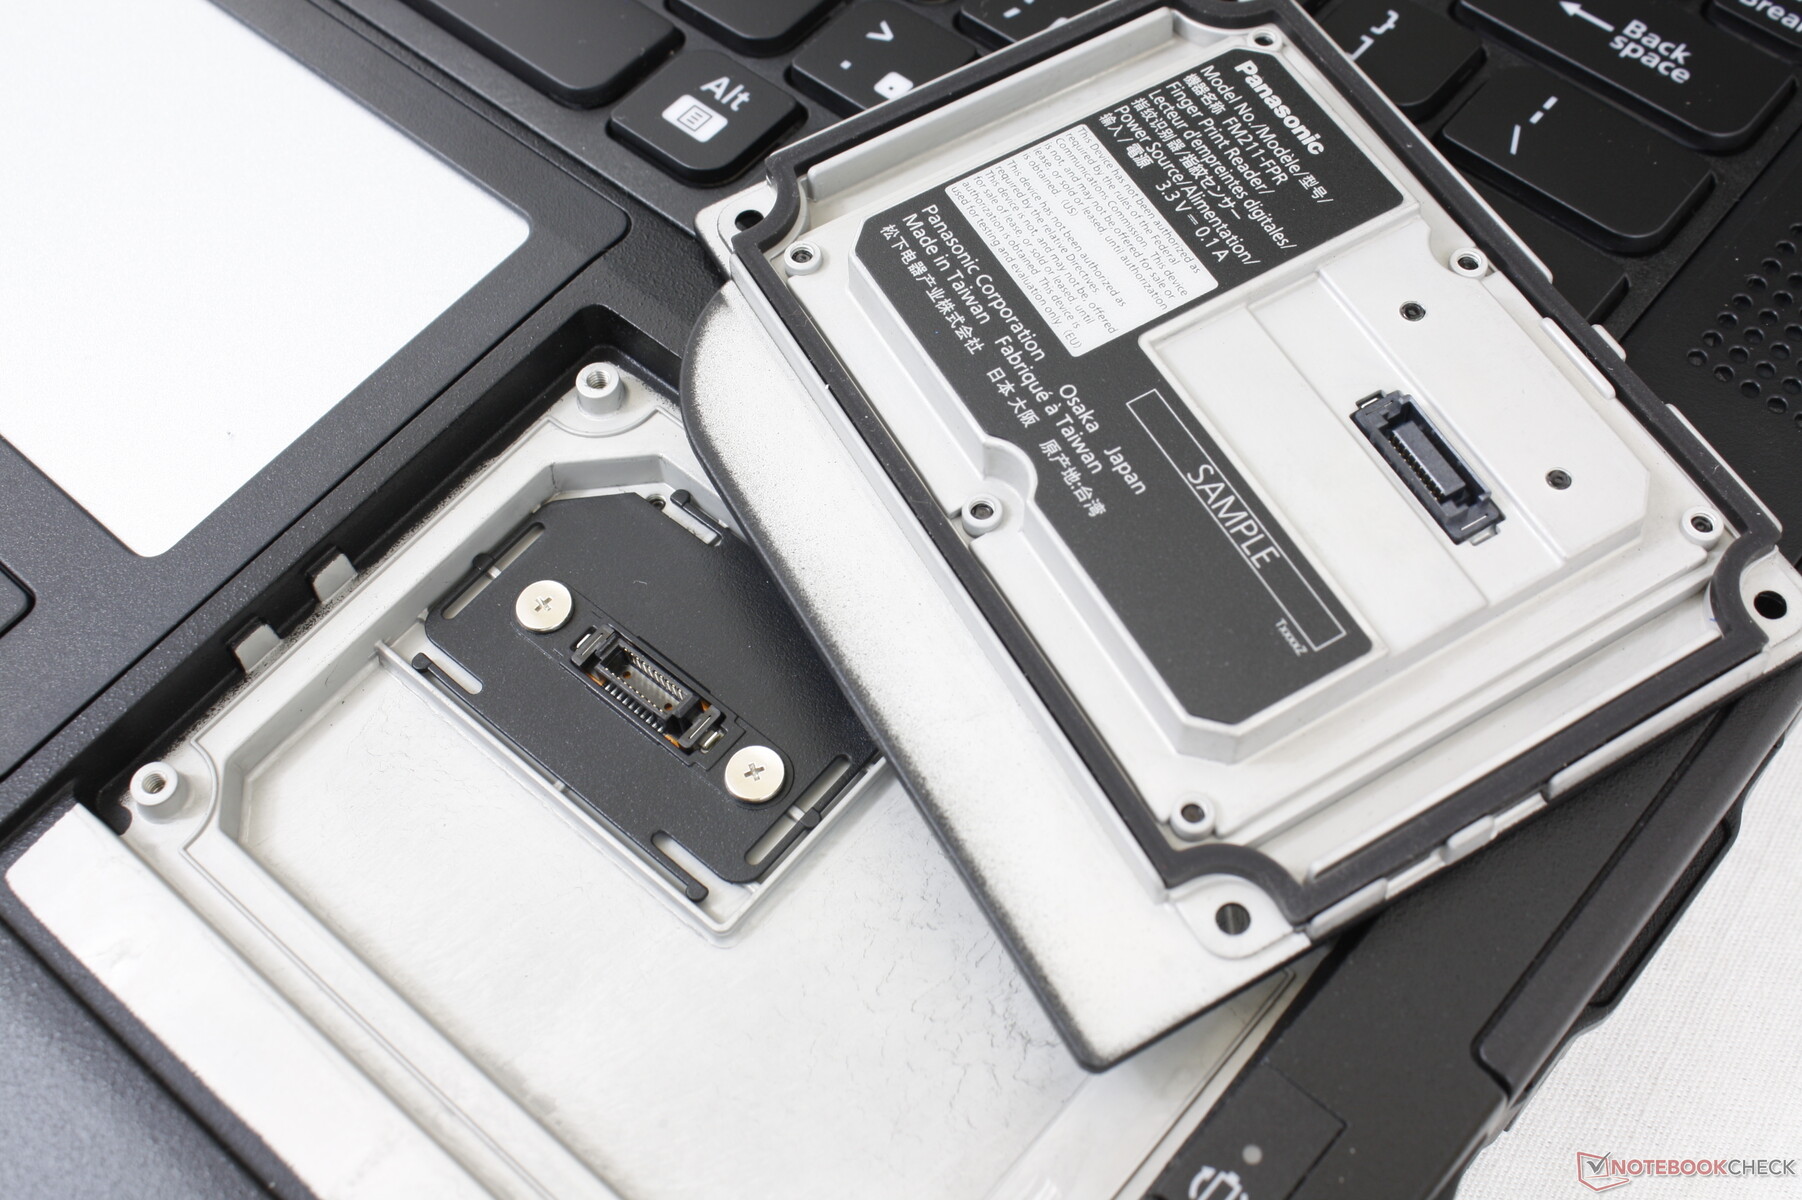
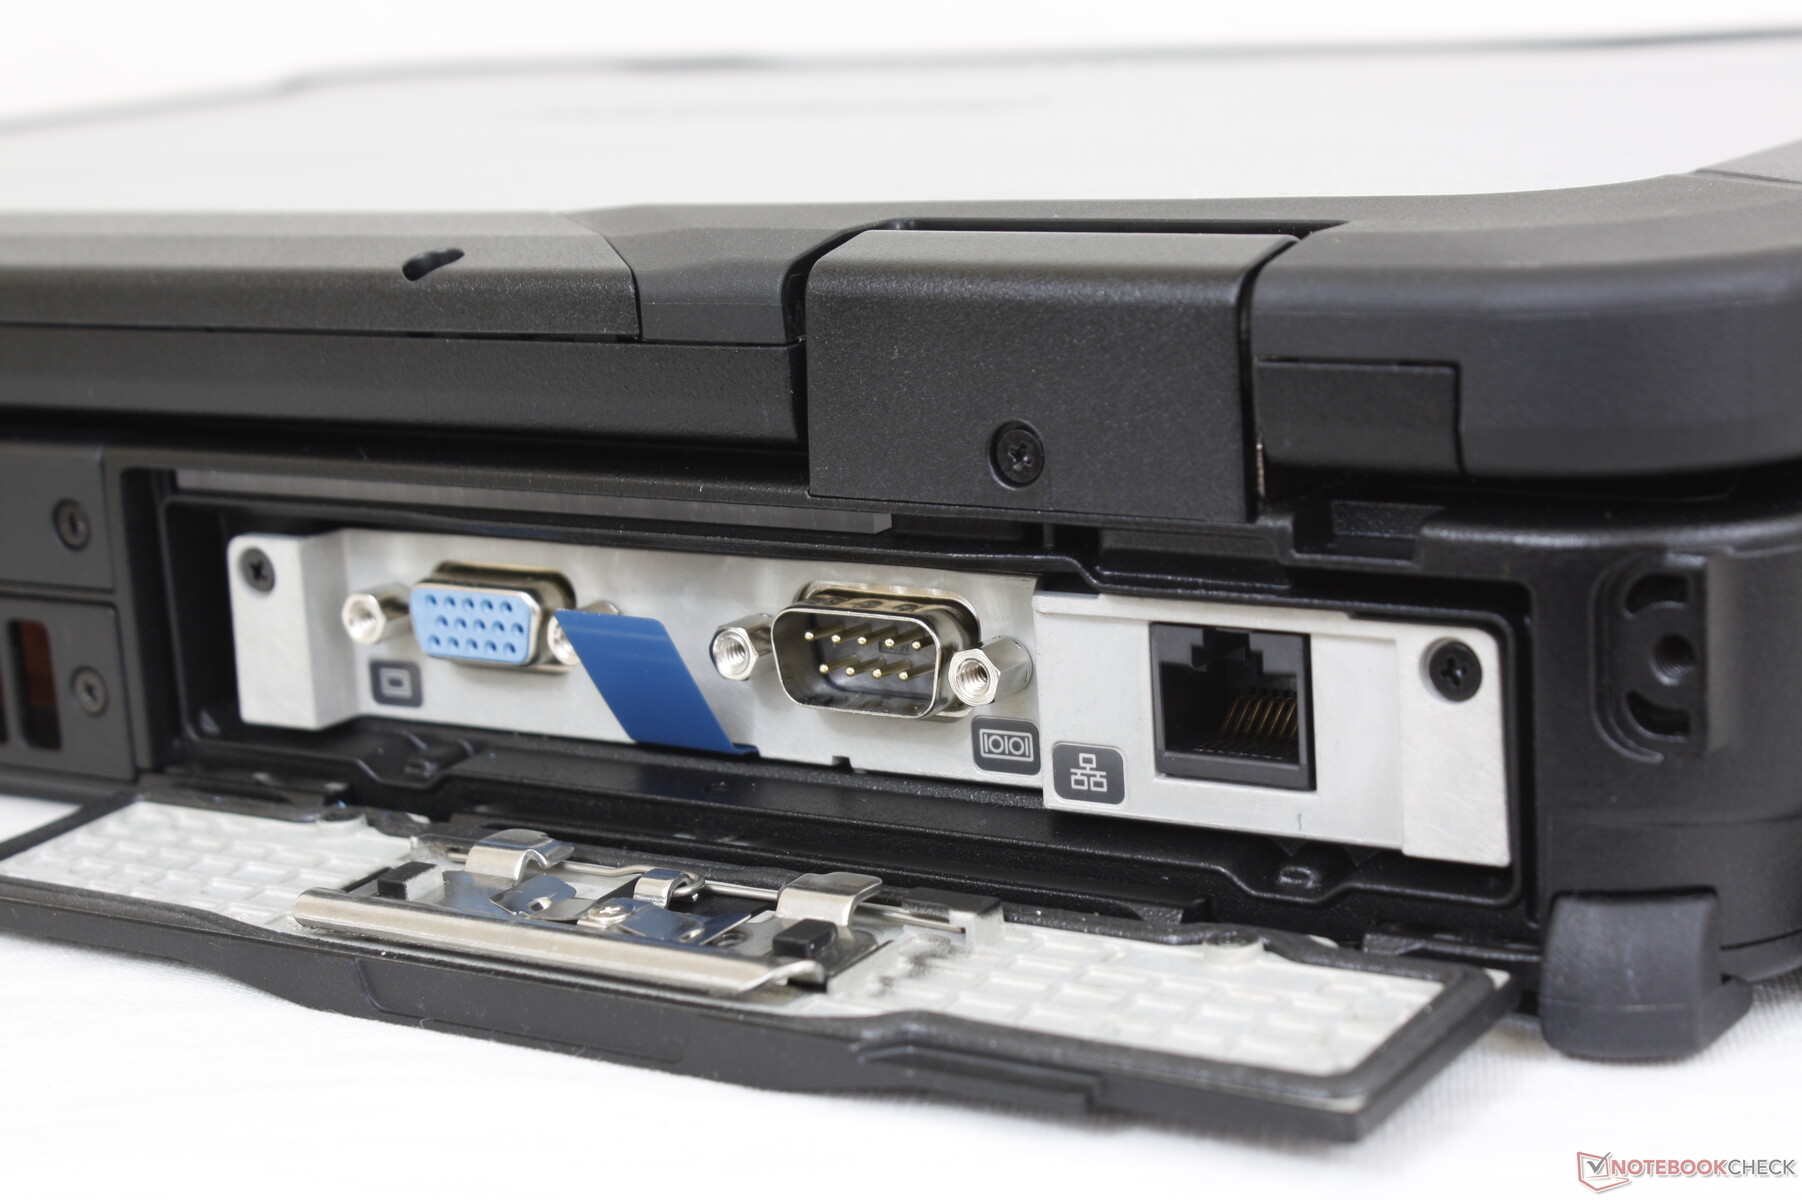
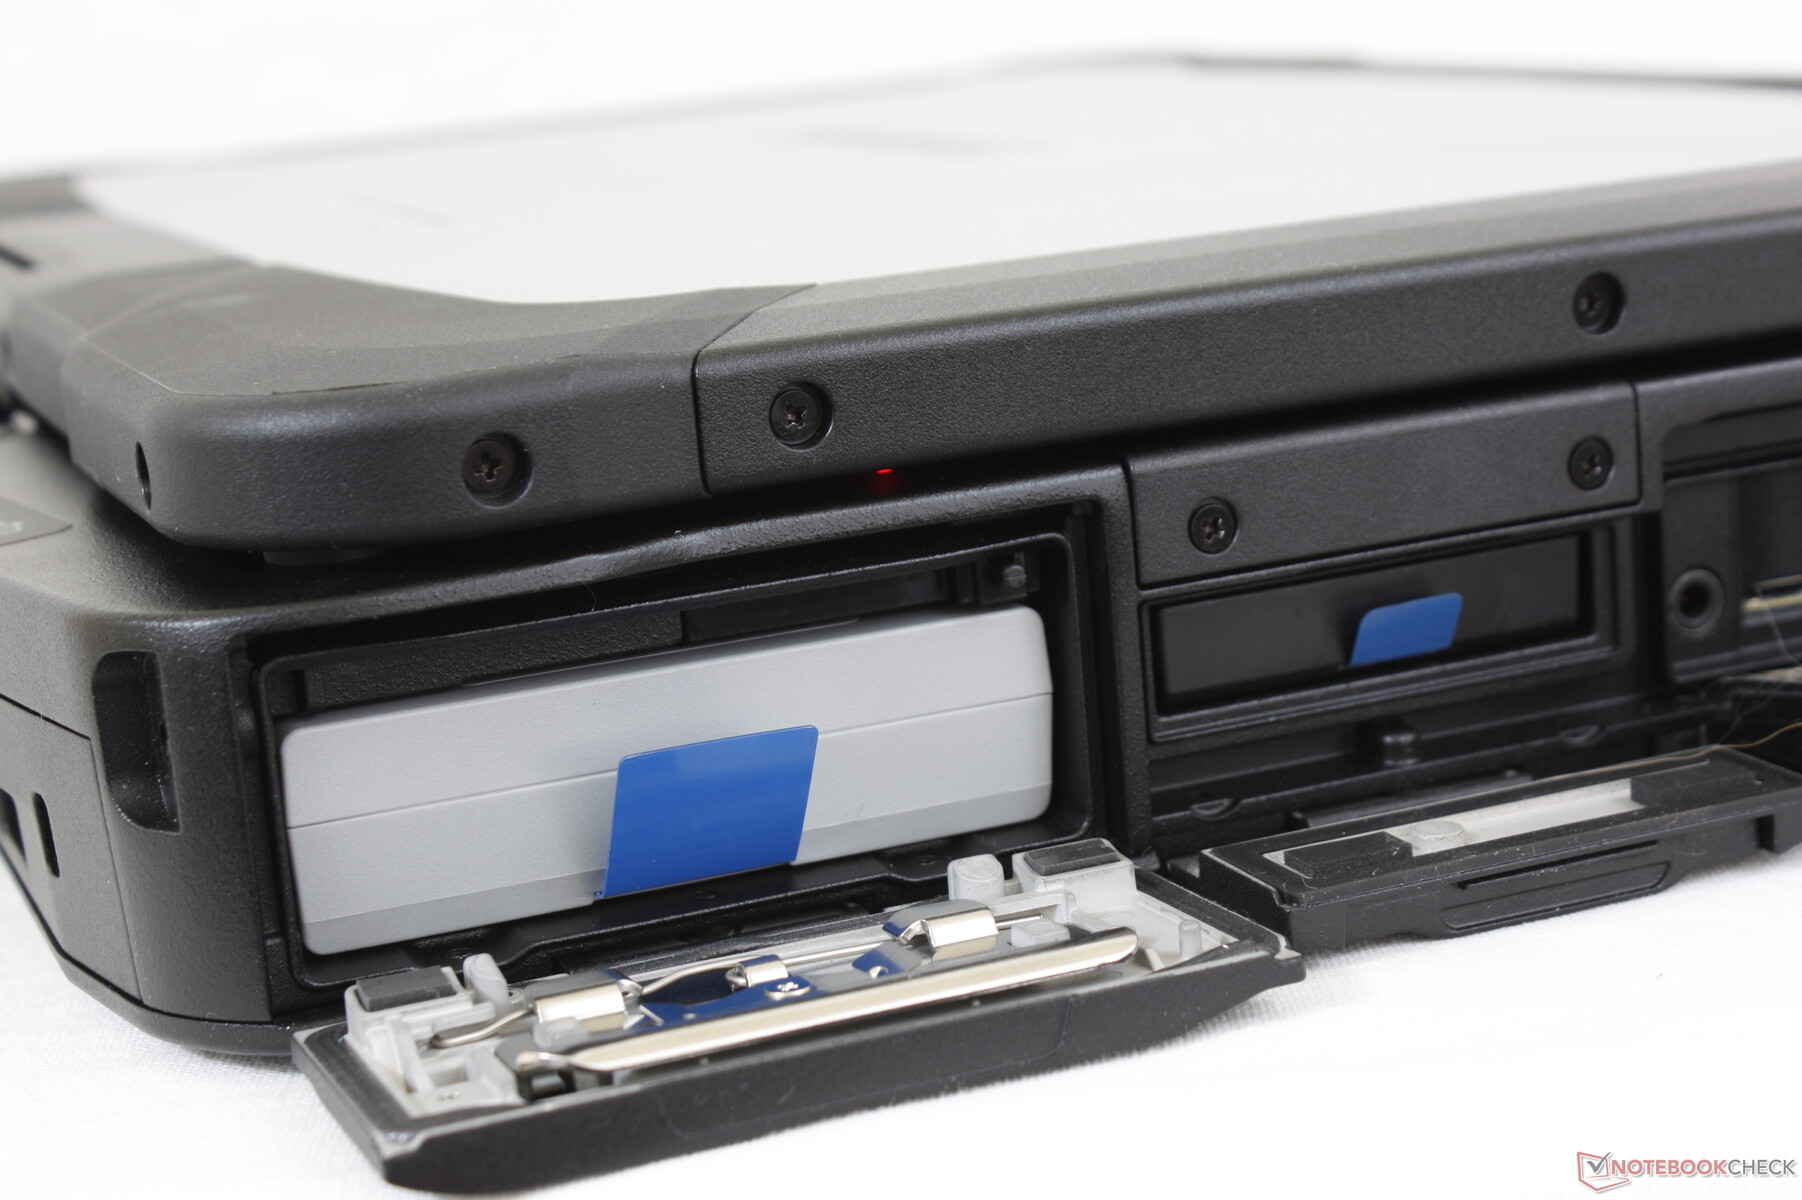
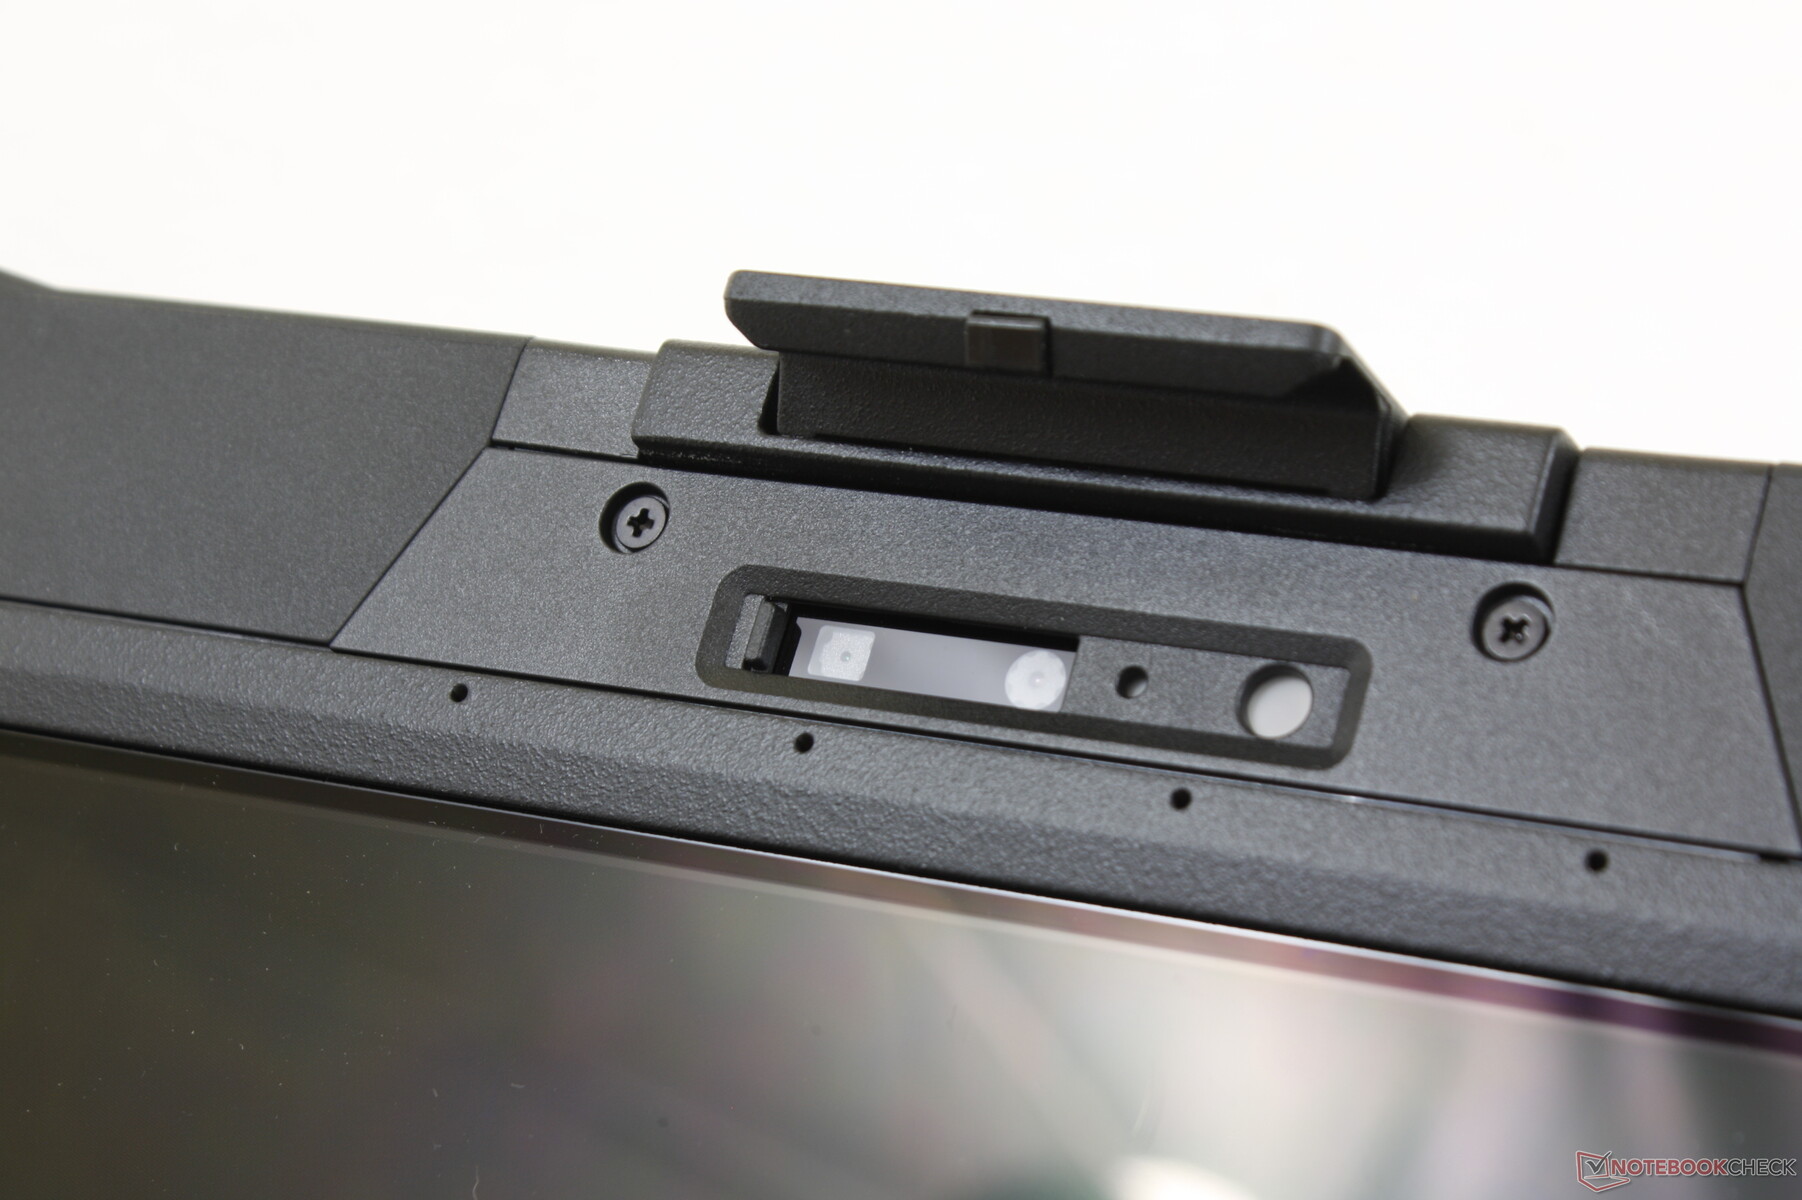
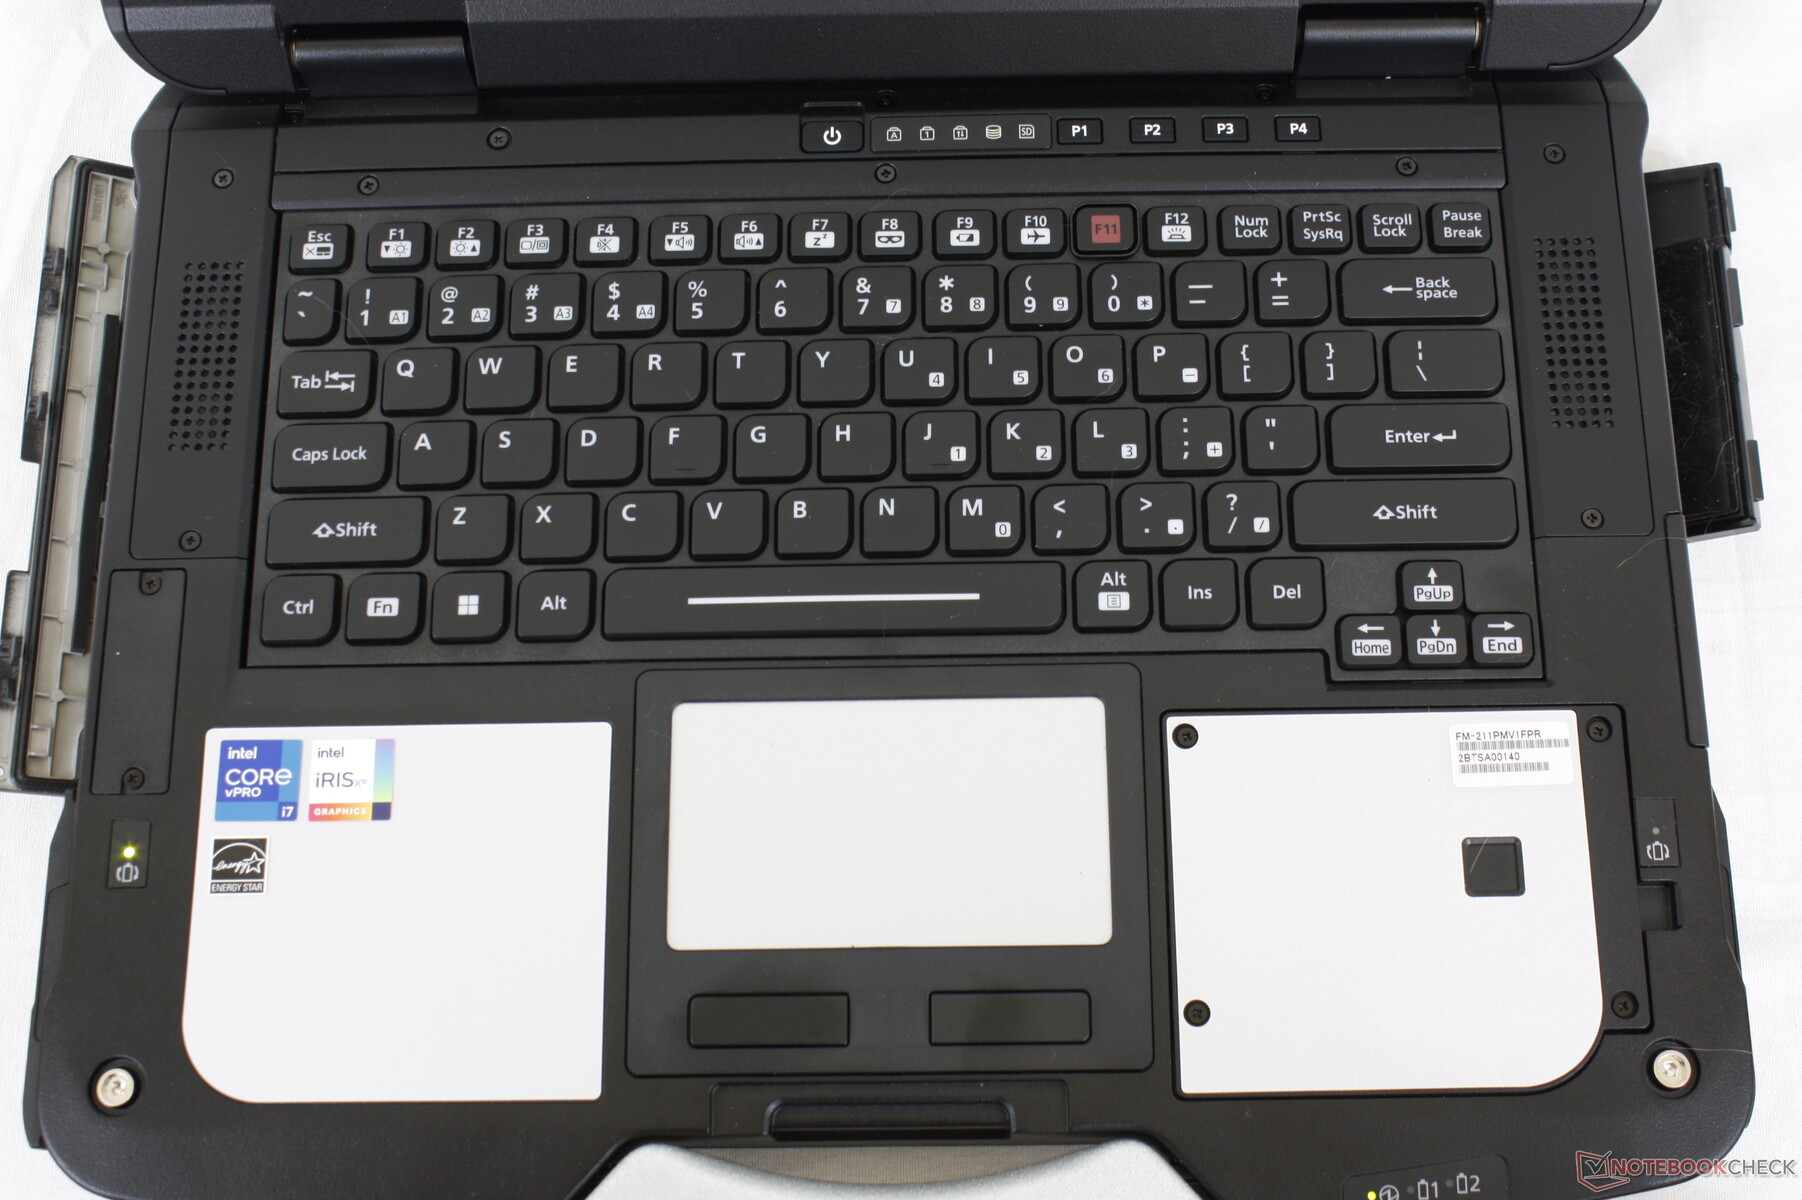
Toughbook 40的可插拔端口和连接功能是我们在任何笔记本电脑上看到的最通用的一些功能。该机型最多同时支持四个可拆卸的xPAK卡。如下图所示,一个沿后部,一个沿左侧边缘,一个沿右侧边缘,还有一个在右侧掌托下面。例如,如果你的使用场景不需要HDMI,那么可以用另一个包括不同端口的端口甲板来交换。主电池和固态硬盘也分别在左侧边缘和右侧边缘有自己的插槽,但它们不包括在四个xPAK插槽中。请记住,四个xPAK插槽的尺寸和形状各不相同;设计成适合一个插槽的卡将不适合其他任何插槽。
第一个插槽是后面的扩展插槽,设计用于VGA、串行、LAN、USB-A和HDMI等端口。沿着左侧边缘的第二个插槽支持光驱、条形码扫描仪、智能卡阅读器和二级固态硬盘。沿着右侧边缘的第三个插槽支持二级电池或智能卡读卡器。最后,掌托槽支持指纹识别器和其他安全功能。制造商计划在不久的将来为各种目的生产额外的扩展卡。
所有这些插槽的一个令人烦恼的问题是,覆盖它们的挡板非常棘手,难以打开和锁定,特别是如果你的手比较小或者手指比较油腻。这些挡板没有足够的抓力,使用起来不舒服。键盘边缘的盖子 DellLatitude 7330 Rugged相比之下,更容易抓握和处理。

SD卡阅读器
| SD Card Reader | |
| average JPG Copy Test (av. of 3 runs) | |
| Dell Latitude 5420 Rugged-P85G (Toshiba Exceria Pro SDXC 64 GB UHS-II) | |
| Panasonic Toughbook FZ-55 MK2 (AV Pro V60) | |
| Panasonic Toughbook 40 (AV Pro V60) | |
| Acer Enduro Urban N3 EUN314 (AV Pro V60) | |
| Durabook S14I (Angelbird 128GB AV Pro UHS-II) | |
| maximum AS SSD Seq Read Test (1GB) | |
| Dell Latitude 5420 Rugged-P85G (Toshiba Exceria Pro SDXC 64 GB UHS-II) | |
| Panasonic Toughbook FZ-55 MK2 (AV Pro V60) | |
| Panasonic Toughbook 40 (AV Pro V60) | |
| Durabook S14I (Angelbird 128GB AV Pro UHS-II) | |
| Acer Enduro Urban N3 EUN314 (AV Pro V60) | |
沟通
英特尔AX201是Wi-Fi 6连接的标准配置。截至目前,还没有Wi-Fi 6E的选项。
可选的4G LTE甚至是5G都是可用的选项。
| Networking | |
| iperf3 transmit AX12 | |
| Acer Enduro Urban N3 EUN314 | |
| Panasonic Toughbook FZ-55 MK2 | |
| Durabook S14I | |
| Getac S410 Gen 4 | |
| Dell Latitude 5420 Rugged-P85G | |
| iperf3 receive AX12 | |
| Durabook S14I | |
| Acer Enduro Urban N3 EUN314 | |
| Panasonic Toughbook FZ-55 MK2 | |
| Getac S410 Gen 4 | |
| Dell Latitude 5420 Rugged-P85G | |
| iperf3 receive AXE11000 | |
| Panasonic Toughbook 40 | |
| iperf3 transmit AXE11000 | |
| Panasonic Toughbook 40 | |
网络摄像头
500万像素的摄像头比其他大多数笔记本电脑上的200万像素或更低的摄像头更清晰。红外线用于支持Windows Hello。


维护
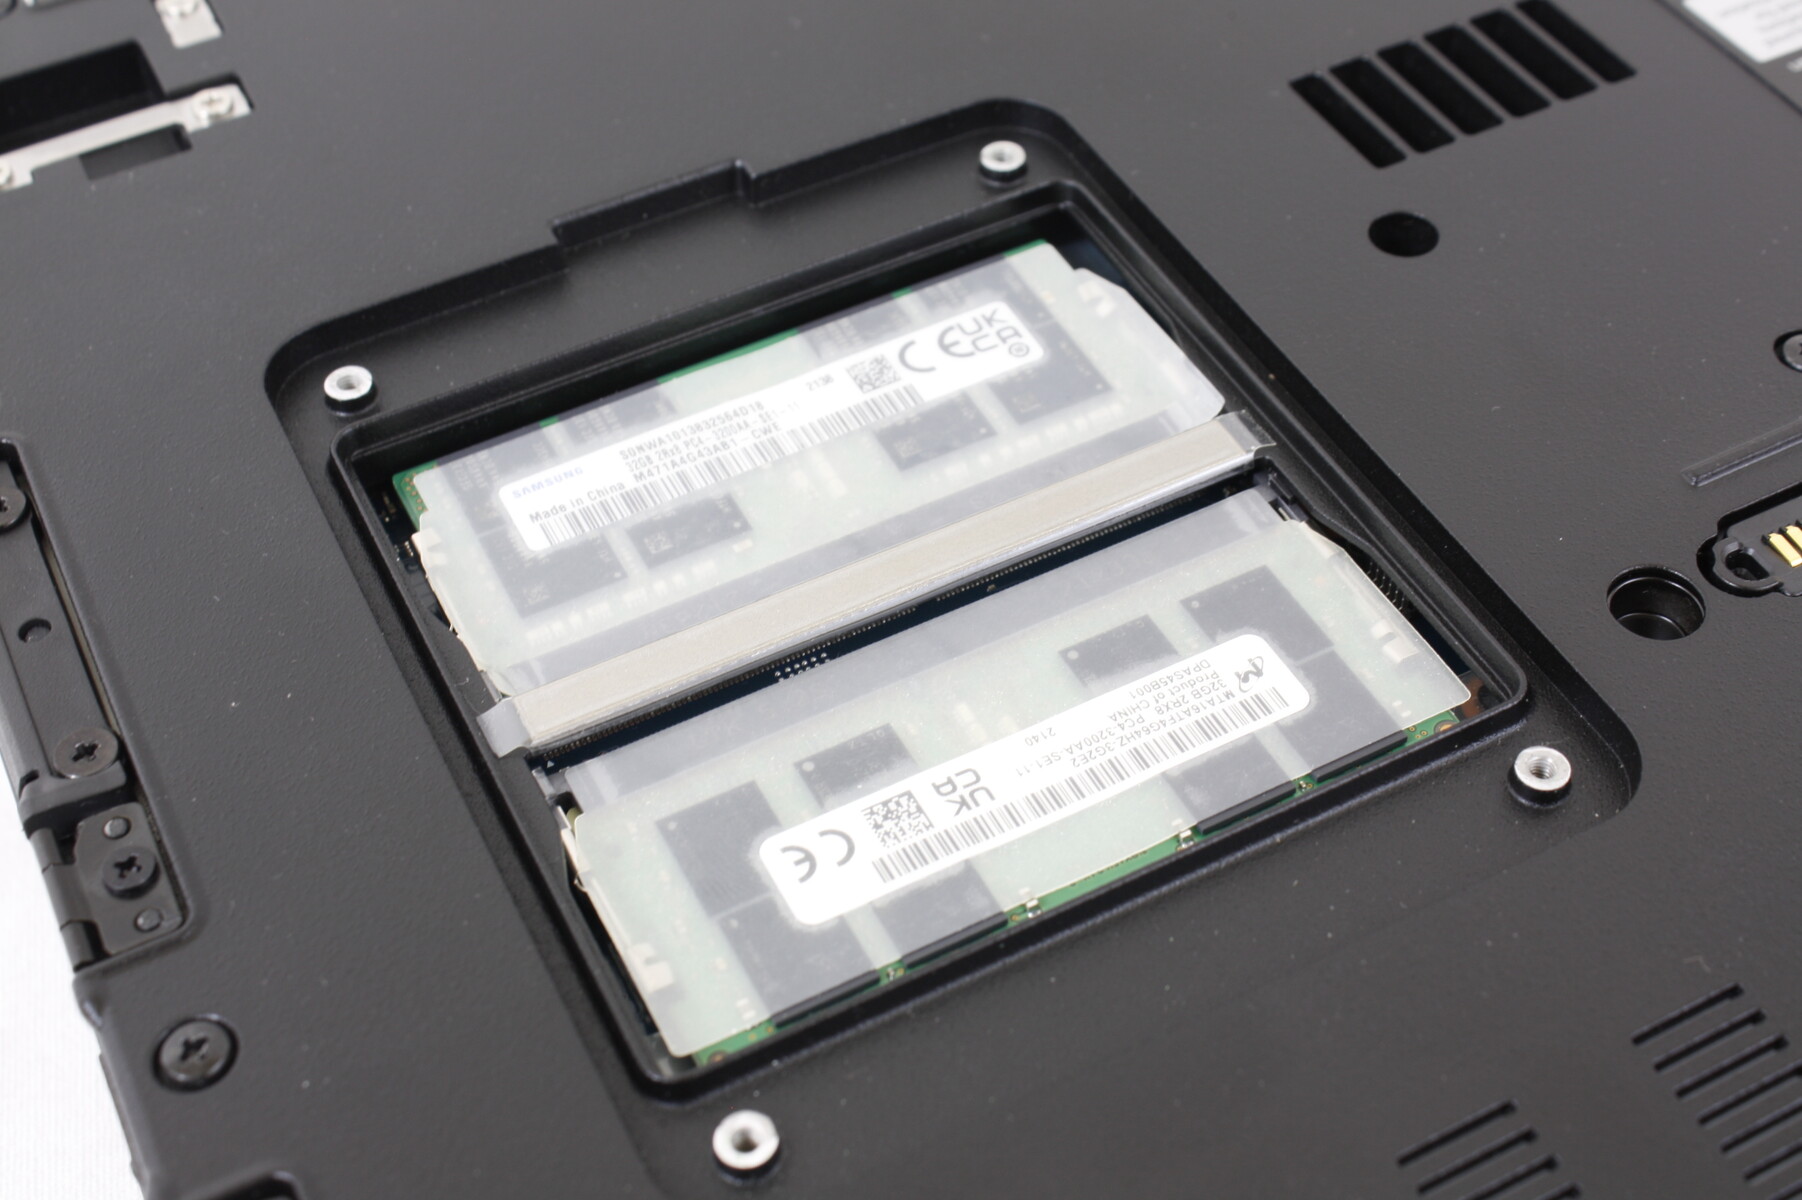
底部面板的设计并不是为了让用户轻松拆卸。取而代之的是一个内置的小舱门,用于访问2个DDR4 SODIMM插槽。
配件和保修
一支无源手写笔沿着设备的正面放在手柄内。松下为其笔记本电脑型号提供了广泛的配件,详情请见https://na.panasonic.com/us/computers-tablets-handhelds/computers/laptops/toughbook-40.
标准的三年有限制造商保修适用。
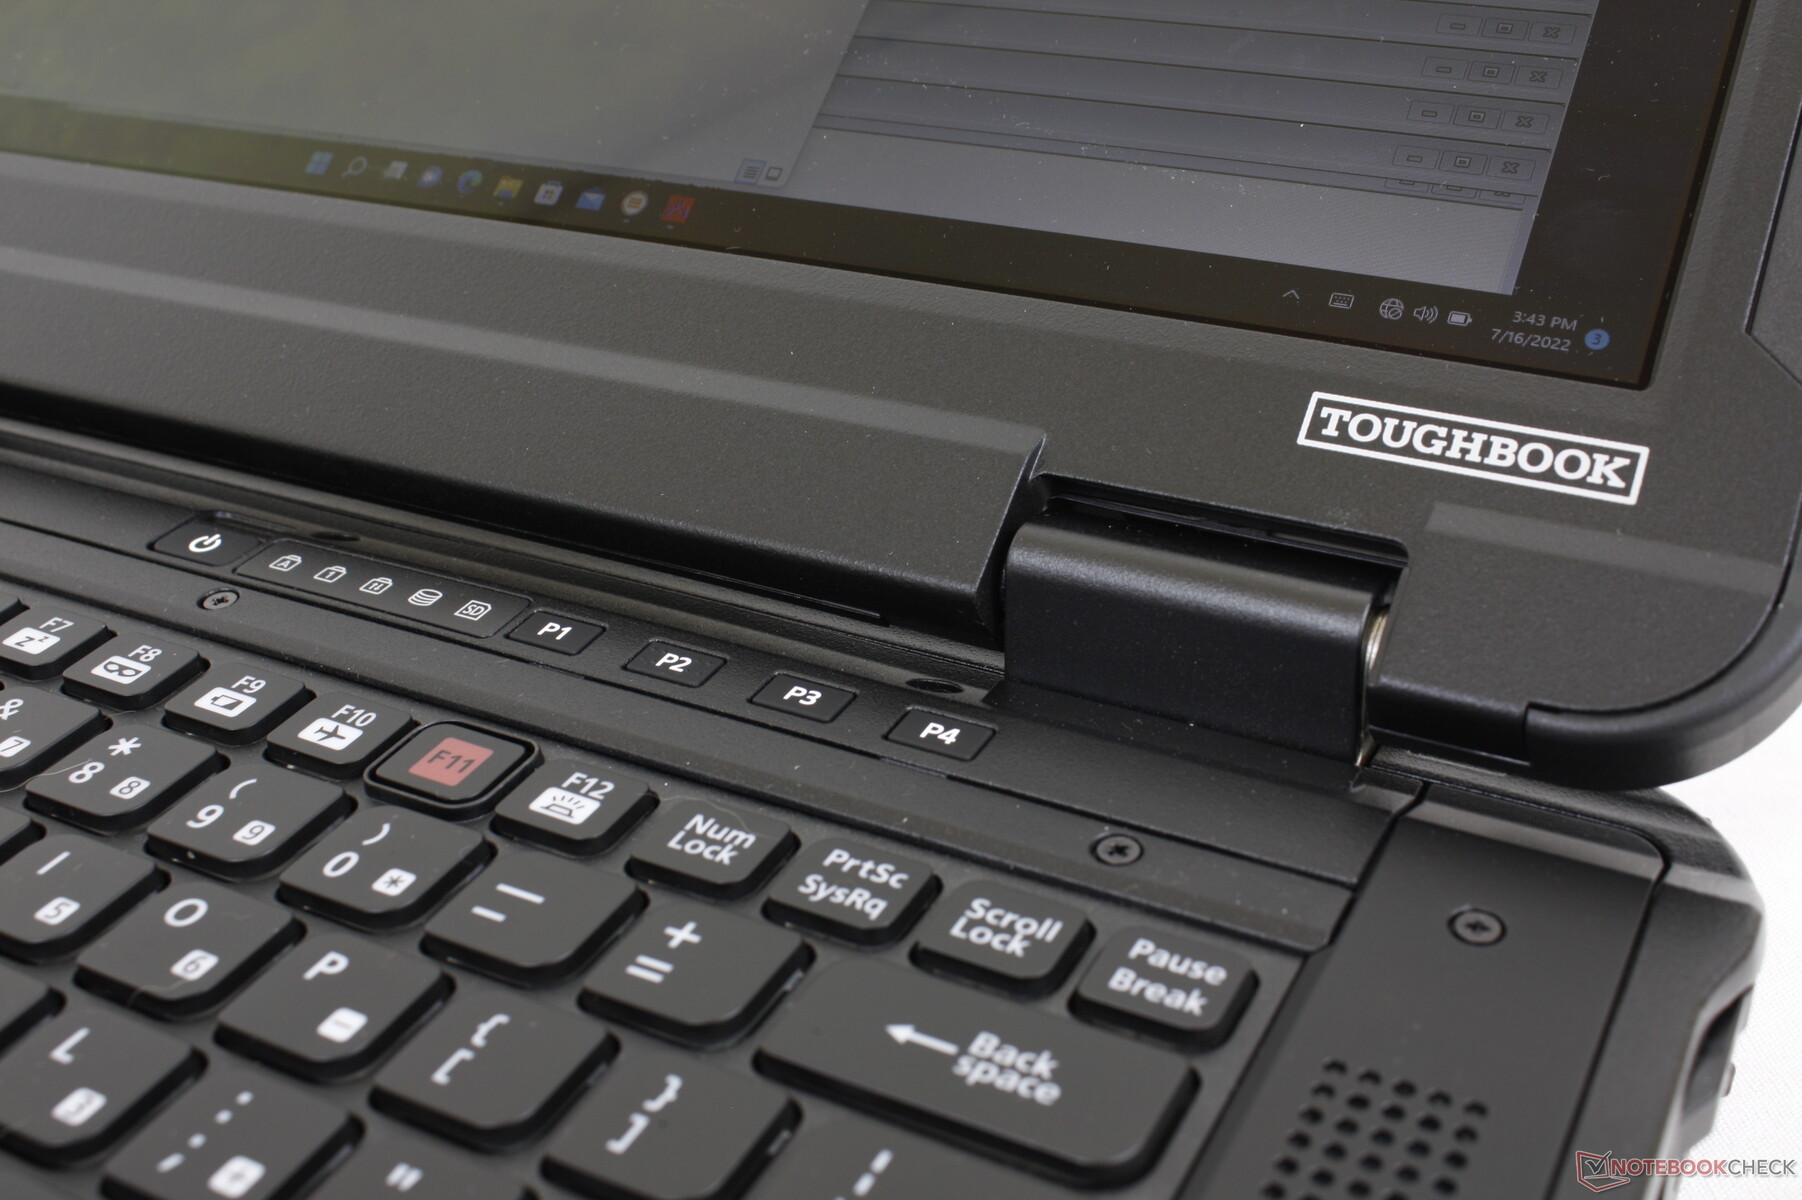
输入设备

显示
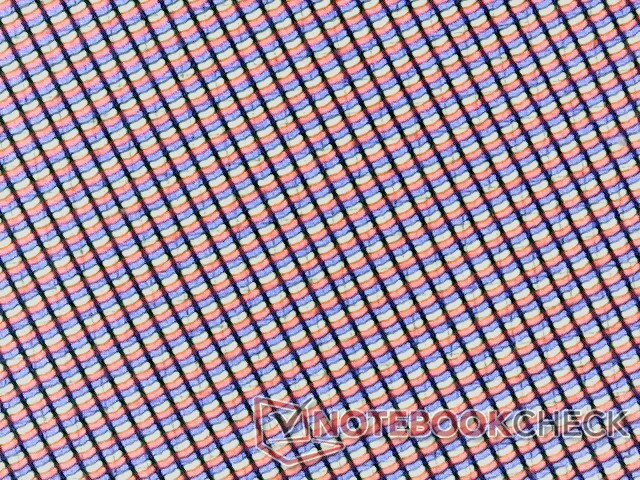
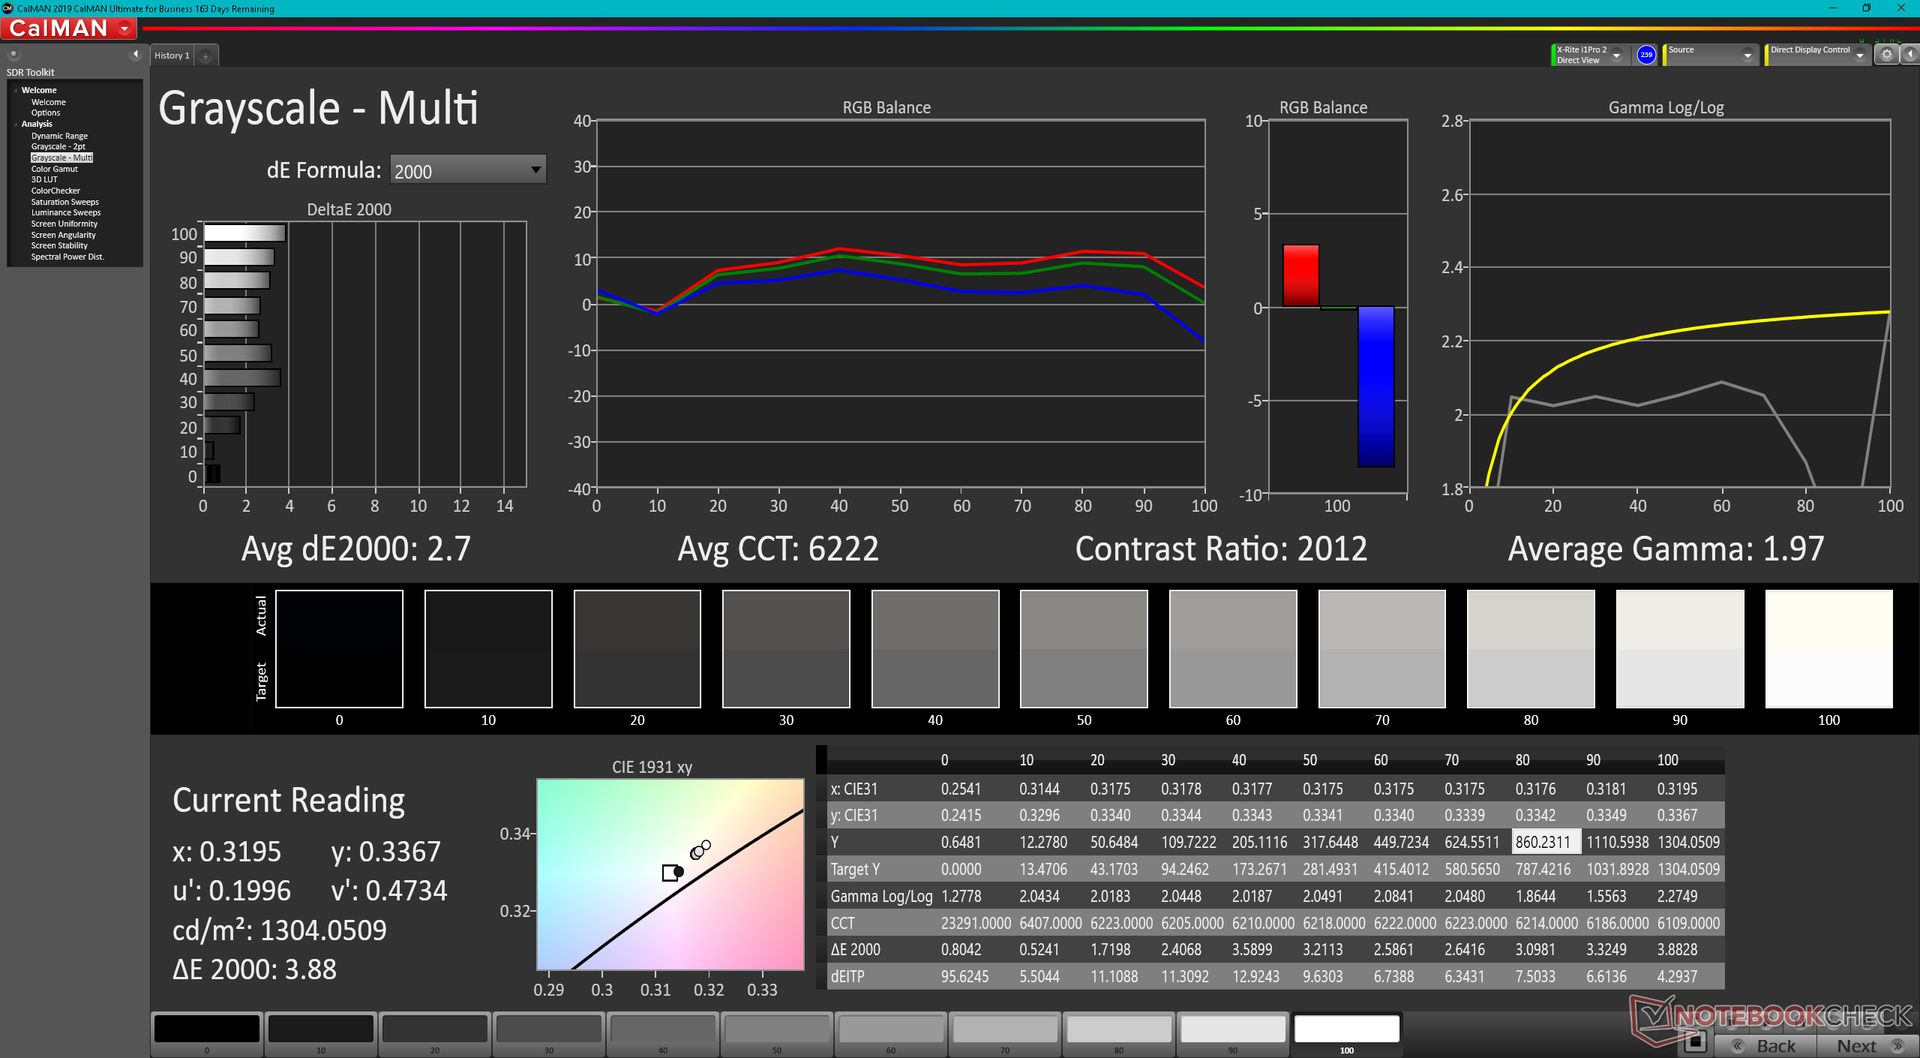
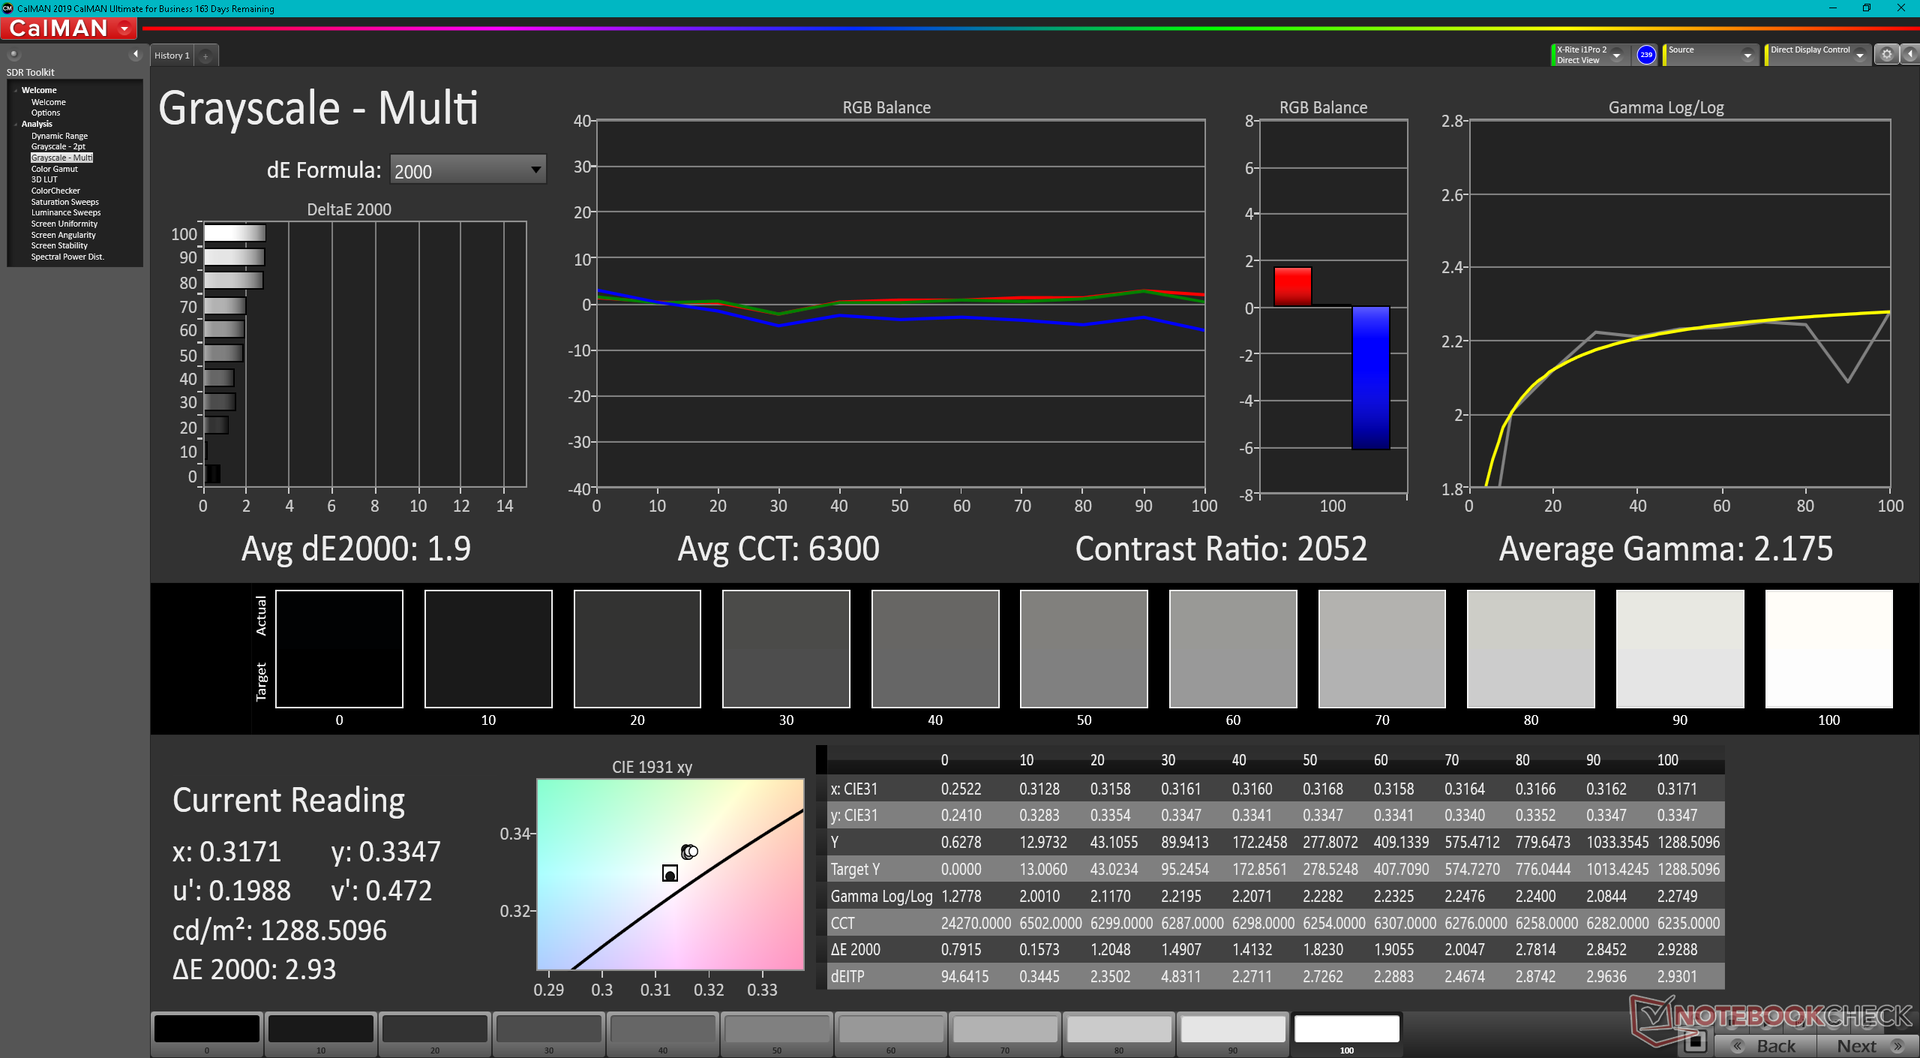
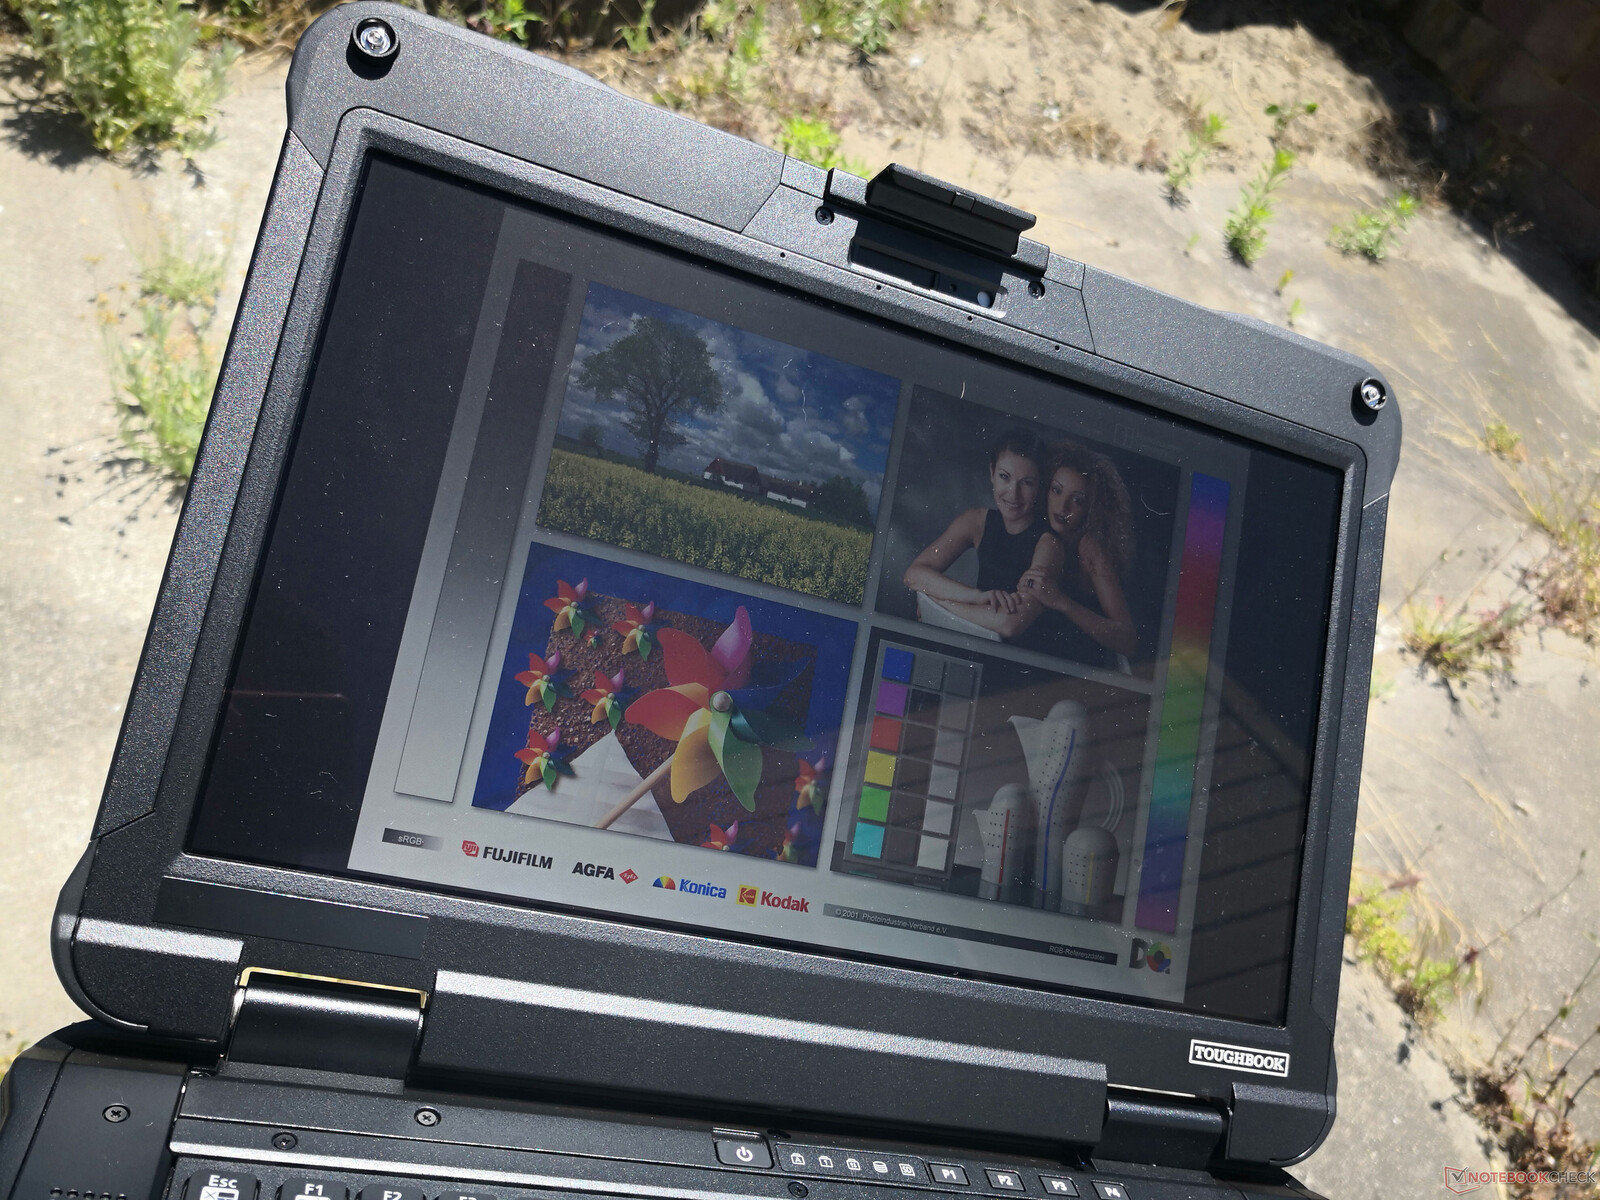
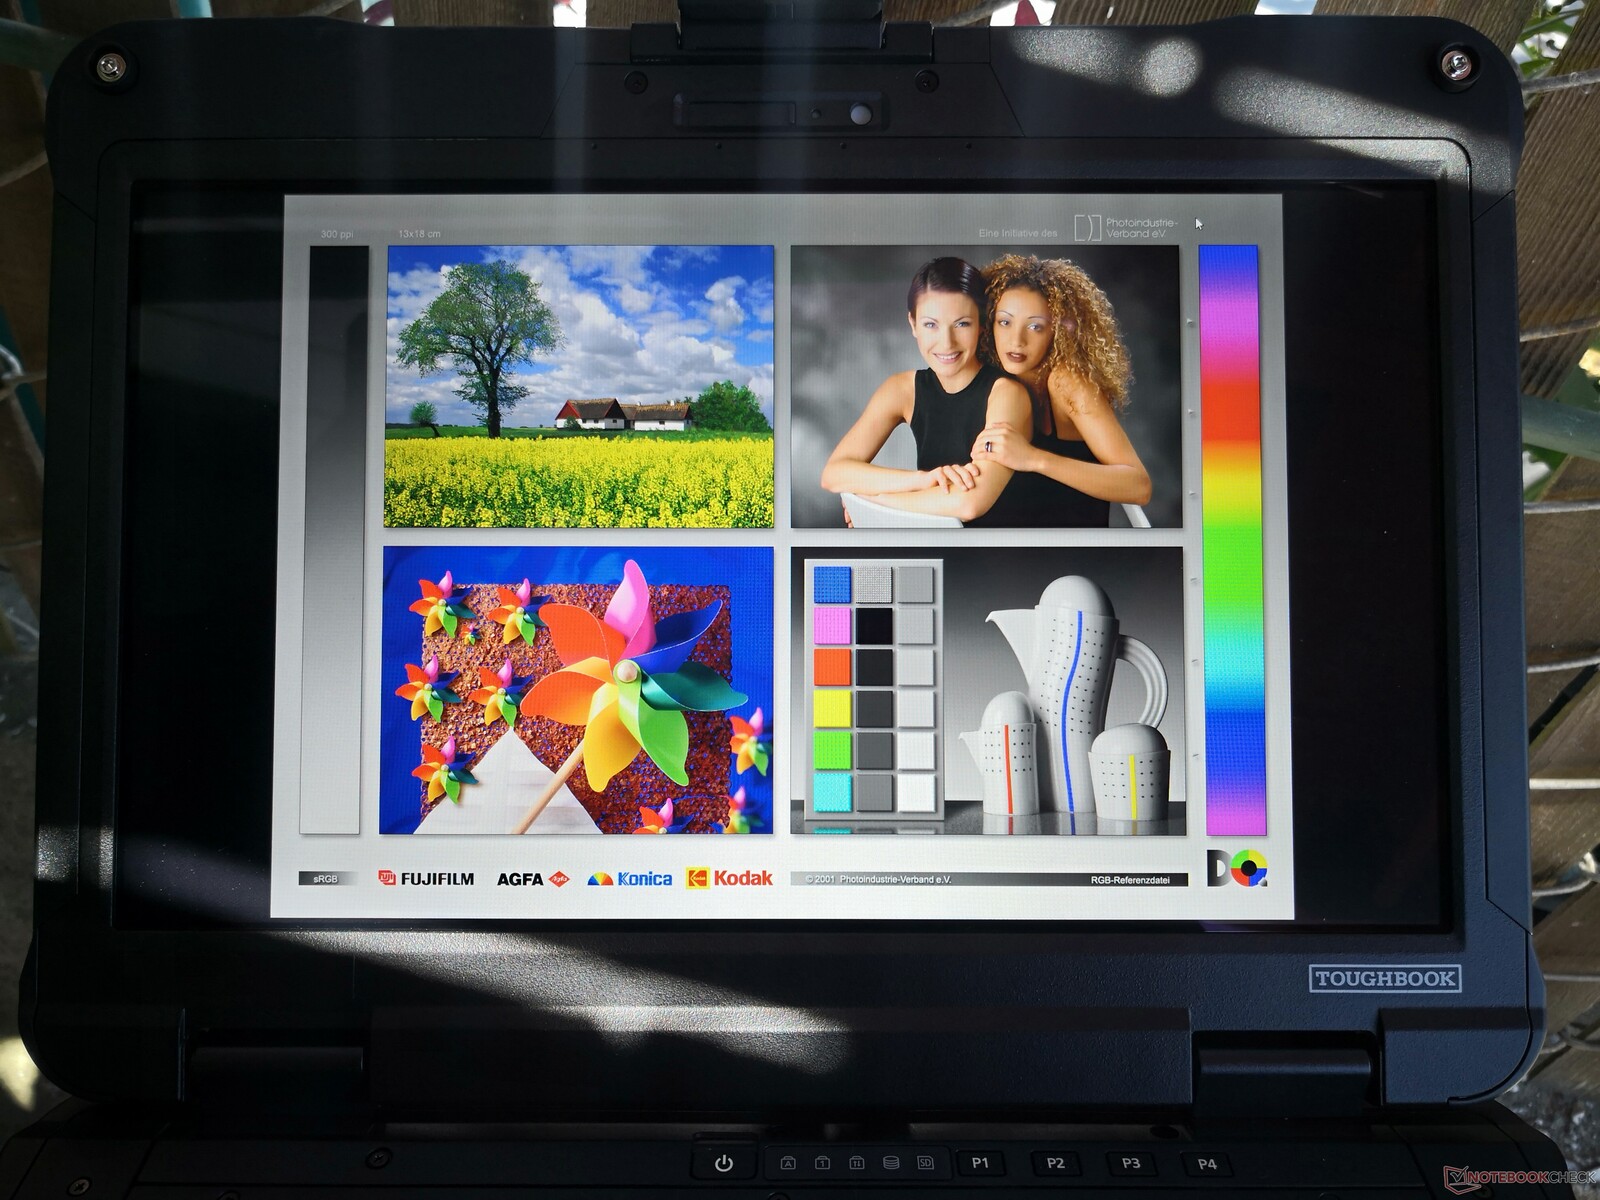
不过,就耐用型笔记本电脑而言,IPS显示屏是非常好的。它不会像许多其他耐用型电脑那样出现严重的颗粒感问题,使文本和图像更加清晰。它的亮度也很高,接近1400尼特,同时保持了超过1000:1的良好对比度,比Durabook S14I上的1400尼特TN显示屏更好。
不幸的是,脉冲宽度调制存在于除最大亮度以外的所有亮度水平。如果你的眼睛对闪烁很敏感,那么你可能要避免在高亮度设置下长时间使用松下的产品。
| |||||||||||||||||||||||||
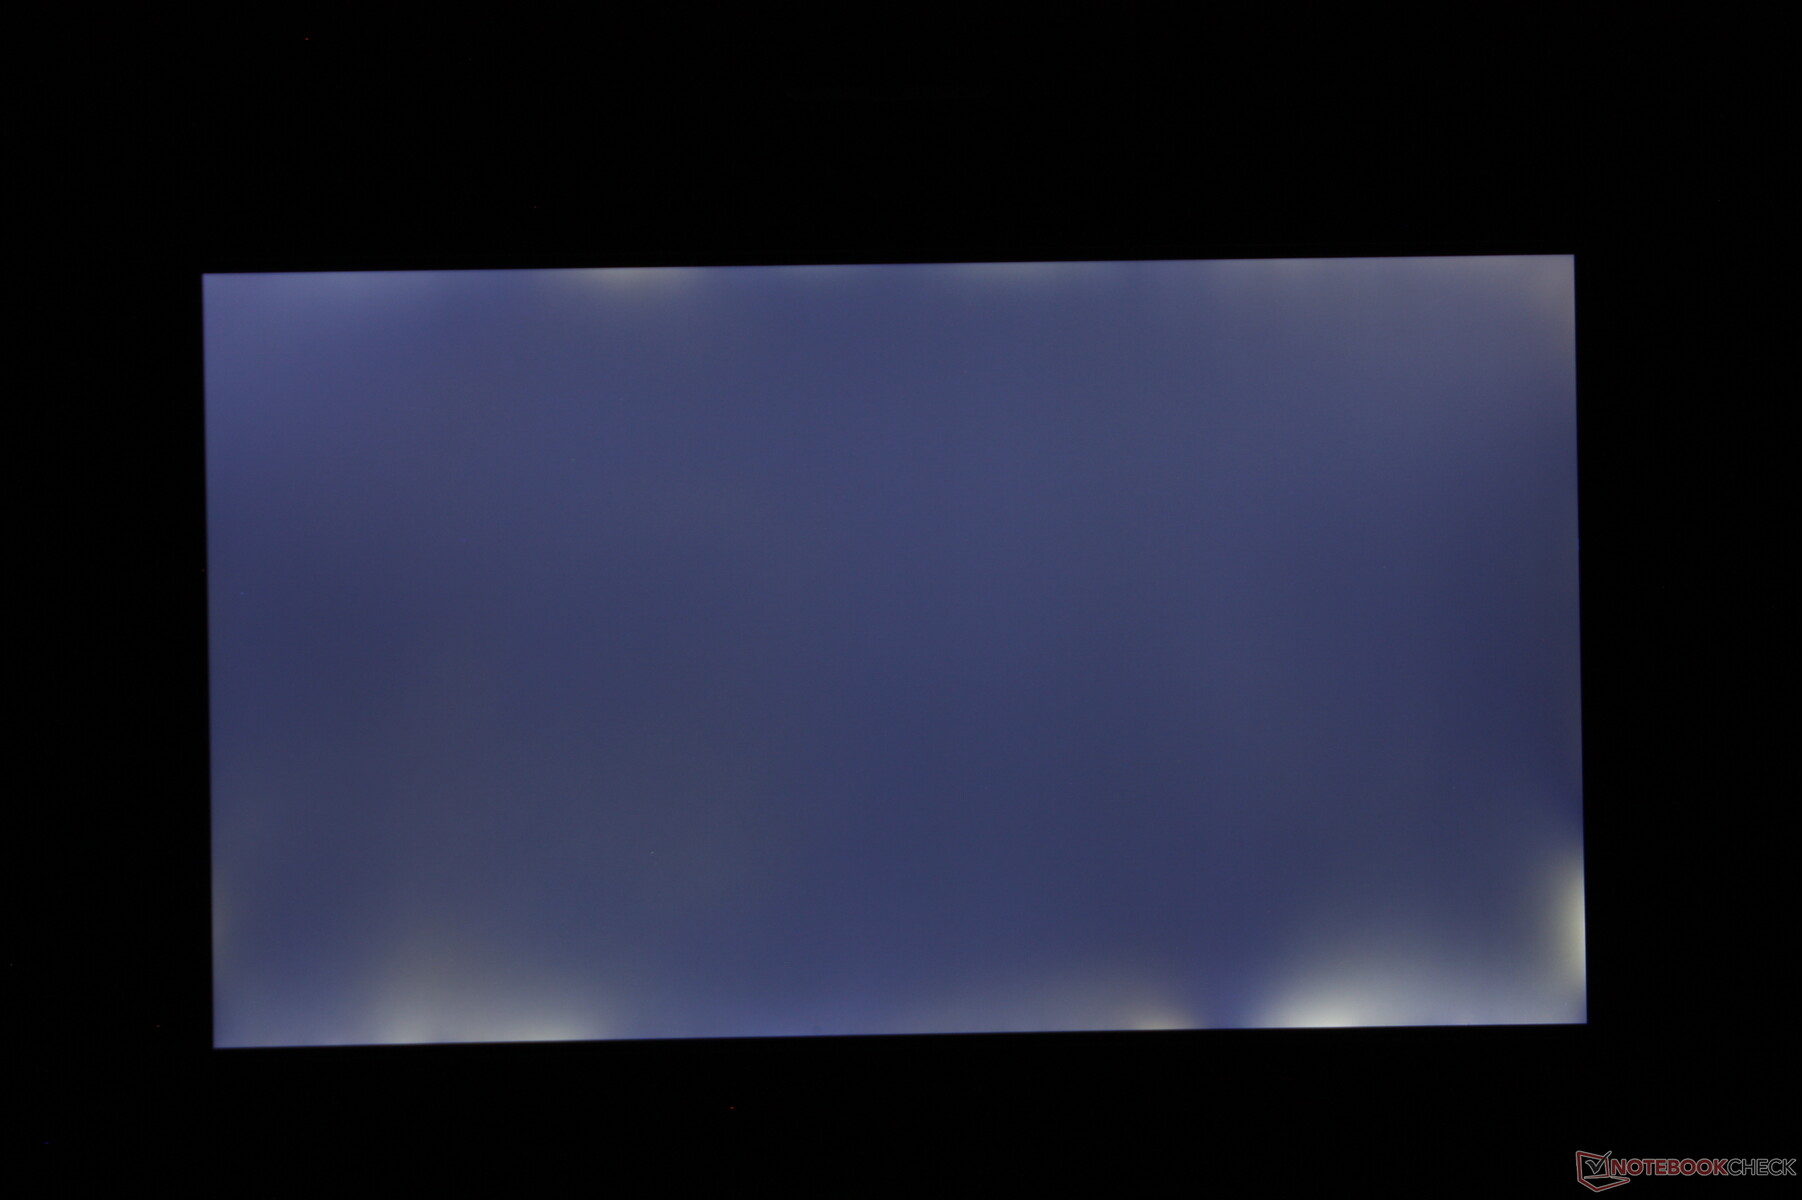
Brightness Distribution: 82 %
Center on Battery: 1284.3 cd/m²
Contrast: 1443:1 (Black: 0.89 cd/m²)
ΔE ColorChecker Calman: 4.67 | ∀{0.5-29.43 Ø4.72}
calibrated: 2.21
ΔE Greyscale Calman: 2.7 | ∀{0.09-98 Ø4.97}
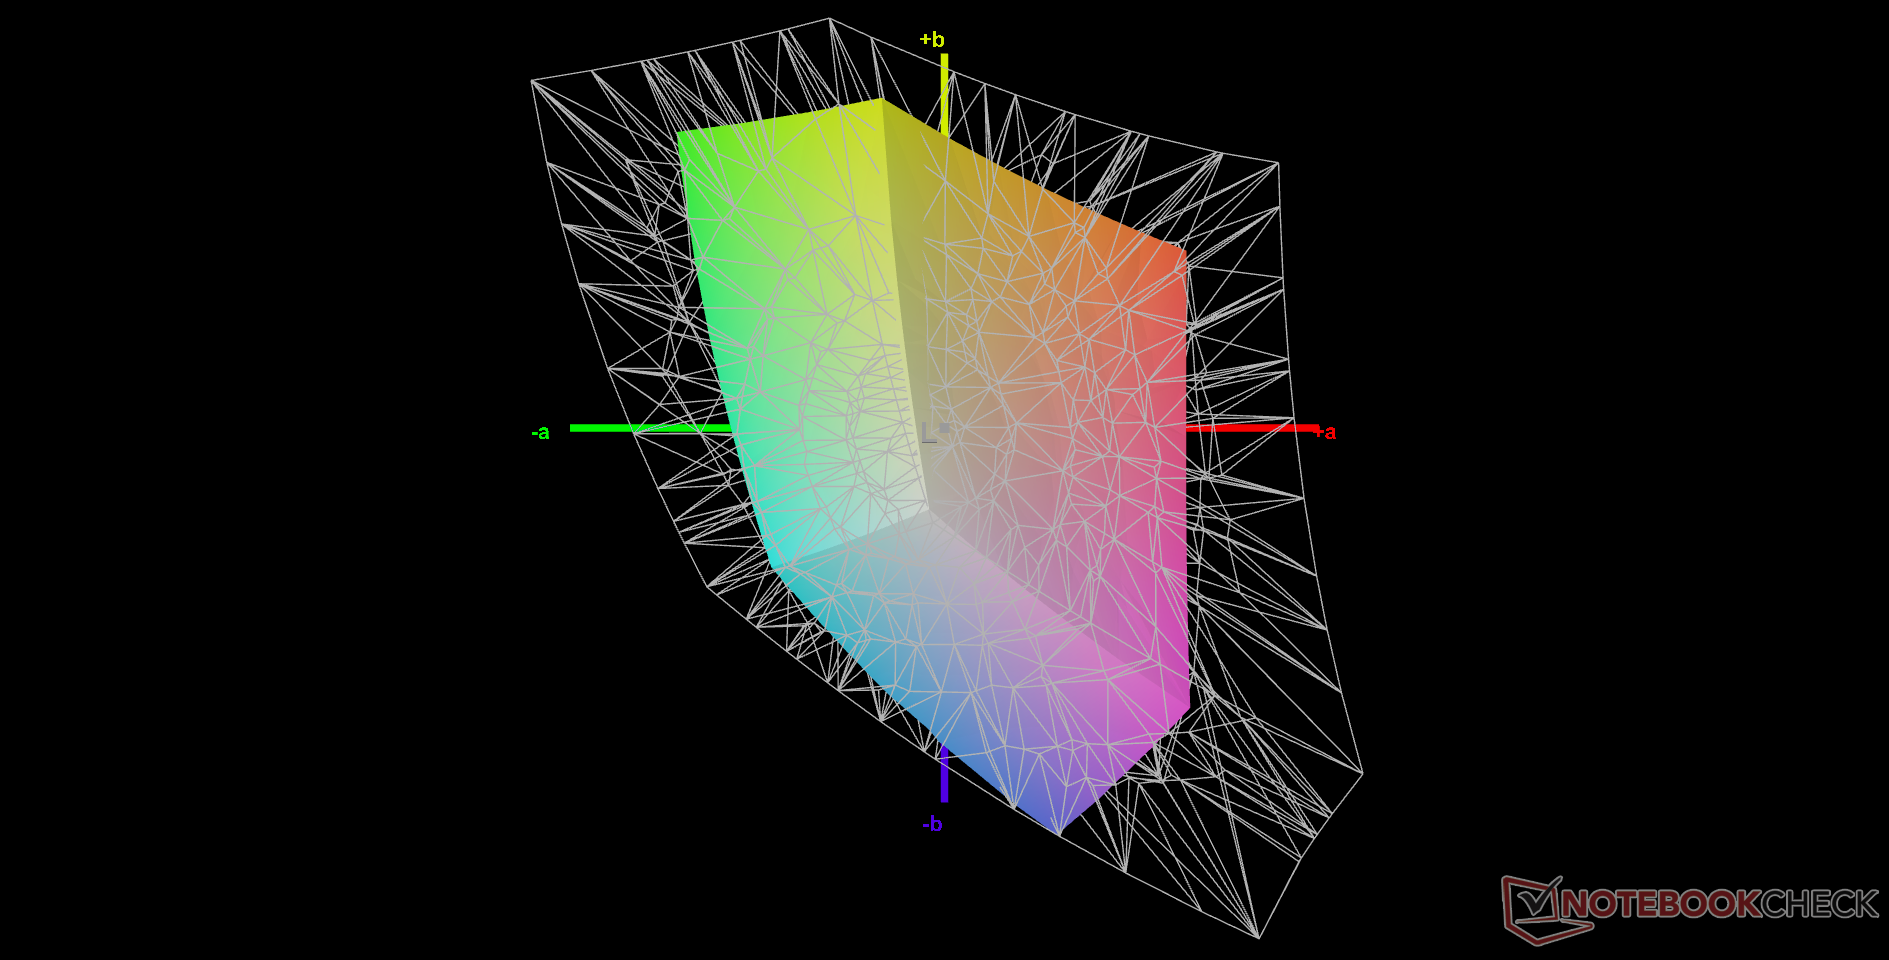
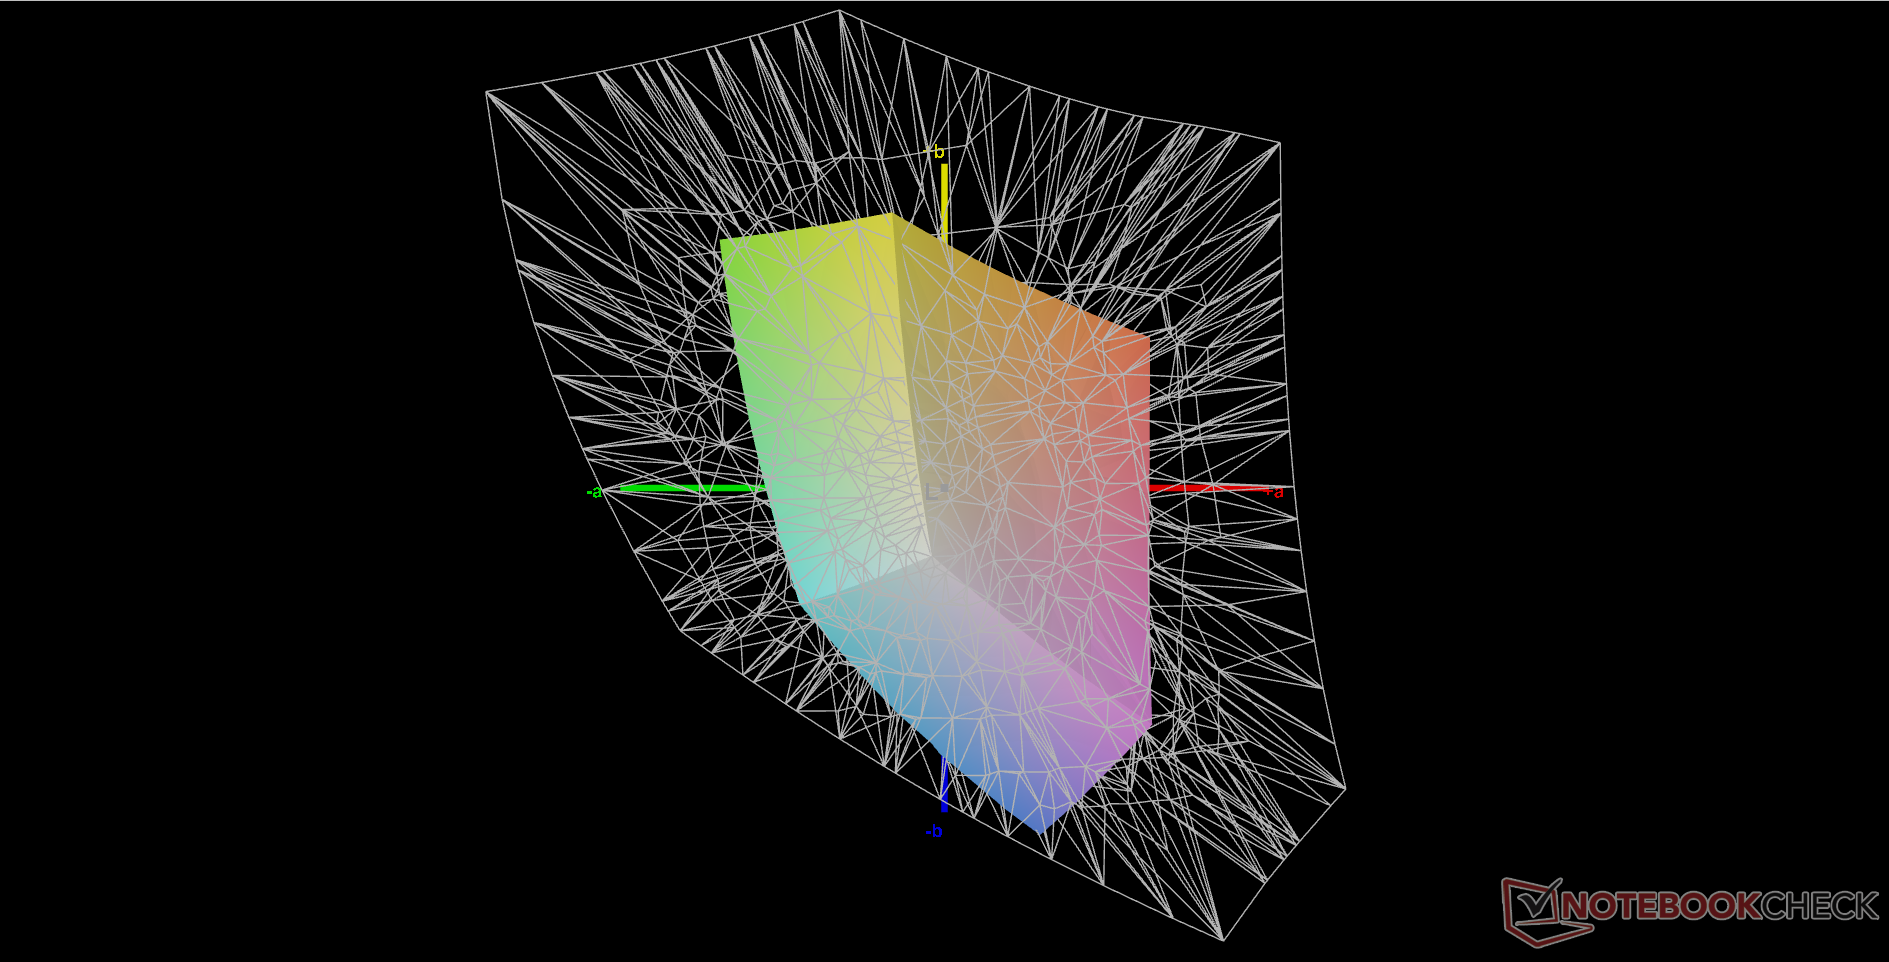
37% AdobeRGB 1998 (Argyll 3D)
53.8% sRGB (Argyll 3D)
35.8% Display P3 (Argyll 3D)
Gamma: 1.97
CCT: 6222 K
| Panasonic Toughbook 40 InfoVision M140NWF5 R3, IPS, 1920x1080, 14" | Panasonic Toughbook FZ-55 MK2 InfoVision M140NWF5 R3, IPS, 1920x1080, 14" | Getac S410 Gen 4 AU Optronics AUO413D, IPS, 1920x1080, 14" | Dell Latitude 5420 Rugged-P85G AU Optronics AUO523D, IPS, 1920x1080, 14" | Acer Enduro Urban N3 EUN314 XR140EA6T, IPS, 1920x1080, 14" | Durabook S14I KD140N0730A01, TN, 1920x1080, 14" | |
|---|---|---|---|---|---|---|
| Display | -3% | 7% | 74% | 75% | 22% | |
| Display P3 Coverage (%) | 35.8 | 34.8 -3% | 38.3 7% | 62.5 75% | 63.5 77% | 43.55 22% |
| sRGB Coverage (%) | 53.8 | 52.2 -3% | 57.2 6% | 92.4 72% | 91.9 71% | 65.4 22% |
| AdobeRGB 1998 Coverage (%) | 37 | 36 -3% | 39.5 7% | 64.2 74% | 65.5 77% | 45 22% |
| Response Times | 18% | 9% | -29% | -20% | 49% | |
| Response Time Grey 50% / Grey 80% * (ms) | 50.4 ? | 28.4 ? 44% | 35.2 ? 30% | 68 ? -35% | 56 ? -11% | 30.4 ? 40% |
| Response Time Black / White * (ms) | 27.6 ? | 30 ? -9% | 31.2 ? -13% | 33.6 ? -22% | 35.2 ? -28% | 11.8 ? 57% |
| PWM Frequency (Hz) | 694.4 ? | 685 ? | 870 ? | 735 ? | 1000 ? | 304.9 ? |
| Screen | -5% | -35% | -11% | -30% | -100% | |
| Brightness middle (cd/m²) | 1284.3 | 1061.1 -17% | 956.9 -25% | 1111.7 -13% | 487.8 -62% | 1180.7 -8% |
| Brightness (cd/m²) | 1289 | 997 -23% | 984 -24% | 1026 -20% | 464 -64% | 1102 -15% |
| Brightness Distribution (%) | 82 | 76 -7% | 84 2% | 80 -2% | 89 9% | 89 9% |
| Black Level * (cd/m²) | 0.89 | 0.7 21% | 0.81 9% | 0.81 9% | 0.48 46% | 1.91 -115% |
| Contrast (:1) | 1443 | 1516 5% | 1181 -18% | 1372 -5% | 1016 -30% | 618 -57% |
| Colorchecker dE 2000 * | 4.67 | 4.64 1% | 6.6 -41% | 3.83 18% | 6.51 -39% | 13.45 -188% |
| Colorchecker dE 2000 max. * | 19.85 | 20.92 -5% | 22.94 -16% | 7.85 60% | 11.36 43% | 22.52 -13% |
| Colorchecker dE 2000 calibrated * | 2.21 | 2.52 -14% | 4.05 -83% | 2.98 -35% | 1.77 20% | 3.19 -44% |
| Greyscale dE 2000 * | 2.7 | 2.8 -4% | 6 -122% | 5.6 -107% | 7.8 -189% | 15.4 -470% |
| Gamma | 1.97 112% | 2.08 106% | 2.19 100% | 2.306 95% | 2.28 96% | 1.97 112% |
| CCT | 6222 104% | 6364 102% | 7276 89% | 7676 85% | 8102 80% | 21134 31% |
| Color Space (Percent of AdobeRGB 1998) (%) | 59 | 41.6 | ||||
| Color Space (Percent of sRGB) (%) | 93 | 65.5 | ||||
| Total Average (Program / Settings) | 3% /
-1% | -6% /
-20% | 11% /
5% | 8% /
-6% | -10% /
-53% |
* ... smaller is better
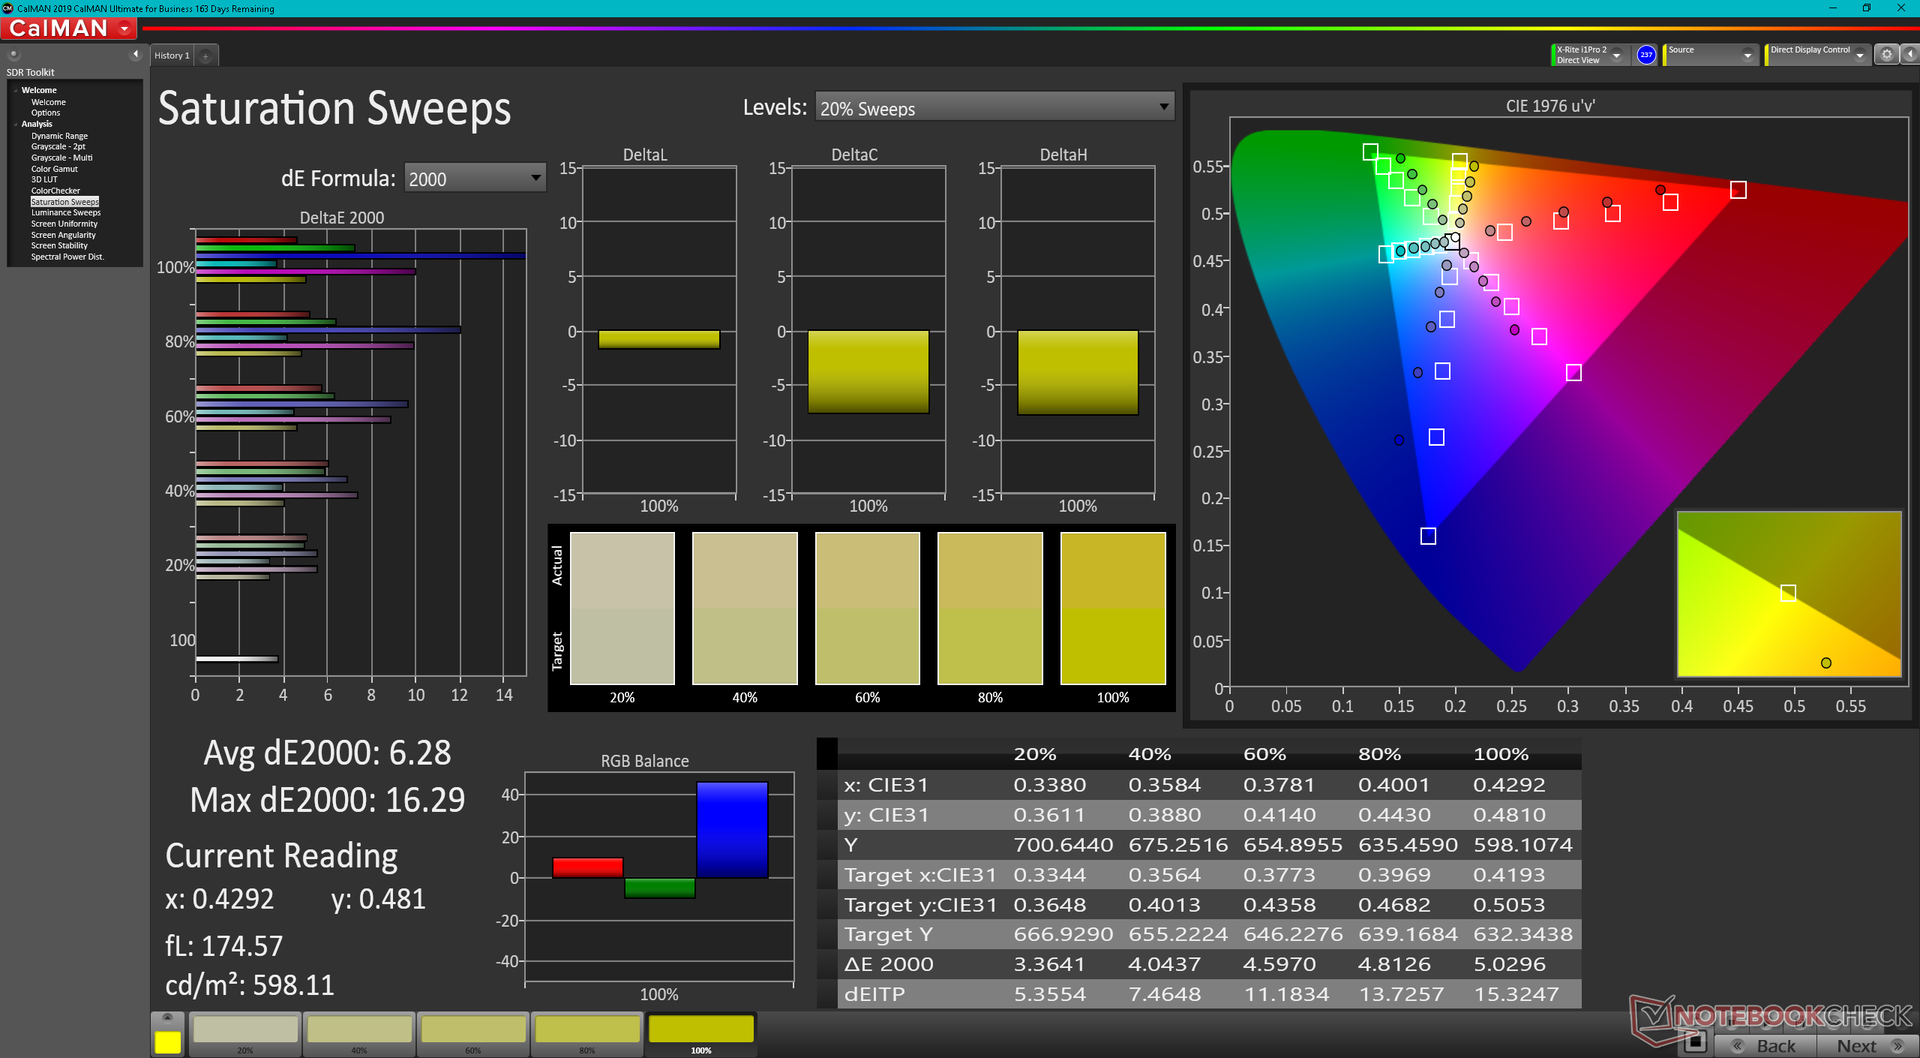
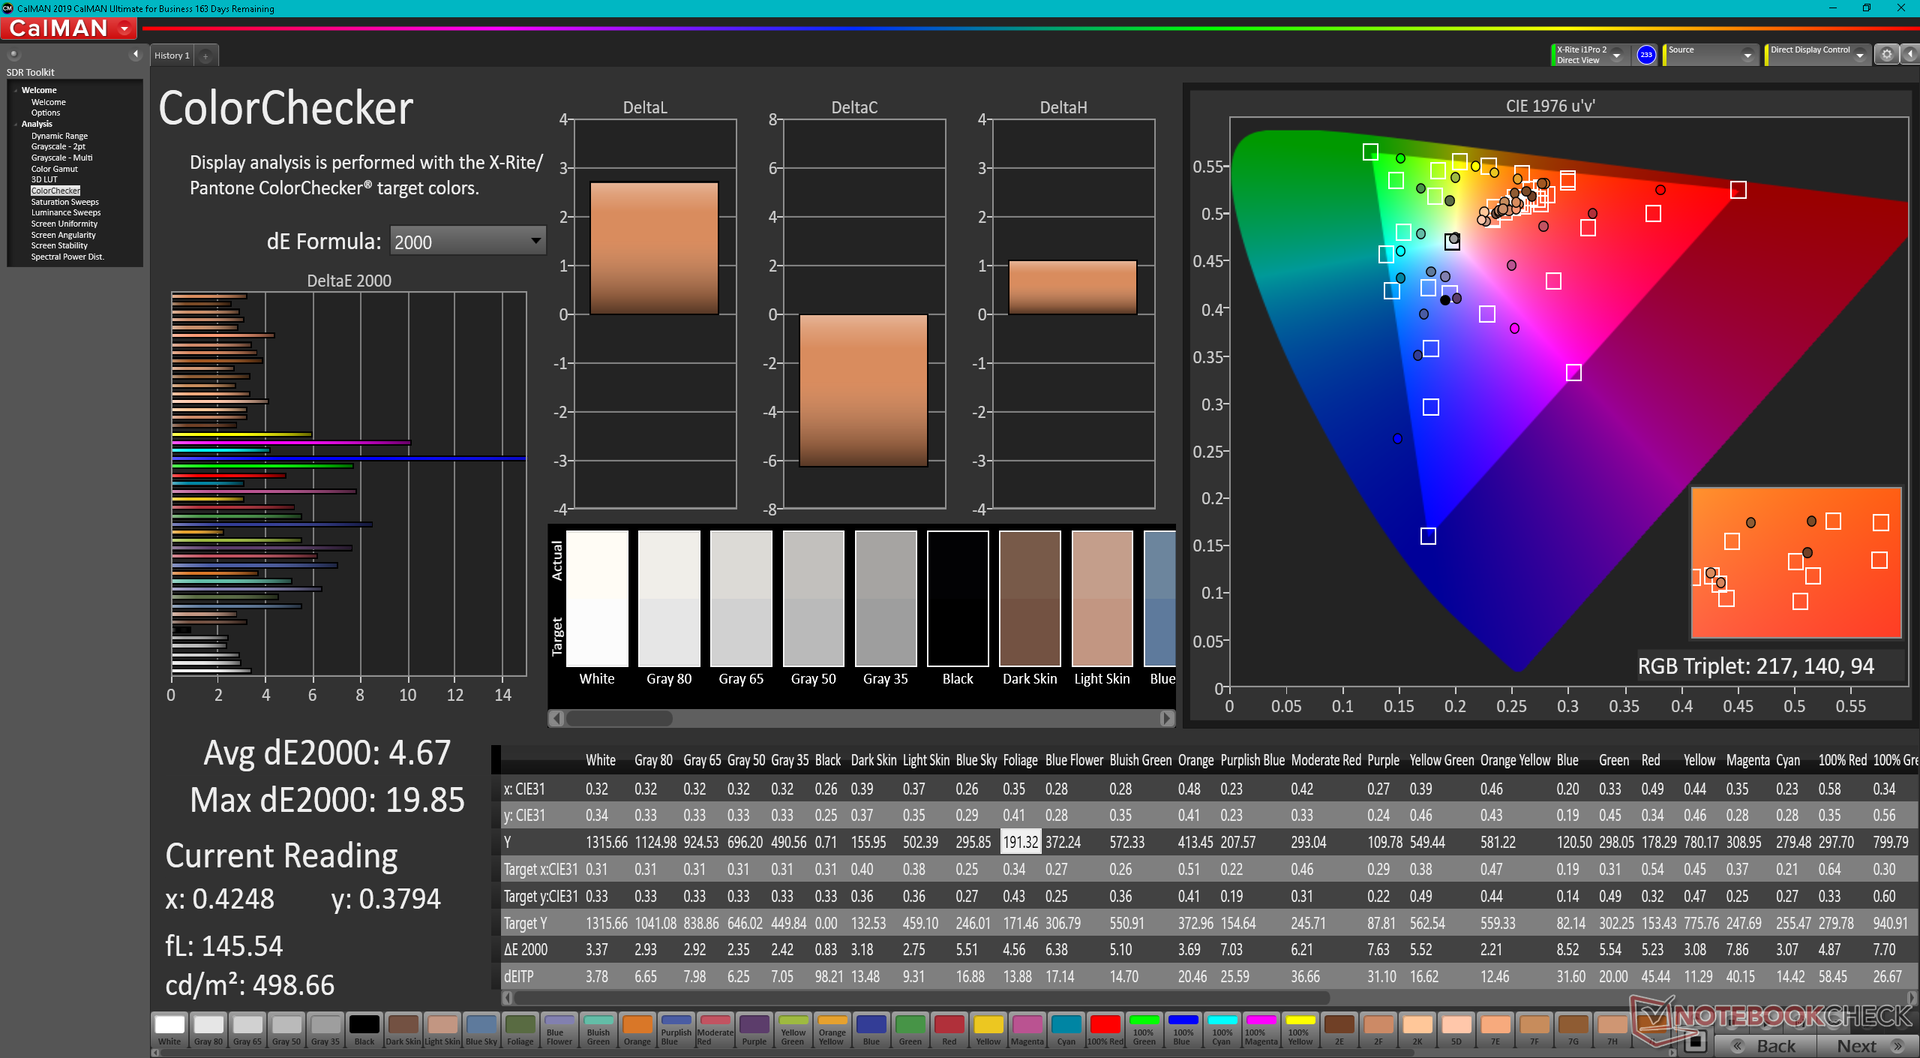
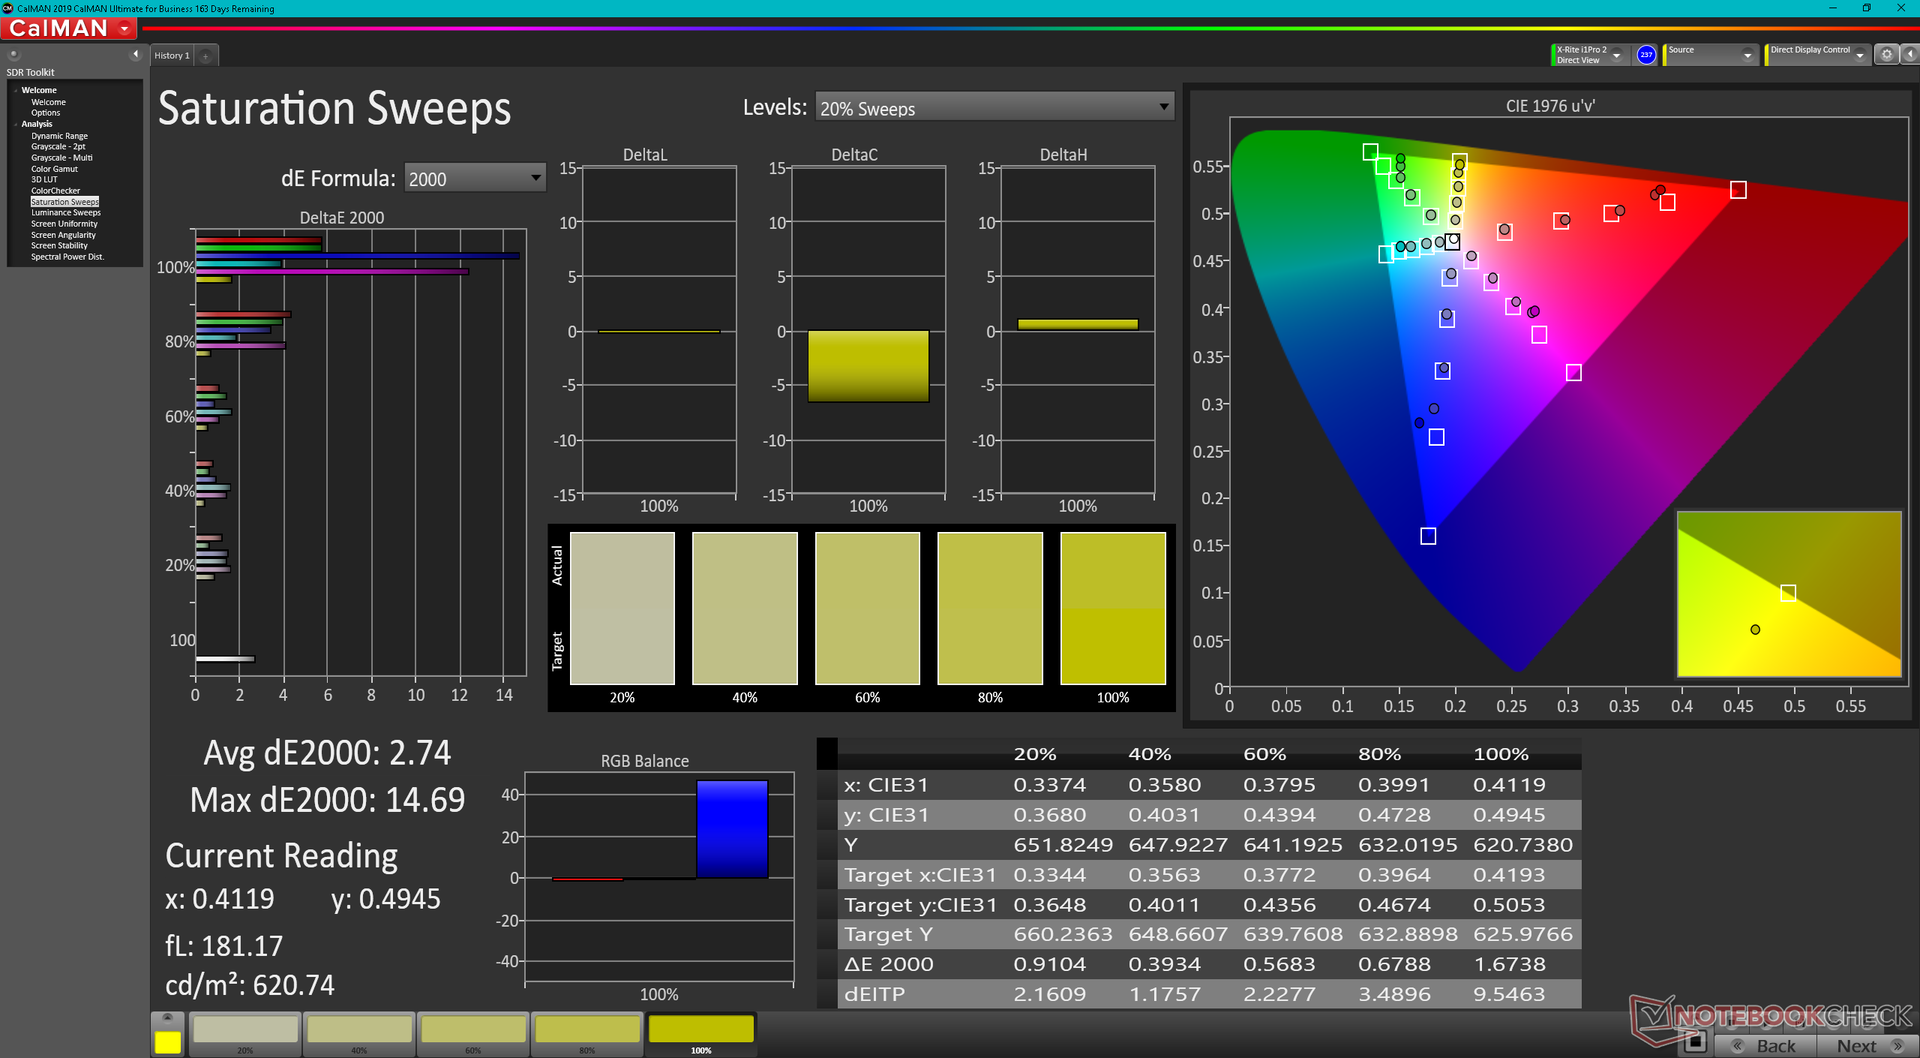
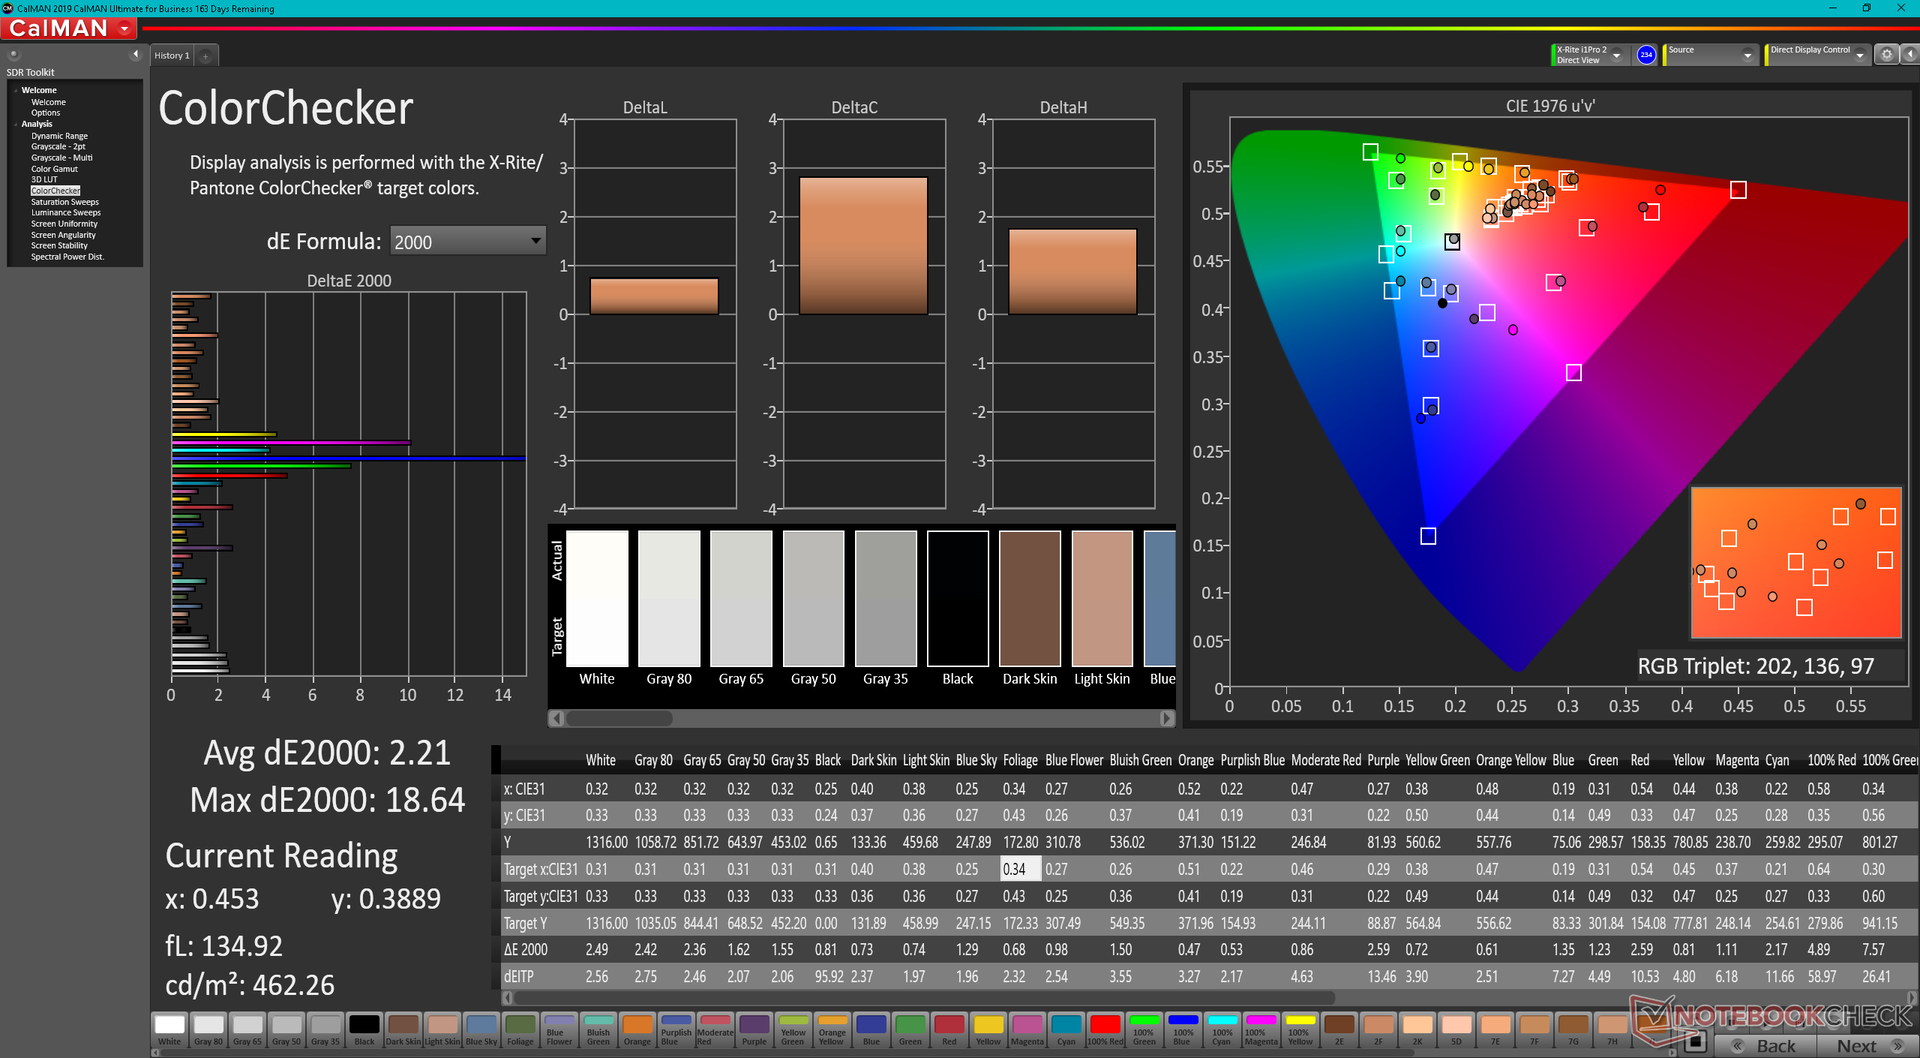
色域很窄,仅占sRGB的54%,而宏碁的色域超过90%。 Acer Enduro Urban N3戴尔Latitude 5420 Rugged,以及大多数中档或更高的消费者笔记本电脑。这通常不应该是一个问题,除非色彩准确度对你的应用至关重要。
该显示器在出厂时没有经过校准。自己校准会全面提高平均deltaE值,但由于上述有限的sRGB覆盖范围,饱和的颜色总是不准确的。即便如此,用户仍然可以应用我们上述校准的ICM配置文件,以获得显示器的最大效益。
Display Response Times
| ↔ Response Time Black to White | ||
|---|---|---|
| 27.6 ms ... rise ↗ and fall ↘ combined | ↗ 14.4 ms rise | 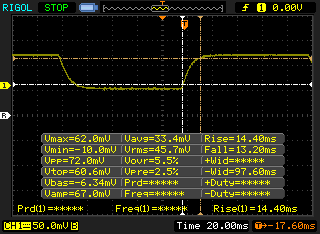 |
| ↘ 13.2 ms fall | ||
| The screen shows relatively slow response rates in our tests and may be too slow for gamers. In comparison, all tested devices range from 0.1 (minimum) to 240 (maximum) ms. » 70 % of all devices are better. This means that the measured response time is worse than the average of all tested devices (19.8 ms). | ||
| ↔ Response Time 50% Grey to 80% Grey | ||
| 50.4 ms ... rise ↗ and fall ↘ combined | ↗ 24.4 ms rise | 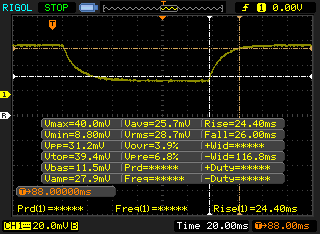 |
| ↘ 26 ms fall | ||
| The screen shows slow response rates in our tests and will be unsatisfactory for gamers. In comparison, all tested devices range from 0.165 (minimum) to 636 (maximum) ms. » 87 % of all devices are better. This means that the measured response time is worse than the average of all tested devices (31 ms). | ||
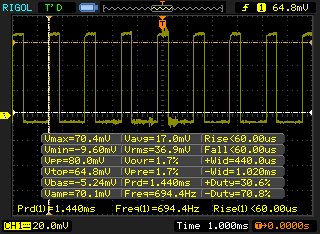
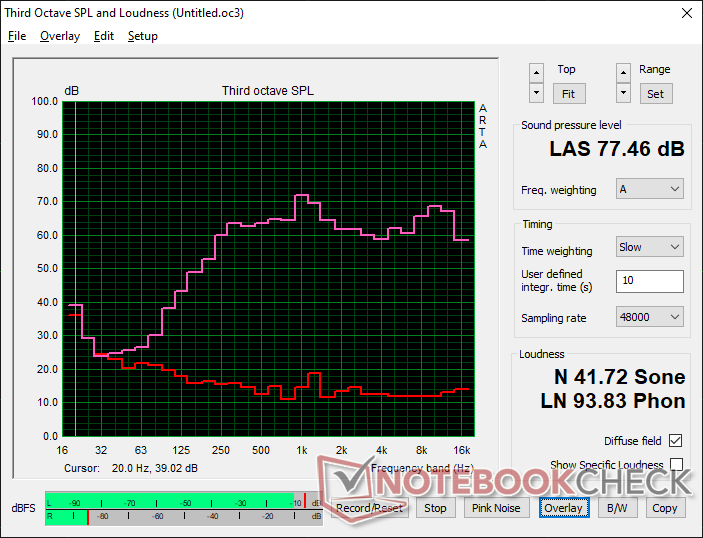
Screen Flickering / PWM (Pulse-Width Modulation)
| Screen flickering / PWM detected | 694.4 Hz | ≤ 99 % brightness setting |  |
The display backlight flickers at 694.4 Hz (worst case, e.g., utilizing PWM) Flickering detected at a brightness setting of 99 % and below. There should be no flickering or PWM above this brightness setting. The frequency of 694.4 Hz is quite high, so most users sensitive to PWM should not notice any flickering. In comparison: 52 % of all tested devices do not use PWM to dim the display. If PWM was detected, an average of 7778 (minimum: 5 - maximum: 343500) Hz was measured. | |||
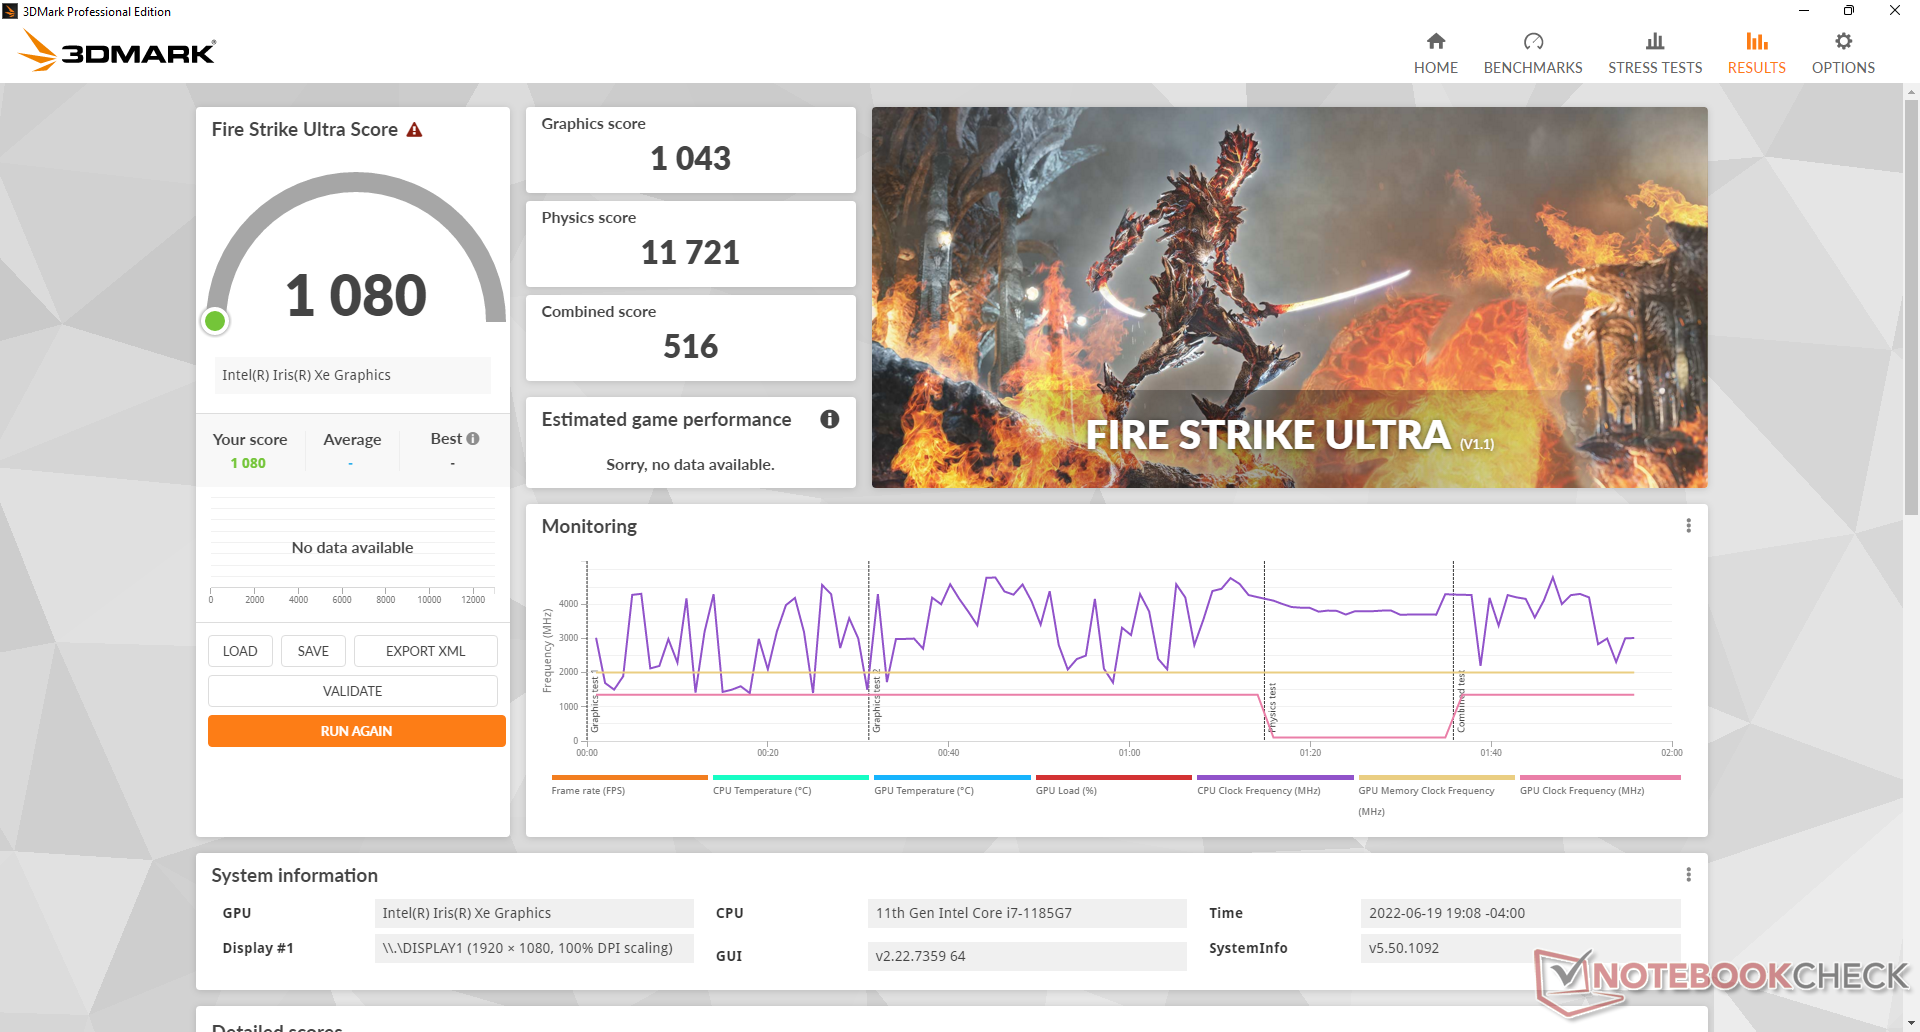
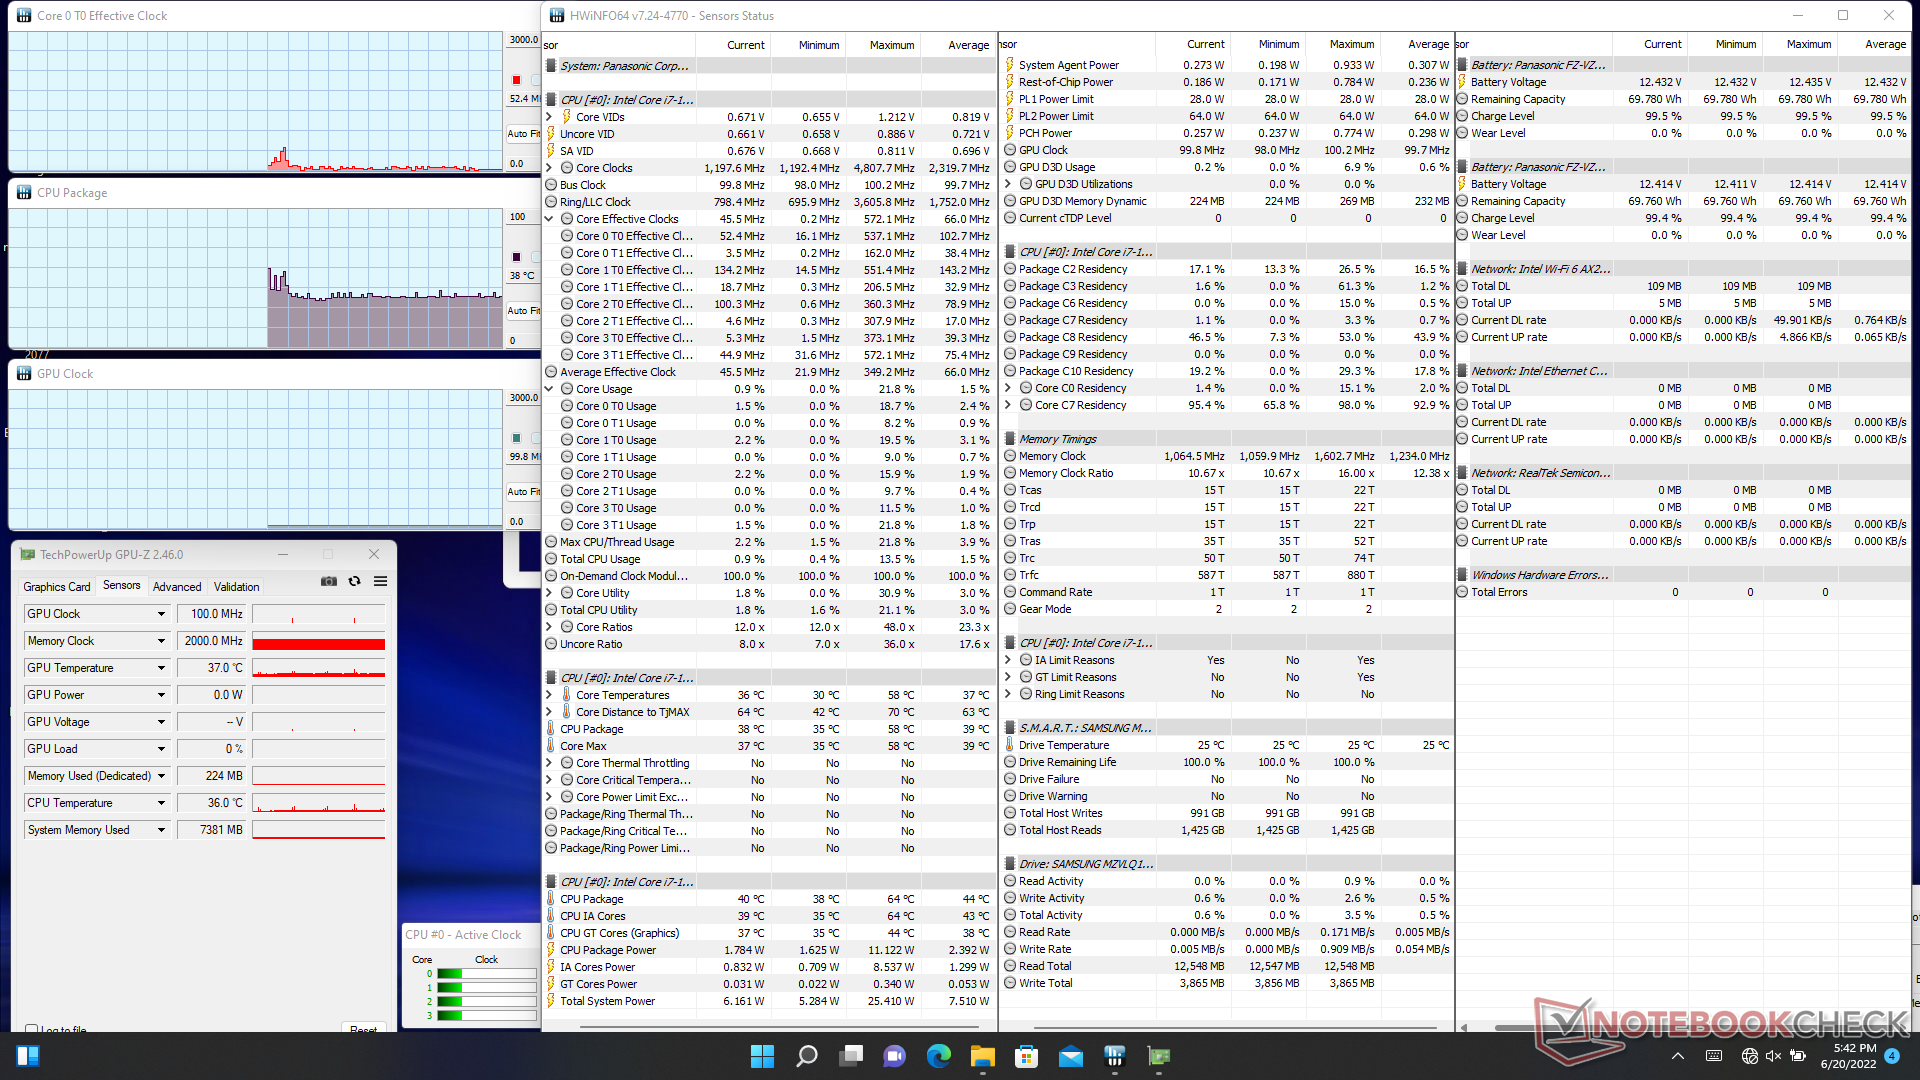
业绩
测试条件
在运行以下任何基准测试之前,我们通过Windows将我们的设备设置为性能模式。
处理器
在单线程和多线程工作负载中,CPU的性能比我们数据库中配备相同的笔记本电脑要慢5%到10%左右。 酷睿i7-1185G7CPU。这并不罕见,因为许多坚固耐用的笔记本电脑倾向于以较低的时钟速率为目标,以提高稳定性和可靠性。总体性能仍然比任何第十代或更早的酷睿U系列解决方案快得多。
Cinebench R15 Multi Loop
Cinebench R23: Multi Core | Single Core
Cinebench R15: CPU Multi 64Bit | CPU Single 64Bit
Blender: v2.79 BMW27 CPU
7-Zip 18.03: 7z b 4 | 7z b 4 -mmt1
Geekbench 5.5: Multi-Core | Single-Core
HWBOT x265 Benchmark v2.2: 4k Preset
LibreOffice : 20 Documents To PDF
R Benchmark 2.5: Overall mean
| Cinebench R20 / CPU (Multi Core) | |
| Lenovo IdeaPad 5 Pro 14ACN6 | |
| Lenovo Yoga 9 14IAP7 82LU0001US | |
| Dell Inspiron 14 7400 7415 2-in-1 | |
| Dell Inspiron 14 7420 2-in-1 | |
| Dell Latitude 14 5420-D2G5W | |
| Average Intel Core i7-1185G7 (1425 - 2493, n=28) | |
| Acer Enduro Urban N3 EUN314 | |
| Panasonic Toughbook 40 | |
| Acer Spin 3 SP314-54N-56S5 | |
| Asus ZenBook 14 UX434FL-DB77 | |
| Infinix INBook X2 | |
| Durabook S15ABG2 | |
| Cinebench R20 / CPU (Single Core) | |
| Dell Inspiron 14 7420 2-in-1 | |
| Lenovo Yoga 9 14IAP7 82LU0001US | |
| Average Intel Core i7-1185G7 (489 - 593, n=28) | |
| Acer Enduro Urban N3 EUN314 | |
| Lenovo IdeaPad 5 Pro 14ACN6 | |
| Panasonic Toughbook 40 | |
| Dell Latitude 14 5420-D2G5W | |
| Dell Inspiron 14 7400 7415 2-in-1 | |
| Asus ZenBook 14 UX434FL-DB77 | |
| Acer Spin 3 SP314-54N-56S5 | |
| Infinix INBook X2 | |
| Durabook S15ABG2 | |
| Cinebench R23 / Multi Core | |
| Lenovo IdeaPad 5 Pro 14ACN6 | |
| Lenovo Yoga 9 14IAP7 82LU0001US | |
| Dell Inspiron 14 7400 7415 2-in-1 | |
| Dell Inspiron 14 7420 2-in-1 | |
| Dell Latitude 14 5420-D2G5W | |
| Average Intel Core i7-1185G7 (3610 - 6383, n=24) | |
| Acer Enduro Urban N3 EUN314 | |
| Panasonic Toughbook 40 | |
| Acer Spin 3 SP314-54N-56S5 | |
| Infinix INBook X2 | |
| Cinebench R23 / Single Core | |
| Dell Inspiron 14 7420 2-in-1 | |
| Lenovo Yoga 9 14IAP7 82LU0001US | |
| Average Intel Core i7-1185G7 (1251 - 1532, n=24) | |
| Acer Enduro Urban N3 EUN314 | |
| Panasonic Toughbook 40 | |
| Dell Latitude 14 5420-D2G5W | |
| Lenovo IdeaPad 5 Pro 14ACN6 | |
| Dell Inspiron 14 7400 7415 2-in-1 | |
| Acer Spin 3 SP314-54N-56S5 | |
| Infinix INBook X2 | |
| Cinebench R15 / CPU Multi 64Bit | |
| Lenovo IdeaPad 5 Pro 14ACN6 | |
| Lenovo Yoga 9 14IAP7 82LU0001US | |
| Dell Inspiron 14 7400 7415 2-in-1 | |
| Dell Inspiron 14 7420 2-in-1 | |
| Average Intel Core i7-1185G7 (617 - 1066, n=32) | |
| Dell Latitude 14 5420-D2G5W | |
| Acer Enduro Urban N3 EUN314 | |
| Panasonic Toughbook 40 | |
| Asus ZenBook 14 UX434FL-DB77 | |
| Acer Spin 3 SP314-54N-56S5 | |
| Infinix INBook X2 | |
| Durabook S15ABG2 | |
| Cinebench R15 / CPU Single 64Bit | |
| Dell Inspiron 14 7420 2-in-1 | |
| Lenovo Yoga 9 14IAP7 82LU0001US | |
| Lenovo IdeaPad 5 Pro 14ACN6 | |
| Average Intel Core i7-1185G7 (168 - 230, n=27) | |
| Acer Enduro Urban N3 EUN314 | |
| Panasonic Toughbook 40 | |
| Dell Latitude 14 5420-D2G5W | |
| Dell Inspiron 14 7400 7415 2-in-1 | |
| Asus ZenBook 14 UX434FL-DB77 | |
| Acer Spin 3 SP314-54N-56S5 | |
| Durabook S15ABG2 | |
| Infinix INBook X2 | |
| Blender / v2.79 BMW27 CPU | |
| Durabook S15ABG2 | |
| Infinix INBook X2 | |
| Acer Spin 3 SP314-54N-56S5 | |
| Asus ZenBook 14 UX434FL-DB77 | |
| Panasonic Toughbook 40 | |
| Average Intel Core i7-1185G7 (478 - 745, n=28) | |
| Acer Enduro Urban N3 EUN314 | |
| Dell Latitude 14 5420-D2G5W | |
| Dell Inspiron 14 7420 2-in-1 | |
| Dell Inspiron 14 7400 7415 2-in-1 | |
| Lenovo Yoga 9 14IAP7 82LU0001US | |
| Lenovo IdeaPad 5 Pro 14ACN6 | |
| 7-Zip 18.03 / 7z b 4 | |
| Lenovo Yoga 9 14IAP7 82LU0001US | |
| Lenovo IdeaPad 5 Pro 14ACN6 | |
| Dell Inspiron 14 7400 7415 2-in-1 | |
| Dell Inspiron 14 7420 2-in-1 | |
| Acer Enduro Urban N3 EUN314 | |
| Average Intel Core i7-1185G7 (18812 - 27693, n=27) | |
| Dell Latitude 14 5420-D2G5W | |
| Panasonic Toughbook 40 | |
| Acer Spin 3 SP314-54N-56S5 | |
| Asus ZenBook 14 UX434FL-DB77 | |
| Infinix INBook X2 | |
| Durabook S15ABG2 | |
| 7-Zip 18.03 / 7z b 4 -mmt1 | |
| Dell Inspiron 14 7420 2-in-1 | |
| Acer Enduro Urban N3 EUN314 | |
| Lenovo IdeaPad 5 Pro 14ACN6 | |
| Average Intel Core i7-1185G7 (3678 - 5507, n=27) | |
| Panasonic Toughbook 40 | |
| Dell Latitude 14 5420-D2G5W | |
| Lenovo Yoga 9 14IAP7 82LU0001US | |
| Dell Inspiron 14 7400 7415 2-in-1 | |
| Acer Spin 3 SP314-54N-56S5 | |
| Durabook S15ABG2 | |
| Asus ZenBook 14 UX434FL-DB77 | |
| Infinix INBook X2 | |
| Geekbench 5.5 / Multi-Core | |
| Lenovo Yoga 9 14IAP7 82LU0001US | |
| Dell Inspiron 14 7420 2-in-1 | |
| Average Intel Core i7-1185G7 (4620 - 5944, n=21) | |
| Acer Enduro Urban N3 EUN314 | |
| Panasonic Toughbook 40 | |
| Acer Spin 3 SP314-54N-56S5 | |
| Dell Latitude 14 5420-D2G5W | |
| Infinix INBook X2 | |
| Durabook S15ABG2 | |
| Asus ZenBook 14 UX434FL-DB77 | |
| Geekbench 5.5 / Single-Core | |
| Lenovo Yoga 9 14IAP7 82LU0001US | |
| Dell Inspiron 14 7420 2-in-1 | |
| Acer Enduro Urban N3 EUN314 | |
| Average Intel Core i7-1185G7 (1398 - 1626, n=21) | |
| Panasonic Toughbook 40 | |
| Acer Spin 3 SP314-54N-56S5 | |
| Dell Latitude 14 5420-D2G5W | |
| Infinix INBook X2 | |
| Asus ZenBook 14 UX434FL-DB77 | |
| Durabook S15ABG2 | |
| HWBOT x265 Benchmark v2.2 / 4k Preset | |
| Lenovo IdeaPad 5 Pro 14ACN6 | |
| Lenovo Yoga 9 14IAP7 82LU0001US | |
| Dell Inspiron 14 7400 7415 2-in-1 | |
| Dell Inspiron 14 7420 2-in-1 | |
| Acer Enduro Urban N3 EUN314 | |
| Average Intel Core i7-1185G7 (5.02 - 8.13, n=27) | |
| Dell Latitude 14 5420-D2G5W | |
| Panasonic Toughbook 40 | |
| Asus ZenBook 14 UX434FL-DB77 | |
| Acer Spin 3 SP314-54N-56S5 | |
| Infinix INBook X2 | |
| Durabook S15ABG2 | |
| LibreOffice / 20 Documents To PDF | |
| Asus ZenBook 14 UX434FL-DB77 | |
| Durabook S15ABG2 | |
| Infinix INBook X2 | |
| Acer Enduro Urban N3 EUN314 | |
| Dell Inspiron 14 7400 7415 2-in-1 | |
| Acer Spin 3 SP314-54N-56S5 | |
| Dell Latitude 14 5420-D2G5W | |
| Lenovo IdeaPad 5 Pro 14ACN6 | |
| Panasonic Toughbook 40 | |
| Average Intel Core i7-1185G7 (41.3 - 61.7, n=26) | |
| Dell Inspiron 14 7420 2-in-1 | |
| Lenovo Yoga 9 14IAP7 82LU0001US | |
| R Benchmark 2.5 / Overall mean | |
| Asus ZenBook 14 UX434FL-DB77 | |
| Infinix INBook X2 | |
| Durabook S15ABG2 | |
| Acer Spin 3 SP314-54N-56S5 | |
| Dell Latitude 14 5420-D2G5W | |
| Panasonic Toughbook 40 | |
| Dell Inspiron 14 7400 7415 2-in-1 | |
| Average Intel Core i7-1185G7 (0.55 - 0.615, n=27) | |
| Acer Enduro Urban N3 EUN314 | |
| Lenovo IdeaPad 5 Pro 14ACN6 | |
| Lenovo Yoga 9 14IAP7 82LU0001US | |
| Dell Inspiron 14 7420 2-in-1 | |
* ... smaller is better
AIDA64: FP32 Ray-Trace | FPU Julia | CPU SHA3 | CPU Queen | FPU SinJulia | FPU Mandel | CPU AES | CPU ZLib | FP64 Ray-Trace | CPU PhotoWorxx
| Performance rating | |
| Acer Enduro Urban N3 EUN314 | |
| Average Intel Core i7-1185G7 | |
| Panasonic Toughbook FZ-55 MK2 | |
| Getac S410 Gen 4 | |
| Panasonic Toughbook 40 | |
| Durabook S14I | |
| AIDA64 / FP32 Ray-Trace | |
| Acer Enduro Urban N3 EUN314 | |
| Average Intel Core i7-1185G7 (5621 - 7453, n=20) | |
| Panasonic Toughbook FZ-55 MK2 | |
| Getac S410 Gen 4 | |
| Panasonic Toughbook 40 | |
| Durabook S14I | |
| AIDA64 / FPU Julia | |
| Acer Enduro Urban N3 EUN314 | |
| Panasonic Toughbook FZ-55 MK2 | |
| Average Intel Core i7-1185G7 (23248 - 32614, n=20) | |
| Getac S410 Gen 4 | |
| Panasonic Toughbook 40 | |
| Durabook S14I | |
| AIDA64 / CPU SHA3 | |
| Acer Enduro Urban N3 EUN314 | |
| Average Intel Core i7-1185G7 (1530 - 2209, n=20) | |
| Panasonic Toughbook FZ-55 MK2 | |
| Getac S410 Gen 4 | |
| Panasonic Toughbook 40 | |
| Durabook S14I | |
| AIDA64 / CPU Queen | |
| Acer Enduro Urban N3 EUN314 | |
| Durabook S14I | |
| Panasonic Toughbook FZ-55 MK2 | |
| Average Intel Core i7-1185G7 (44677 - 52815, n=20) | |
| Getac S410 Gen 4 | |
| Panasonic Toughbook 40 | |
| AIDA64 / FPU SinJulia | |
| Acer Enduro Urban N3 EUN314 | |
| Panasonic Toughbook FZ-55 MK2 | |
| Average Intel Core i7-1185G7 (3870 - 5027, n=20) | |
| Getac S410 Gen 4 | |
| Panasonic Toughbook 40 | |
| Durabook S14I | |
| AIDA64 / FPU Mandel | |
| Acer Enduro Urban N3 EUN314 | |
| Panasonic Toughbook FZ-55 MK2 | |
| Average Intel Core i7-1185G7 (14584 - 19594, n=20) | |
| Getac S410 Gen 4 | |
| Panasonic Toughbook 40 | |
| Durabook S14I | |
| AIDA64 / CPU AES | |
| Acer Enduro Urban N3 EUN314 | |
| Durabook S14I | |
| Average Intel Core i7-1185G7 (33002 - 76826, n=20) | |
| Getac S410 Gen 4 | |
| Panasonic Toughbook FZ-55 MK2 | |
| Panasonic Toughbook 40 | |
| AIDA64 / CPU ZLib | |
| Acer Enduro Urban N3 EUN314 | |
| Panasonic Toughbook 40 | |
| Getac S410 Gen 4 | |
| Average Intel Core i7-1185G7 (258 - 412, n=22) | |
| Panasonic Toughbook FZ-55 MK2 | |
| Durabook S14I | |
| AIDA64 / FP64 Ray-Trace | |
| Acer Enduro Urban N3 EUN314 | |
| Panasonic Toughbook FZ-55 MK2 | |
| Average Intel Core i7-1185G7 (2821 - 4094, n=20) | |
| Getac S410 Gen 4 | |
| Panasonic Toughbook 40 | |
| Durabook S14I | |
| AIDA64 / CPU PhotoWorxx | |
| Average Intel Core i7-1185G7 (22349 - 43701, n=20) | |
| Getac S410 Gen 4 | |
| Acer Enduro Urban N3 EUN314 | |
| Panasonic Toughbook FZ-55 MK2 | |
| Panasonic Toughbook 40 | |
| Durabook S14I | |
系统性能
CrossMark: Overall | Productivity | Creativity | Responsiveness
| PCMark 10 / Score | |
| Panasonic Toughbook FZ-55 MK2 | |
| Average Intel Core i7-1185G7, Intel Iris Xe Graphics G7 96EUs (4746 - 5561, n=20) | |
| Panasonic Toughbook 40 | |
| Durabook S14I | |
| Getac S410 Gen 4 | |
| Acer Enduro Urban N3 EUN314 | |
| Dell Latitude 5420 Rugged-P85G | |
| PCMark 10 / Essentials | |
| Panasonic Toughbook FZ-55 MK2 | |
| Durabook S14I | |
| Getac S410 Gen 4 | |
| Average Intel Core i7-1185G7, Intel Iris Xe Graphics G7 96EUs (8279 - 10664, n=20) | |
| Panasonic Toughbook 40 | |
| Acer Enduro Urban N3 EUN314 | |
| Dell Latitude 5420 Rugged-P85G | |
| PCMark 10 / Productivity | |
| Dell Latitude 5420 Rugged-P85G | |
| Durabook S14I | |
| Average Intel Core i7-1185G7, Intel Iris Xe Graphics G7 96EUs (5799 - 8770, n=20) | |
| Panasonic Toughbook FZ-55 MK2 | |
| Panasonic Toughbook 40 | |
| Acer Enduro Urban N3 EUN314 | |
| Getac S410 Gen 4 | |
| PCMark 10 / Digital Content Creation | |
| Panasonic Toughbook 40 | |
| Panasonic Toughbook FZ-55 MK2 | |
| Average Intel Core i7-1185G7, Intel Iris Xe Graphics G7 96EUs (4424 - 5684, n=20) | |
| Getac S410 Gen 4 | |
| Acer Enduro Urban N3 EUN314 | |
| Durabook S14I | |
| Dell Latitude 5420 Rugged-P85G | |
| CrossMark / Overall | |
| Average Intel Core i7-1185G7, Intel Iris Xe Graphics G7 96EUs (1233 - 1474, n=5) | |
| Panasonic Toughbook 40 | |
| Getac S410 Gen 4 | |
| CrossMark / Productivity | |
| Average Intel Core i7-1185G7, Intel Iris Xe Graphics G7 96EUs (1277 - 1506, n=5) | |
| Panasonic Toughbook 40 | |
| Getac S410 Gen 4 | |
| CrossMark / Creativity | |
| Average Intel Core i7-1185G7, Intel Iris Xe Graphics G7 96EUs (1291 - 1513, n=5) | |
| Panasonic Toughbook 40 | |
| Getac S410 Gen 4 | |
| CrossMark / Responsiveness | |
| Average Intel Core i7-1185G7, Intel Iris Xe Graphics G7 96EUs (969 - 1411, n=5) | |
| Panasonic Toughbook 40 | |
| Getac S410 Gen 4 | |
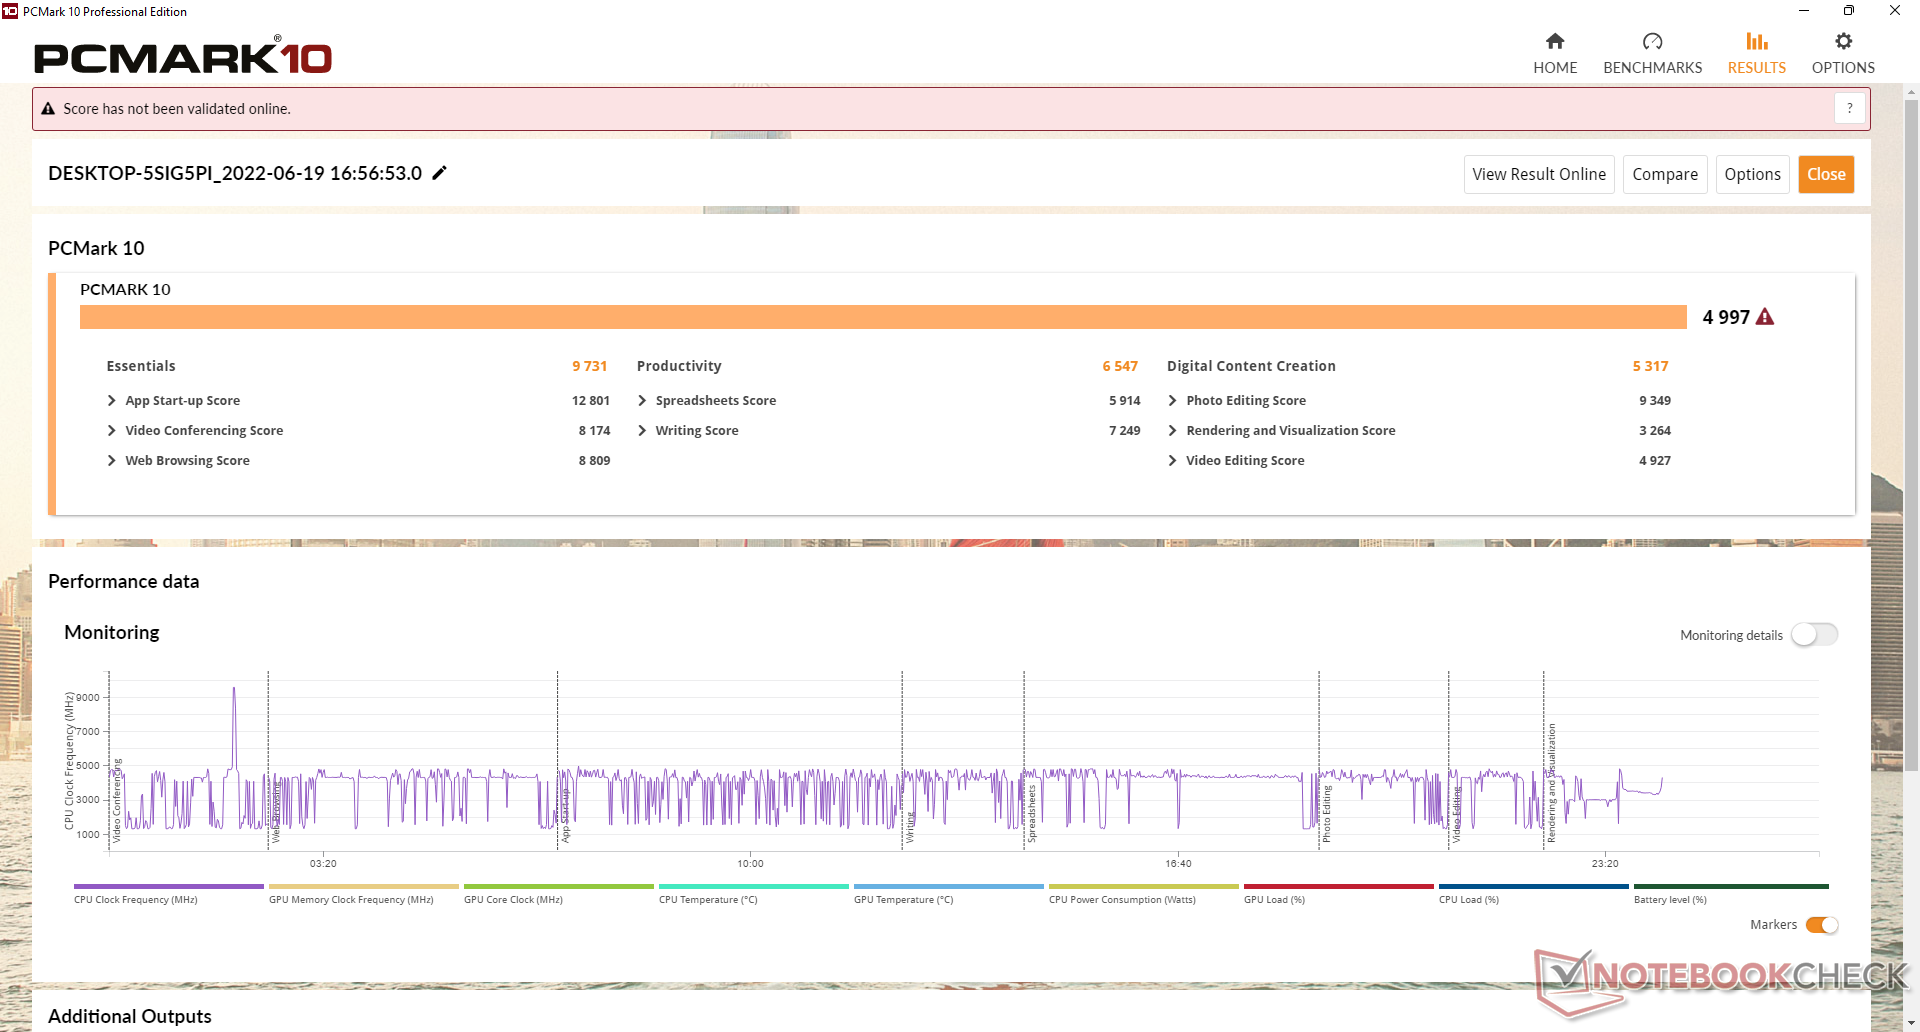
| PCMark 10 Score | 4997 points | |
Help | ||
| AIDA64 / Memory Copy | |
| Average Intel Core i7-1185G7 (36515 - 68450, n=20) | |
| Acer Enduro Urban N3 EUN314 | |
| Panasonic Toughbook FZ-55 MK2 | |
| Getac S410 Gen 4 | |
| Panasonic Toughbook 40 | |
| Durabook S14I | |
| AIDA64 / Memory Read | |
| Average Intel Core i7-1185G7 (38394 - 64291, n=20) | |
| Acer Enduro Urban N3 EUN314 | |
| Panasonic Toughbook FZ-55 MK2 | |
| Getac S410 Gen 4 | |
| Panasonic Toughbook 40 | |
| Durabook S14I | |
| AIDA64 / Memory Write | |
| Average Intel Core i7-1185G7 (37684 - 66873, n=20) | |
| Acer Enduro Urban N3 EUN314 | |
| Panasonic Toughbook FZ-55 MK2 | |
| Getac S410 Gen 4 | |
| Panasonic Toughbook 40 | |
| Durabook S14I | |
| AIDA64 / Memory Latency | |
| Panasonic Toughbook 40 | |
| Average Intel Core i7-1185G7 (78.3 - 117, n=22) | |
| Acer Enduro Urban N3 EUN314 | |
| Getac S410 Gen 4 | |
| Panasonic Toughbook FZ-55 MK2 | |
| Durabook S14I | |
* ... smaller is better
DPC延时
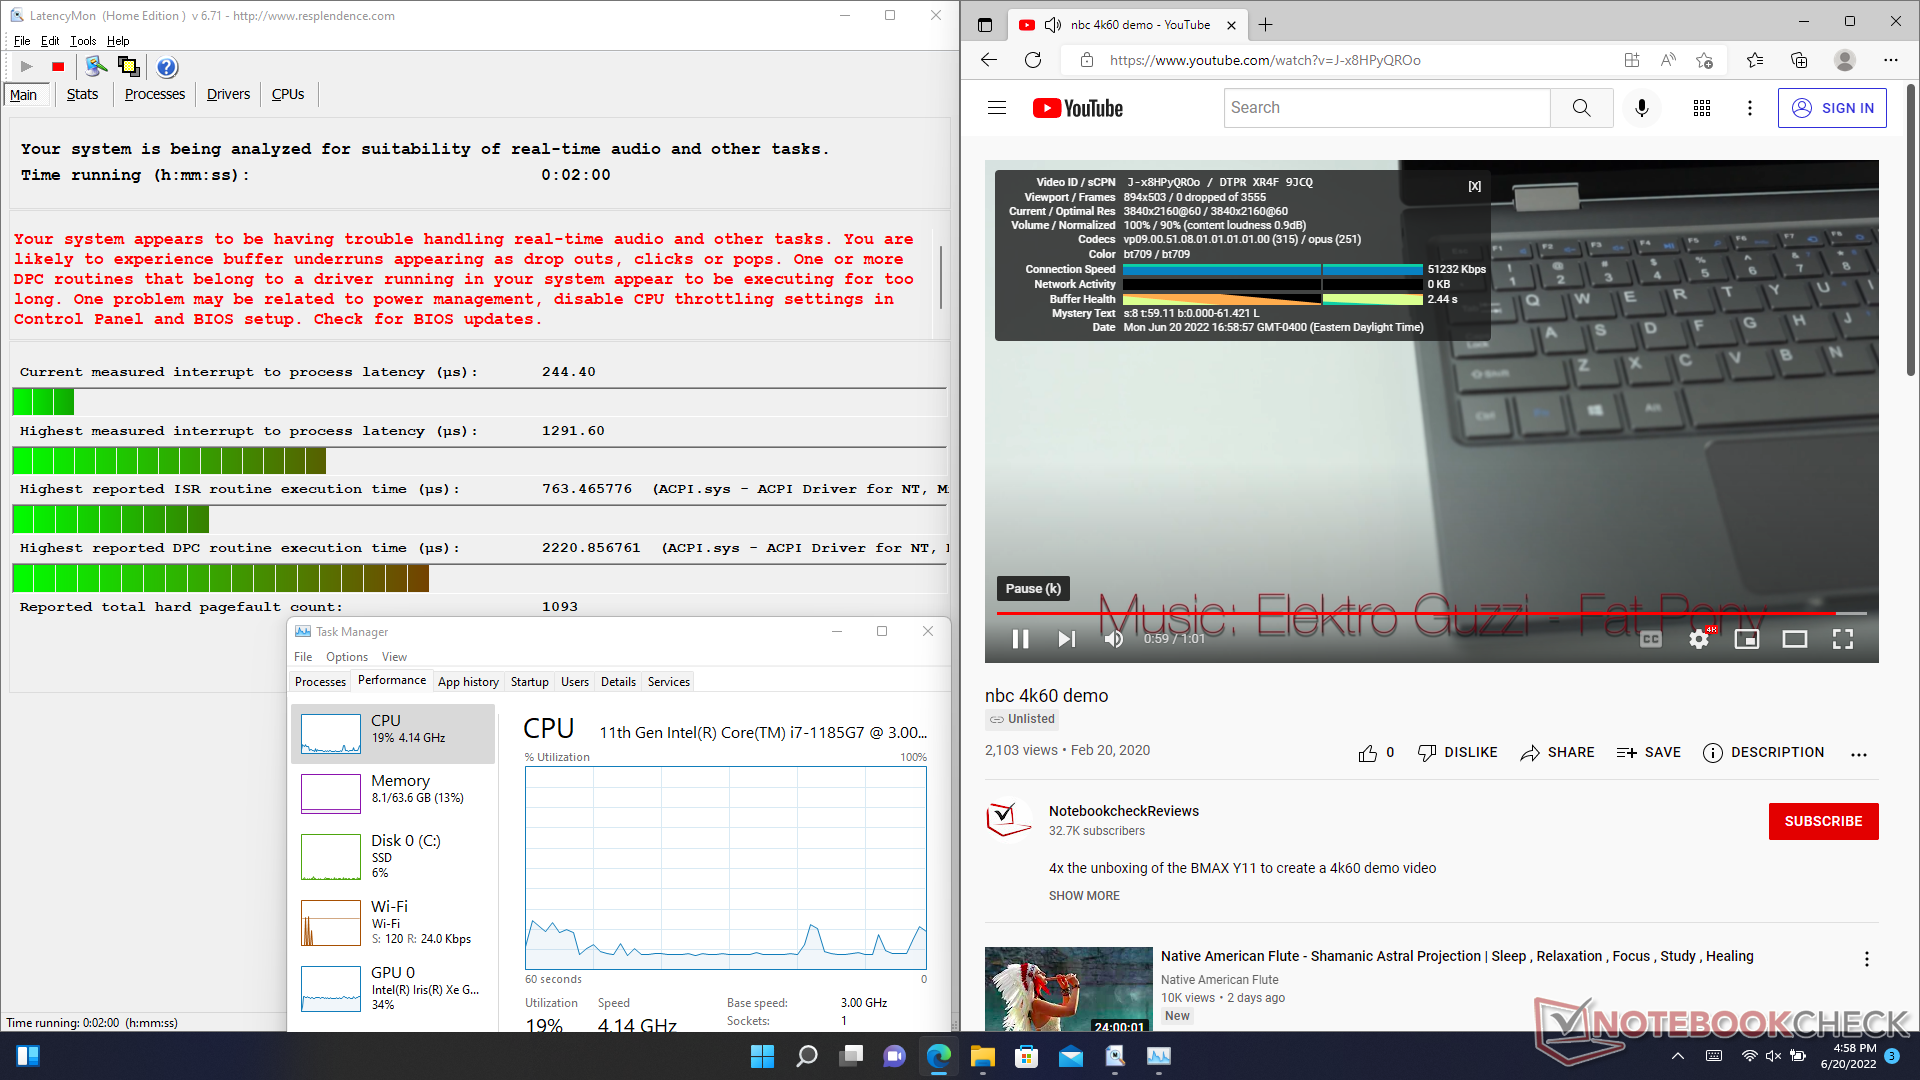
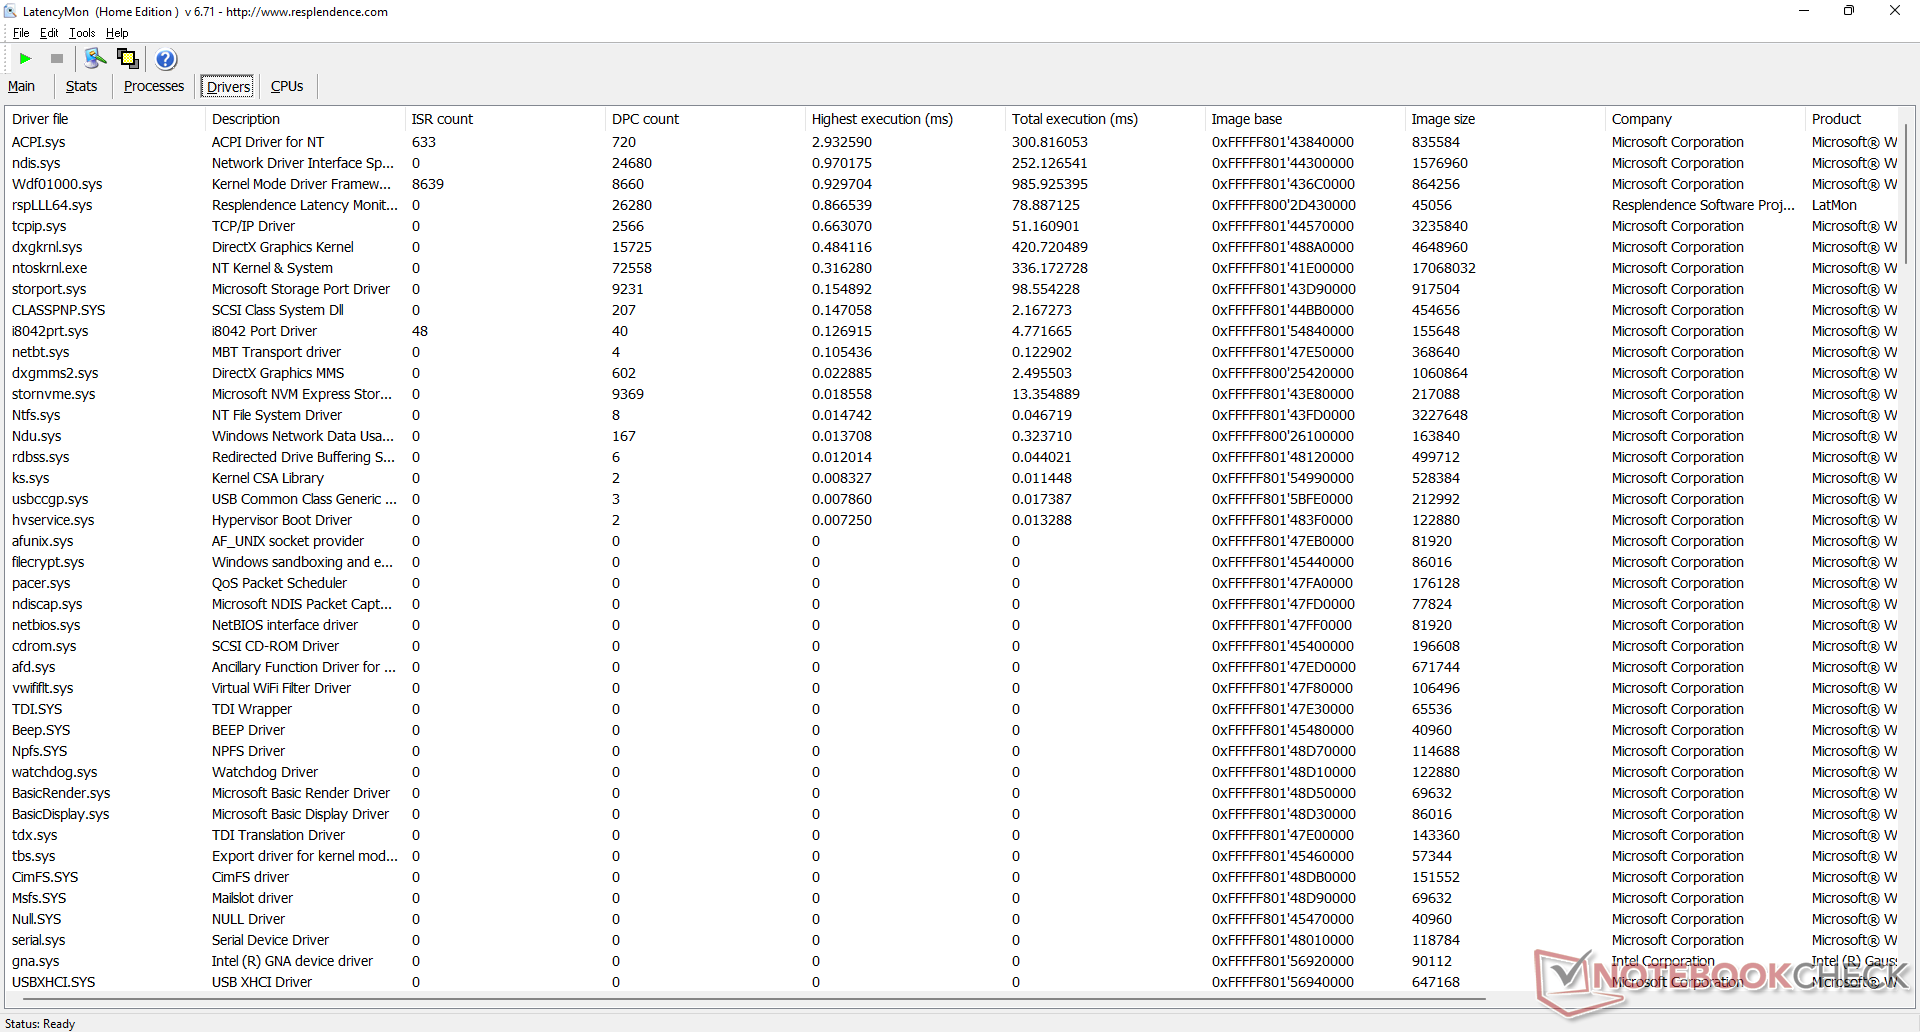
LatencyMon显示了在打开我们的主页的多个浏览器标签时的DPC问题。在60 FPS的情况下,4K视频播放很流畅,没有任何掉帧。
| DPC Latencies / LatencyMon - interrupt to process latency (max), Web, Youtube, Prime95 | |
| Acer Enduro Urban N3 EUN314 | |
| Panasonic Toughbook FZ-55 MK2 | |
| Durabook S14I | |
| Getac S410 Gen 4 | |
| Panasonic Toughbook 40 | |
* ... smaller is better
存储设备
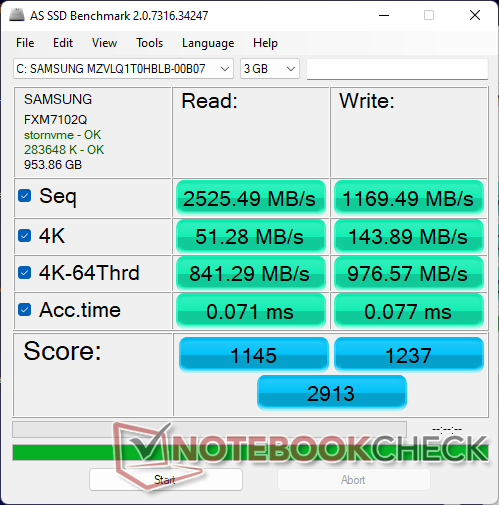
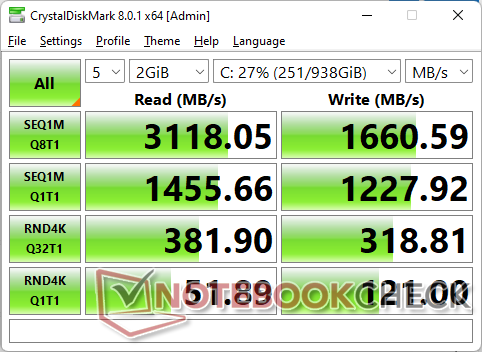
我们的测试设备配备了一个主 三星PM991PCIe3 x4 NVMe SSD。通过利用其中一个xPAK插槽,还可以安装一个可选的次级SATA驱动器。这两个驱动器都是通过快速释放的插槽连接到笔记本电脑上的。
我们设备中的固态硬盘无法长时间保持其最大传输速率,可能是由于散热不良。当循环运行DiskSpd时,传输率开始时高达3000MB/s,然后稳步下降,最终稳定在1700MB/s左右。

| Drive Performance rating - Percent | |
| Acer Enduro Urban N3 EUN314 | |
| Durabook S14I | |
| Panasonic Toughbook 40 | |
| Dell Latitude 5420 Rugged-P85G -8! | |
| Panasonic Toughbook FZ-55 MK2 | |
| Getac S410 Gen 4 | |
* ... smaller is better
Disk Throttling: DiskSpd Read Loop, Queue Depth 8
GPU性能
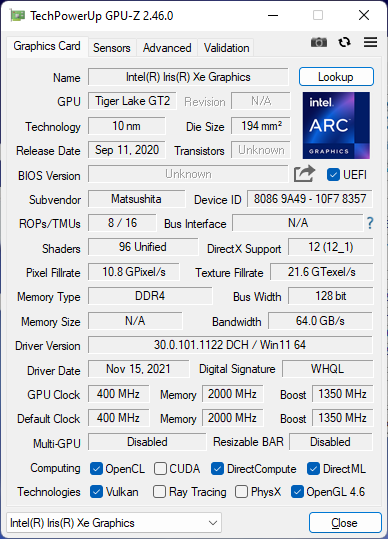
集成的 Iris Xe 96 EUs相对于其他具有相同GPU的笔记本电脑,它的性能是我们所期望的。无论是性能还是每瓦性能,都明显高于任何仍在运行旧版UHD 620图形处理器的坚固耐用的笔记本电脑。 UHD 620图形.
| 3DMark 11 - 1280x720 Performance GPU | |
| Lenovo Yoga 9 14IAP7 82LU0001US | |
| Acer Enduro Urban N3 EUN314 | |
| Panasonic Toughbook 40 | |
| Average Intel Iris Xe Graphics G7 96EUs (2867 - 7676, n=209) | |
| Dell Inspiron 14 7420 2-in-1 | |
| Dell Inspiron 14 7400 7415 2-in-1 | |
| Lenovo IdeaPad 5 Pro 14ACN6 | |
| Dell Latitude 14 5420-D2G5W | |
| Infinix INBook X2 | |
| Asus ZenBook 14 UX434FL-DB77 | |
| Acer Spin 3 SP314-54N-56S5 | |
| Durabook S15ABG2 | |
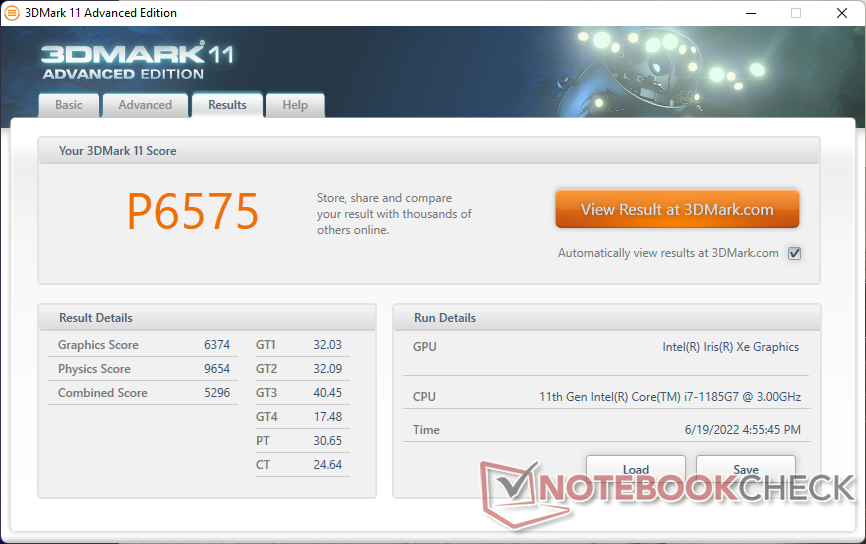
| 3DMark 11 Performance | 6575 points | |
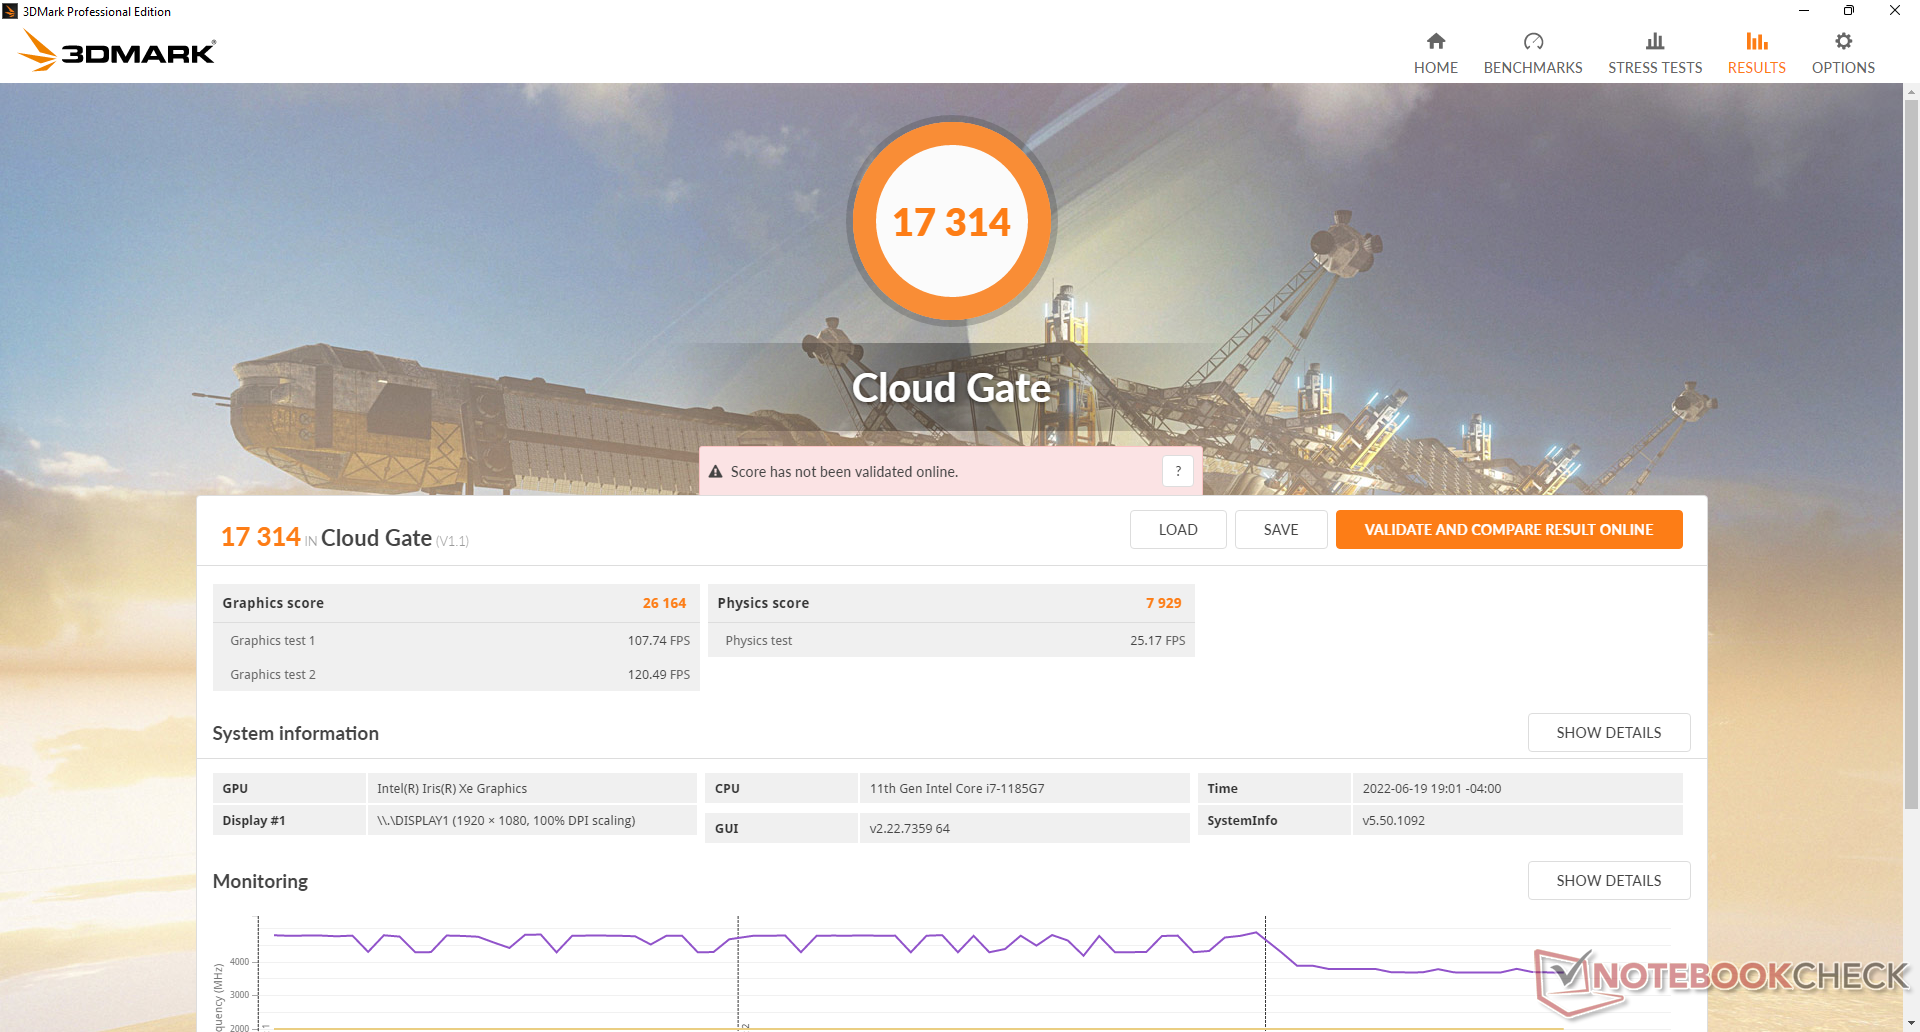
| 3DMark Cloud Gate Standard Score | 17314 points | |
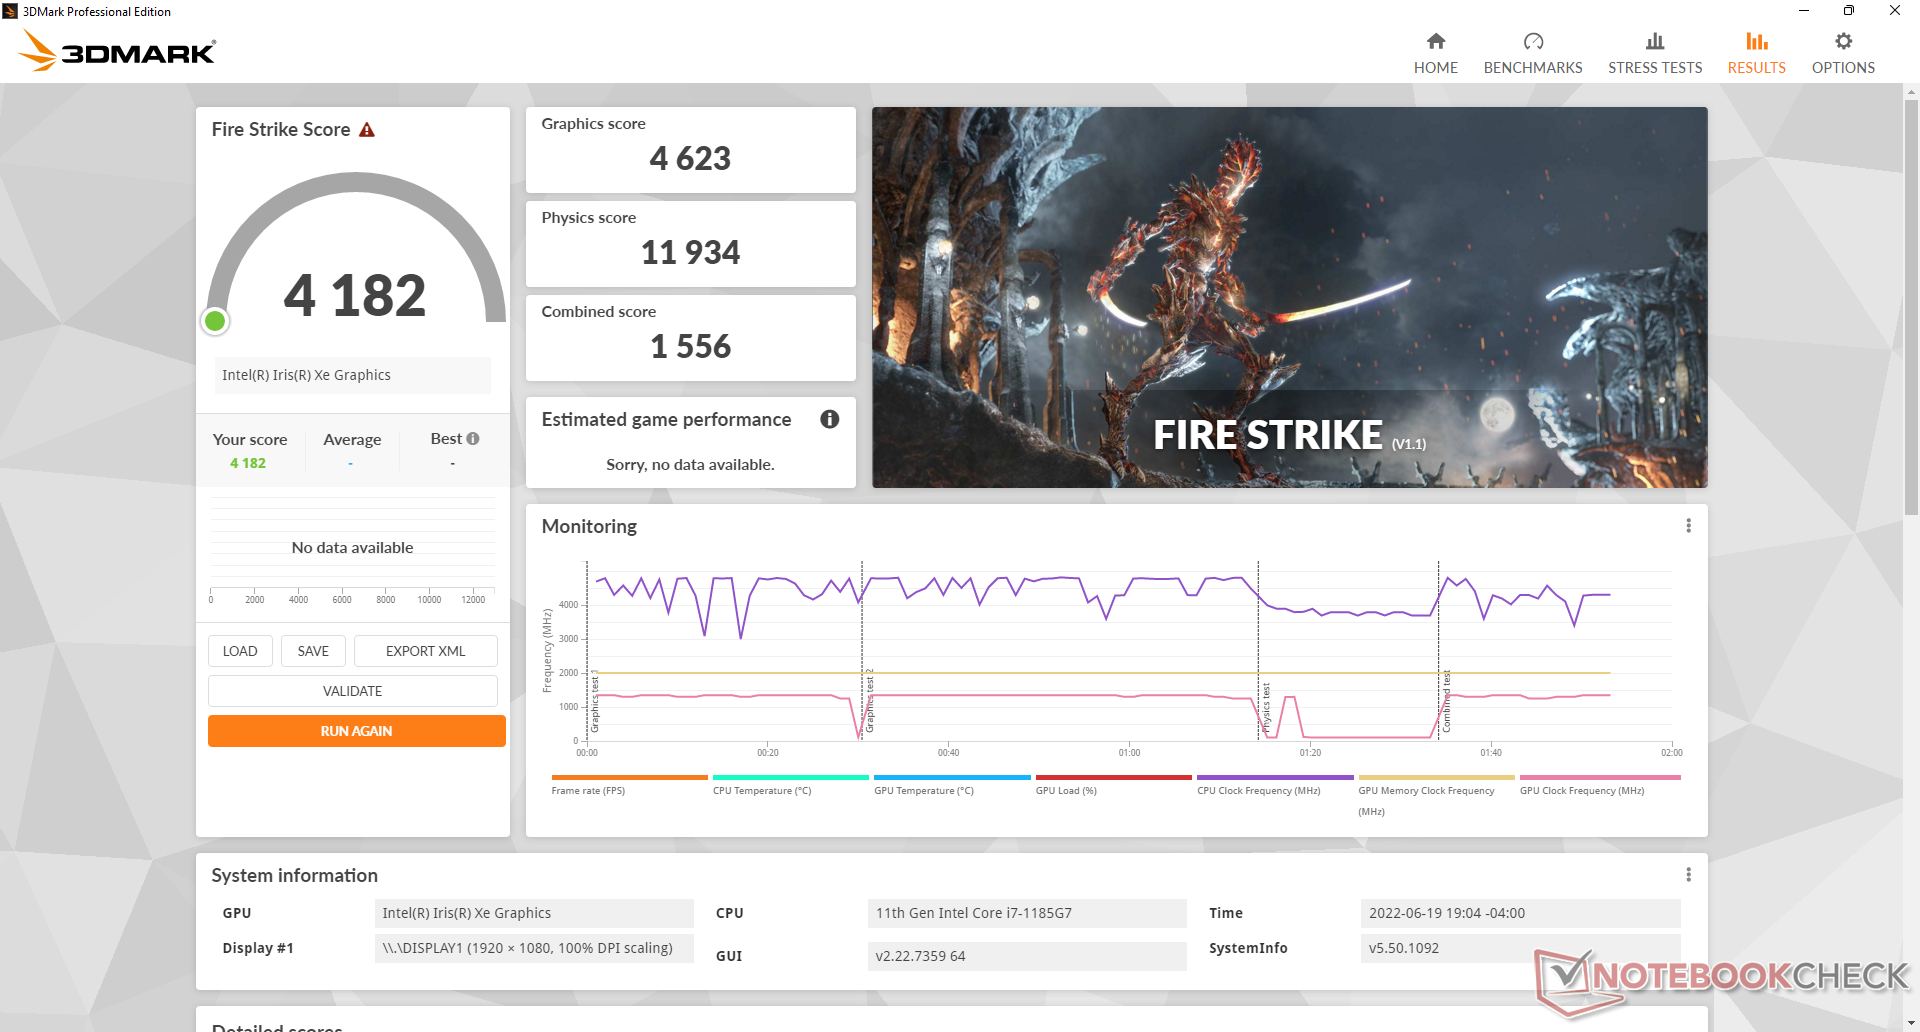
| 3DMark Fire Strike Score | 4182 points | |
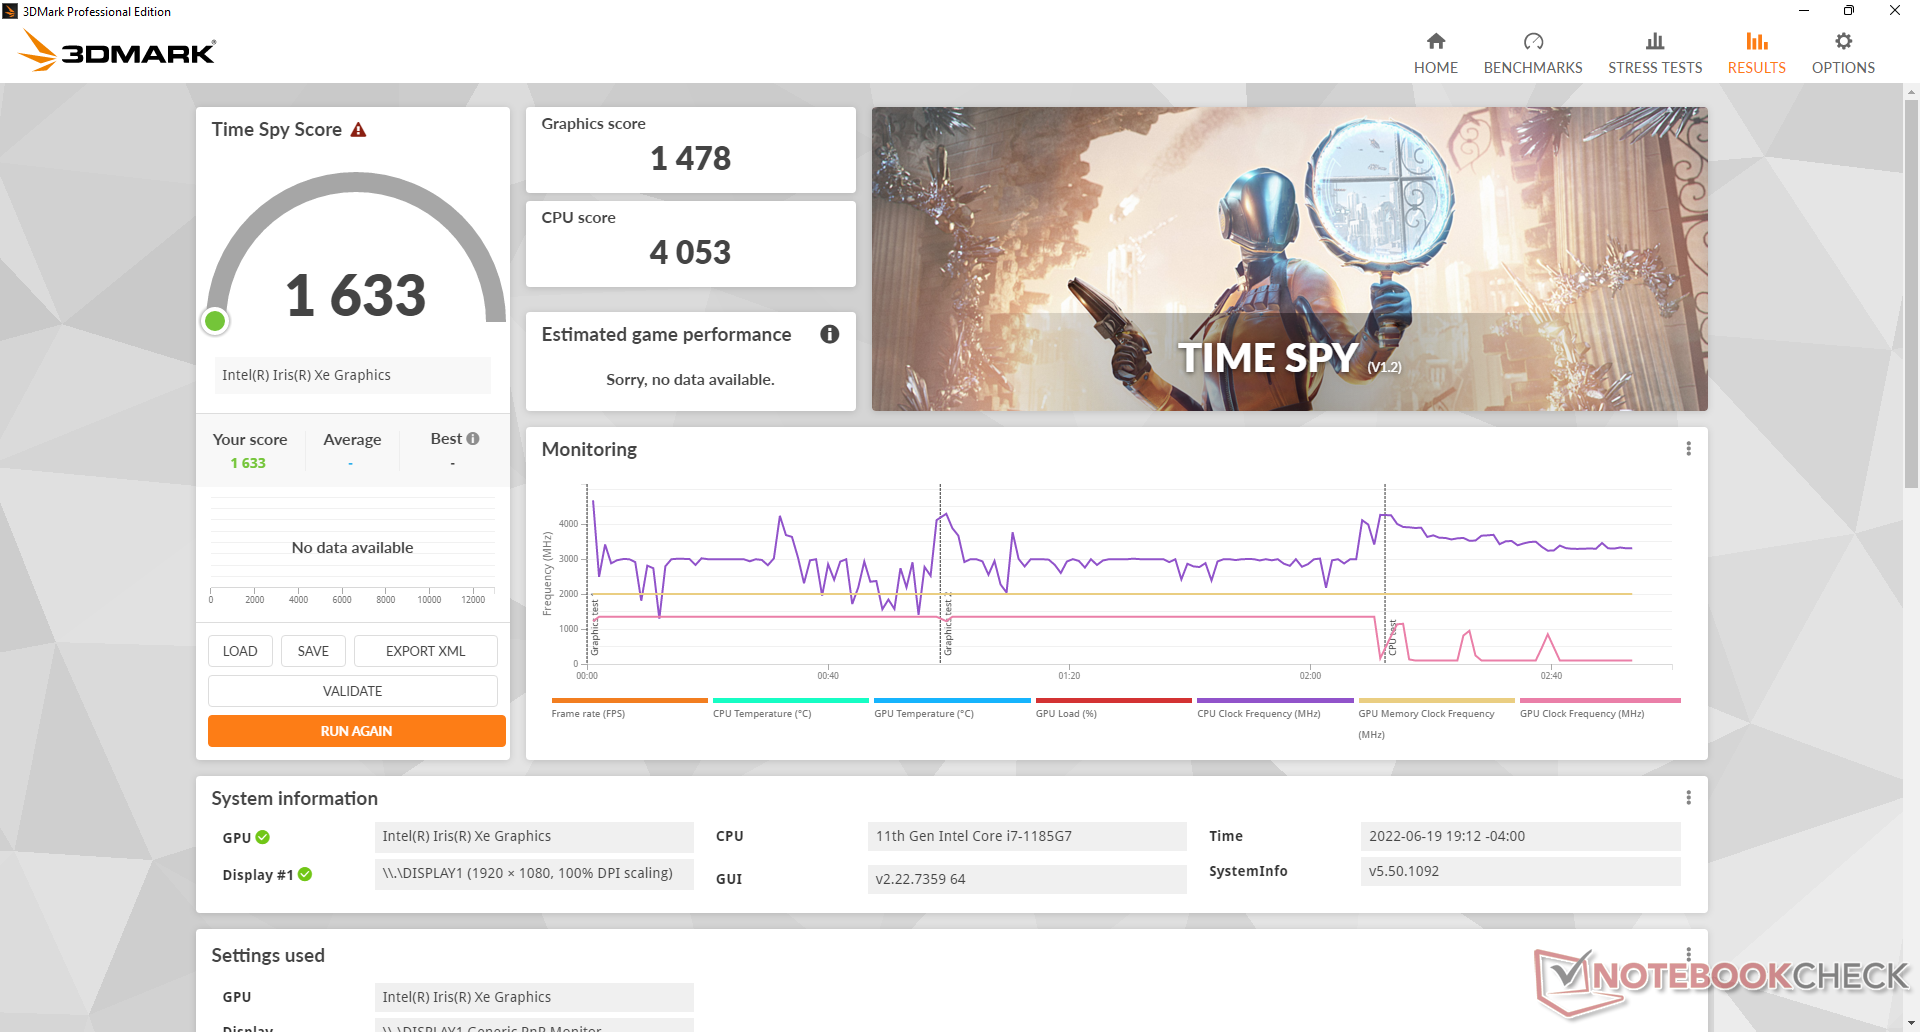
| 3DMark Time Spy Score | 1633 points | |
Help | ||
Witcher 3 FPS Chart
| low | med. | high | ultra | |
|---|---|---|---|---|
| The Witcher 3 (2015) | 85.9 | 54.2 | 29.5 | 14.8 |
| Dota 2 Reborn (2015) | 112.9 | 104.6 | 62.4 | 55.5 |
| Final Fantasy XV Benchmark (2018) | 40.1 | 21.3 | 15.5 | |
| X-Plane 11.11 (2018) | 24.8 | 23.3 | 25.9 | |
| Cyberpunk 2077 1.6 (2022) | 21.1 | 17.2 | 13 | 10.5 |
排放
系统噪音
根据我们的经验,即使在桌面上空转时,风扇始终处于活跃状态,音量为26 dB(A),而静音背景为22.8 dB(A)。当把耳朵放在键盘按键附近时,我们也能注意到一些电子噪音或线圈的呜呜声。值得庆幸的是,这些被动噪音并不响亮,在大多数真实世界的场景中不会引起任何关注。
运行3DMark 06的第一个基准场景会引起37.6 dB(A)的风扇噪音,比我们在Toughbook FZ-55 MK2上观察到的要大要小。 Toughbook FZ-55 MK2和Getac S410 Gen 4,分别。在运行高要求的负载时,预计会有这种水平的噪音。
Noise level
| Idle |
| 26 / 26 / 26 dB(A) |
| Load |
| 37.6 / 40.3 dB(A) |
 | ||
30 dB silent 40 dB(A) audible 50 dB(A) loud |
||
min: | ||
| Panasonic Toughbook 40 Iris Xe G7 96EUs, i7-1185G7, Samsung PM991 MZVLQ1T0HALB | Panasonic Toughbook FZ-55 MK2 Iris Xe G7 96EUs, i7-1185G7, Toshiba KIOXIA KBG4AZNV512G M.2 2280 OPAL | Getac S410 Gen 4 Iris Xe G7 96EUs, i7-1185G7, SSSTC CA5-8D256 | Dell Latitude 5420 Rugged-P85G Radeon RX 540, i7-8650U, SK hynix PC401 NVMe 500 GB | Acer Enduro Urban N3 EUN314 Iris Xe G7 96EUs, i7-1165G7, Samsung PM991 MZVLQ1T0HALB | Durabook S14I Iris Xe G7 96EUs, i7-1165G7, UDinfo M2P M2P80DE512GBAEP | |
|---|---|---|---|---|---|---|
| Noise | 8% | -3% | -4% | 8% | -3% | |
| off / environment * (dB) | 22.8 | 23.8 -4% | 23.3 -2% | 28.3 -24% | 23.8 -4% | 25.2 -11% |
| Idle Minimum * (dB) | 26 | 24 8% | 23.5 10% | 28.3 -9% | 24.1 7% | 25.2 3% |
| Idle Average * (dB) | 26 | 24 8% | 23.5 10% | 28.3 -9% | 24.1 7% | 25.2 3% |
| Idle Maximum * (dB) | 26 | 24 8% | 28 -8% | 28.3 -9% | 24.1 7% | 34.5 -33% |
| Load Average * (dB) | 37.6 | 26.7 29% | 42.8 -14% | 29.9 20% | 27.9 26% | 34.5 8% |
| Witcher 3 ultra * (dB) | 37.8 | 42.3 -12% | 35.7 6% | |||
| Load Maximum * (dB) | 40.3 | 41.7 -3% | 42.6 -6% | 38 6% | 38.6 4% | 36.2 10% |
* ... smaller is better
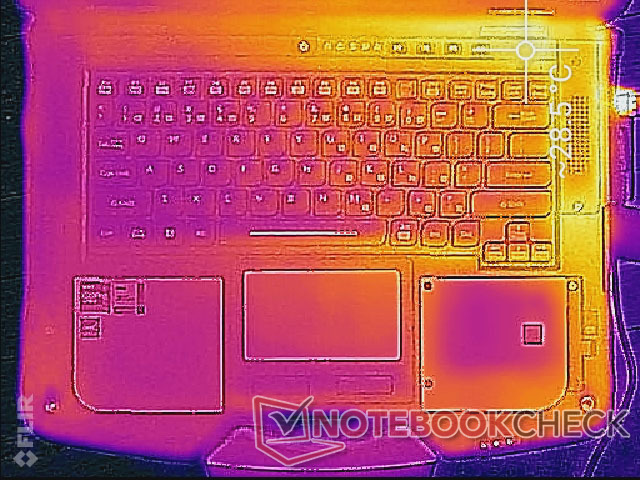
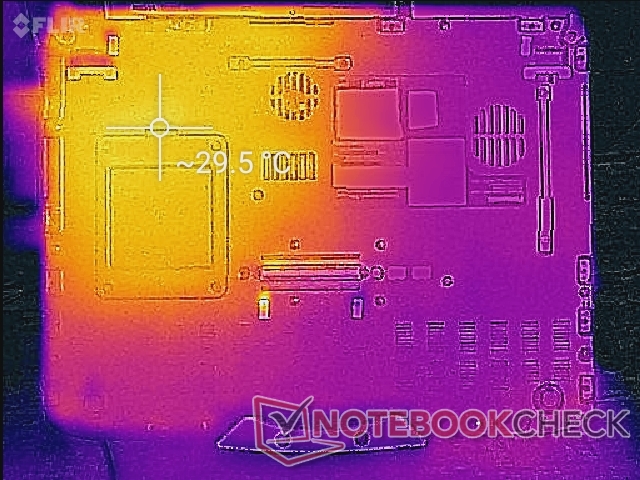
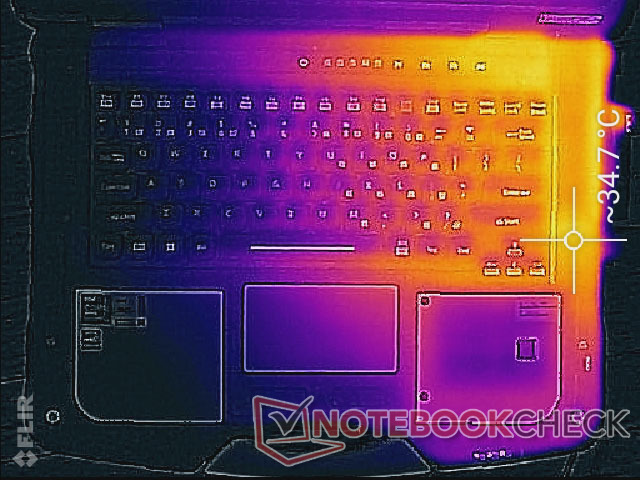
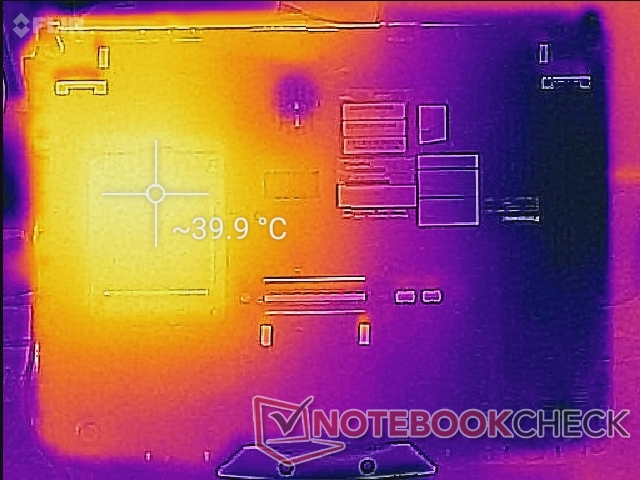
温度
由于采用了酷睿U系列CPU和厚实的机箱设计,表面温度通常很低。毕竟,这与许多更薄的消费者笔记本电脑上的CPU相同。在长时间运行重负荷后,顶部和底部的热点可以分别达到29℃和40℃。
由于CPU和冷却解决方案在内部的定位方式,Toughbook模型的右半部分总是比左半部分更热。
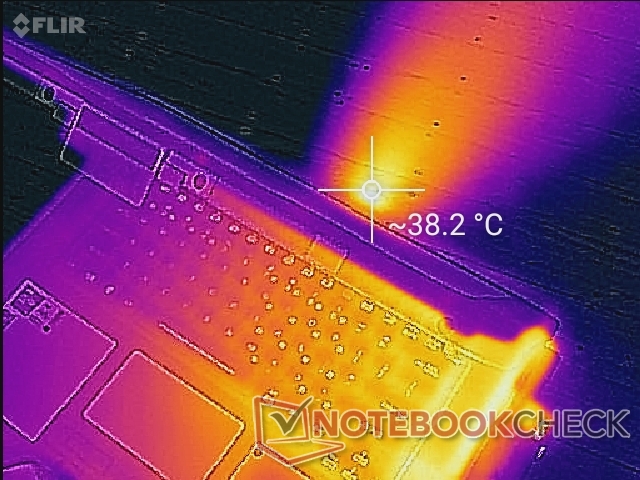
(+) The maximum temperature on the upper side is 35.6 °C / 96 F, compared to the average of 34.3 °C / 94 F, ranging from 21.2 to 62.5 °C for the class Office.
(±) The bottom heats up to a maximum of 40 °C / 104 F, compared to the average of 36.8 °C / 98 F
(+) In idle usage, the average temperature for the upper side is 27.1 °C / 81 F, compared to the device average of 29.5 °C / 85 F.
(+) The palmrests and touchpad are cooler than skin temperature with a maximum of 29 °C / 84.2 F and are therefore cool to the touch.
(±) The average temperature of the palmrest area of similar devices was 27.5 °C / 81.5 F (-1.5 °C / -2.7 F).
| Panasonic Toughbook 40 Intel Core i7-1185G7, Intel Iris Xe Graphics G7 96EUs | Panasonic Toughbook FZ-55 MK2 Intel Core i7-1185G7, Intel Iris Xe Graphics G7 96EUs | Getac S410 Gen 4 Intel Core i7-1185G7, Intel Iris Xe Graphics G7 96EUs | Dell Latitude 5420 Rugged-P85G Intel Core i7-8650U, AMD Radeon RX 540 | Acer Enduro Urban N3 EUN314 Intel Core i7-1165G7, Intel Iris Xe Graphics G7 96EUs | Durabook S14I Intel Core i7-1165G7, Intel Iris Xe Graphics G7 96EUs | |
|---|---|---|---|---|---|---|
| Heat | -8% | -13% | -11% | -4% | -7% | |
| Maximum Upper Side * (°C) | 35.6 | 36.2 -2% | 36 -1% | 42.2 -19% | 37.8 -6% | 36.4 -2% |
| Maximum Bottom * (°C) | 40 | 42.2 -6% | 46.8 -17% | 42 -5% | 45.8 -15% | 38.6 3% |
| Idle Upper Side * (°C) | 28.6 | 31 -8% | 30 -5% | 31.6 -10% | 26.4 8% | 32.6 -14% |
| Idle Bottom * (°C) | 29.4 | 34 -16% | 38.2 -30% | 31.8 -8% | 30.2 -3% | 33.8 -15% |
* ... smaller is better
压力测试
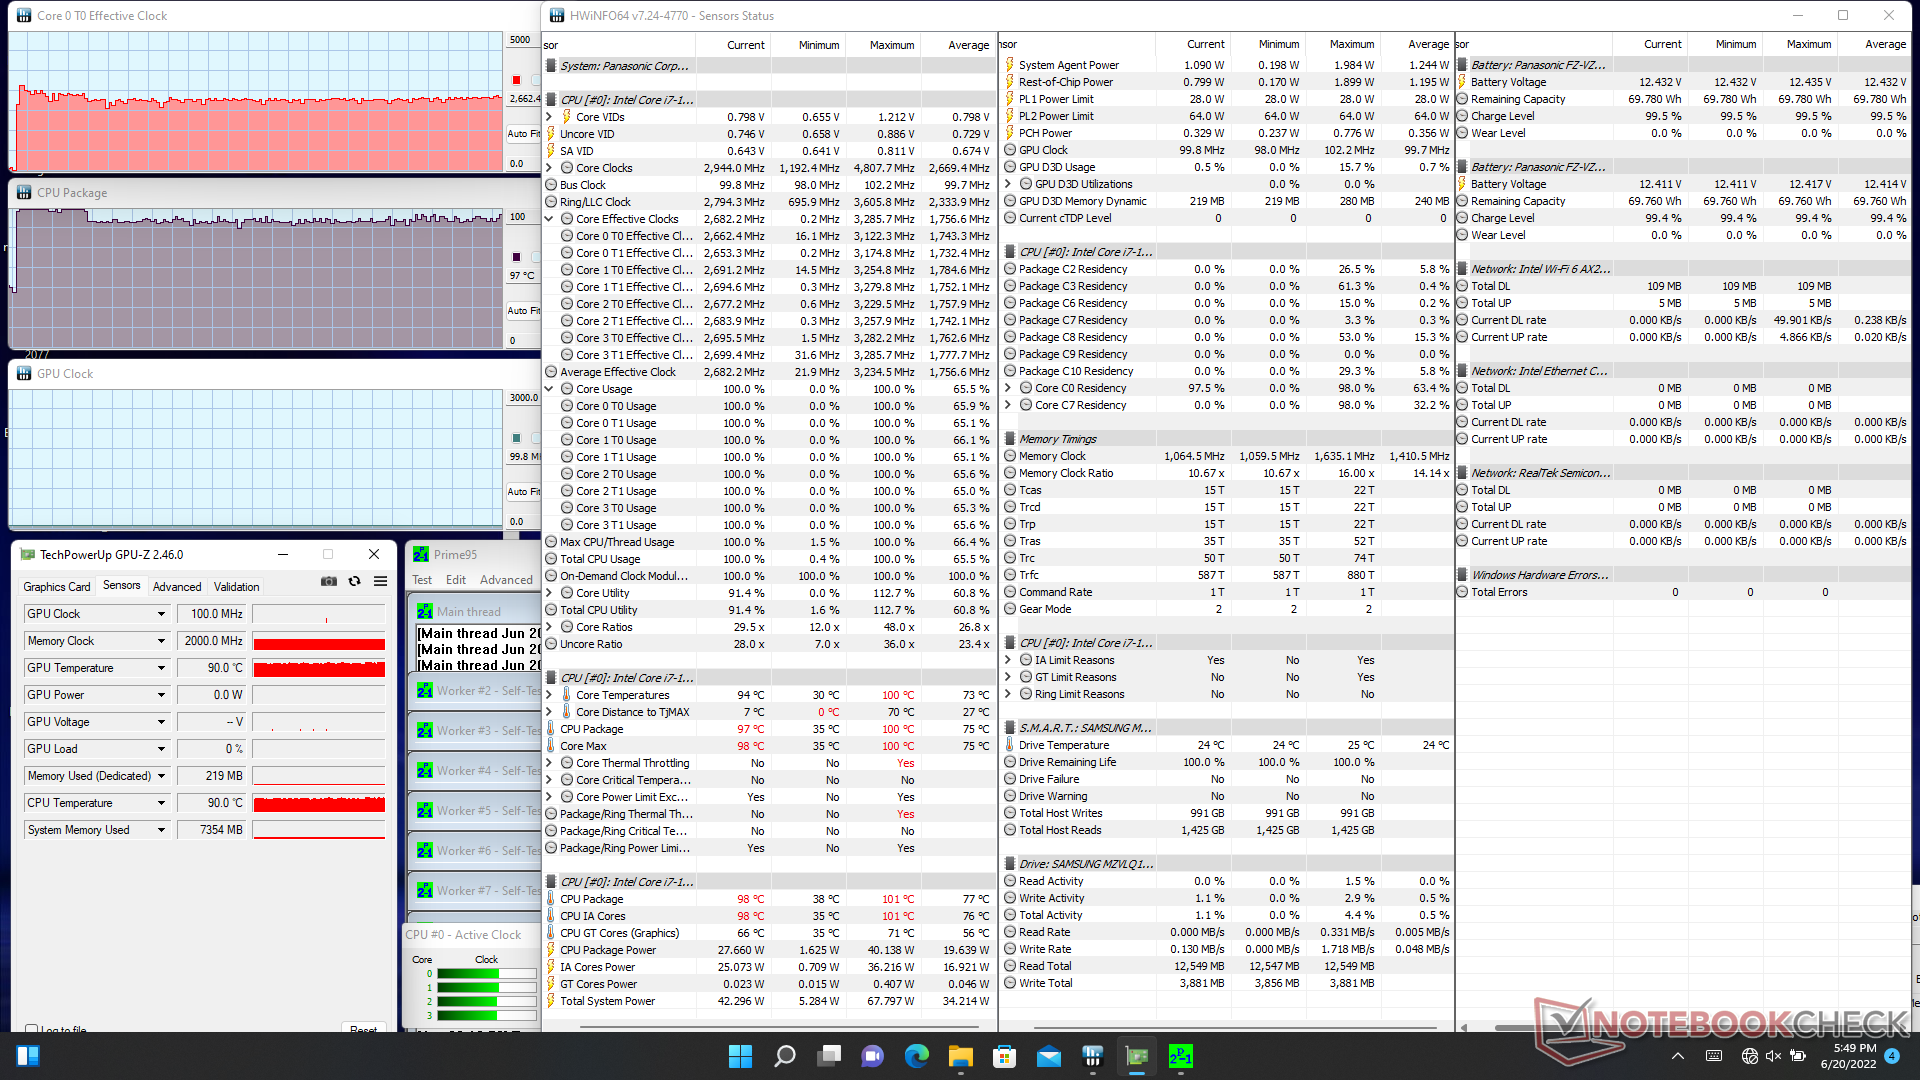
当运行Prime95对CPU施加压力时,时钟频率和核心温度会在一瞬间分别飙升到3.1GHz和100C,然后稳步下降到2.6和~95C。 Durabook S14I上进行同样的测试,尽管时钟频率较低,为1.8GHz,但Core i7-1165G7 CPU的稳定核心温度要低得多,为63C。很明显,我们的松下模型更倾向于CPU的性能,即使这意味着在这个过程中处理器的温度更高。
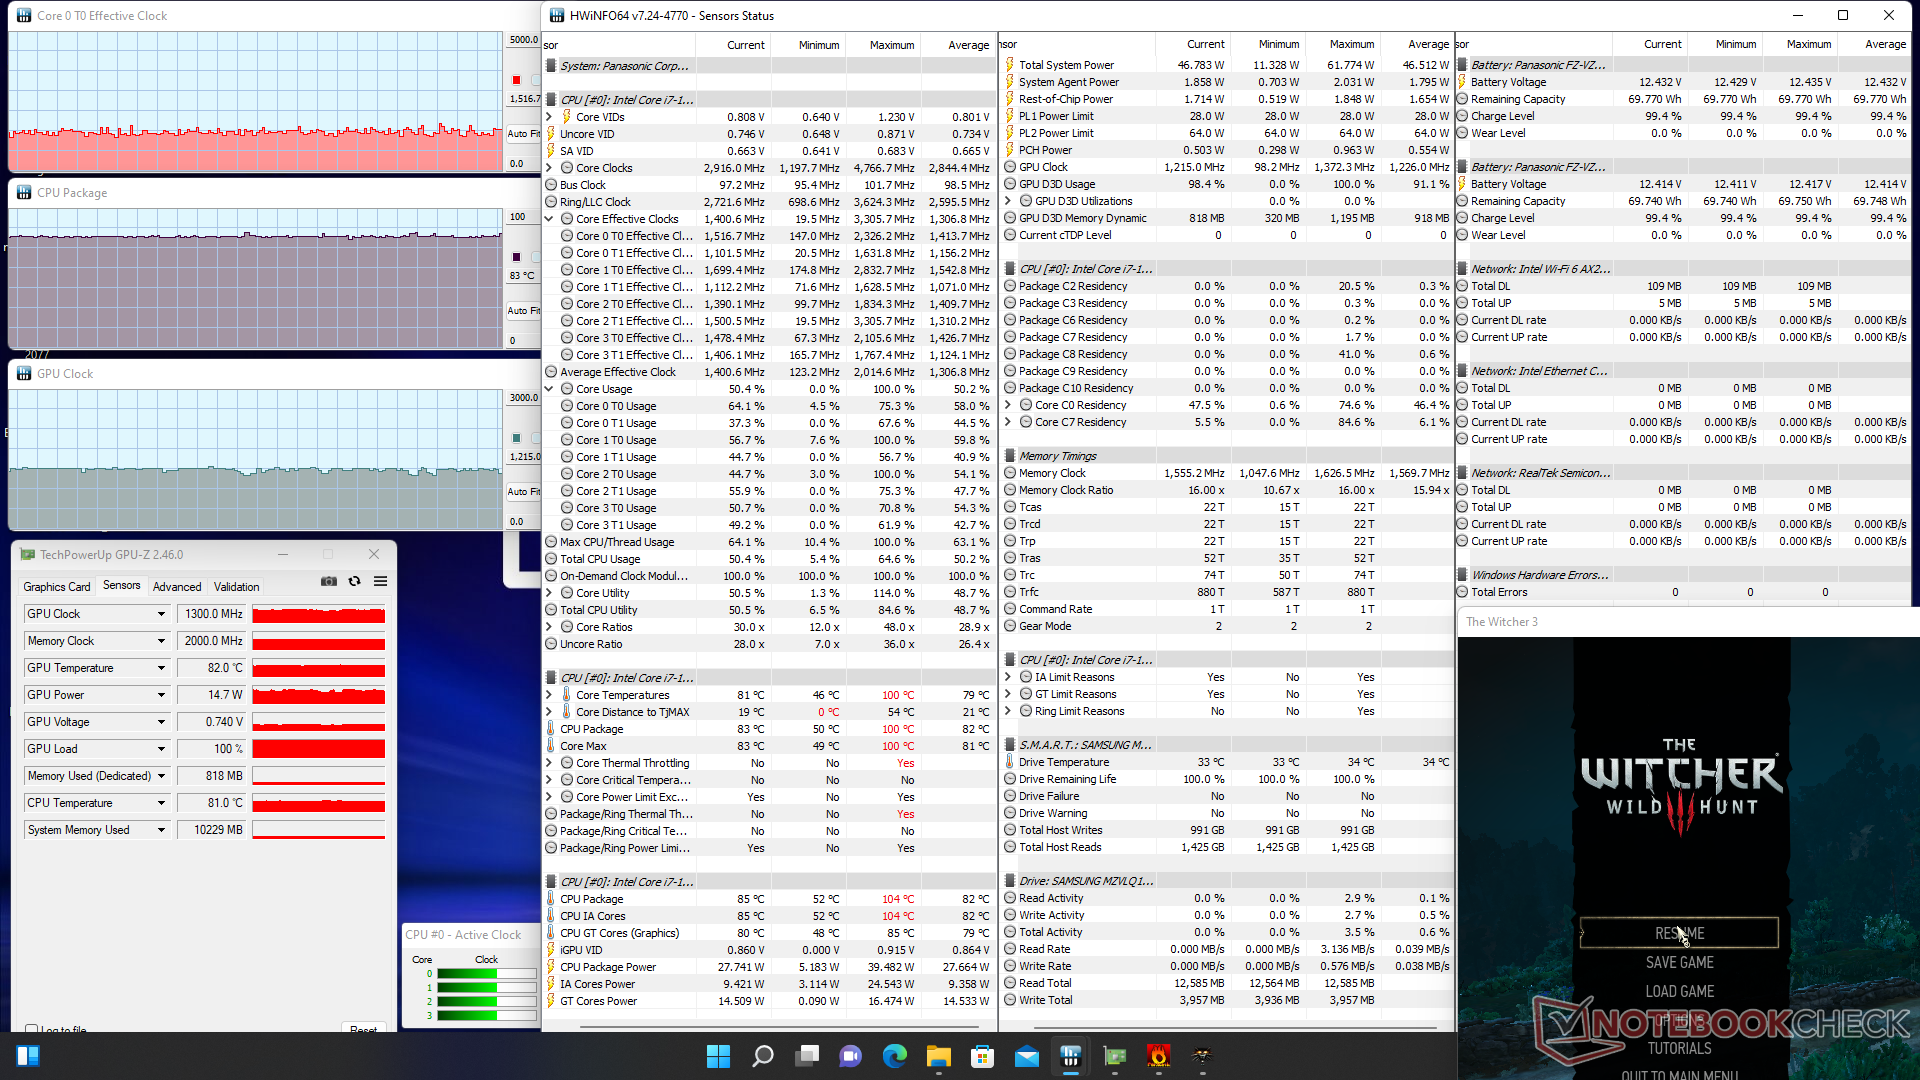
当运行 Witcher 3 代表苛刻的负载时,处理器温度将稳定在83摄氏度,这比上述Durabook(68摄氏度)更热,但比Getac S410 Gen 4的温度更低。 Getac S410 Gen 4(95 C).
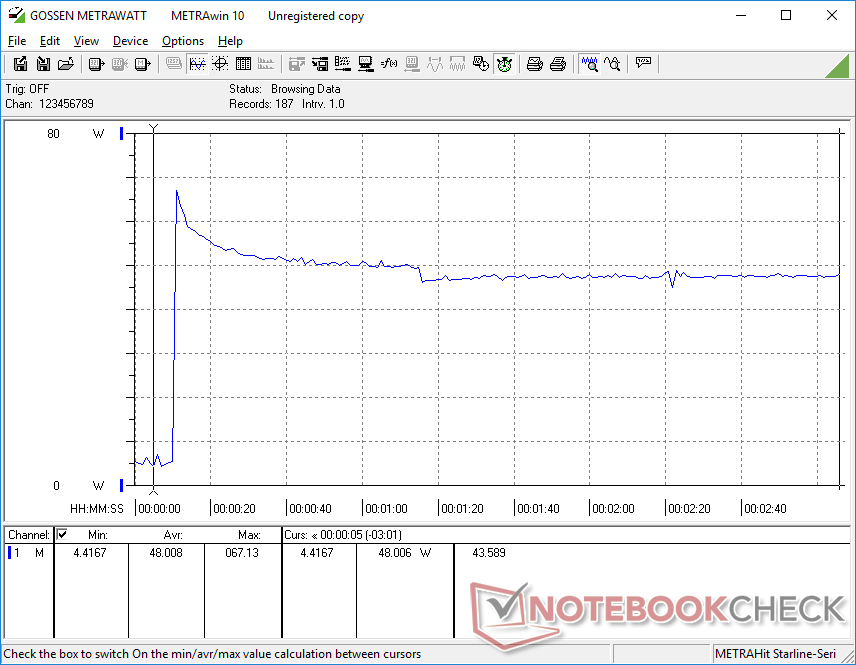
用电池供电运行不会限制性能。在电池上进行的3DMark 11测试将返回与在主电源上运行相似的分数。
| CPU时钟(GHz) | GPU时钟(MHz) | CPU平均温度(°C) | |
| 系统空闲 | -- | -- | 38 |
| Prime95压力 | 2.7 | -- | 97 |
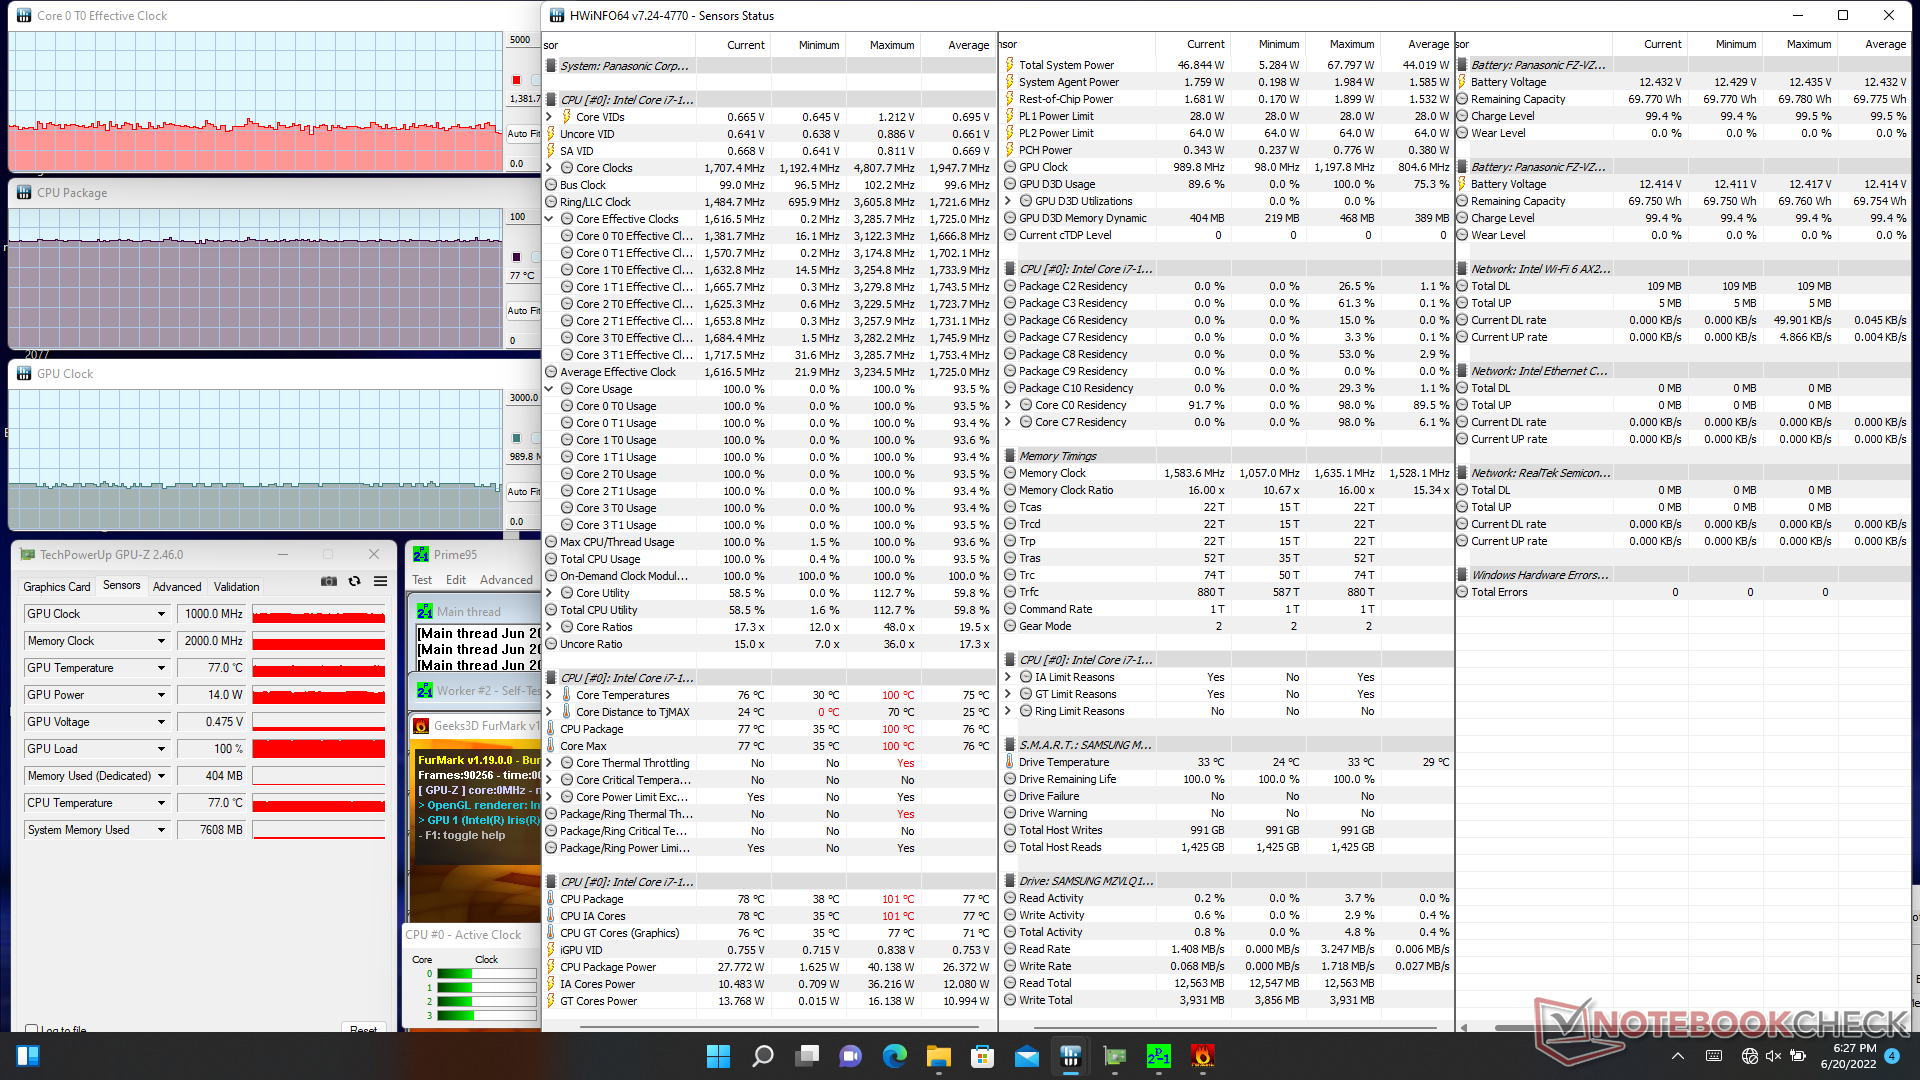
| Prime95 + FurMark 压力 | 1.4 - 1.6 | 1000 | 77 |
| Witcher 3 应力 | 1.4 - 1.6 | 1300 | 83 |
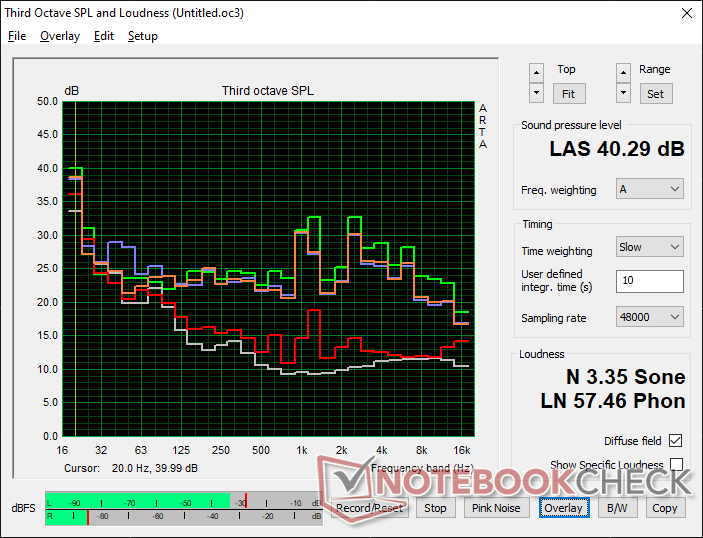
发言人
Panasonic Toughbook 40 audio analysis
(±) | speaker loudness is average but good (77.5 dB)
Bass 100 - 315 Hz
(±) | reduced bass - on average 11.5% lower than median
(±) | linearity of bass is average (11.6% delta to prev. frequency)
Mids 400 - 2000 Hz
(+) | balanced mids - only 3.3% away from median
(+) | mids are linear (5.5% delta to prev. frequency)
Highs 2 - 16 kHz
(+) | balanced highs - only 2.5% away from median
(+) | highs are linear (4.8% delta to prev. frequency)
Overall 100 - 16.000 Hz
(+) | overall sound is linear (13.1% difference to median)
Compared to same class
» 7% of all tested devices in this class were better, 2% similar, 92% worse
» The best had a delta of 7%, average was 21%, worst was 53%
Compared to all devices tested
» 13% of all tested devices were better, 3% similar, 84% worse
» The best had a delta of 4%, average was 24%, worst was 134%
Apple MacBook Pro 16 2021 M1 Pro audio analysis
(+) | speakers can play relatively loud (84.7 dB)
Bass 100 - 315 Hz
(+) | good bass - only 3.8% away from median
(+) | bass is linear (5.2% delta to prev. frequency)
Mids 400 - 2000 Hz
(+) | balanced mids - only 1.3% away from median
(+) | mids are linear (2.1% delta to prev. frequency)
Highs 2 - 16 kHz
(+) | balanced highs - only 1.9% away from median
(+) | highs are linear (2.7% delta to prev. frequency)
Overall 100 - 16.000 Hz
(+) | overall sound is linear (4.6% difference to median)
Compared to same class
» 0% of all tested devices in this class were better, 0% similar, 100% worse
» The best had a delta of 5%, average was 17%, worst was 45%
Compared to all devices tested
» 0% of all tested devices were better, 0% similar, 100% worse
» The best had a delta of 4%, average was 24%, worst was 134%
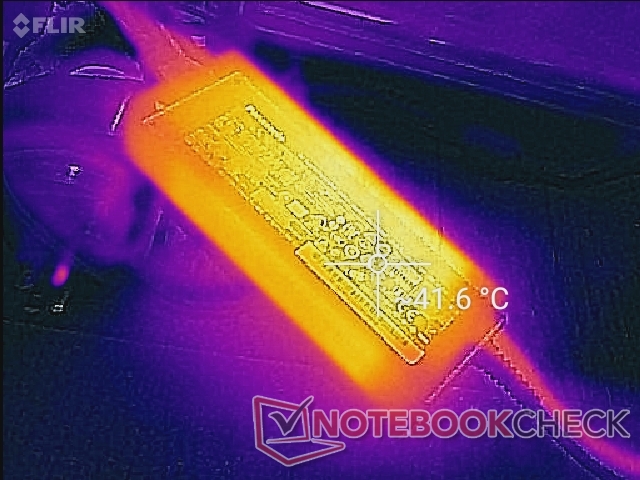
能源管理
消耗功率
在桌面上空转消耗4瓦至14瓦,这取决于亮度水平和电源配置文件。仅仅是将亮度从0%提高到100%,就需要大约8瓦,这是因为1400尼特的明亮背光。
负载下的功耗与其他采用第11代酷睿U系列CPU的坚固耐用机型类似,包括松下自己的Toughbook FZ-55 MK2。Tiger Lake-U系列在每瓦性能方面比老一代的耐用机型有巨大的提升,如 Latitude 5420采用Kaby Lake-R和Radeon RX 540图形。
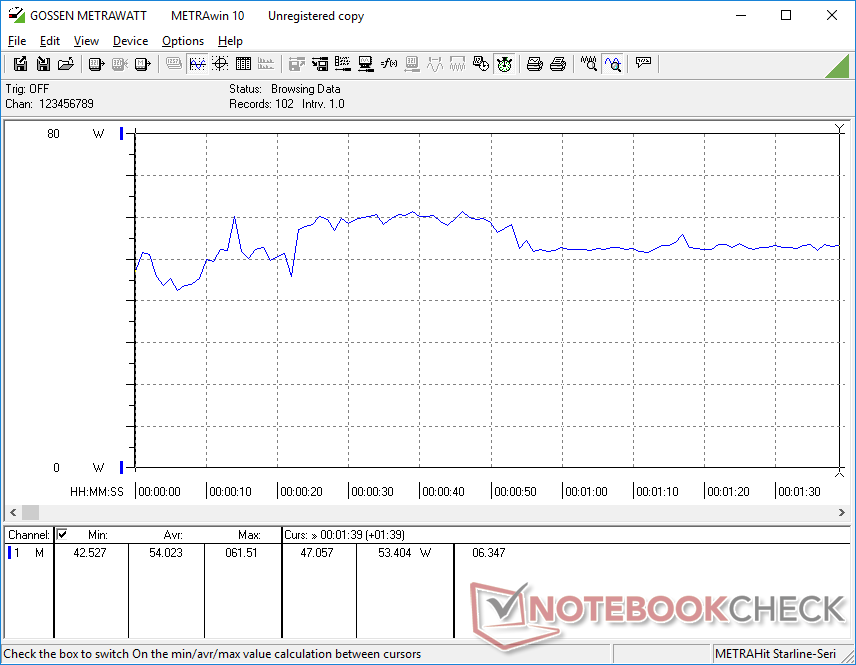
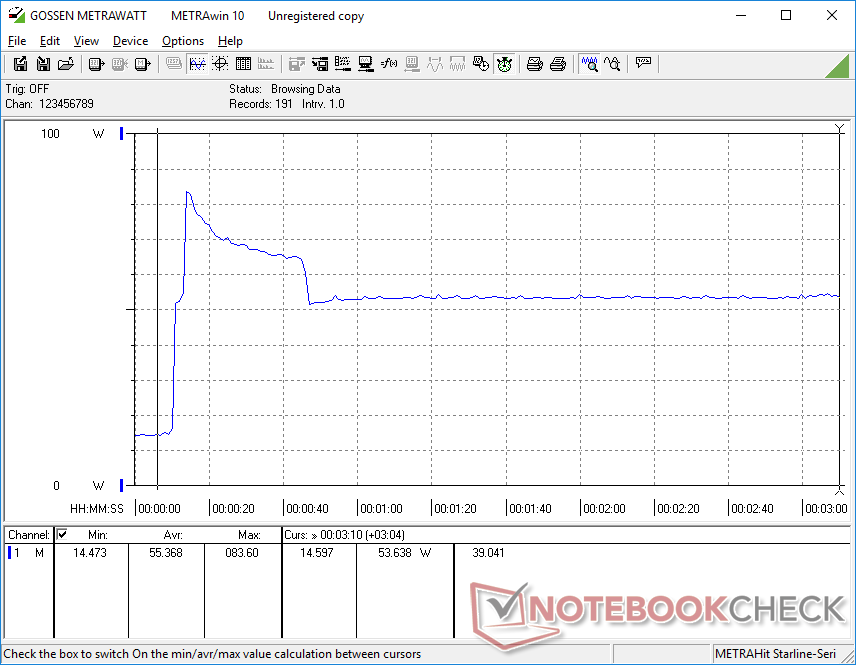
在运行Prime95和FurMark压力时,我们能够从小型(约14 x 5.4 x 3.1厘米)的110瓦交流适配器中记录到83.6瓦的最大消耗。如我们下面的截图所示,由于散热限制,这个峰值是短暂的。
| Off / Standby | |
| Idle | |
| Load |
|
Key:
min: | |
| Panasonic Toughbook 40 i7-1185G7, Iris Xe G7 96EUs, Samsung PM991 MZVLQ1T0HALB, IPS, 1920x1080, 14" | Panasonic Toughbook FZ-55 MK2 i7-1185G7, Iris Xe G7 96EUs, Toshiba KIOXIA KBG4AZNV512G M.2 2280 OPAL, IPS, 1920x1080, 14" | Getac S410 Gen 4 i7-1185G7, Iris Xe G7 96EUs, SSSTC CA5-8D256, IPS, 1920x1080, 14" | Dell Latitude 5420 Rugged-P85G i7-8650U, Radeon RX 540, SK hynix PC401 NVMe 500 GB, IPS, 1920x1080, 14" | Acer Enduro Urban N3 EUN314 i7-1165G7, Iris Xe G7 96EUs, Samsung PM991 MZVLQ1T0HALB, IPS, 1920x1080, 14" | Durabook S14I i7-1165G7, Iris Xe G7 96EUs, UDinfo M2P M2P80DE512GBAEP, TN, 1920x1080, 14" | |
|---|---|---|---|---|---|---|
| Power Consumption | 12% | -11% | -16% | 34% | -11% | |
| Idle Minimum * (Watt) | 4.9 | 3.5 29% | 8.3 -69% | 4.8 2% | 3.8 22% | 6.8 -39% |
| Idle Average * (Watt) | 12.3 | 10.4 15% | 10.5 15% | 13.6 -11% | 8 35% | 16.4 -33% |
| Idle Maximum * (Watt) | 14 | 10.5 25% | 14.9 -6% | 13.8 1% | 8.7 38% | 16.9 -21% |
| Load Average * (Watt) | 54 | 45.4 16% | 48.6 10% | 67.8 -26% | 34.6 36% | 39.2 27% |
| Witcher 3 ultra * (Watt) | 46.3 | 43 7% | 50.9 -10% | 69.1 -49% | 35.4 24% | |
| Load Maximum * (Watt) | 83.6 | 99.3 -19% | 90.1 -8% | 93.5 -12% | 45.4 46% | 73.1 13% |
* ... smaller is better
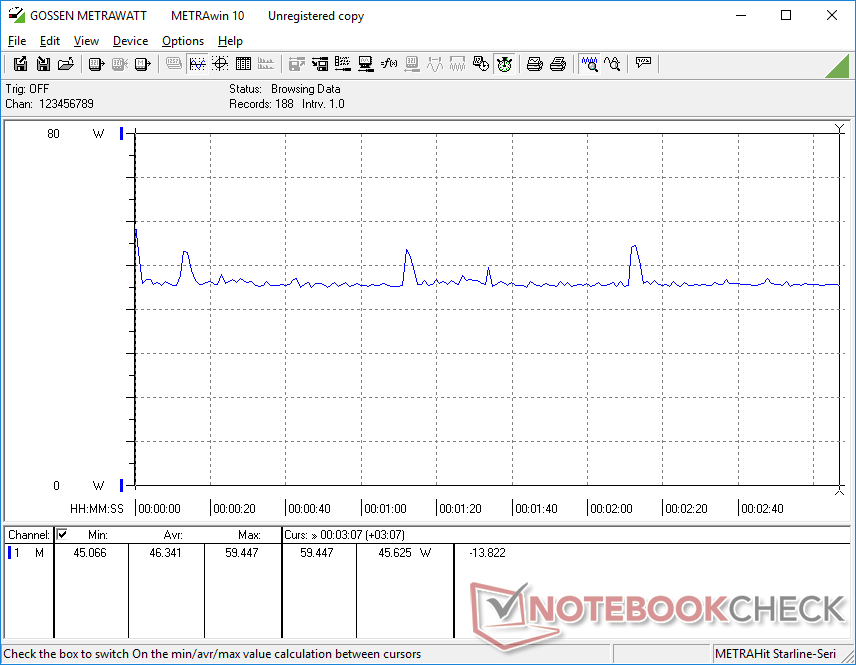
Power Consumption Witcher 3 / Stresstest
Power Consumption external Monitor
电池寿命
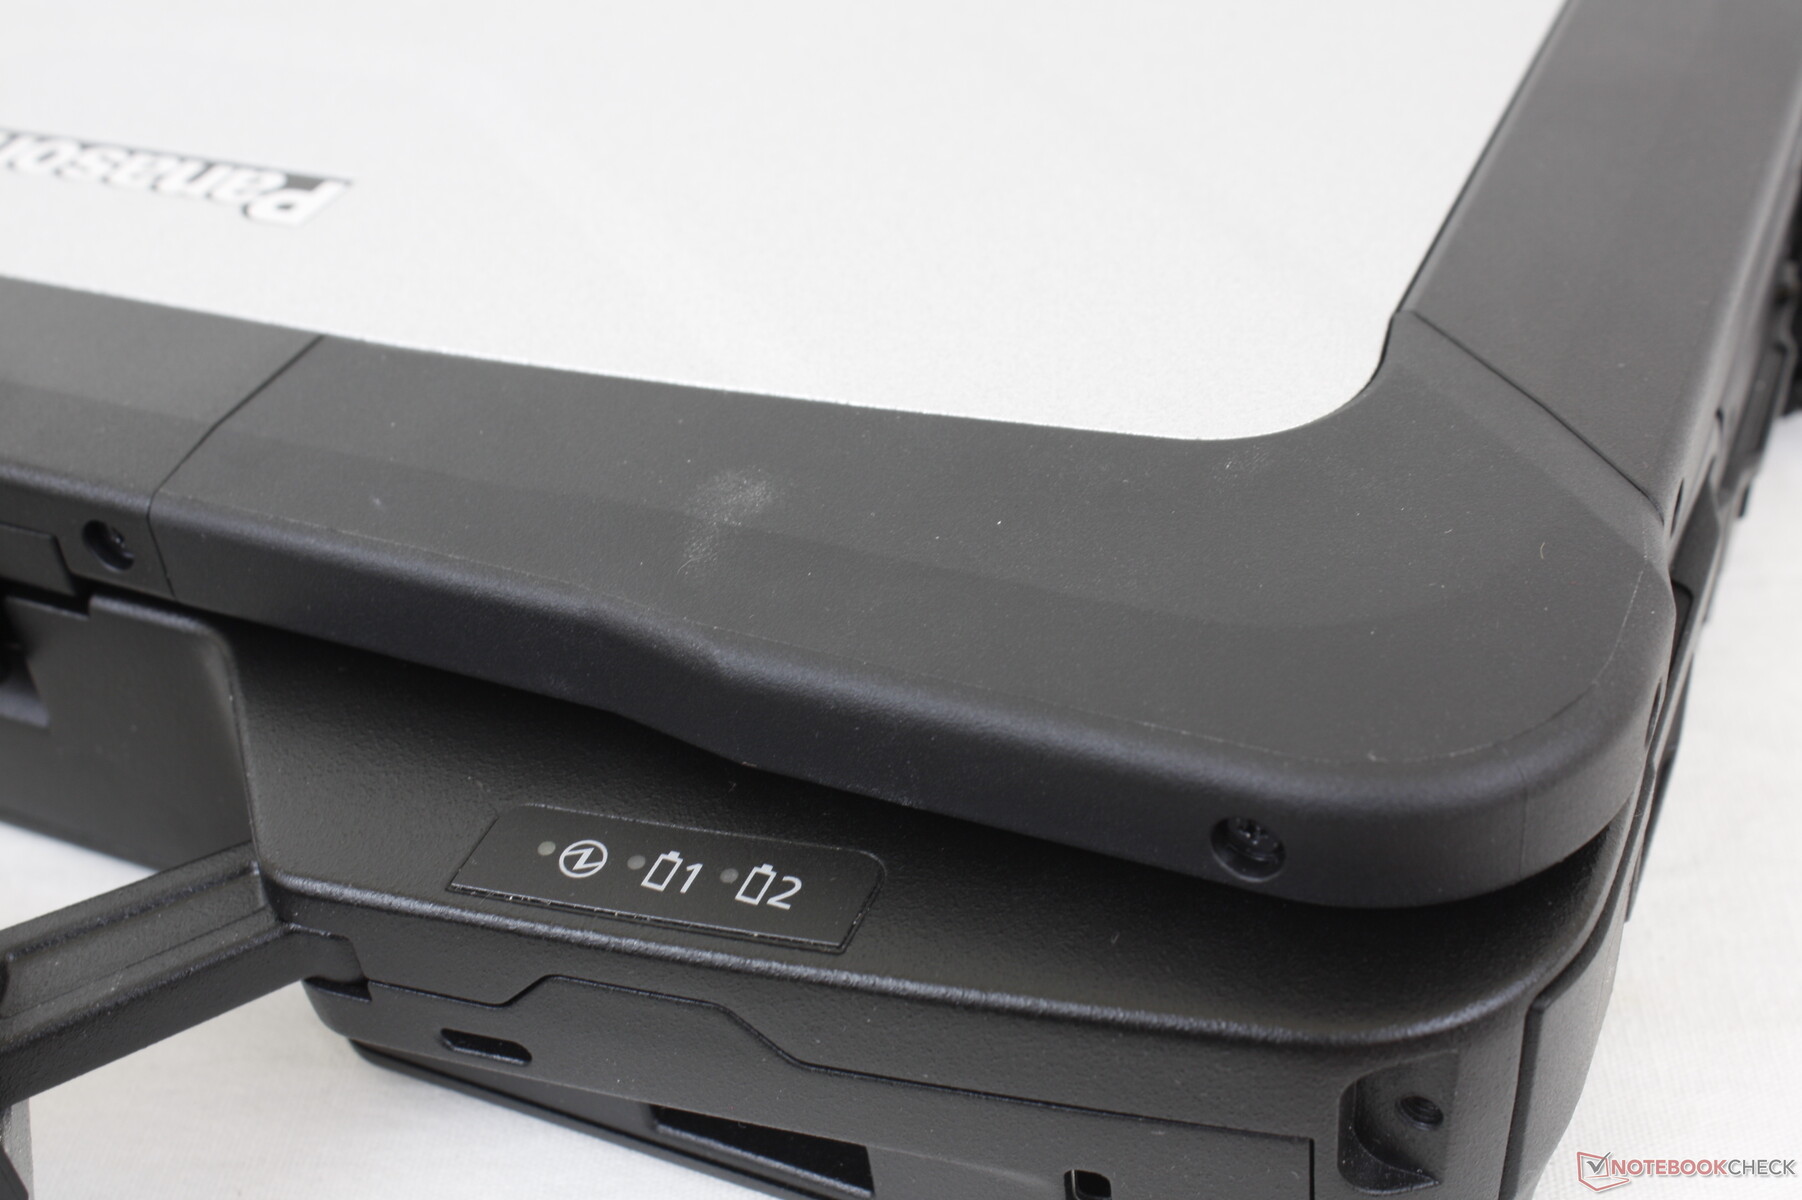
我们的测试装置在发货时配备了两块68Wh的可拆卸电池,每块电池都占据了机箱两侧的一个扩展槽。额外的电池也可以安装在底部,以获得更长的运行时间。在需要充电之前,我们的两块电池能够在150尼特的亮度下记录近19个小时的真实世界无线网络浏览。
说到充电,不幸的是,充电速度非常慢。即使连接了两块电池,系统一次只能给一块电池充电,每块电池需要2.5至3小时才能充满。相比之下,大多数普通笔记本电脑只需1.5至2小时就能完全充电。
支持USB-C充电,因此可以使用某些第三方的USB-C适配器来代替专有的交流适配器。
| Panasonic Toughbook 40 i7-1185G7, Iris Xe G7 96EUs, 136 Wh | Panasonic Toughbook FZ-55 MK2 i7-1185G7, Iris Xe G7 96EUs, 71 Wh | Getac S410 Gen 4 i7-1185G7, Iris Xe G7 96EUs, 194 Wh | Dell Latitude 5420 Rugged-P85G i7-8650U, Radeon RX 540, 102 Wh | Acer Enduro Urban N3 EUN314 i7-1165G7, Iris Xe G7 96EUs, 50.3 Wh | Durabook S14I i7-1165G7, Iris Xe G7 96EUs, 50 Wh | |
|---|---|---|---|---|---|---|
| Battery runtime | -28% | 51% | -15% | -66% | -71% | |
| WiFi v1.3 (h) | 19 | 13.6 -28% | 28.6 51% | 16.2 -15% | 6.4 -66% | 5.5 -71% |
| Reader / Idle (h) | 31.4 | |||||
| Load (h) | 3.2 |
Pros
Cons
判决书
支持不仅仅是一个或两个,而是四个不同的专业扩展插槽的能力,使Toughbook 40在同类产品中拥有更长的腿和更多的功能。如果可拆卸的xPAK模块对你的使用场景不实用,那么Toughbook 40的吸引力就会大大下降。像Latitude 7424 Rugged Extreme这样的替代品,虽然没有松下的扩展能力,但也是完全耐用的,而且更小。
有几个恼人的方面,我们希望看到改进。例如,覆盖端口的挡板很难握住并打开或关闭。屏幕闪烁是存在的,而且没有更宽的色域选项可用于更深的颜色。固态硬盘的性能也可以更好,而电池充电则太慢。这些缺点可能并不重要,取决于使用情况。
价格和可用性
用户可以通过官方产品页面,向松下公司请求报价。.
Price comparison

