


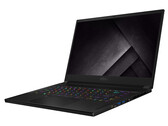
MSI GS66 Stealth 10SE笔记本电脑评测:配备了240Hz屏幕的高端游戏本
GS66的硬件将所有最新的电脑游戏流畅的运行在15.6英寸磨砂屏幕(240 Hz,FHD,IPS)上。 设备的其余部分也很合理:NVMe SSD,16 GB RAM(双通道模式)和Thunderbolt 3端口。
Intel Core i7-10750H, NVIDIA GeForce RTX 2060 Mobile, 15.6", 2.2 kgNVIDIA GeForce RTX 2060是一款用于笔记本电脑的快速中档游戏图形卡。它基于台式机RTX 2060芯片,但降低了GPU频率(-30%),并降低了功耗(台式机版本的功耗为80-90瓦TGP,而台式机为160瓦)。
NVIDIA使用12 nm FinFET工艺制造Turing TU106芯片,并包含深度学习超级采样(DLSS)和实时光线追踪(RTRT)等功能,与基于Pascal的旧GPU相比,这些功能结合起来可有更逼真的光照效果(如果游戏支持)。 RTX 2060支持DisplayPort 1.4,同时还支持HDMI 2.0b,HDR,同时多投影(SMP)和H.265视频编码/解码(PlayReady 3.0)。
移动RTX 2060的游戏性能类似于旧的Nvidia GeForce GTX 1070(台式机),并且明显落后于台式机RTX2060。移动GTX 1660 Ti在我们的游戏性能中仅落后百分之几,但没有内置的光线追踪功能。对于2019年要求苛刻的游戏,RTX 2060最适合全高清(1080p)和高/超设置下运行。但是,在大多数游戏中没有太多的性能余地来用上光线追踪功能。
英伟达(Nvidia)宣传的功耗为80-90瓦TGP,因此与RTX 2070和RTX 2080的Max-Q相似。在我们的现实笔记本电脑测试中,运行Witcher 3时从整个系统的功耗来看RTX 2060略低于Max-Q版本,略高于GTX 1660 Ti移动版(如预期)。
GeForce RTX 2000 Series
| ||||||||||||||||||||||||||||||||||||||||||||||||||||||||||
| Codename | N18E-G1 TU106 | |||||||||||||||||||||||||||||||||||||||||||||||||||||||||
| Architecture | Turing | |||||||||||||||||||||||||||||||||||||||||||||||||||||||||
| Pipelines | 1920 - unified | |||||||||||||||||||||||||||||||||||||||||||||||||||||||||
| Core Speed | 960 - 1200 (Boost) MHz | |||||||||||||||||||||||||||||||||||||||||||||||||||||||||
| Memory Speed | 14000 MHz | |||||||||||||||||||||||||||||||||||||||||||||||||||||||||
| Memory Bus Width | 192 Bit | |||||||||||||||||||||||||||||||||||||||||||||||||||||||||
| Memory Type | GDDR6 | |||||||||||||||||||||||||||||||||||||||||||||||||||||||||
| Max. Amount of Memory | 6 GB | |||||||||||||||||||||||||||||||||||||||||||||||||||||||||
| Shared Memory | no | |||||||||||||||||||||||||||||||||||||||||||||||||||||||||
| API | DirectX 12_1, OpenGL 4.6 | |||||||||||||||||||||||||||||||||||||||||||||||||||||||||
| Power Consumption | 80-90 Watt | |||||||||||||||||||||||||||||||||||||||||||||||||||||||||
| Man. Technology | 12 nm | |||||||||||||||||||||||||||||||||||||||||||||||||||||||||
| Features | DLSS, Raytraycing, VR Ready, G-SYNC, Vulkan, Multi Monitor | |||||||||||||||||||||||||||||||||||||||||||||||||||||||||
| Notebook Size | large | |||||||||||||||||||||||||||||||||||||||||||||||||||||||||
| Date of Announcement | 06.01.2019 | |||||||||||||||||||||||||||||||||||||||||||||||||||||||||
The following benchmarks stem from our benchmarks of review laptops. The performance depends on the used graphics memory, clock rate, processor, system settings, drivers, and operating systems. So the results don't have to be representative for all laptops with this GPU. For detailed information on the benchmark results, click on the fps number.


| low | med. | high | ultra | QHD | 4K | |
|---|---|---|---|---|---|---|
| F1 2021 | 149 | 126 | 71 | 52 | 28 | |
| Days Gone | 99.3 | 87.4 | 64.8 | 46.9 | 26.4 | |
| Mass Effect Legendary Edition | 102 | 99.9 | 90.3 | 56.9 | ||
| Resident Evil Village | 106 | 95.1 | 93.2 | 56.6 | 31.7 | |
| Outriders | 104 | 89.8 | 76.6 | 51.6 | 32.8 | |
| Hitman 3 | 120 | 105 | 96.8 | 61.8 | 34.2 | |
| Cyberpunk 2077 1.0 | 62.3 | 48 | 41 | 28.1 | 12.6 | |
| Immortals Fenyx Rising | 74 | 59 | 55 | 46 | 28 | |
| Yakuza Like a Dragon | 82.9 | 75 | 66 | 45.8 | 23.3 | |
| Call of Duty Black Ops Cold War | 83.3 | 66 | 60 | 42.2 | 19.4 | |
| Assassin´s Creed Valhalla | 71 | 56 | 48 | 38 | 22 | |
| Dirt 5 | 75.6 | 60 | 37 | 29.4 | 21.9 | |
| Watch Dogs Legion | 85.5 | 70 | 38 | 27.9 | 15.3 | |
| FIFA 21 | 231 | 227 | 190 | 186 | 210 | 146 |
| Star Wars Squadrons | 266 | 207 | 182 | 165 | 117 | 63.7 |
| Mafia Definitive Edition | 115 | 74 | 69 | 50.8 | 25.9 | |
| Serious Sam 4 | 115 | 81 | 68 | 58 | 43.6 | |
| Crysis Remastered | 112 | 57 | 43 | 24.1 | 15.6 | |
| Flight Simulator 2020 | 68 | 57 | 43 | 31 | 22.9 | 13.6 |
| Horizon Zero Dawn | 125 | 85 | 73 | 60 | 45 | 25 |
| Death Stranding | 145 | 103 | 95 | 91 | 64.7 | 34.7 |
| F1 2020 | 219 | 147 | 130 | 95 | 70 | 41 |
| Valorant | 225 | 223 | 196 | 212 | 171 | |
| Gears Tactics | 231 | 147 | 98 | 66 | 50.8 | 26.8 |
| Doom Eternal | 206 | 139 | 126 | 122 | 86.9 | 41 |
| Hunt Showdown | 184 | 102 | 81 | 51.7 | 24.8 | |
| Escape from Tarkov | 121 | 121 | 117 | 101 | 61.5 | 30 |
| Red Dead Redemption 2 | 115 | 81 | 54 | 34 | 28.7 | 19.5 |
| Star Wars Jedi Fallen Order | 99.6 | 82 | 77 | 61.9 | 30.1 | |
| Need for Speed Heat | 99.6 | 93.2 | 75 | 66 | 54.4 | 29.6 |
| Call of Duty Modern Warfare 2019 | 152 | 101 | 89 | 79 | 62.9 | 35 |
| GRID 2019 | 183 | 117 | 87 | 65 | 58.9 | 36.3 |
| Ghost Recon Breakpoint | 118 | 88 | 78 | 58 | 42 | 20 |
| FIFA 20 | 258 | 252 | 178 | 178 | 230 | 151 |
| Borderlands 3 | 125 | 92 | 64 | 51 | 36.4 | 16.6 |
| Control | 210 | 78 | 58 | 37.7 | 18.4 | |
| F1 2019 | 198 | 164 | 137 | 107 | 75 | 48 |
| Total War: Three Kingdoms | 232 | 110 | 71 | 50 | ||
| Rage 2 | 159.2 | 85.6 | 76 | 79 | ||
| Anno 1800 | 79.3 | 73.2 | 64 | 37 | ||
| The Division 2 | 131 | 99 | 80 | 61 | ||
| Dirt Rally 2.0 | 170.7 | 134.6 | 121 | 70 | ||
| Anthem | 89.7 | 78.2 | 63 | 58 | ||
| Far Cry New Dawn | 102 | 86 | 83 | 75 | ||
| Metro Exodus | 129 | 71 | 54 | 44 | 35 | |
| Apex Legends | 143.7 | 130.4 | 111 | 117 | 79.6 | |
| Just Cause 4 | 110 | 86 | 79 | 53.6 | 29.5 | |
| Darksiders III | 134 | 105 | 92 | 61.6 | 29 | |
| Battlefield V | 111.1 | 104 | 97 | 90 | 75 | 41.6 |
| Farming Simulator 19 | 189 | 151 | 120 | 84 | ||
| Hitman 2 | 116 | 90 | 83 | 76 | 60.6 | 31 |
| Call of Duty Black Ops 4 | 119 | 106 | 103 | 65 | 32.4 | |
| Assassin´s Creed Odyssey | 91 | 72 | 50 | 40 | 25 | |
| Forza Horizon 4 | 135 | 108 | 107 | 88 | ||
| FIFA 19 | 366 | 280 | 270 | 246 | 134 | |
| Shadow of the Tomb Raider | 118 | 91 | 84 | 75 | 49 | 25 |
| Strange Brigade | 262 | 149 | 123 | 107 | ||
| F1 2018 | 175 | 148 | 117 | 83 | 69 | 41 |
| Monster Hunter World | 141 | 103 | 93 | 70 | 42.5 | 21 |
| The Crew 2 | 60 | 60 | 60 | 59.1 | 32 | |
| Far Cry 5 | 113 | 94 | 89 | 83 | 63 | 33 |
| World of Tanks enCore | 425.6 | 218.2 | 121.7 | |||
| X-Plane 11.11 | 95 | 83 | 71 | |||
| Kingdom Come: Deliverance | 105 | 85 | 62 | 42.2 | 21.1 | |
| Final Fantasy XV Benchmark | 118 | 82 | 62 | 25.1 | ||
| Fortnite | 162 | 144 | 113 | 73.8 | 33.7 | |
| Star Wars Battlefront 2 | 140 | 121 | 87.3 | 61.3 | 30.9 | |
| Need for Speed Payback | 140 | 122 | 117 | 74.9 | 39.1 | |
| Destiny 2 | 125.9 | 114.7 | 110.5 | 99.7 | ||
| ELEX | 119 | 95.9 | 74 | 49.5 | 26 | |
| The Evil Within 2 | 79.6 | 53.1 | 53.2 | 53.6 | ||
| Middle-earth: Shadow of War | 136 | 103 | 77 | 30 | ||
| Ark Survival Evolved | 128.5 | 67.4 | 52.1 | 36.1 | ||
| Playerunknown's Battlegrounds (PUBG) | 171 | 147 | 112 | 38.2 | ||
| Dirt 4 | 231 | 150 | 84 | |||
| Rocket League | 249 | 248 | 231 | 98 | ||
| Prey | 143 | 139 | 136 | 50.5 | ||
| Ghost Recon Wildlands | 93.1 | 86.4 | 49.6 | 32.4 | ||
| For Honor | 138 | 132 | 103 | 42.7 | ||
| Resident Evil 7 | 279 | 160 | 131 | 45.4 | ||
| Dishonored 2 | 110 | 97.4 | 44 | |||
| Civilization 6 | 152.9 | 116.8 | 92.4 | 90.4 | ||
| Deus Ex Mankind Divided | 86.1 | 47.7 | 29.2 | |||
| Mirror's Edge Catalyst | 110 | 99.7 | 37.1 | |||
| Overwatch | 250 | 148 | 78.3 | |||
| Doom | 138 | 134 | 142 | 134 | 53 | |
| Ashes of the Singularity | 71.1 | 65.4 | 64.4 | |||
| The Division | 101 | 79.4 | 39.2 | |||
| Rise of the Tomb Raider | 151 | 142 | 107 | 86 | 39 | |
| Rainbow Six Siege | 206 | 188 | 77.6 | |||
| World of Warships | 178.4 | 151.7 | 129.3 | 123.7 | ||
| Dota 2 Reborn | 133 | 122 | 113 | 107 | 87 | |
| The Witcher 3 | 256 | 185 | 111 | 61 | 38 | |
| GTA V | 160 | 149 | 114 | 65 | ||
| Thief | 97.7 | |||||
| BioShock Infinite | 312 | 273 | 255 | 140 | ||
| Tomb Raider | 439.7 | 393 | 367.3 | 192.9 | ||
| Diablo III | 222.5 | 197.5 | 200.8 | 173 | ||
| StarCraft 2 | 419.1 | 188.6 | 181.6 | 159.7 | ||
| low | med. | high | ultra | QHD | 4K | < 30 fps < 60 fps < 120 fps ≥ 120 fps | 18 41 | 2 50 39 | 10 57 29 | 20 54 17 | 6 26 21 4 | 29 33 5 4 |
For more games that might be playable and a list of all games and graphics cards visit our Gaming List


MSI GL73 8SE-010US: Intel Core i7-8750H, 17.30", 2.7 kg
Review » 微星GL73 8SE(i7-8750H, RTX 2060)笔记本电脑评测
Dell G3 15 3500-G4DG2: Intel Core i7-10750H, 15.60", 2.3 kg
External Review » Dell G3 15 3500-G4DG2
BTO Notebooks X-Book 15X1187-AMD: AMD Ryzen 7 4800H, 15.60"
External Review » BTO Notebooks X-Book 15X1187-AMD
Acer Nitro 5 AN517-51-76V6: Intel Core i7-9750H, 17.30", 2.7 kg
External Review » Acer Nitro 5 AN517-51-76V6
MSI GS66 Stealth 10SE-092NL: Intel Core i7-10750H, 15.60", 2.1 kg
External Review » MSI GS66 Stealth 10SE-092NL
HP Omen 15-en825no: AMD Ryzen 7 4800H, 15.60", 2.5 kg
External Review » HP Omen 15-en825no
Acer Nitro 5 AN515-55-524P: Intel Core i5-10300H, 15.60", 2.3 kg
External Review » Acer Nitro 5 AN515-55-524P
Lenovo Legion Y540 15IRH-81SX007YMH: Intel Core i7-9750H, 15.60", 2.3 kg
External Review » Lenovo Legion Y540 15IRH-81SX007YMH
Asus TUF Gaming A15 FA506IV-AS76: AMD Ryzen 7 4800H, 15.60", 2.3 kg
External Review » Asus TUF Gaming A15 FA506IV-AS76
Acer Nitro 5 AN517-52-758K: Intel Core i7-10750H, 17.30", 2.2 kg
External Review » Acer Nitro 5 AN517-52-758K
HP Omen 15-en0016ns: AMD Ryzen 7 4800H, 15.60", 2.4 kg
External Review » HP Omen 15-en0016ns
MSI Stealth 15M A11SEK-055XES: Intel Core i7-1185G7, 15.60", 1.7 kg
External Review » MSI Stealth 15M A11SEK-055XES
Lenovo Legion C7 15IMH05-82EH002CUK: Intel Core i7-10750H, 15.60", 2.2 kg
External Review » Lenovo Legion C7 15IMH05-82EH002CUK
Dell G7 15 7500, i7-10750H RTX 2060: Intel Core i7-10750H, 15.60", 2.3 kg
External Review » Dell G7 15 7500, i7-10750H RTX 2060
MSI GF75 Thin 10SER-427XES: Intel Core i7-10750H, 17.30", 2.3 kg
External Review » MSI GF75 Thin 10SER-427XES
Gigabyte Aorus 7 KB-7ES1130SD: Intel Core i7-10750H, 17.30", 2.5 kg
External Review » Gigabyte Aorus 7 KB-7ES1130SD
HP Omen 15-en0017ns: AMD Ryzen 7 4800H, 15.60", 2.5 kg
External Review » HP Omen 15-en0017ns
Asus Strix G712LV-H7077: Intel Core i7-10750H, 17.30", 2.9 kg
External Review » Asus Strix G712LV-H7077
Lenovo Legion Y540-15IRH-HASP: Intel Core i7-9750H, 15.60", 2.3 kg
External Review » Lenovo Legion Y540-15IRH-HASP
MSI GL75 10SER-257XTR: Intel Core i7-10750H, 17.30", 2.6 kg
External Review » MSI GL75 10SER-257XTR
Lenovo Legion 5 15IMH05H-81Y60043GE: Intel Core i5-10300H, 15.60", 2.5 kg
External Review » Lenovo Legion 5 15IMH05H-81Y60043GE
Medion Akoya S15801, i7-10750H RTX 2060: Intel Core i7-10750H, 15.60", 1.8 kg
External Review » Medion Akoya S15801, i7-10750H RTX 2060
Acer Nitro 5 AN517-51-77QV: Intel Core i7-9750H, 17.30", 2.7 kg
External Review » Acer Nitro 5 AN517-51-77QV
Lenovo Legion Slim 7i: Intel Core i7-10870H, 15.60", 1.9 kg
External Review » Lenovo Legion Slim 7i
HP Omen 15-ek0600nd: Intel Core i7-10750H, 15.60", 2.4 kg
External Review » HP Omen 15-ek0600nd
Lenovo Legion 5 15IMH05H-81Y600J7SP: Intel Core i7-10750H, 15.60", 2.5 kg
External Review » Lenovo Legion 5 15IMH05H-81Y600J7SP
MSI GF65 Thin 10SER-884XES: Intel Core i7-10750H, 15.60", 1.9 kg
External Review » MSI GF65 Thin 10SER-884XES
HP Omen 15-en0009ns: AMD Ryzen 7 4800H, 15.60", 2.5 kg
External Review » HP Omen 15-en0009ns
HP Omen 15-en0004ns: AMD Ryzen 7 4800H, 15.60", 2.5 kg
External Review » HP Omen 15-en0004ns
Asus ROG Strix G15 G512LV-HN090: Intel Core i7-10750H, 15.60", 2.4 kg
External Review » Asus ROG Strix G15 G512LV-HN090
Asus Strix G17 G712LV-H7007: Intel Core i7-10750H, 17.30", 2.9 kg
External Review » Asus Strix G17 G712LV-H7007
Acer Nitro 5 AN515-54-70KK: Intel Core i7-9750H, 15.60", 2.3 kg
External Review » Acer Nitro 5 AN515-54-70KK
MSI Creator 15M A10SE-646IT: Intel Core i7-10750H, 15.60", 1.9 kg
External Review » MSI Creator 15M A10SE-646IT
Asus ROG Strix G15 G512LV-AZ125T: Intel Core i7-10750H, 15.60", 2.4 kg
External Review » Asus ROG Strix G15 G512LV-AZ125T
MSI GL75 Leopard 10SEK-261XES: Intel Core i7-10750H, 17.30", 2.6 kg
External Review » MSI GL75 Leopard 10SEK-261XES
Asus ROG Strix G15 G512LV-HN221: Intel Core i7-10875H, 15.60", 2.4 kg
External Review » Asus ROG Strix G15 G512LV-HN221
Lenovo Legion 5 15ARH05H-82B1000RRU: AMD Ryzen 5 4600H, 15.60", 2.5 kg
External Review » Lenovo Legion 5 15ARH05H-82B1000RRU
Honor Hunter V700: Intel Core i7-10750H, 16.10", 2.5 kg
External Review » Honor Hunter V700
Gigabyte Aorus 5 KB-7ES1130SD: Intel Core i7-10750H, 15.60"
External Review » Gigabyte Aorus 5 KB-7ES1130SD
HP Omen 15-en0046nf: AMD Ryzen 7 4800H, 15.60", 2.4 kg
External Review » HP Omen 15-en0046nf
Lenovo Legion 5P AMD 4900H: AMD Ryzen 9 4900H, 15.60", 2.5 kg
External Review » Lenovo Legion 5P AMD 4900H
Lenovo Legion 5 15ARH05H-82B1003EMH: AMD Ryzen 7 4800H, 15.60", 2.5 kg
External Review » Lenovo Legion 5 15ARH05H-82B1003EMH
Lenovo Legion 5 15ARH05H-82B1008ASP: AMD Ryzen 7 4800H, 15.60", 2.5 kg
External Review » Lenovo Legion 5 15ARH05H-82B1008ASP
Gateway Creator Series 15.6 GWTN156-3BK: Intel Core i5-10300H, 15.60", 2 kg
External Review » Gateway Creator Series 15.6 GWTN156-3BK
Acer Nitro 5 AN517-51-75JE: Intel Core i7-9750H, 17.30", 2.7 kg
External Review » Acer Nitro 5 AN517-51-75JE
MSI GL65 10SER, i5-10300H RTX 2060: Intel Core i5-10300H, 15.60", 2.3 kg
External Review » MSI GL65 10SER, i5-10300H RTX 2060
Origin PC NS-15: AMD Ryzen 7 3700X, 15.60", 2.2 kg
External Review » Origin PC NS-15
Monster Tulpar T5 V19.2: Intel Core i7-10750H, 15.60", 2.1 kg
External Review » Monster Tulpar T5 V19.2
MSI GS66 Stealth 10SE-616XES: Intel Core i7-10875H, 15.60", 2.1 kg
External Review » MSI GS66 Stealth 10SE-616XES
Acer Predator Helios 300 PH315-53-71NT: Intel Core i7-10750H, 15.60", 2.5 kg
External Review » Acer Predator Helios 300 PH315-53-71NT
MSI GF65 Thin 9SEXR-687XES: Intel Core i5-9300H, 14.00", 1.5 kg
External Review » MSI GF65 Thin 9SEXR-687XES
Lenovo Legion Y740SI-81YX000VGE: Intel Core i7-10750H, 15.60", 1.7 kg
External Review » Lenovo Legion Y740SI-81YX000VGE
Lenovo Legion Y540-15IRH-81SX014NSP: Intel Core i5-9300H, 15.60", 2.3 kg
External Review » Lenovo Legion Y540-15IRH-81SX014NSP
Lenovo Legion 5 15IMH05H-81Y600ALMH: Intel Core i7-10750H, 15.60", 2.5 kg
External Review » Lenovo Legion 5 15IMH05H-81Y600ALMH
HP Omen 15-en0013ax: AMD Ryzen 7 4800H, 15.60", 2.4 kg
External Review » HP Omen 15-en0013ax
HP Omen 15-ek0005ns: Intel Core i7-10750H, 15.60", 2.4 kg
External Review » HP Omen 15-ek0005ns
Lenovo Legion Y540-15IRH-81SX00HVSP: Intel Core i7-9750H, 15.60", 2.3 kg
External Review » Lenovo Legion Y540-15IRH-81SX00HVSP
Dell G7 17 7700, i7-10750H RTX 2060: Intel Core i7-10750H, 17.30", 3.3 kg
External Review » Dell G7 17 7700, i7-10750H RTX 2060
MSI GF65 Thin 9SEXR-249: Intel Core i5-9300H, 15.60", 1.9 kg
External Review » MSI GF65 Thin 9SEXR-249
Asus ROG Strix G15 G512LW-HN852: Intel Core i7-10875H, 15.60", 2.3 kg
External Review » Asus ROG Strix G15 G512LW-HN852
Lenovo Legion Y540-15IRH-81SX012LGE: Intel Core i5-9300HF, 15.60", 2.3 kg
External Review » Lenovo Legion Y540-15IRH-81SX012LGE
HP Pavilion Gaming 16-a0025ns: Intel Core i7-10750H, 16.10", 2.4 kg
External Review » HP Pavilion Gaming 16-a0025ns
Acer Nitro 5 AN515-55-71M0: Intel Core i7-10750H, 15.60", 2.3 kg
External Review » Acer Nitro 5 AN515-55-71M0
Aorus 7 KB: Intel Core i7-10750H, 17.30", 2.5 kg
External Review » Aorus 7 KB
Asus Strix G15 G512LV-AZ126T: Intel Core i7-10750H, 15.60", 2.4 kg
External Review » Asus Strix G15 G512LV-AZ126T
Asus TUF Gaming A15 FA506IV-HN337: AMD Ryzen 7 4800H, 15.60", 2.3 kg
External Review » Asus TUF Gaming A15 FA506IV-HN337
Acer Nitro 5 AN517-52: Intel Core i5-10300H, 17.30", 2.2 kg
External Review » Acer Nitro 5 AN517-52
MSI GL75 10SEK-039ES: Intel Core i7-10750H, 17.30", 2.6 kg
External Review » MSI GL75 10SEK-039ES
Asus ROG Zephyrus M15 GU502GV-AZ037T: Intel Core i7-9750H, 15.60", 1.9 kg
External Review » Asus ROG Zephyrus M GU502GV-AZ037T
Lenovo Legion 5 15IMH05H-81Y60093MH: Intel Core i7-10750H, 15.60", 2.5 kg
External Review » Lenovo Legion 5 15IMH05H-81Y60093MH
Dell G5 15 5500-RVHTJ: Intel Core i7-10750H, 15.60", 2.4 kg
External Review » Dell G5 15 5500-RVHTJ
MSI GF65 Thin 9SEXR-686XES: Intel Core i7-9750H, 15.60"
External Review » MSI GF65 Thin 9SEXR-686XES
Asus TUF Gaming F15 FX506IV-BQ123T: AMD Ryzen 7 4800H, 15.60", 2.3 kg
External Review » Asus TUF Gaming A15 FX506IV-BQ123T
Asus Zephyrus M15: Intel Core i7-10750H, 15.60", 1.9 kg
External Review » Asus Zephyrus M15
MSI GF65 10SER-690: Intel Core i7-10750H, 15.60", 1.9 kg
External Review » MSI GF65 10SER-690
Lenovo Legion 7 15IMH05-81YT005BMH: Intel Core i7-10750H, 15.60", 2.3 kg
External Review » Lenovo Legion 7 15IMH05-81YT005BMH
Asus ROG Strix G15 G512LV-AL007: Intel Core i7-10750H, 15.60", 2.4 kg
External Review » Asus ROG Strix G15 G512LV-AL007
MSI GF65 Thin 9SEXR-441RU: Intel Core i5-9300H, 15.60", 1.9 kg
External Review » MSI GF65 Thin 9SEXR-441RU
Acer Nitro 7 AN715-52-78D5: Intel Core i7-10750H, 15.60", 2.5 kg
External Review » Acer Nitro 7 AN715-52-78D5
MSI GL65 10SEK-241XES: Intel Core i7-10750H, 15.60", 2.3 kg
External Review » MSI GL65 10SEK-241XES
Acer Nitro 5 AN515-55-73Y6: Intel Core i7-10750H, 15.60", 2.3 kg
External Review » Acer Nitro 5 AN515-55-73Y6
Lenovo Legion 5i 15-81Y6000FUS: Intel Core i7-10750H, 15.60", 2.3 kg
External Review » Lenovo Legion 5i 15-81Y6000FUS
HP Omen 17-cb1055ng: Intel Core i7-10750H, 17.30", 3.3 kg
External Review » HP Omen 17-cb1055ng
HP Omen 15-dh1059nr: Intel Core i7-10750H, 15.60", 2.4 kg
External Review » HP Omen 15-dh1059nr
MSI Creator 17 A10SE-256: Intel Core i7-10875H, 17.30", 2.5 kg
External Review » MSI Creator 17 A10SE-256
Acer Predator Helios 300 PH315-53-700X: Intel Core i7-10750H, 15.60", 2.3 kg
External Review » Acer Predator Helios 300 PH315-53-700X
Acer Predator Helios 300 PH317-54-71AE: Intel Core i7-10750H, 17.30", 2.9 kg
External Review » Acer Predator Helios 300 PH317-54-71AE
Asus Strix G17 G712LV-EV047T: Intel Core i7-10750H, 17.30", 2.9 kg
External Review » Asus Strix G17 G712LV-EV047T
MSI Creator 17M A10SE-214: Intel Core i7-10750H, 17.30", 2.2 kg
External Review » MSI Creator 17M A10SE-214
Aorus 7 KB-7DE1130SH: Intel Core i7-10750H, 17.30", 2.5 kg
External Review » Aorus 7 KB-7DE1130SH
Asus TUF FX505DV-AL116: AMD Ryzen 7 3750H, 15.60", 2.2 kg
External Review » Asus TUF FX505DV-AL116
Acer Nitro 5 AN517-52-77DS: Intel Core i7-10750H, 17.30", 2.2 kg
External Review » Acer Nitro 5 AN517-52-77DS
Asus TUF Gaming A15 FA506IV-HN320T: AMD Ryzen 9 4900H, 15.60", 2.3 kg
External Review » Asus TUF Gaming A15 FA506IV-HN320T
Acer Predator Helios 300 PH317-54-728H: Intel Core i7-10750H, 17.30", 2.9 kg
External Review » Acer Predator Helios 300 PH317-54-728H
MSI GP75 Leopard 10SEK: Intel Core i7-10750H, 17.30", 2.6 kg
External Review » MSI GP75 Leopard 10SEK
Asus TUF Gaming A15 566IV-AL155T: AMD Ryzen 7 4800H, 15.60", 2.1 kg
External Review » Asus TUF Gaming A15 566IV-AL155T
Asus TUF Gaming A15 FA506IV-AL064T: AMD Ryzen 7 4800H, 15.60", 2.3 kg
External Review » Asus TUF Gaming A15 FA506IV-AL064T
Asus TUF Gaming F15 FX506IV: AMD Ryzen 7 4800H, 15.60", 2.3 kg
External Review » Asus TUF Gaming A15 FX506IV
MSI GE66 Raider 10SE: Intel Core i7-10750H, 15.60"
External Review » MSI GE66 Raider 10SE
Lenovo Legion 5 15IMH05H-81Y6003QMH: Intel Core i7-10750H, 15.60", 2.5 kg
External Review » Lenovo Legion 5 15IMH05H-81Y6003QMH
Aorus 5 KB-7US1130SH: Intel Core i7-10750H, 15.60", 2.2 kg
External Review » Aorus 5 KB-7US1130SH
Gigabyte Aero 15 OLED KB-8NL5130SP: Intel Core i7-10875H, 15.60", 2 kg
External Review » Gigabyte Aero 15 OLED KB-8NL5130SP
Asus Zephyrus G14 GA401IV-011T: AMD Ryzen 9 4900HS, 14.00", 1.7 kg
External Review » Asus Zephyrus G14 GA401IV-011T
MSI GL65 10SEK: Intel Core i7-10750H, 15.60", 2.3 kg
External Review » MSI GL65 10SEK
MSI GS66 Stealth 10SE-045: Intel Core i7-10750H, 15.60", 2.2 kg
External Review » MSI GS66 Stealth 10SE-045
Asus ProArt StudioBook 15 H500GV-HC012R: Intel Core i7-9750H, 15.60", 2 kg
External Review » Asus ProArt StudioBook 15 H500GV-HC012R
Asus ProArt StudioBook 15 H500GV-XS76: Intel Core i7-9750H, 15.60", 2 kg
External Review » Asus ProArt StudioBook 15 H500GV-XS76
MSI GL75 10SEK-040XES: Intel Core i7-10750H, 17.30", 2.6 kg
External Review » MSI GL75 10SEK-040XES
Schenker XMG Apex 15 Ryzen 5 3600, RTX 2060: unknown, 15.60", 2.6 kg
External Review » Schenker XMG Apex 15 Ryzen 5 3600, RTX 2060
Asus ROG Zephyrus M15 GU502GV-AZ038T: Intel Core i7-9750H, 15.60", 1.9 kg
External Review » Asus ROG Zephyrus M GU502GV-AZ038T
Asus TUF Gaming A15 FA506IV-AL029T: AMD Ryzen 7 4800H, 15.60", 1.7 kg
External Review » Asus TUF Gaming A15 FA506IV-AL029T
Asus ZenBook Pro Duo UX581GV-H2002R: Intel Core i7-9750H, 15.60", 2.5 kg
External Review » Asus ZenBook Pro Duo UX581GV-H2002R
MSI GF65 Thin 9SEXR-236XES: Intel Core i7-9750H, 15.60", 1.9 kg
External Review » MSI GF65 Thin 9SEXR-236XES
Asus TUF Gaming A15 FA506IV-AL032T: AMD Ryzen 7 4800H, 15.60", 2.3 kg
External Review » Asus TUF Gaming A15 FA506IV-AL032T
Acer Predator Helios 300 PH315-52-79H8: Intel Core i7-9750H, 15.60", 2.4 kg
External Review » Acer Predator Helios 300 PH315-52-79H8
MSI GF65 Thin 9SEXR-237XES: Intel Core i5-9300H, 15.60", 1.9 kg
External Review » MSI GF65 Thin 9SEXR-237XES
Gigabyte Aero 15 OLED WA-7BE5130SP: Intel Core i7-9750H, 15.60", 2 kg
External Review » Gigabyte Aero 15 OLED WA-7BE5130SP
Acer Predator Helios 300 PH315-52-73ZX: Intel Core i7-8750H, 15.60", 2.5 kg
External Review » Acer Predator Helios 300 PH315-52-73ZX
Asus ROG Zephyrus M15 GU502GV-AZ088T: Intel Core i7-9750H, 15.60", 1.9 kg
External Review » Asus Zephyrus M GU502GV-AZ088T
Asus Zephyrus G14 GA401IV-HA026T: AMD Ryzen 7 4800HS, 14.00", 1.7 kg
External Review » Asus Zephyrus G14 GA401IV-HA026T
Lenovo Legion Y540-15IRH-81SX00HRSP: Intel Core i7-9750H, 15.60", 2.3 kg
External Review » Lenovo Legion Y540-15IRH-81SX00HRSP
Asus ROG Strix G531GV-AL172: Intel Core i7-9750H, 15.60", 2.4 kg
External Review » Asus ROG Strix G531GV-AL172
MSI GL65 9SEK-255XES: Intel Core i7-9750H, 15.60", 2.3 kg
External Review » MSI GL65 9SEK-255XES
Asus ROG Zephyrus M15 GU502GV-ES004T: Intel Core i7-9750H, 15.60", 2 kg
External Review » Asus ROG Zephyrus M GU502GV-ES004T
Asus TUF Gaming FX505DV-AL014: AMD Ryzen 7 3750H, 15.60", 2.2 kg
External Review » Asus TUF Gaming FX505DV-AL014
Asus ROG Strix Scar III G731GV-EV106T: Intel Core i7-9750H, 17.30", 2.9 kg
External Review » Asus ROG Strix Scar III G731GV-EV106T
HP Omen 15-dc1041nl: Intel Core i7-8750H, 15.60", 2.4 kg
External Review » HP Omen 15-dc1041nl
Asus TUF FX505DD: AMD Ryzen 7 3750H, 15.60", 2.2 kg
External Review » Asus TUF FX505DD
Lenovo Legion Y540-17IRH-81Q4002CGE: Intel Core i7-9750H, 17.30", 2.8 kg
External Review » Lenovo Legion Y540-17IRH-81Q4002CGE
MSI GE65 Raider-052: Intel Core i7-9750H, 15.60", 2.3 kg
External Review » MSI GE65 Raider-052
Asus TUF FX505DV-BQ099T: AMD Ryzen 7 3750H, 15.60", 2.2 kg
External Review » Asus TUF FX505DV-BQ099T
HP Omen 15-dh0001ns: Intel Core i7-9750H, 15.60", 2.7 kg
External Review » HP Omen 15-dh0001ns
Asus Zenbook Pro Duo UX581GV-H2004T: Intel Core i7-9750H, 15.60", 2.5 kg
External Review » Asus Zenbook Pro Duo UX581GV-H2004T
Asus ZenBook Pro Duo UX581GV-H2003R: Intel Core i7-9750H, 15.60", 2.5 kg
External Review » Asus ZenBook Pro Duo UX581GV-H2003R
MSI GL65 9SEK-210XES: Intel Core i7-9750H, 15.60", 2.3 kg
External Review » MSI GL65 9SEK-210XES
Asus ROG Strix Scar III G531GV-AZ177T: Intel Core i7-9750H, 15.60", 2.4 kg
External Review » Asus ROG Strix Scar III G531GV-AZ177T
Lenovo Legion Y740-17IRH: Intel Core i7-9750H, 17.30", 3 kg
External Review » Lenovo Legion Y740-17IRH
Acer Predator Helios 300 PH315-52-78T7: Intel Core i7-9750H, 15.60", 2.4 kg
External Review » Acer Predator Helios 300 PH315-52-78T7
Asus ROG Zephyrus S GX502GV-ES047T: Intel Core i7-9750H, 15.60", 2 kg
External Review » Asus ROG Zephyrus S GX502GV-ES047T
Asus TUF FX505DV-AL019: AMD Ryzen 7 3750H, 15.60", 2.3 kg
External Review » Asus TUF FX505DV-AL019
HP Omen 15-dc1002ns: Intel Core i7-8750H, 15.60", 2.5 kg
External Review » HP Omen 15-dc1002ns
Asus ZenBook Pro Duo UX581GV-H2002T: Intel Core i7-9750H, 15.60", 2.5 kg
External Review » Asus ZenBook Pro Duo UX581GV-H2002T
Asus ZenBook Pro Duo UX581GV-H2004R: Intel Core i7-9750H, 15.60", 2.5 kg
External Review » Asus ZenBook Pro Duo UX581GV-H2004R
Lenovo Legion Y740-15ICHg-81HE003YGE: Intel Core i5-8300H, 15.60", 2.2 kg
External Review » Lenovo Legion Y740-15ICHg-81HE003YGE
Lenovo Legion Y740-15IRHg-81UH001XGE: Intel Core i7-9750H, 15.60", 2.2 kg
External Review » Lenovo Legion Y740-15IRHg-81UH001XGE
MSI GL75 9SEK-074XES: Intel Core i7-9750H, 15.60", 2.5 kg
External Review » MSI GL75 9SEK-074XES
MSI GE75 Raider 8SG-059FR: Intel Core i7-9750H, 17.30", 2.6 kg
External Review » MSI GE75 Raider 8SG-059FR
Asus Strix Hero III G731GV: Intel Core i7-9750H, 17.30", 2.9 kg
External Review » Asus Strix Hero III G731GV
MSI P75 Creator 9SE-279DE: Intel Core i7-9750H, 17.30", 2.3 kg
External Review » MSI P75 Creator 9SE-279DE
HP Omen 15-dh0105tx : Intel Core i7-9750H, 15.60", 2.4 kg
External Review » HP Omen 15-dh0105tx
Acer Predator Helios 300 PH315-52-71KD: Intel Core i7-9750H, 15.60", 2.5 kg
External Review » Acer Predator Helios 300 PH315-52-71KD
Acer ConceptD 7 CN715-71-743N: Intel Core i7-9750H, 15.60", 2.2 kg
External Review » Acer ConceptD 7 CN715-71-743N
Acer Predator Triton 500 PT515-51-73G6: Intel Core i7-8750H, 15.60", 2.1 kg
External Review » Acer Predator Triton 500 PT515-51-73G6
Hyperbook SL504: Intel Core i7-9750H, 15.60", 2.4 kg
External Review » Hyperbook SL504
Asus Zephyrus S GX502GV-PB74: Intel Core i7-9750H, 15.60", 2 kg
External Review » Asus Zephyrus S GX502GV-PB74
Dell G5 15 5590-FJJN8: Intel Core i7-9750H, 15.60", 2.8 kg
External Review » Dell G5 15 5590-FJJN8
Lenovo Legion Y540-15IRH: Intel Core i7-9750H, 15.60", 2.3 kg
External Review » Lenovo Legion Y540-15IRH
MSI GP75 Leopard 9SE-660XES: Intel Core i7-9750H, 17.30", 2.6 kg
External Review » MSI GP75 Leopard 9SE-660XES
MSI GE63 Raider RGB-053: Intel Core i7-8750H, 15.60", 2.6 kg
External Review » MSI GE63 Raider RGB-053
Asus ROG Zephyrus M15 GU502GV-BI7N10: Intel Core i7-9750H, 15.60", 1.9 kg
External Review » Asus Zephyrus M GU502GV-BI7N10
Asus Zephyrus S GX701GVR-EV003R: Intel Core i7-8750H, 17.30", 2.7 kg
External Review » Asus Zephyrus S GX701GVR-EV003R
Dell G7 15 7590 (i7-9750H, RTX 2060): Intel Core i7-9750H, 15.60", 2.5 kg
External Review » Dell G7 15 7590 (i7-9750H, RTX 2060)
Schenker XMG Pro 15-M19mbm: Intel Core i7-9750H, 15.60", 2.5 kg
External Review » Schenker XMG Pro 15-M19mbm
Alienware m17 9JX63: Intel Core i7-8750H, 17.30", 2.6 kg
External Review » Alienware m17 9JX63
MSI GS65 Stealth 8SE-037ES: Intel Core i7-8750H, 15.60", 1.9 kg
External Review » MSI GS65 Stealth 8SE-037ES
Razer Blade Pro 17 RTX 2060: Intel Core i7-9750H, 17.30", 2.8 kg
External Review » Razer Blade Pro 17 RTX 2060
MSI GS75 9SE-278 Stealth: Intel Core i7-9750H, 17.30", 2.3 kg
External Review » MSI GS75 9SE-278 Stealth
MSI GE75 Raider 9SE-402NL: Intel Core i7-9750H, 17.30", 2.6 kg
External Review » MSI GE75 Raider 9SE-402NL
Acer Predator Helios 300 PH317-53-79Y1: Intel Core i7-9750H, 17.30", 2.9 kg
External Review » Acer Predator Helios 300 PH317-53-79Y1
Acer Predator Helios 300 PH315-52-73XY: Intel Core i7-9750H, 15.60", 2.4 kg
External Review » Acer Predator Helios 300 PH315-52-73XY
Asus ROG Strix SCAR II GL504GV-ES020: Intel Core i7-8750H, 15.60", 2.4 kg
External Review » Asus ROG Strix SCAR II GL504GV-ES020
Dell G5 15 5590: Intel Core i7-8750H, 15.60", 2.7 kg
External Review » Dell G5 15 5590
MSI GS65 8SE-060: Intel Core i7-8750H, 15.60", 1.9 kg
External Review » MSI GS65 8SE-060
Dell G7 15-7590 (i7-8750H, RTX 2060): Intel Core i7-8750H, 15.60", 2.5 kg
External Review » Dell G7 15-7590 (i7-8750H, RTX 2060)
Asus ZenBook Pro Duo UX581GV: Intel Core i9-9980HK, 15.60", 2.5 kg
External Review » Asus ZenBook Pro Duo UX581GV
MSI GL73 8SE-010US: Intel Core i7-8750H, 17.30", 2.7 kg
External Review » MSI GL73 8SE-010US
MSI GE75 Raider 8SE-035XES: Intel Core i7-8750H, 17.30", 2.7 kg
External Review » MSI GE75 Raider 8SE-035XES
MSI GS75 Stealth 8SE-066ES: Intel Core i7-8750H, 17.30", 2.3 kg
External Review » MSI GS75 Stealth 8SE-066ES
BTO Notebooks X-Book 16X885: Intel Core i7-8750H, 16.10", 2.1 kg
External Review » BTO Notebooks X-Book 16X885
Dell G5 15 5590-650GJ: Intel Core i7-8750H, 15.60", 2.8 kg
External Review » Dell G5 15 5590-650GJ
Acer Predator Triton 500 PT515-51-73G6: Intel Core i7-8750H, 15.60", 2.1 kg
External Review » Acer Predator Triton 500 PT515-51-73G6
Asus ROG Strix Hero II G515GV-ES048T: Intel Core i7-8750H, 15.60", 2.4 kg
External Review » Asus ROG Strix Hero II G515GV-ES048T
Dell G7 17-7790-WMGG1: Intel Core i7-8750H, 17.30", 3.3 kg
External Review » Dell G7 17-7790-WMGG1
Razer Blade 15 RTX 2060: Intel Core i7-8750H, 15.60", 2.1 kg
External Review » Razer Blade 15 RTX 2060
Lenovo Legion Y740-15ICHg-81HE0000US: Intel Core i7-8750H, 15.60", 2.2 kg
External Review » Lenovo Legion Y740-15ICHg-81HE0000US
Lenovo Legion Y540-15ICH: Intel Core i7-8750H, 15.60", 2.4 kg
External Review » Lenovo Legion Y540-15ICH
MSI GE75 8SE-047: Intel Core i7-8750H, 17.30", 2.6 kg
External Review » MSI GE75 8SE-047
Asus ROG Strix Scar II GL704GV-EV024T: Intel Core i7-8750H, 17.30", 2.9 kg
External Review » Asus ROG Strix Scar II GL704GV-EV024T
Aorus 15 W9: Intel Core i7-8750H, 15.60", 2.2 kg
External Review » Aorus 15 W9
Dell G5 15 5590-931WJ: Intel Core i7-8750H, 15.60", 2.8 kg
External Review » Dell G5 15 5590-931WJ
MSI GL73 8SE-008XES: Intel Core i7-8750H, 17.30", 2.9 kg
External Review » MSI GL73 8SE-008XES
MSI GL63 8SE-026XES: Intel Core i7-8750H, 15.60", 2.3 kg
External Review » MSI GL63 8SE-026XES
Asus Strix Scar II GL504GV-ES087T : Intel Core i7-8750H, 15.60", 2.4 kg
External Review » Asus Strix Scar II GL504GV-ES087T
Asus Strix Scar II GL704GV-EV052T: Intel Core i7-8750H, 17.30", 2.9 kg
External Review » Asus Strix Scar II GL704GV-EV052T
MSI GL63 8SE-071: Intel Core i7-8750H, 15.60", 2.3 kg
External Review » MSI GL63 8SE-071
Acer Predator Triton 500 PT515-51-557V: Intel Core i5-8300H, 15.60", 2.1 kg
External Review » Acer Predator Triton 500 PT515-51-557V
MSI GS75 8SE-073: Intel Core i7-8750H, 17.30", 2.3 kg
External Review » MSI GS75 8SE-073
» Comparison of GPUs
Detailed list of all laptop GPUs sorted by class and performance.
» Benchmark List
Sort and restrict laptop GPUs based on performance in synthetic benchmarks.
» Notebook Gaming List
Playable games for each graphics card and their average FPS results.
* Approximate position of the graphics adapter
» Notebookcheck多媒体笔记本电脑Top 10排名
» Notebookcheck游戏笔记本电脑Top 10排名
» Notebookcheck低价办公/商务笔记本电脑Top 10排名
» Notebookcheck高端办公/商务笔记本电脑Top 10排名
» Notebookcheck工作站笔记本电脑Top 10排名
» Notebookcheck亚笔记本电脑Top 10排名
» Notebookcheck超级本产品Top 10排名
» Notebookcheck变形本产品Top 10排名
» Notebookcheck平板电脑Top 10排名
» Notebookcheck智能手机Top 10排名
» Notebookcheck评测过最出色的笔记本电脑屏幕
» Notebookcheck售价500欧元以下笔记本电脑Top 10排名
» Notebookcheck售价300欧元以下笔记本电脑Top 10排名