


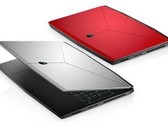
Alienware外星人m15(i7-8750H, GTX 1070 Max-Q)笔记本电脑评测
Alienware的第一款超薄笔记本电脑继承了Alienware 15 R4的精神,同时推动该系列向轻薄游戏本领域迈进。当然,在使用更小的设计时必须做出一些牺牲,但总的来说,它是成功的,睿频性能和机身刚性方面尤为出色。
Intel Core i7-8750H, NVIDIA GeForce GTX 1070 Max-Q, 15.6", 2.2 kg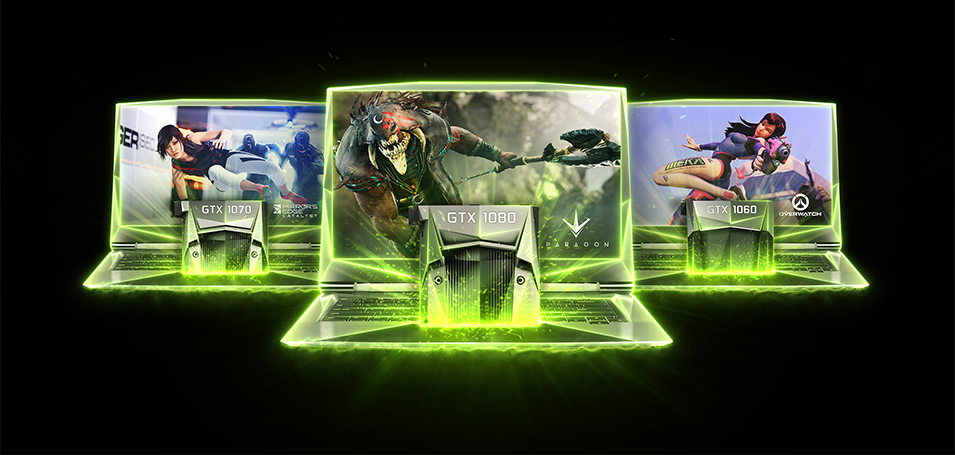
英伟达GeForce GTX 1070 Max-Q设计方案,是Pascal系列中的高端显卡。为轻薄笔记本而设计,比通常版本的GTX 1070的性能低10-15%,具体取决于散热。 T基础频率(1101-1215 MHz)也比常规GTX 1070(1433 MHz,至少少10%)低得多,睿频(1265-1379 MHz)也比为常规的GTX 1070的1645 MHz低得多(至少少6%)。但是,时钟频率是一样的。
时钟频率不是它与常规的GTX 1070的唯一区别。Max-Q版本的驱动程序针对效率(而不是性能)进行了优化,优化的电压转换器可用于1V操作,拥有高端冷却方法以及40 dB的风扇噪声限制(靠着时钟频率的调整)。
特点
GP104芯片采用台积电16nm FinFET工艺制造,提供了一系列新功能。DisplayPort 1.4(Ready),HDMI 2.0b,HDR,同时多投影(SMP),以及改良后的H.265视频编解码器(用于PlayReady 3.0)只是其中一部分功能。有关更多详细信息,请参阅我们的Pascal体系构架页面。
英伟达称,Max-Q设计的功耗显着低于笔记本电脑中的普通GTX 1070显卡,范围在80到90瓦(TGP)。
GeForce GTX 1000 Series
| ||||||||||||||||||||||||||||||||||||||||||||||||||||||||||||||||
| Codename | N17E-G2 Max-Q | |||||||||||||||||||||||||||||||||||||||||||||||||||||||||||||||
| Architecture | Pascal | |||||||||||||||||||||||||||||||||||||||||||||||||||||||||||||||
| Pipelines | 2048 - unified | |||||||||||||||||||||||||||||||||||||||||||||||||||||||||||||||
| Core Speed | 1101 - 1215 - 1265 - 1379 (Boost) MHz | |||||||||||||||||||||||||||||||||||||||||||||||||||||||||||||||
| Memory Speed | 8000 MHz | |||||||||||||||||||||||||||||||||||||||||||||||||||||||||||||||
| Memory Bus Width | 256 Bit | |||||||||||||||||||||||||||||||||||||||||||||||||||||||||||||||
| Memory Type | GDDR5 | |||||||||||||||||||||||||||||||||||||||||||||||||||||||||||||||
| Max. Amount of Memory | 8 GB | |||||||||||||||||||||||||||||||||||||||||||||||||||||||||||||||
| Shared Memory | no | |||||||||||||||||||||||||||||||||||||||||||||||||||||||||||||||
| API | DirectX 12_1, OpenGL 4.5 | |||||||||||||||||||||||||||||||||||||||||||||||||||||||||||||||
| Transistor Count | 7.2 Billion | |||||||||||||||||||||||||||||||||||||||||||||||||||||||||||||||
| Man. Technology | 16 nm | |||||||||||||||||||||||||||||||||||||||||||||||||||||||||||||||
| Features | Multi-Projection, VR Ready, G-SYNC, Vulkan, Multi Monitor | |||||||||||||||||||||||||||||||||||||||||||||||||||||||||||||||
| Notebook Size | large | |||||||||||||||||||||||||||||||||||||||||||||||||||||||||||||||
| Date of Announcement | 30.05.2017 | |||||||||||||||||||||||||||||||||||||||||||||||||||||||||||||||
The following benchmarks stem from our benchmarks of review laptops. The performance depends on the used graphics memory, clock rate, processor, system settings, drivers, and operating systems. So the results don't have to be representative for all laptops with this GPU. For detailed information on the benchmark results, click on the fps number.


For more games that might be playable and a list of all games and graphics cards visit our Gaming List
HP Omen 15-dc0010ng: Intel Core i7-8750H, 15.60", 2.5 kg
External Review » HP Omen 15-dc0010ng
MSI Creator P65 8RF-453NE: Intel Core i7-8750H, 15.60", 1.9 kg
External Review » MSI Creator P65 8RF-453NE
Alienware m15 GTX 1070 Max-Q: Intel Core i7-8750H, 15.60", 2.2 kg
External Review » Alienware m15 GTX 1070 Max-Q
MSI P65 8RF-451 - Creator: Intel Core i7-8750H, 15.60", 1.9 kg
External Review » MSI P65 8RF-451 - Creator
MSI GS65 8RF-233NL: Intel Core i7-8750H, 15.60", 1.9 kg
External Review » MSI GS65 8RF-233NL
MSI P65 Creator 8RF-456NL: Intel Core i7-8750H, 15.60", 1.9 kg
External Review » MSI P65 Creator 8RF-456NL
MSI P65 Creator 8RF-445ES: Intel Core i7-8750H, 15.60", 1.9 kg
External Review » MSI P65 Creator 8RF-445ES
Alienware m15, GTX 1070 Max-Q: Intel Core i7-8750H, 15.60", 2.2 kg
External Review » Alienware m15, GTX 1070 Max-Q
MSI GS65 Stealth Thin 8RF-038NL: Intel Core i7-8750H, 15.60", 1.9 kg
External Review » MSI GS65 Stealth Thin 8RF-038NL
Asus Zephyrus S GX531GS: Intel Core i7-8750H, 15.60", 2.1 kg
External Review » Asus GX531GS (Zephyrus S)
Origin PC EVO15-S 2018, 8750H: Intel Core i7-8750H, 15.60", 2 kg
External Review » Origin PC EVO15-S 2018, 8750H
Hyperbook SL950VR2: Intel Core i7-8750H, 15.60", 1.9 kg
External Review » Hyperbook SL950VR2
Razer Blade 15 2018: Intel Core i7-8750H, 15.60", 2.1 kg
External Review » Razer Blade 15 2018
MSI GS65 8RF-019DE Stealth Thin: Intel Core i7-8750H, 15.60", 1.8 kg
External Review » MSI GS65 8RF-019DE Stealth Thin
MSI GS65 8RF-078 Stealth Thin: Intel Core i7-8750H, 15.60", 1.8 kg
External Review » MSI GS65 8RF-078 Stealth Thin
Gigabyte Aero 15X v8: Intel Core i7-8750H, 15.60", 2.1 kg
External Review » Gigabyte Aero 15X v8
MSI GS73VR 7RG-003 Stealth Pro: Intel Core i7-7700HQ, 17.30", 2.4 kg
External Review » MSI GS73VR 7RG-003 Stealth Pro
MSI GS63VR 7RG: Intel Core i7-7700HQ, 15.60", 1.9 kg
External Review » MSI GS63VR 7RG
MSI GS63VR Stealth Pro-002: Intel Core i7-7700HQ, 15.60", 1.8 kg
External Review » MSI GS63VR Stealth Pro-002
Gigabyte Aero 15X: Intel Core i7-7700HQ, 15.60", 2.2 kg
External Review » Gigabyte Aero 15X
» Comparison of GPUs
Detailed list of all laptop GPUs sorted by class and performance.
» Benchmark List
Sort and restrict laptop GPUs based on performance in synthetic benchmarks.
» Notebook Gaming List
Playable games for each graphics card and their average FPS results.
* Approximate position of the graphics adapter
» Notebookcheck多媒体笔记本电脑Top 10排名
» Notebookcheck游戏笔记本电脑Top 10排名
» Notebookcheck低价办公/商务笔记本电脑Top 10排名
» Notebookcheck高端办公/商务笔记本电脑Top 10排名
» Notebookcheck工作站笔记本电脑Top 10排名
» Notebookcheck亚笔记本电脑Top 10排名
» Notebookcheck超级本产品Top 10排名
» Notebookcheck变形本产品Top 10排名
» Notebookcheck平板电脑Top 10排名
» Notebookcheck智能手机Top 10排名
» Notebookcheck评测过最出色的笔记本电脑屏幕
» Notebookcheck售价500欧元以下笔记本电脑Top 10排名
» Notebookcheck售价300欧元以下笔记本电脑Top 10排名