Notebookcheck Logo

AMD Radeon RX Vega 11

AMD Vega 11

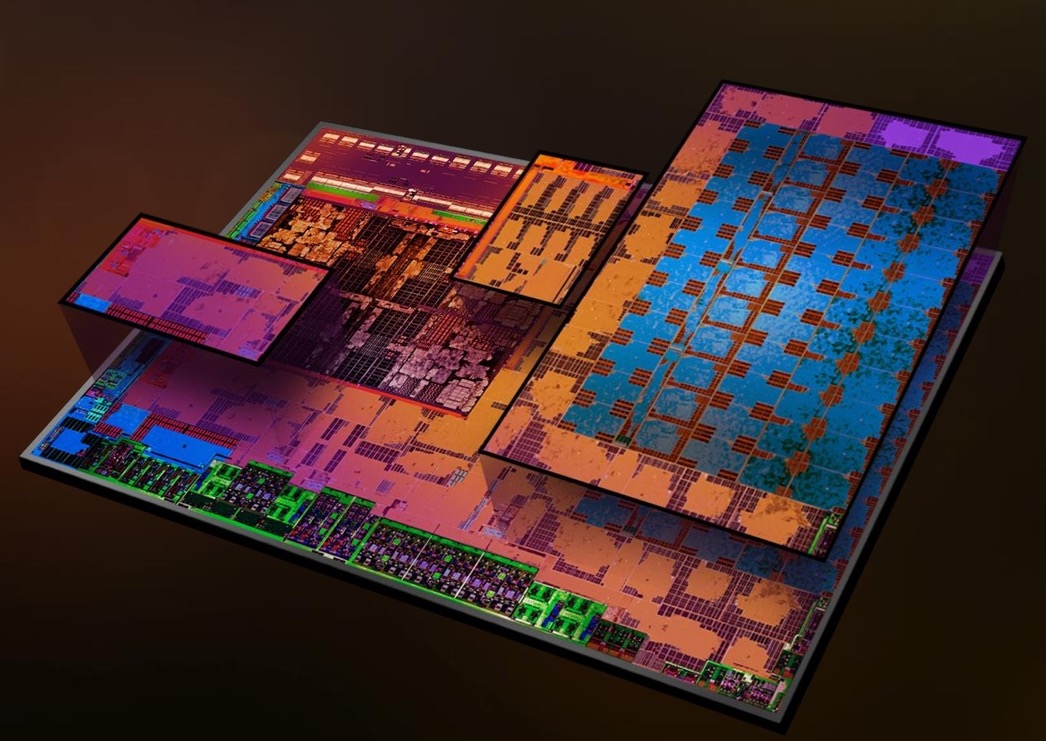
AMD Radeon RX Vega 11是在2018年初推出的Ryzen桌面APU(Ryzen 5 2400G)中的集成GPU。该显卡基于Vega架构(第5代GCN)并具有11个CU(= 704个着色器)时钟频率高达1240 MHz(Ryzen 5 2400G)。 GPU性能会受益于快速双通道DDR4-2400 RAM(DDR4-2133可能会情况不同)。

Vega架构相对于Polaris一代有了一些改进,现在支持DirectX 12 Feature Level 12_1。我们有关Raven Ridge架构的专门文章中提供了更多信息。

根据AMD发布的第一个3DMark Fire Strike跑分,Vega 11有着与旧款Radeon R9 M280X相当的理论性能。然而,在游戏中,专用图形存储器的缺少可能会是瓶颈。因此,现代硬件要求苛刻的游戏只能在最低的设置下运行,APU主要可以用于硬件要求较低的游戏,如Overwatch,Dota 2等

由于14nm工艺和巧妙的省电功能,功耗相对较低。然而,与具有15瓦TDP的移动APU相比,APU的高TDP(65W)应该会有更高的功耗。

AMD Radeon RX Vega Series

RX Vega 64 4096 @ 1.63 GHz2048 Bit @ 945 MHz
RX Vega 56 3584 @ 1.14 - 1.47 GHz409.6 Bit @ 800 MHz
Vega Mobile 1792 2048 Bit
Vega M GH 1536 @ 1.06 - 1.19 GHz
Vega M GL / 870 1280 @ 0.93 - 1.01 GHz
WX Vega M GL 1280 @ 0.93 - 1.01 GHz
Vega 11 704 @ 1.24 GHz
CodenameVega Raven Ridge
ArchitectureVega
Pipelines704 - unified
Core Speed1240 (Boost) MHz
Shared Memoryno
APIDirectX 12_1
Power Consumption65 Watt
Transistor Count4.5 Billion
technology14 nm
FeaturesTiled Rasterization, Shared Memory (up to Dual-Channel DDR4-2400)
Date of Announcement26.10.2017
CPU in Vega 11GPU Base SpeedGPU Boost / Turbo
AMD Ryzen 5 2400G4 x 3600 MHz, 65 W? MHz1250 MHz
AMD Ryzen 7 3780U4 x 2300 MHz, 15 W? MHz1400 MHz
AMD Ryzen 7 2800H4 x 3300 MHz, 45 W? MHz1300 MHz
min. - max.? MHz1250 - 1400 MHz

Benchmarks

Performance Rating - 3DMark 11 + Fire Strike + Time Spy
1.6 pt (5%)
AMD Radeon HD 8180
0.06605 -96%
...
1.406 -12%
1.426 -10%
AMD Radeon Pro WX 3200
1.438 -10%
NVIDIA GeForce GTX 950M
1.458 -8%
NVIDIA Quadro P520
1.466 -8%
NVIDIA GeForce GTX 770M
1.525 -4%
AMD Radeon RX Vega 7
1.525 -4%
AMD Radeon R9 M385X
1.551 -3%
1.589 0%
AMD Radeon RX Vega 11
1.592
AMD Radeon R9 M280X
1.593 0%
NVIDIA Quadro M1000M
1.593 0%
1.594 0%
1.66 4%
1.665 5%
1.667 5%
1.679 5%
AMD Radeon RX 550X (Laptop)
1.68 6%
NVIDIA GeForce GT 750M SLI
1.687 6%
...
21.1 1225%
max:
33.3 1992%
0%
100%
3DMark - 3DMark Time Spy Score
min: 886     avg: 1075     median: 1127 (3%)     max: 1212 Points
3DMark - 3DMark Time Spy Graphics
min: 786     avg: 936     median: 935.5 (2%)     max: 1085 Points
Intel UHD Graphics 605
113 -88%
...
Intel UHD Graphics Xe G4 48EUs
763 -18%
787 -16%
796 -15%
AMD Radeon 540X
797 -15%
Qualcomm Adreno 690
811 -13%
AMD Radeon Pro WX 3100
820 -12%
AMD Radeon RX Vega 6 (Ryzen 4000/5000)
821 -12%
862 -8%
AMD Radeon RX Vega 9
872 -7%
AMD Radeon RX Vega 11
936
AMD Radeon Pro 450
952 2%
AMD Radeon Pro WX 3200
956 2%
NVIDIA GeForce GTX 950M
971 4%
AMD Radeon RX Vega 7
991 6%
995 6%
NVIDIA Quadro P520
999 7%
1008 8%
AMD Radeon R9 M280X
1012 8%
AMD Radeon RX 550X (Laptop)
1050 12%
...
19434 1976%
max:
36485 3798%
0%
100%
3DMark - 3DMark Ice Storm Unlimited Graphics
min: 149941     avg: 160025     median: 157382 (18%)     max: 175397 Points
3DMark - 3DMark Ice Storm Extreme Graphics
min: 69751     avg: 87099     median: 87098.5 (11%)     max: 104446 Points
3DMark - 3DMark Cloud Gate Score
min: 13263     avg: 14436     median: 14579 (16%)     max: 15323 Points
3DMark - 3DMark Cloud Gate Graphics
min: 17047     avg: 20261     median: 20847.5 (5%)     max: 22303 Points
3DMark - 3DMark Fire Strike Standard Score
min: 2219     avg: 2934     median: 3038.5 (5%)     max: 3264 Points
3DMark - 3DMark Fire Strike Standard Graphics
min: 3476     avg: 3523     median: 3494 (4%)     max: 3599 Points
3DMark - 3DMark Ice Storm Graphics
min: 88177     avg: 108334     median: 108334 (13%)     max: 128491 Points
3DMark - 3DMark Night Raid
8516 Points (8%)
3DMark - 3DMark Night Raid Graphics Score
9324 Points (4%)
3DMark 11 - 3DM11 Performance Score
min: 4277     avg: 5210     median: 5350 (7%)     max: 5635 Points
3DMark 11 - 3DM11 Performance GPU
min: 4337     avg: 5213     median: 5483 (5%)     max: 5549 Points
171.8 -97%
...
4787 -8%
4894 -6%
NVIDIA GeForce GTX 860M
4913 -6%
4957 -5%
NVIDIA GeForce GTX 770M
4974 -5%
AMD Radeon RX Vega 7
5054 -3%
NVIDIA Quadro M2000M
5134 -2%
5167 -1%
AMD Radeon Pro 555
5185 -1%
AMD Radeon RX Vega 11
5213
5235 0%
NVIDIA GeForce GTX 960M
5277 1%
AMD Radeon Pro 560
5305 2%
5310 2%
5334 2%
AMD Radeon RX 550X (Laptop)
5345 3%
AMD Radeon Pro 455
5388 3%
AMD FirePro M6100
5445 4%
AMD Radeon R9 M385X
5515 6%
...
59943 1050%
max:
106023 1934%
0%
100%
3DMark 06 3DMark 06 - Standard 1280x1024 +
3DMark 06
20608 Points (27%)
Cinebench R10 Cinebench R10 Shading (32bit) +
Cinebench R10 - Cinebench R10 Shading (32bit)
min: 10880     avg: 11001     median: 11001 (8%)     max: 11122 points
Cinebench R11.5 Cinebench R11.5 OpenGL 64 Bit +
Cinebench R11.5 - Cinebench R11.5 OpenGL 64 Bit
min: 59.7     avg: 65     median: 65 (23%)     max: 70.3 fps
Cinebench R15
Cinebench R15 OpenGL 64 Bit +
Cinebench R15 - Cinebench R15 OpenGL 64 Bit
min: 80.1     avg: 80.2     median: 80.1 (5%)     max: 80.4 fps
Cinebench R15 OpenGL Ref. Match 64 Bit +
Cinebench R15 - Cinebench R15 OpenGL Ref. Match 64 Bit
98 % (98%)
LuxMark v2.0 64Bit - LuxMark v2.0 Room GPU
min: 447     avg: 465     median: 465 (2%)     max: 483 Samples/s
LuxMark v2.0 64Bit - LuxMark v2.0 Sala GPU
min: 1019     avg: 1074     median: 1074 (2%)     max: 1129 Samples/s
ComputeMark v2.1 - ComputeMark v2.1 Result
min: 3392     avg: 3425     median: 3425 (4%)     max: 3458 points
Power Consumption - Furmark Stress Test Power Consumption - external Monitor *
min: 78.7     avg: 89.3     median: 89.3 (13%)     max: 99.9 Watt
Power Consumption - The Witcher 3 Power Consumption - external Monitor *
min: 63.1     avg: 76.1     median: 74.7 (10%)     max: 90.5 Watt
Power Consumption - Witcher 3 Power Consumption *
90.5 Watt (20%)
Power Consumption - Witcher 3 ultra Power Efficiency - external Monitor
0.2 fps per Watt (13%)
Emissions Witcher 3 Fan Noise +
Emissions - Witcher 3 Fan Noise
42 dB(A) (67%)
Clock Speed - GPU Clock Witcher 3 ultra
1240 MHz (49%)
Clock Speed - GPU Clock Speed Furmark
1240 MHz (49%)
- Range of benchmark values for this graphics card
- Average benchmark values for this graphics card
* Smaller numbers mean a higher performance

Game Benchmarks

The following benchmarks stem from our benchmarks of review laptops. The performance depends on the used graphics memory, clock rate, processor, system settings, drivers, and operating systems. So the results don't have to be representative for all laptops with this GPU. For detailed information on the benchmark results, click on the fps number.

low 1280x720
38.1 56.1 ~ 47 fps    + Compare
med. 1920x1080
14.3 21.7 ~ 18 fps    + Compare
high 1920x1080
8.2 13.2 ~ 11 fps    + Compare
ultra 1920x1080
6.2 8.9 ~ 8 fps    + Compare
» With all tested laptops playable in detail settings low.
Control

Control

2019
low 1280x720
41.2  fps    + Compare
med. 1920x1080
12.5  fps    + Compare
high 1920x1080
7.1  fps    + Compare
» With all tested laptops playable in detail settings low.
F1 2019

F1 2019

2019
low 1280x720
84  fps    + Compare
med. 1920x1080
43  fps    + Compare
high 1920x1080
30  fps    + Compare
» With all tested laptops playable in detail settings med..
Rage 2

Rage 2

2019
low 1280x720
37.5  fps    + Compare
med. 1920x1080
31.9  fps    + Compare
high 1920x1080
31.1  fps    + Compare
» With all tested laptops playable in detail settings low.
Anno 1800

Anno 1800

2019
low 1280x720
58.5  fps    + Compare
med. 1920x1080
21.3  fps    + Compare
high 1920x1080
12.9  fps    + Compare
» With all tested laptops playable in detail settings low.
low 1280x720
62  fps    + Compare
med. 1920x1080
33  fps    + Compare
high 1920x1080
17  fps    + Compare
» With all tested laptops playable in detail settings low.
low 1280x720
121.1  fps    + Compare
med. 1920x1080
44.3  fps    + Compare
high 1920x1080
35.8  fps    + Compare
ultra 1920x1080
18.5  fps    + Compare
» With all tested laptops playable in detail settings high.
Anthem

Anthem

2019
low 1280x720
0 (!)  fps    + Compare
low 1280x720
28 39 ~ 34 fps    + Compare + 📈 Graph
med. 1920x1080
14 21 ~ 18 fps    + Compare + 📈 Graph
high 1920x1080
13 19 ~ 16 fps    + Compare + 📈 Graph
ultra 1920x1080
13 18 ~ 16 fps    + Compare + 📈 Graph
» The benchmarks indicate that the game is not playable in the tested settings.
low 1280x720
26  fps    + Compare
med. 1920x1080
11.3  fps    + Compare
high 1920x1080
8.3  fps    + Compare
ultra 1920x1080
7  fps    + Compare
» The benchmarks indicate that the game is not playable in the tested settings.
low 1280x720
64.6  fps    + Compare
med. 1920x1080
32.6  fps    + Compare
high 1920x1080
23.8  fps    + Compare
» With all tested laptops playable in detail settings low.
low 1280x720
39.4  fps    + Compare
med. 1920x1080
24.9  fps    + Compare
high 1920x1080
19.4  fps    + Compare
ultra 1920x1080
18.1  fps    + Compare
» With all tested laptops playable in detail settings low.
low 1280x720
79.6  fps    + Compare
med. 1920x1080
26.8  fps    + Compare
high 1920x1080
20.8  fps    + Compare
ultra 1920x1080
17.3  fps    + Compare
» With all tested laptops playable in detail settings low.
low 1280x720
66.9 66.9 ~ 67 fps    + Compare
med. 1920x1080
30.9 30.9 ~ 31 fps    + Compare
high 1920x1080
26.1 26.1 ~ 26 fps    + Compare
ultra 1920x1080
25.1 25.1 ~ 25 fps    + Compare
4K 3840x2160
8.4 8.4 ~ 8 fps    + Compare
» With all tested laptops playable in detail settings low.
low 1280x720
125.8  fps    + Compare
med. 1920x1080
64.2  fps    + Compare
high 1920x1080
36.6  fps    + Compare
ultra 1920x1080
15.7  fps    + Compare
» With all tested laptops playable in detail settings high.
low 1280x720
44.5 44.5 ~ 45 fps    + Compare
med. 1920x1080
24.2 24.2 ~ 24 fps    + Compare
high 1920x1080
22.3 22.3 ~ 22 fps    + Compare
ultra 1920x1080
21.6 21.6 ~ 22 fps    + Compare
» With all tested laptops playable in detail settings low.
Hitman 2

Hitman 2

2018
low 1280x720
35.9 35.9 ~ 36 fps    + Compare
med. 1920x1080
0 (!) 0 (!) ~ 0 fps    + Compare
» With all tested laptops playable in detail settings low.
low 1280x720
61.3 61.3 ~ 61 fps    + Compare
med. 1920x1080
22.5 22.5 ~ 23 fps    + Compare
» With all tested laptops playable in detail settings low.
low 1280x720
37  fps    + Compare
med. 1920x1080
20  fps    + Compare
high 1920x1080
16  fps    + Compare
ultra 1920x1080
11  fps    + Compare
4K 3840x2160
5  fps    + Compare
» With all tested laptops playable in detail settings low.
low 1280x720
78  fps    + Compare
med. 1920x1080
38  fps    + Compare
high 1920x1080
35  fps    + Compare
ultra 1920x1080
29  fps    + Compare
4K 3840x2160
12  fps    + Compare
» With all tested laptops playable in detail settings med..
FIFA 19

FIFA 19

2018
low 1280x720
123.6  fps    + Compare
med. 1920x1080
89.3  fps    + Compare
high 1920x1080
77.6  fps    + Compare
ultra 1920x1080
76.6  fps    + Compare
4K 3840x2160
25  fps    + Compare
» With all tested laptops playable in detail settings ultra.
low 1280x720
49  fps    + Compare
med. 1920x1080
19  fps    + Compare
high 1920x1080
17  fps    + Compare
ultra 1920x1080
14  fps    + Compare
4K 3840x2160
4  fps    + Compare
» With all tested laptops playable in detail settings low.
Strange Brigade

Strange Brigade

2018
low 1280x720
49.9  fps    + Compare
med. 1920x1080
20.2  fps    + Compare
high 1920x1080
17.1  fps    + Compare
ultra 1920x1080
14.8  fps    + Compare
» With all tested laptops playable in detail settings low.
F1 2018

F1 2018

2018
low 1280x720
71  fps    + Compare
med. 1920x1080
38  fps    + Compare
high 1920x1080
29  fps    + Compare
ultra 1920x1080
19  fps    + Compare
4K 3840x2160
10  fps    + Compare
» With all tested laptops playable in detail settings med..
low 1280x720
43.5  fps    + Compare
med. 1920x1080
19.9  fps    + Compare
high 1920x1080
18.3  fps    + Compare
ultra 1920x1080
13.9  fps    + Compare
» With all tested laptops playable in detail settings low.
low 1280x720
58.8  fps    + Compare
med. 1920x1080
28.4  fps    + Compare
high 1920x1080
24.6  fps    + Compare
ultra 1920x1080
17.8  fps    + Compare
4K 3840x2160
5.5  fps    + Compare
» With all tested laptops playable in detail settings low.
Far Cry 5

Far Cry 5

2018
low 1280x720
32 49 ~ 41 fps    + Compare + 📈 Graph
med. 1920x1080
15 23 ~ 19 fps    + Compare + 📈 Graph
high 1920x1080
14 22 ~ 18 fps    + Compare + 📈 Graph
ultra 1920x1080
13 20 ~ 17 fps    + Compare + 📈 Graph
» With most tested laptops playable in detail settings low.
low 1280x720
38.7 44.8 ~ 42 fps    + Compare
med. 1920x1080
29.8 34.6 ~ 32 fps    + Compare
high 1920x1080
28 31.8 ~ 30 fps    + Compare
4K 3840x2160
15.7 18.1 ~ 17 fps    + Compare
» With all tested laptops playable in detail settings low.
low 1280x720
50.6  fps    + Compare
med. 1920x1080
22.3  fps    + Compare
high 1920x1080
18.7  fps    + Compare
ultra 1920x1080
14.1  fps    + Compare
» With all tested laptops playable in detail settings low.
low 1280x720
24.4 27.2 31.1 31.3 ~ 29 fps    + Compare
med. 1920x1080
12.9 14.7 16.4 16.4 ~ 15 fps    + Compare
high 1920x1080
7.7  fps    + Compare
QHD 2560x1440
5.8  fps    + Compare
4K 3840x2160
3.3  fps    + Compare
» The benchmarks indicate that the game is not playable in the tested settings.
Fortnite

Fortnite

2018
low 1280x720
183  fps    + Compare
med. 1920x1080
86  fps    + Compare
high 1920x1080
30.8  fps    + Compare
» With all tested laptops playable in detail settings med..
low 1280x720
37 41 41 ~ 40 fps    + Compare
med. 1920x1080
20 23 23 ~ 22 fps    + Compare
high 1920x1080
18 19 20 ~ 19 fps    + Compare
» With all tested laptops playable in detail settings low.
Destiny 2

Destiny 2

2017
low 1280x720
56.7  fps    + Compare
med. 1920x1080
30.8  fps    + Compare
high 1920x1080
28.2  fps    + Compare
ultra 1920x1080
23.9  fps    + Compare
» With all tested laptops playable in detail settings low.
low 1280x720
48 53 ~ 51 fps    + Compare
med. 1920x1080
24 24 ~ 24 fps    + Compare
high 1920x1080
18 19 ~ 19 fps    + Compare
» With all tested laptops playable in detail settings low.
F1 2017

F1 2017

2017
low 1280x720
101  fps    + Compare
med. 1920x1080
45  fps    + Compare
high 1920x1080
35  fps    + Compare
» With all tested laptops playable in detail settings med..
ultra 1920x1080
75.4  fps    + Compare
4K 3820x2160
26.5  fps    + Compare
» With all tested laptops playable in detail settings ultra.
low 1280x720
144 215 ~ 180 fps    + Compare
med. 1920x1080
57.6 71 ~ 64 fps    + Compare
high 1920x1080
40 47.1 ~ 44 fps    + Compare
4K 3840x2160
15.2  fps    + Compare
» With all tested laptops playable in detail settings high.
low 1280x720
48.9 50 ~ 49 fps    + Compare
high 1920x1080
18.1  fps    + Compare
» With all tested laptops playable in detail settings low.
Overwatch

Overwatch

2016
low 1280x720
139  fps    + Compare
med. 1366x768
96  fps    + Compare
high 1920x1080
54.2  fps    + Compare
ultra 1920x1080
28.3  fps    + Compare
» With all tested laptops playable in detail settings high.
Additional Benchmarks
Medium (Render Scale 100 %) 2xAF FXAA 1920x1080
57.7
high 1920x1080
68 70 ~ 69 fps    + Compare
ultra 1920x1080
47.8 52.9 ~ 50 fps    + Compare
4K 3840 x 2160
15 15.9 ~ 15 fps    + Compare
» With all tested laptops playable in detail settings ultra.
low 1280x720
96.4 103.3 ~ 100 fps    + Compare
med. 1366x768
72 80.5 ~ 76 fps    + Compare
high 1920x1080
37 54.2 ~ 46 fps    + Compare
ultra 1920x1080
34.7 50.2 ~ 42 fps    + Compare
4K 3840x2160
13.2 20.7 ~ 17 fps    + Compare
» With most tested laptops playable in detail settings ultra.
low 1024x768
41.8  fps    + Compare
high 1920x1080
13.8  fps    + Compare
ultra 1920x1080
9.6  fps    + Compare
» With all tested laptops playable in detail settings low.
GTA V

GTA V

2015
low 1024x768
68.1 102 ~ 85 fps    + Compare
med. 1366x768
63.7  fps    + Compare
high 1920x1080
17.6 28.7 ~ 23 fps    + Compare
ultra 1920x1080
8.3 14.3 ~ 11 fps    + Compare
» With all tested laptops playable in detail settings med..
Additional Benchmarks
Normal/Off 4xAF 1920x1080
41.5
Lowest Settings possible 1920x1080
39.1
low 1024x768
65.9  fps    + Compare
med. 1366x768
44.7  fps    + Compare
high 1366x768
20.1  fps    + Compare
ultra 1920x1080
17.5 20 ~ 19 fps    + Compare
» With all tested laptops playable in detail settings med..
lowmed.highultraQHD4K
Borderlands 34718118
Control41.212.57.1
F1 2019844330
Rage 237.531.931.1
Anno 180058.521.312.9
The Division 2623317
Dirt Rally 2.0121.144.335.818.5
Anthem
Far Cry New Dawn34181616
Metro Exodus2611.38.276.97
Apex Legends64.632.623.8
Just Cause 439.424.919.418.1
Darksiders III79.626.820.817.3
Battlefield V673126258
Farming Simulator 19125.864.236.615.7
Fallout 7645242222
Hitman 2360
Call of Duty Black Ops 46123
Assassin´s Creed Odyssey372016115
Forza Horizon 47838352912
FIFA 19123.689.377.676.625
Shadow of the Tomb Raider491917144
Strange Brigade49.920.217.114.8
F1 20187138291910
Monster Hunter World43.519.918.313.9
The Crew 258.828.424.617.85.5
Far Cry 541191817
X-Plane 11.1142323017
Kingdom Come: Deliverance50.622.318.714.1
Final Fantasy XV Benchmark29157.745.753.33
Fortnite1838630.8
Assassin´s Creed Origins402219
Destiny 256.730.828.223.9
Middle-earth: Shadow of War512419
F1 20171014535
Team Fortress 275.426.5
Rocket League180644415.2
Deus Ex Mankind Divided4918.1
Overwatch1399654.228.3
World of Warships695015
Dota 2 Reborn10076464217
The Witcher 341.813.89.55
GTA V8563.72311
X-Plane 10.2565.944.720.119
< 30 fps
< 60 fps
< 120 fps
≥ 120 fps
2
21
12
6
19
12
7
27
11
2
23
2
2
1


13


For more games that might be playable and a list of all games and graphics cards visit our Gaming List

v1.26
log 26. 01:02:23

#0 no ids found in url (should be separated by "_") +0s ... 0s

#1 not redirecting to Ajax server +0s ... 0s

#2 did not recreate cache, as it is less than 5 days old! Created at Thu, 25 Apr 2024 05:40:10 +0200 +0.001s ... 0.001s

#3 no comparison url found in template nbc.compare_page_1 needed +0.087s ... 0.089s

#4 no comparison url found in template nbc.compare_page_1 needed +0s ... 0.089s

#5 no comparison url found in template nbc.compare_page_1 needed +0s ... 0.089s

#6 no comparison url found in template nbc.compare_page_1 needed +0s ... 0.089s

#7 no comparison url found in template nbc.compare_page_1 needed +0s ... 0.089s

#8 no comparison url found in template nbc.compare_page_1 needed +0s ... 0.089s

#9 composed specs +0s ... 0.089s

#10 did output specs +0s ... 0.089s

#11 start showIntegratedCPUs +0s ... 0.089s

#12 getting avg benchmarks for device 8470 +0.043s ... 0.132s

#13 got single benchmarks 8470 +0.023s ... 0.155s

#14 got avg benchmarks for devices +0s ... 0.155s

#15 min, max, avg, median took s +0.9s ... 1.055s

#16 before gaming benchmark output +0s ... 1.055s

#17 Got 222 rows for game benchmarks. +0.046s ... 1.101s

#18 composed SQL query for gamebenchmarks +0s ... 1.101s

#19 got data and put it in $dataArray +0.041s ... 1.142s

#20 benchmarks composed for output. +2.19s ... 3.332s

#21 no comparison url found in template nbc.compare_page_1 needed +0.005s ... 3.337s

#22 return log +0s ... 3.337s

Notebook reviews with AMD Radeon RX Vega 11 graphics card

Microsoft Surface Laptop 3 15 Ryzen 7 3780U: AMD Ryzen 7 3780U, 15.00", 1.5 kg
  External Review » Microsoft Surface Laptop 3 15 Ryzen 7 3700U

Please share our article, every link counts!

» Comparison of GPUs
Detailed list of all laptop GPUs sorted by class and performance.

» Benchmark List
Sort and restrict laptop GPUs based on performance in synthetic benchmarks.

» Notebook Gaming List
Playable games for each graphics card and their average FPS results.

Class 1

NVIDIA RTX A6000 Desktop
Radeon Pro W6800 Desktop
NVIDIA Titan RTX Desktop
GeForce RTX 3070 Ti Desktop
Radeon RX 6750 XT Desktop
Radeon RX 6700 XT Desktop
NVIDIA GeForce RTX 3060 Ti Desktop
Radeon RX 6650 XT Desktop
GeForce RTX 2080 (Desktop) Desktop
GeForce RTX 2080 Super Mobile

Class 2

NVIDIA GeForce RTX 3060 Desktop
Titan X Pascal Desktop
Radeon VII Desktop
Radeon RX 5700 XT (Desktop) Desktop
M1 Max 32-Core GPU *
GeForce RTX 2070 Super Mobile
GeForce GTX 1080 (Desktop) Desktop
M1 Max 24-Core GPU *
GeForce RTX 2060 Super (Desktop) Desktop
Radeon RX 5700 (Desktop) Desktop
Quadro RTX 5000 Max-Q
GeForce RTX 2060 (Desktop) Desktop
Radeon RX 5700M *
RX Vega 64 Desktop
GeForce GTX 1080 Mobile
Quadro RTX 4000 (Laptop)
M1 Pro 16-Core GPU *
Radeon PRO W6600M *
GeForce RTX 2070 Super Max-Q
Quadro RTX 4000 Max-Q *
M1 Pro 14-Core GPU *
RX Vega 56 Desktop
Quadro P5200
Radeon RX 5600 XT (Desktop) Desktop
Quadro RTX 3000 Max-Q *
Pro Vega 56 Desktop
Quadro P4200
GeForce GTX 1660 Ti (Desktop) Desktop
GeForce GTX 1660 Super (Desktop) Desktop
GeForce GTX 1660 (Desktop) Desktop
GeForce GTX 1650 Super (Desktop) Desktop
Quadro P5000 Max-Q *
Radeon R9 Fury Desktop
Radeon R9 Nano Desktop
Radeon RX 580 Desktop
GeForce GTX 980 (Laptop)
GeForce GTX 1060 (Desktop) Desktop
Radeon RX 570 Desktop
Quadro P4000
Radeon RX 480 Desktop
Quadro P4000 Max-Q
Quadro P3200
Radeon RX 580X (Laptop) *
Radeon RX 580 (Laptop)
Arc A380 Desktop
Radeon Pro 5300M
Radeon RX 5300M
GeForce GTX 970 Desktop
Quadro P3000 Max-Q *
Quadro T2000 Max-Q *
Radeon Pro WX 7100 *
Radeon RX 570X (Laptop) *
Radeon RX 570 (Laptop) *
Radeon RX 470 (Laptop) *
Quadro T1000 Max-Q *

Class 3

Vega M GH
Quadro M5000M
GeForce GTX 960 Desktop
GeForce GTX 1050 Ti Mobile
Radeon 680M
Quadro P2000
Quadro P2000 Max-Q
Quadro M4000M
T500 Laptop GPU *
Radeon R9 M395X
GeForce GTX 1050 Ti Max-Q *
Radeon Pro Vega 16
WX Vega M GL
Radeon R9 M485X
Quadro M3000M
FirePro W7170M
Radeon R9 M395
Radeon R7 370 Desktop
GeForce GTX 1050 Max-Q *
GeForce GTX 950 Desktop
T600 Desktop
Radeon 660M
Radeon Pro WX 4150 *
Radeon RX 560X (Laptop)
Radeon RX 560 (Laptop)
Radeon RX 460 (Laptop)
Quadro P1000
Radeon R9 M390
Xe MAX
Radeon Pro 560X
Radeon Pro 560
Radeon Pro 460
Radeon Pro WX 4130 *
GeForce GTX 960M
Quadro P620 *
Radeon RX 550X (Laptop)
Radeon Pro WX 3200 *
Radeon Pro 555X
Radeon Pro 555
Radeon Pro 455
Quadro P600
Quadro M2000M
Radeon RX 540X *
Radeon Pro WX 2100 *
Radeon Pro WX 3100 *
GeForce GTX 950M
Radeon Pro 450
Radeon 630
Radeon 540X *
Radeon R9 M385X
Quadro P520
Quadro M1000M
GeForce 945M
Quadro P500 *
Iris Plus Graphics G7 (Ice Lake 64 EU) *
Vega 10 *
Iris Pro Graphics 580
FirePro W5170M *
Radeon R9 M370X
Vega 9
FirePro W5130M
UHD Graphics Xe G4 48EUs *
UHD Graphics 32EUs
UHD Graphics Xe 32EUs (Tiger Lake-H) *
UHD Graphics 750
UHD Graphics Xe 750 32EUs * Desktop
Vega 7
Radeon R7 M465
FirePro W4100 Desktop
Iris Pro Graphics 6200
Vega 8
GeForce 940M
Iris Plus Graphics G4 (Ice Lake 48 EU)
Quadro M600M
FirePro W4190M
Radeon R9 M375
Radeon R7 M445
Iris Plus Graphics 650
Iris Graphics 550
Radeon 625
Vega 6 *
Iris Plus Graphics 640
Iris Graphics 540
UHD Graphics 24EUs (Alder Lake-N) *
Radeon R7 M360
GeForce 920M
Radeon 620
Radeon R7 M340
Radeon 610
Radeon 610M *
Vega 6 *
UHD Graphics G1 (Ice Lake 32 EU)
UHD Graphics P630 Desktop
UHD Graphics Xe 16EUs (Tiger Lake-H) *
HD Graphics 630 Desktop
HD Graphics 530
Radeon R5 (Bristol Ridge)
Adreno 690 *
Adreno 685 *
Adreno 680 *
FirePro W2100 Desktop
Radeon R5 M330
GeForce 910M
HD Graphics 520

Class 4

UHD Graphics 730
Radeon R5 M320 *
Radeon R5 M315 *
Radeon R5 M420 *
Vega 2 *
UHD Graphics (Elkhart Lake 32 EU) Desktop
UHD Graphics 617
UHD Graphics 615
HD Graphics 515
UHD Graphics 610
HD Graphics 510
UHD Graphics (Elkhart Lake 16 EU) Desktop
UHD Graphics 605
Radeon R4 (Stoney Ridge)
Radeon R2 (Stoney Ridge)
HD Graphics (Broadwell)
UHD Graphics 600
HD Graphics (Braswell)

Class 5

* Approximate position of the graphics adapter