戴尔Latitude 15 9520二合一与Latitude 9510二合一:较新的不一定更好
Latitude 9520 2-in-1将Latitude 9510 2-in-1上的第10代英特尔CPU换成了较新的第11代选择,同时保持机箱的一致性。因此,我们建议查看我们 关于Latitude 9510 2-in-1的现有评论以了解我们对该系统的机箱、键盘和其他物理特性的更多想法。这篇评论将重点讨论这两种机型之间的差异,包括用户在性能方面可以期待什么。
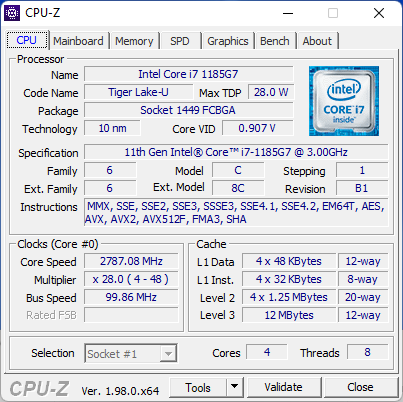
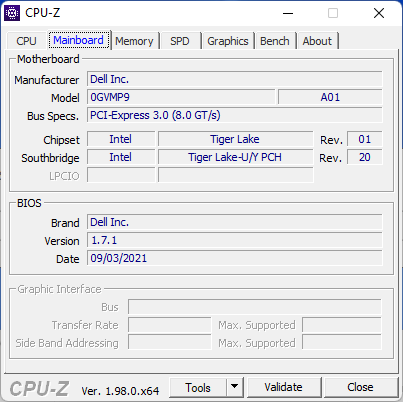
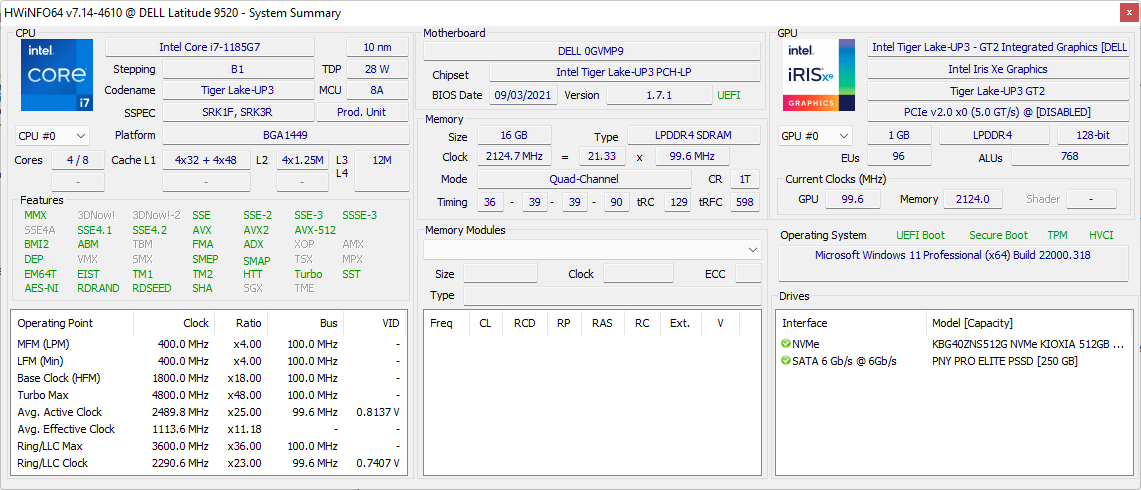
我们的测试单元是一个更高端的配置,采用支持vPro的Core i7-1185G7 CPU,Iris Xe 96 EUs GPU,16GB内存和512GB NVMe SSD,价格约为2800美元。配备酷睿i5-1145G7处理器和一半存储容量的较小SKU售价约为2300美元。请注意,所有二合一SKU都配有相同的15英寸FHD面板,带有接近传感器和电子快门。另外,如果不喜欢二合一的形式因素,用户也可以购买Latitude 9520蛤壳。
Latitude 9520二合一产品与其他高端商务转换器竞争,如微星Summit E13 Flip,微软Surface Book,惠普EliteBook x360 1040 G7, 或联想ThinkPad x13 Yoga 。
更多戴尔评论。
Potential Competitors in Comparison
Rating | Date | Model | Weight | Height | Size | Resolution | Price |
|---|---|---|---|---|---|---|---|
| 89.2 % v7 (old) | 11 / 2021 | Dell Latitude 15 9520 2-in-1 i7-1185G7, Iris Xe G7 96EUs | 1.7 kg | 13.99 mm | 15.00" | 1920x1080 | |
| 88.6 % v7 (old) | 09 / 2020 | Dell Latitude 9510 2-in-1 i7-10810U, UHD Graphics 620 | 1.7 kg | 13.99 mm | 15.00" | 1920x1080 | |
| 86.1 % v7 (old) | 09 / 2021 | HP EliteBook 850 G8 3C7Z8EA i7-1165G7, Iris Xe G7 96EUs | 1.8 kg | 19 mm | 15.60" | 1920x1080 | |
| 85.1 % v7 (old) | 08 / 2021 | Lenovo ThinkPad L15 G2 AMD R5 5600U, Vega 7 | 1.9 kg | 21 mm | 15.60" | 1920x1080 | |
| 81.2 % v7 (old) | MSI Summit B15 A11M i7-1165G7, Iris Xe G7 96EUs | 1.5 kg | 16.9 mm | 15.60" | 1920x1080 | ||
| 84.9 % v7 (old) | 05 / 2021 | Microsoft Surface Laptop 4 15 AMD TFF_00028 R7 4980U, Vega 8 | 1.6 kg | 14.7 mm | 15.00" | 2496x1664 |
案例
虽然机箱与去年的机型相同,但我们的Latitude 9520二合一测试机的铰链在60度和90度之间的角度会感觉比较弱。理想情况下,铰链的硬度应该在所有角度上都是一致的。我们建议在购买后检查铰链是否有任何异常情况。
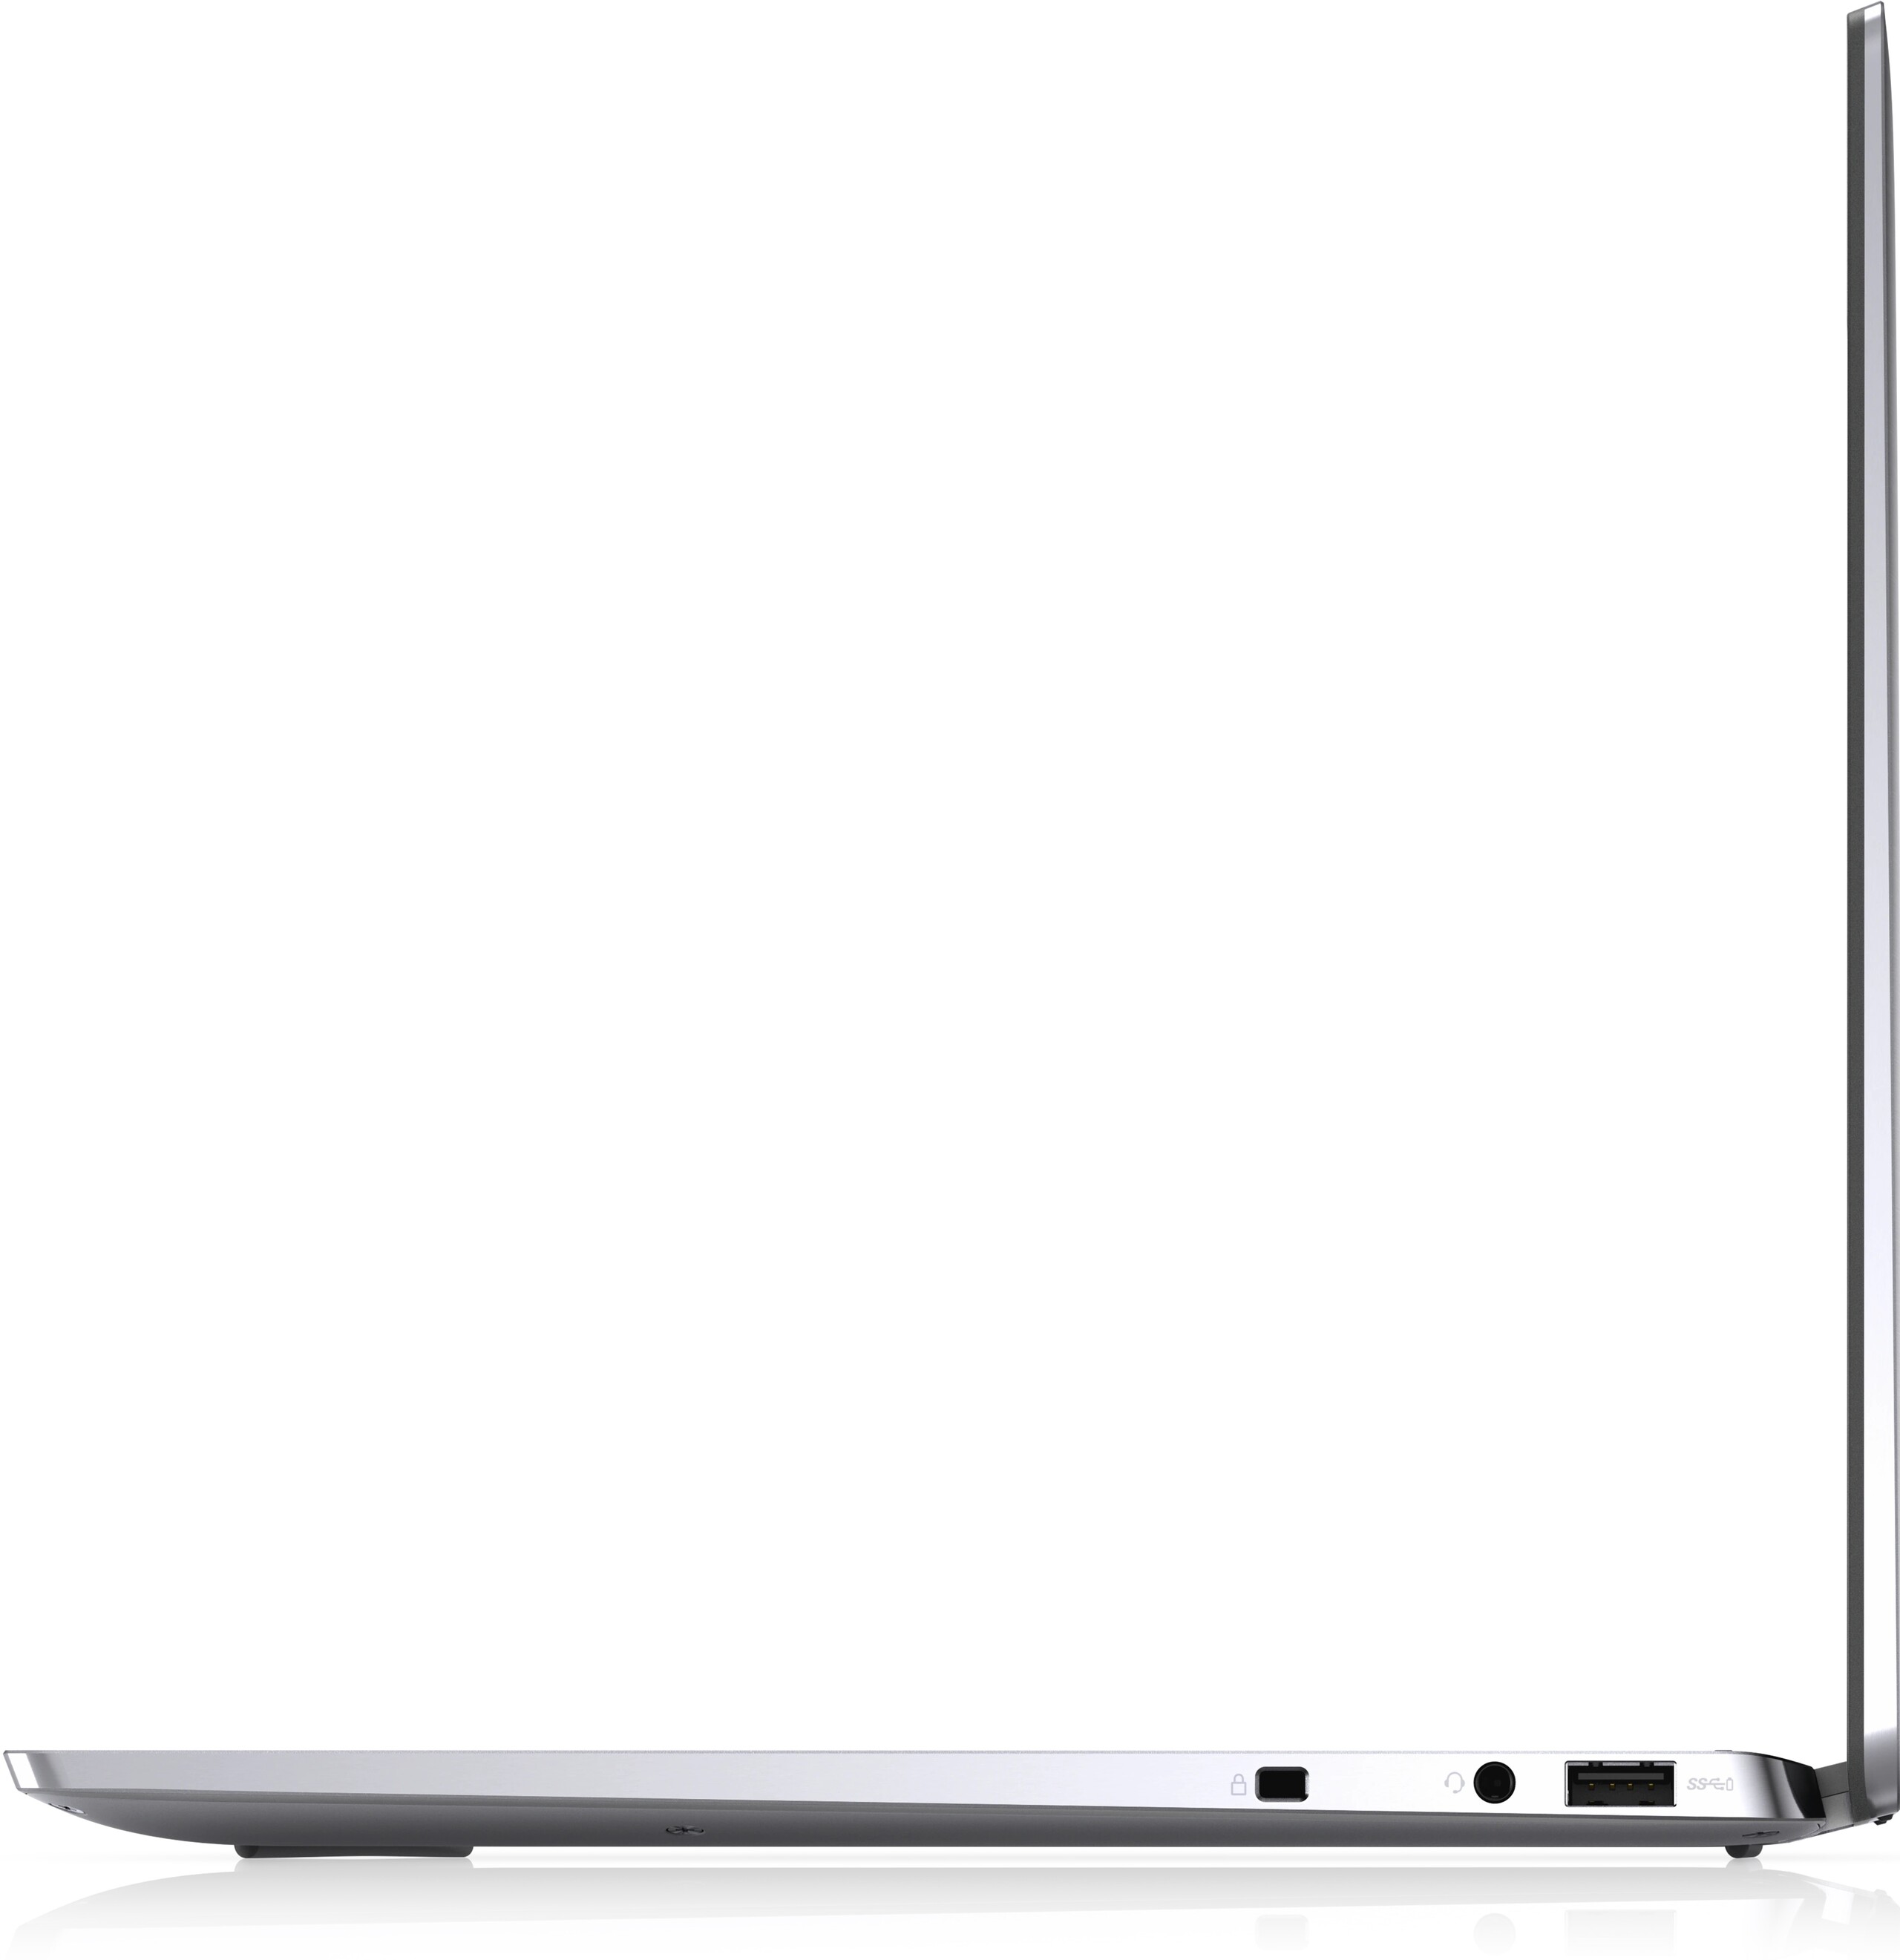
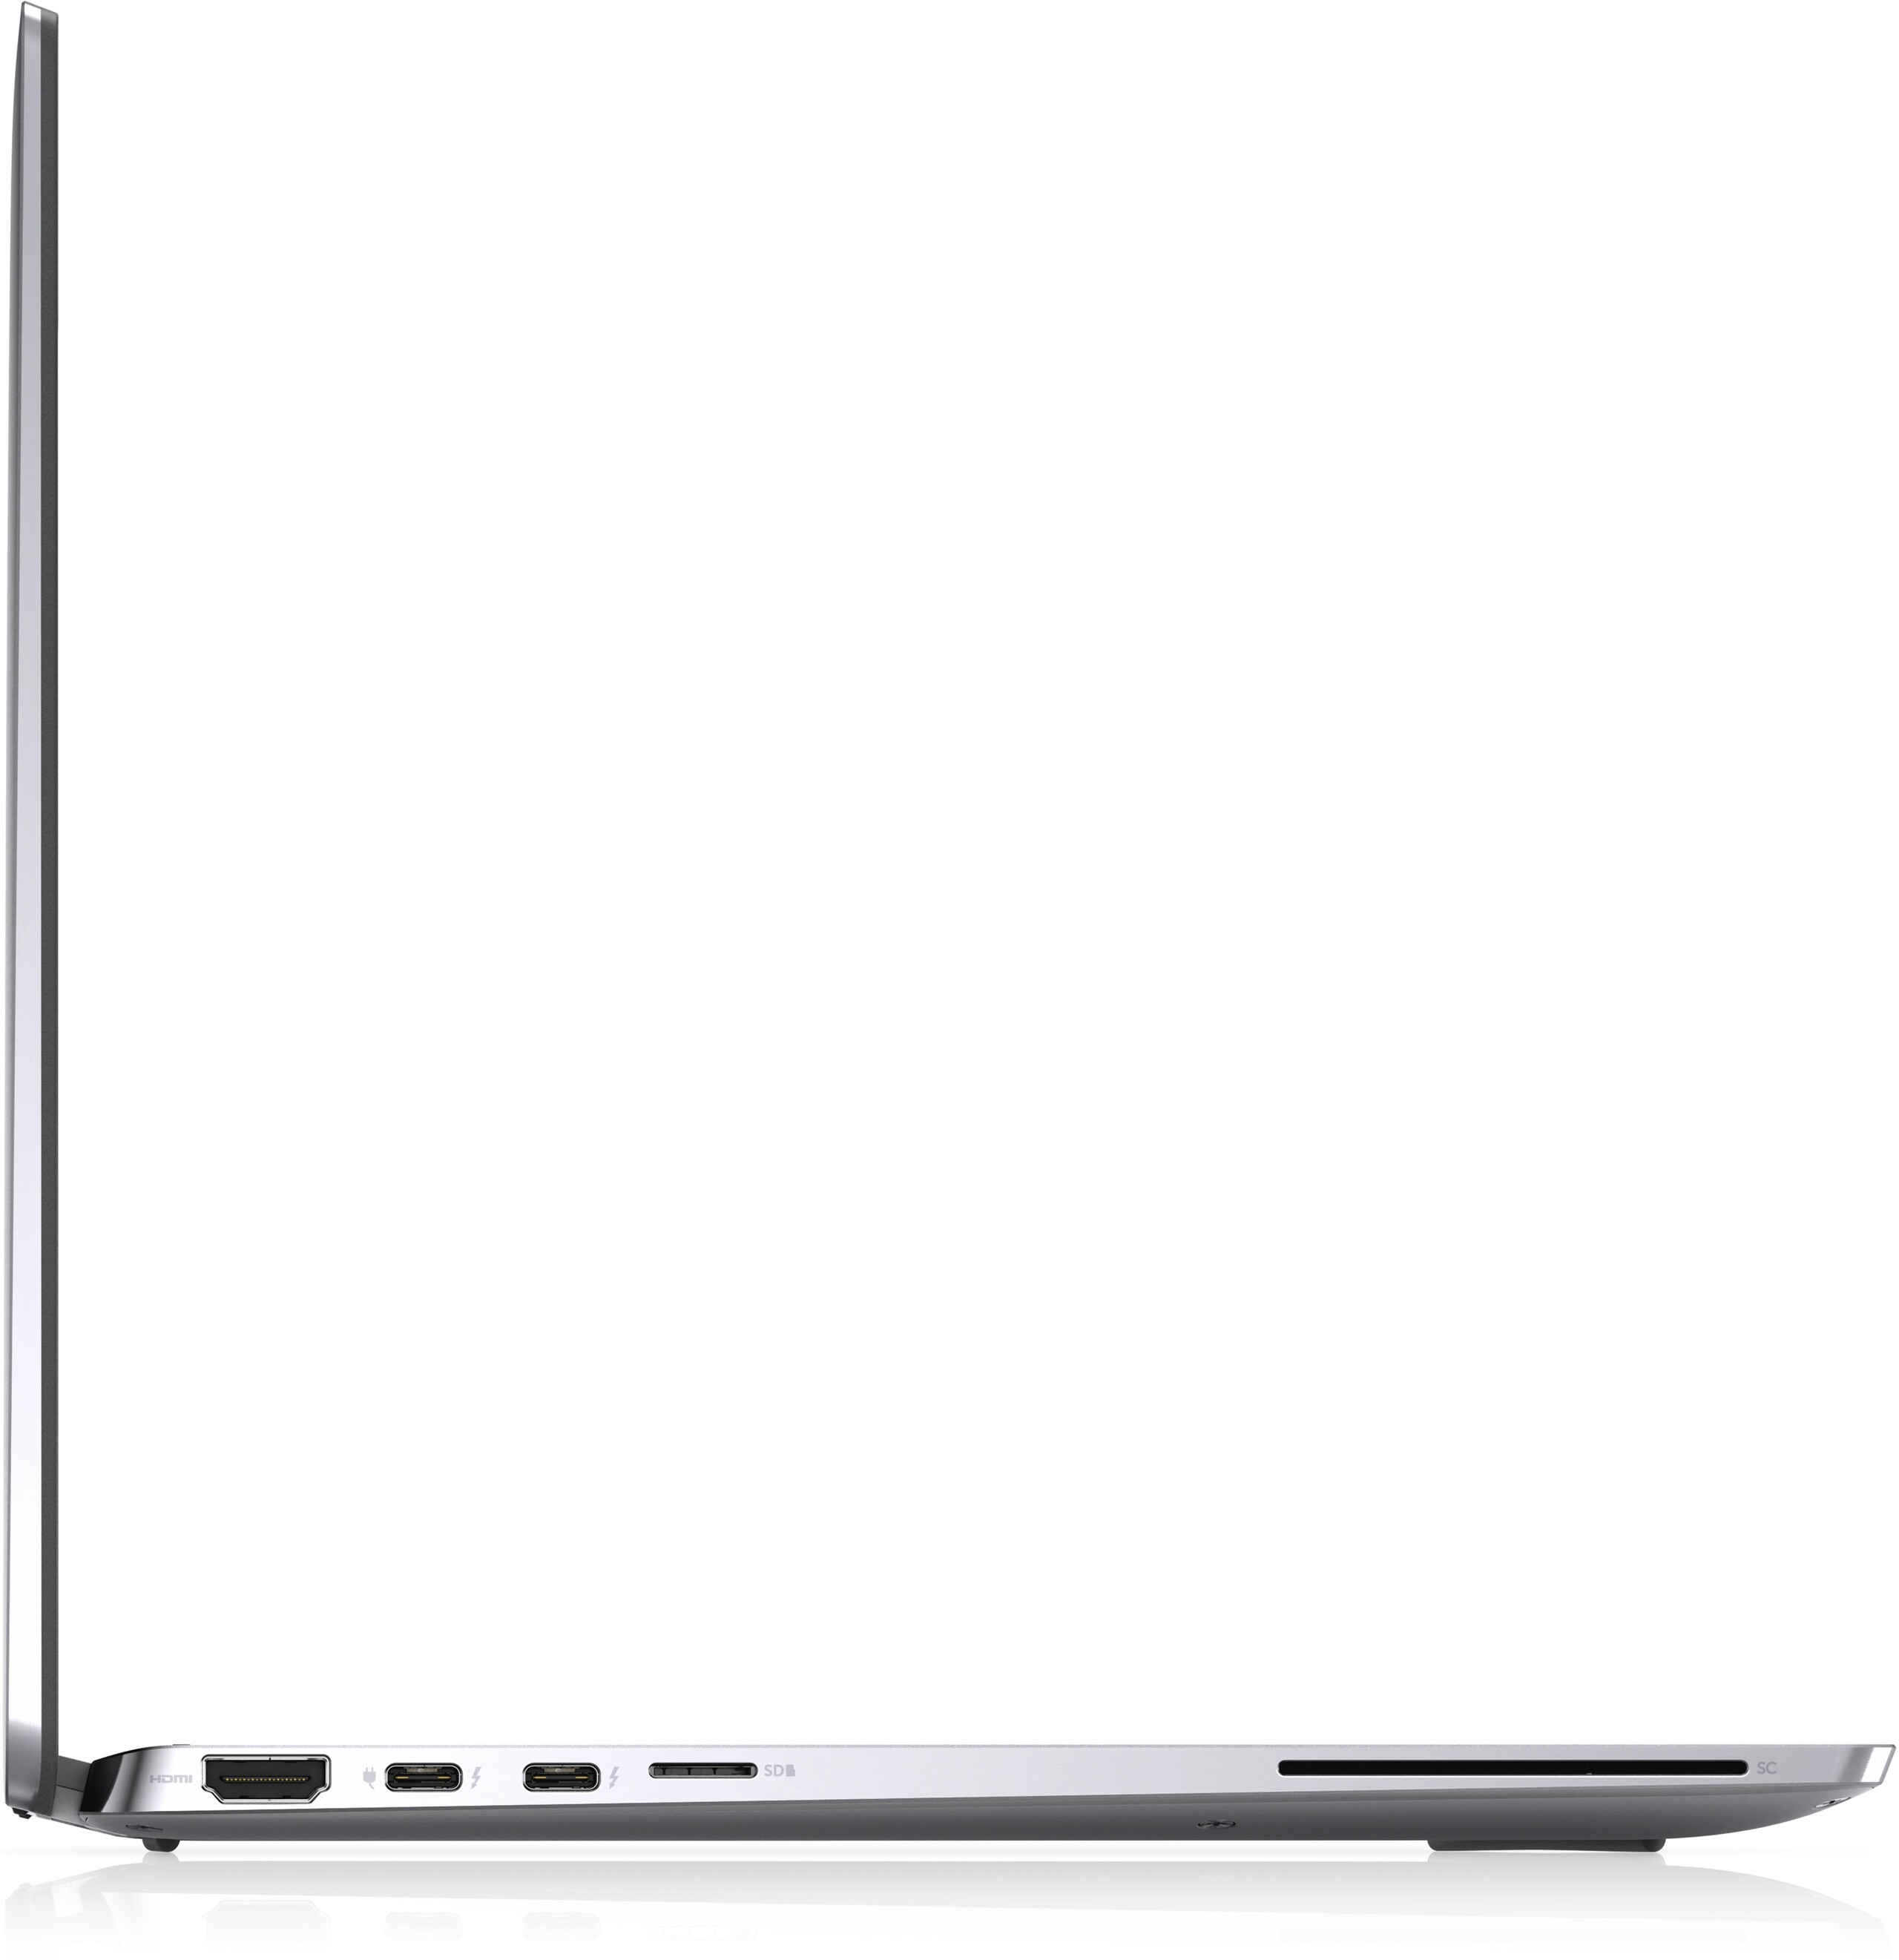
连接性
Latitude 9510上的Thunderbolt 3端口在我们的Latitude 9520上已经升级为Thunderbolt 4。然而,对大多数用户来说,升级基本上没有意义,除非你打算使用外部GPU。所有其他端口在这两种型号之间是相同的。
SD卡阅读器
| SD Card Reader | |
| average JPG Copy Test (av. of 3 runs) | |
| Dell Latitude 9510 2-in-1 (Toshiba Exceria Pro M501 64 GB UHS-II) | |
| Dell Latitude 15 9520 2-in-1 (AV Pro V60) | |
| MSI Summit B15 A11M (AV PRO microSD 128 GB V60) | |
| Lenovo ThinkPad L15 G2 AMD (AV Pro V60) | |
| maximum AS SSD Seq Read Test (1GB) | |
| MSI Summit B15 A11M (AV PRO microSD 128 GB V60) | |
| Dell Latitude 9510 2-in-1 (Toshiba Exceria Pro M501 64 GB UHS-II) | |
| Dell Latitude 15 9520 2-in-1 (AV Pro V60) | |
| Lenovo ThinkPad L15 G2 AMD (AV Pro V60) | |
沟通
| Networking | |
| iperf3 transmit AX12 | |
| HP EliteBook 850 G8 3C7Z8EA | |
| Microsoft Surface Laptop 4 15 AMD TFF_00028 | |
| MSI Summit B15 A11M | |
| Dell Latitude 15 9520 2-in-1 | |
| Dell Latitude 9510 2-in-1 | |
| Lenovo ThinkPad L15 G2 AMD | |
| iperf3 receive AX12 | |
| Dell Latitude 9510 2-in-1 | |
| Dell Latitude 15 9520 2-in-1 | |
| Microsoft Surface Laptop 4 15 AMD TFF_00028 | |
| MSI Summit B15 A11M | |
| HP EliteBook 850 G8 3C7Z8EA | |
| Lenovo ThinkPad L15 G2 AMD | |
网络摄像头


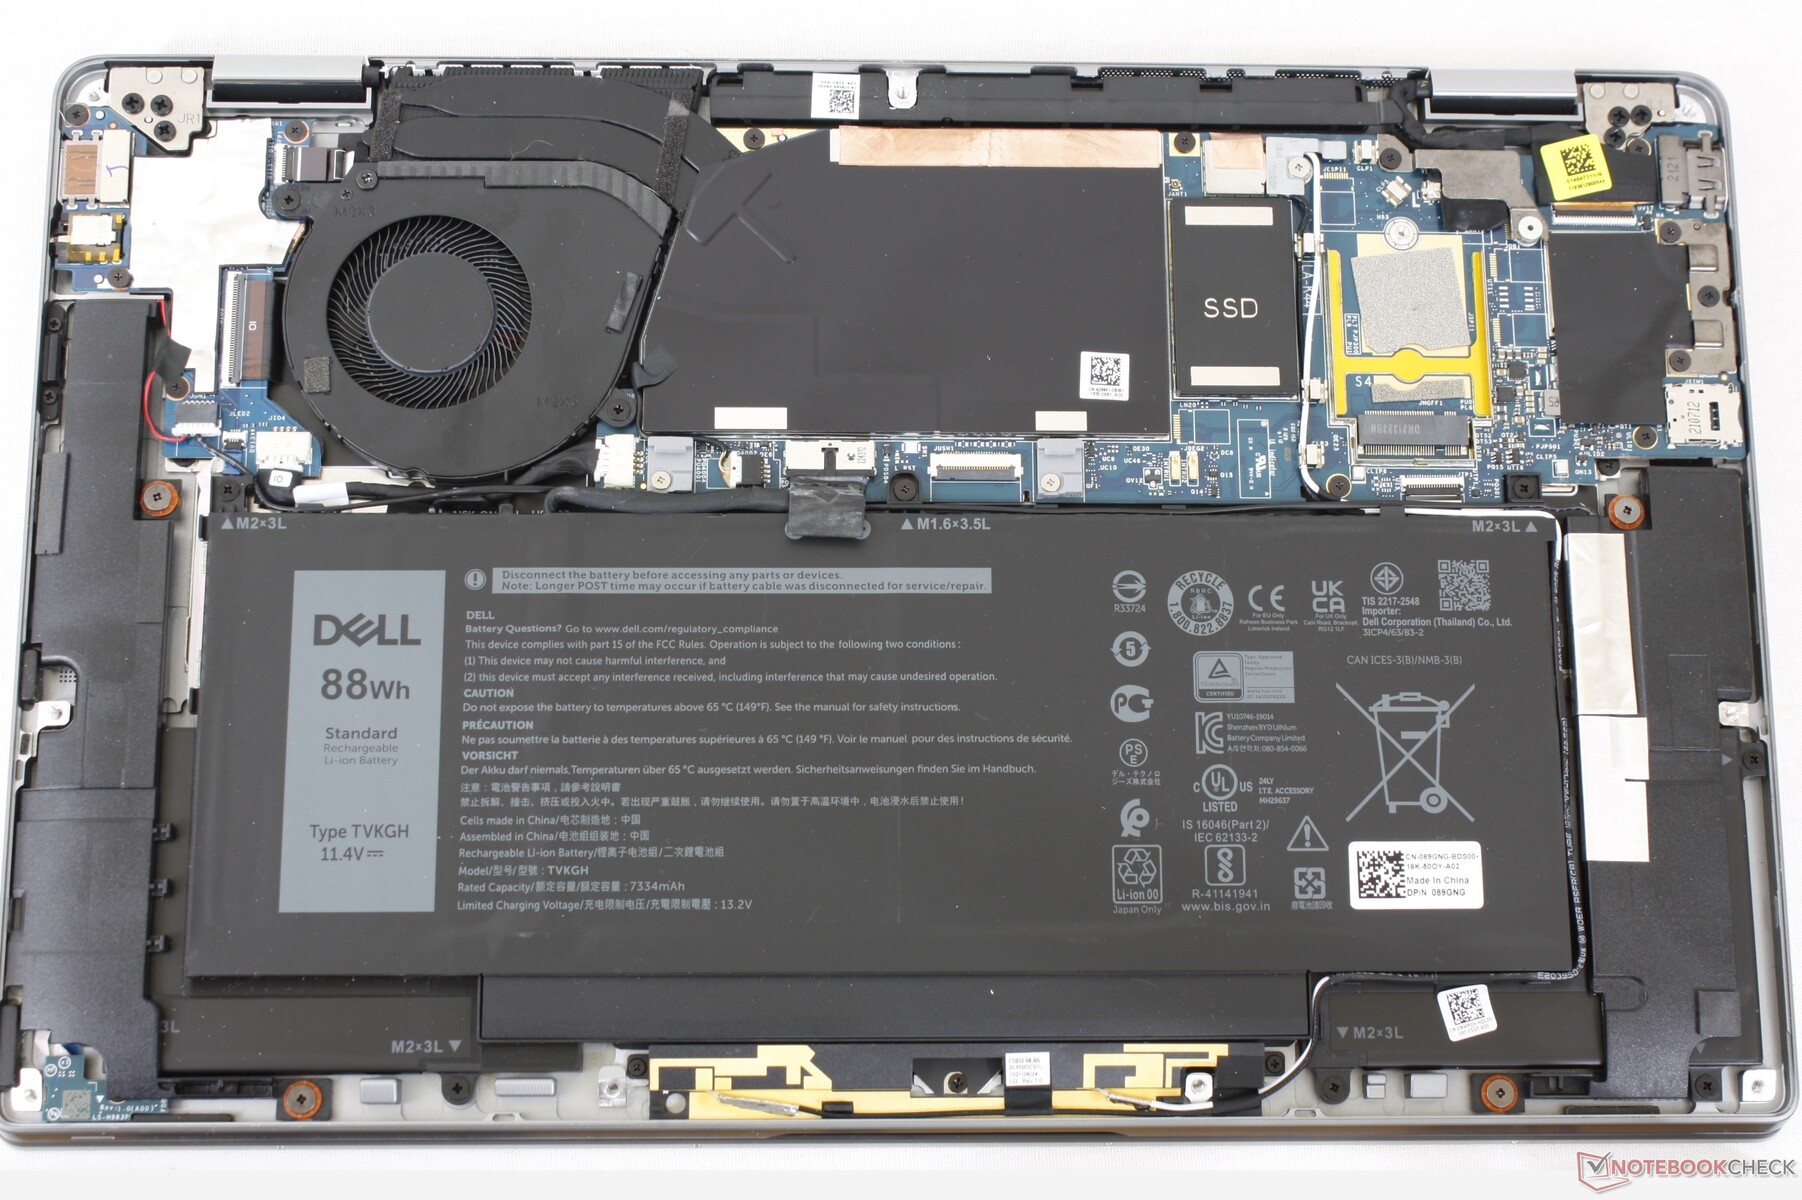
维护
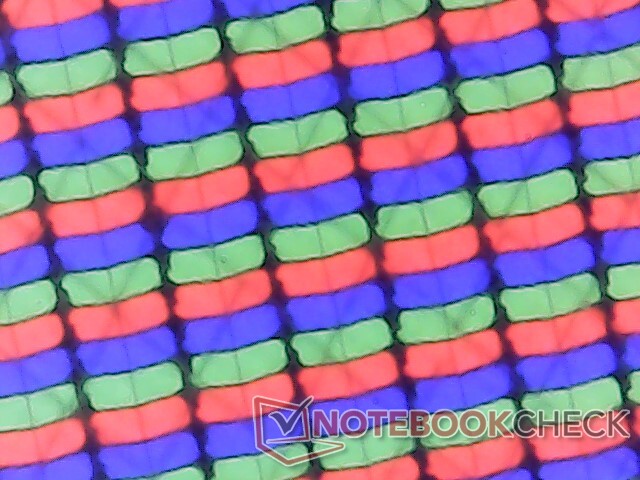
显示
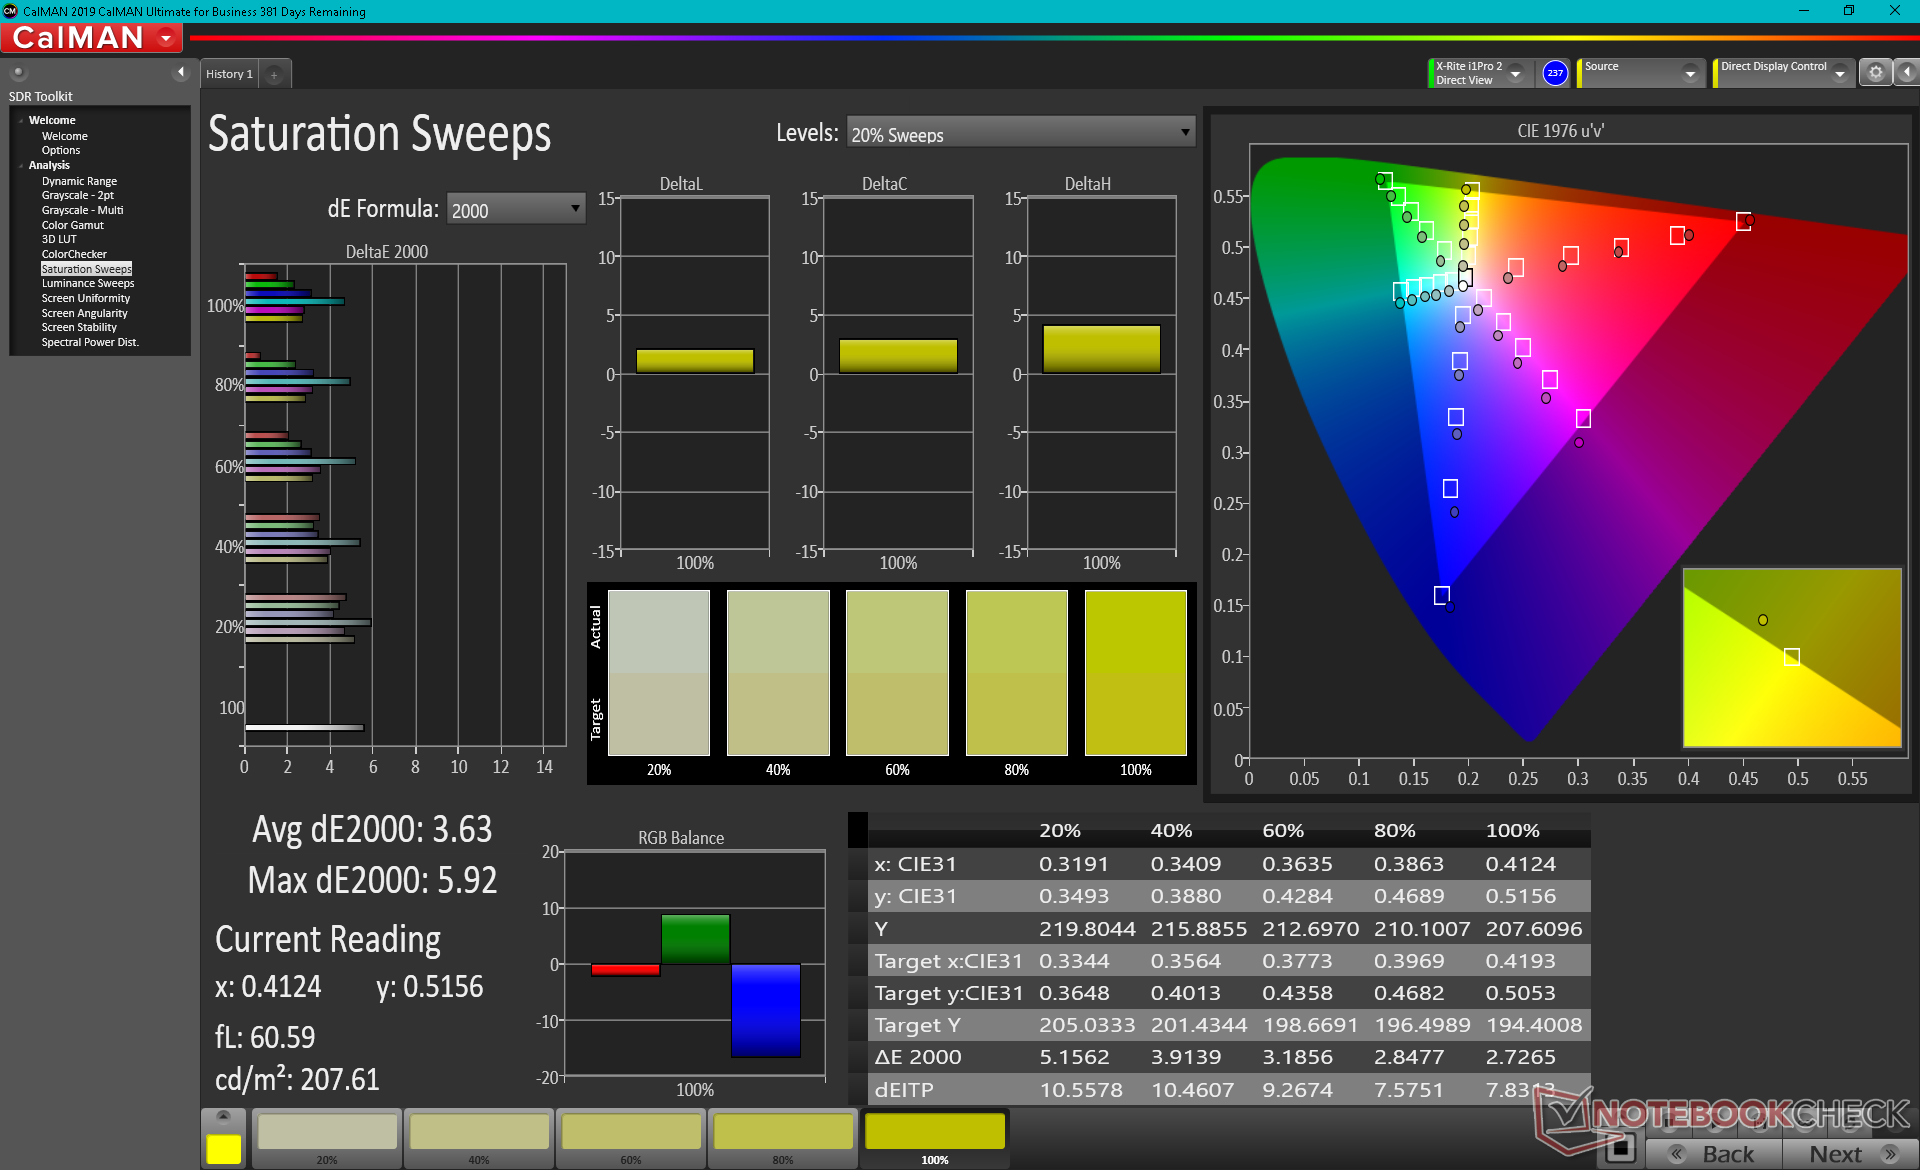
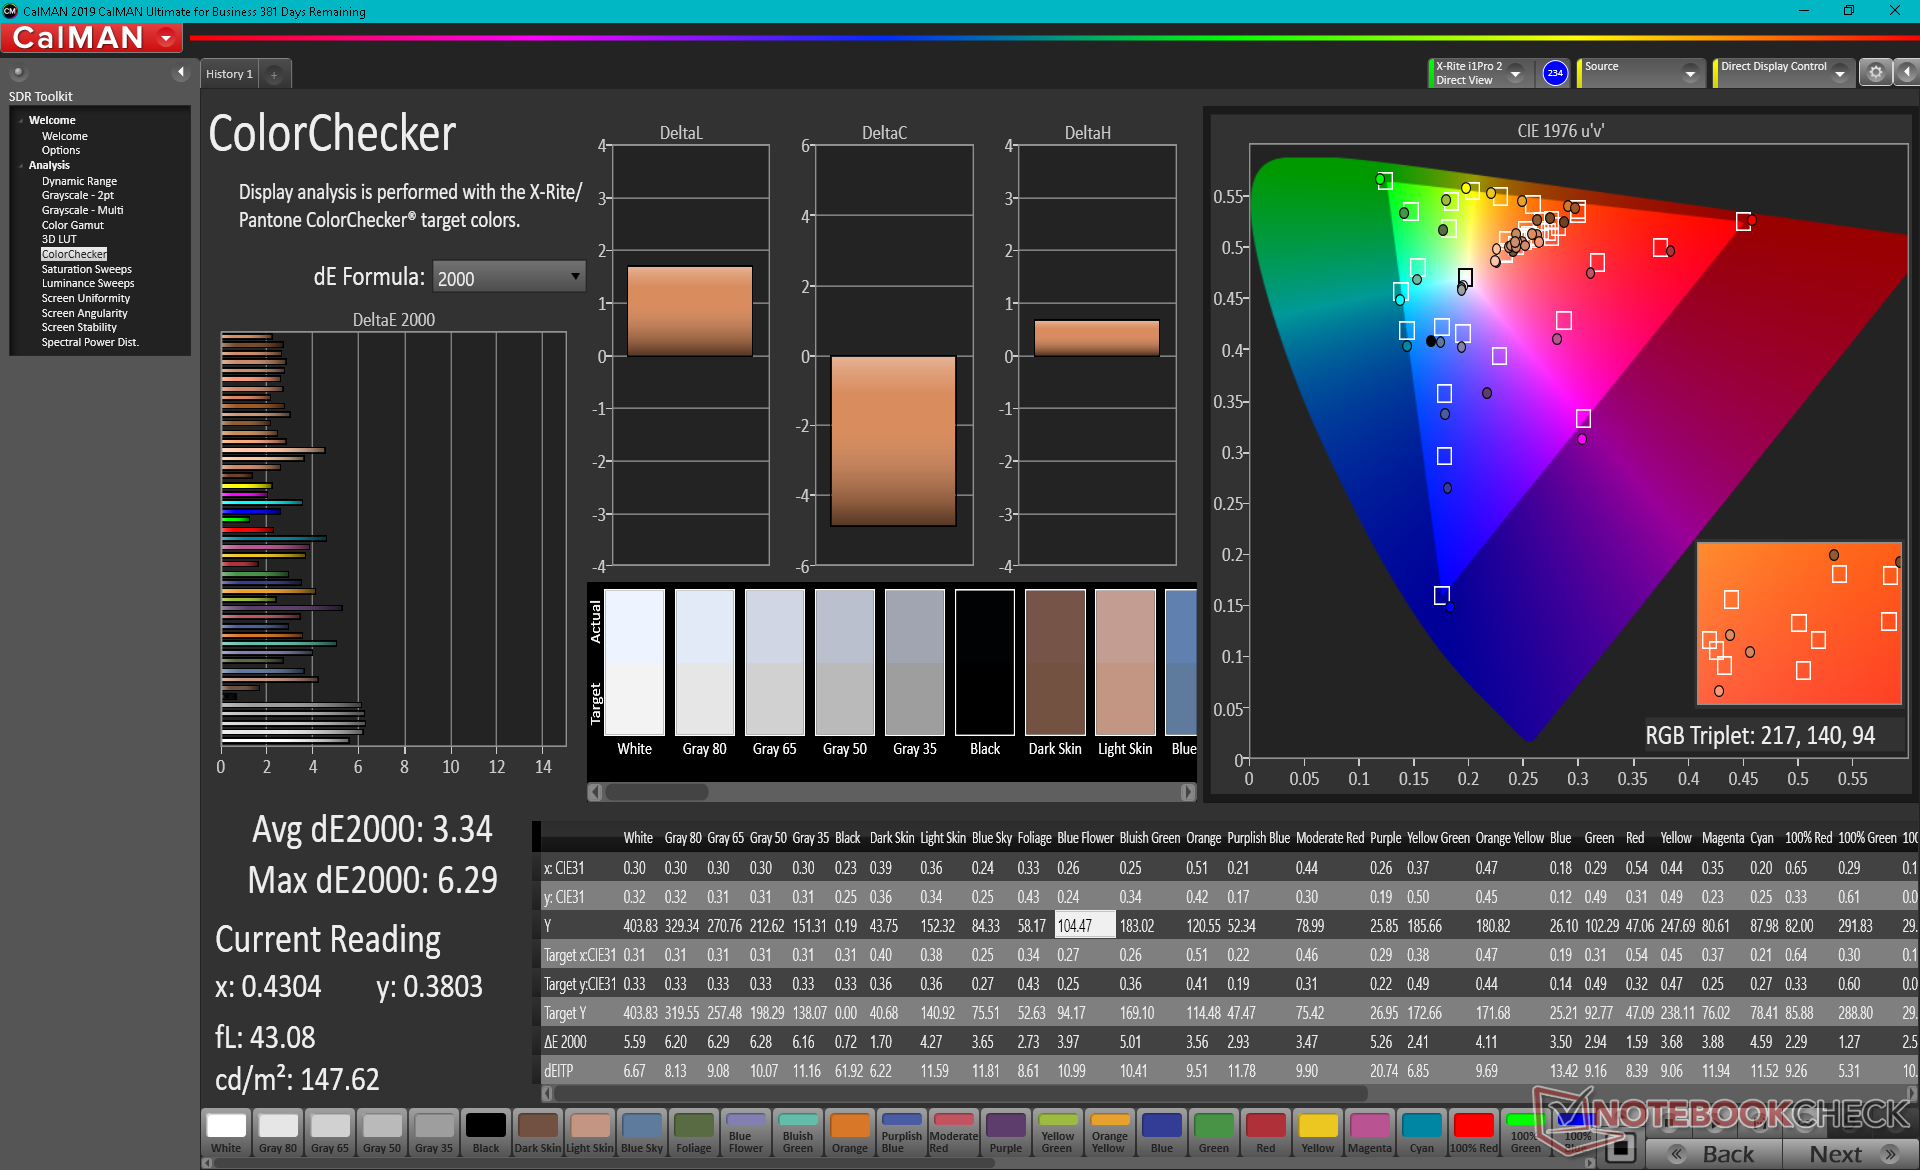
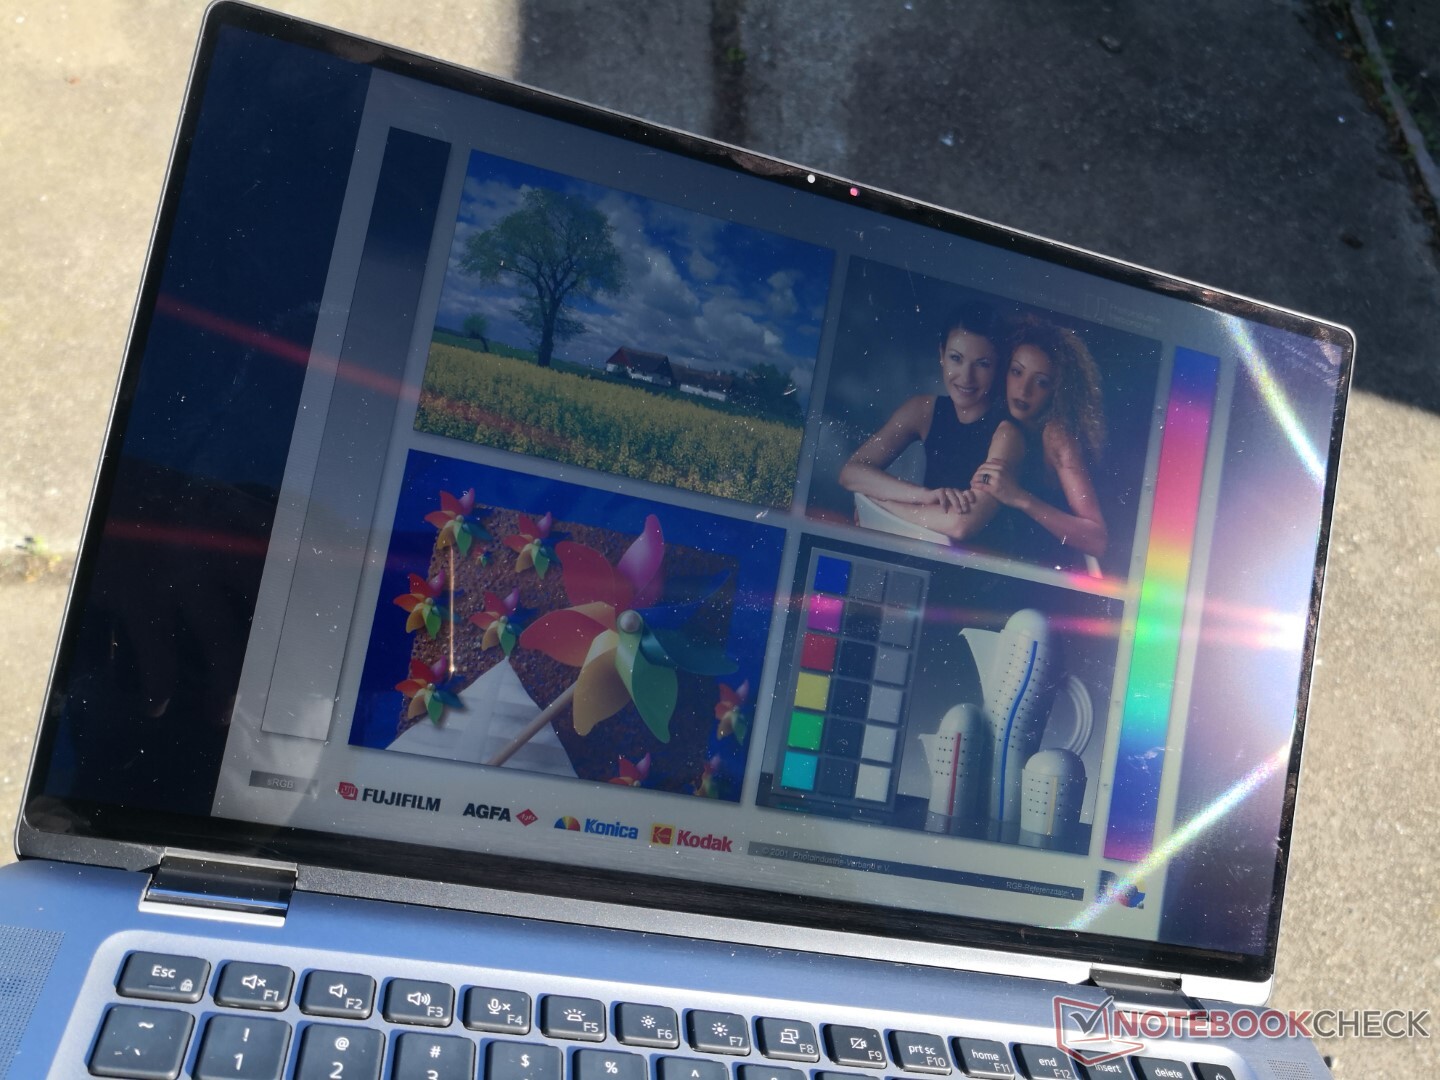
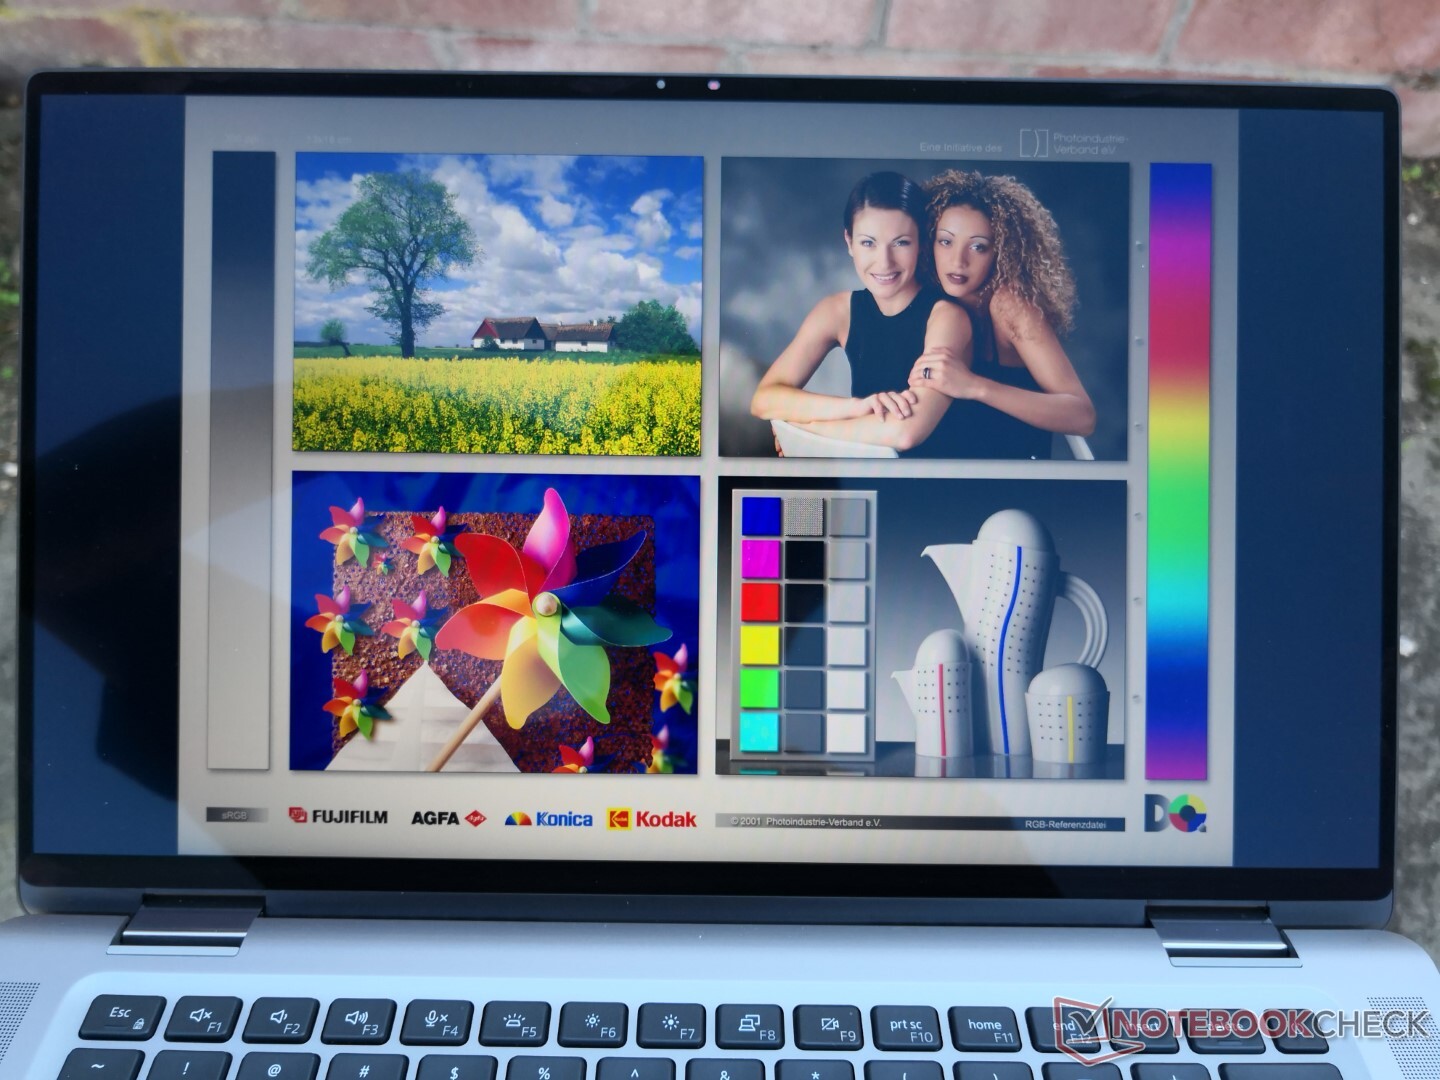
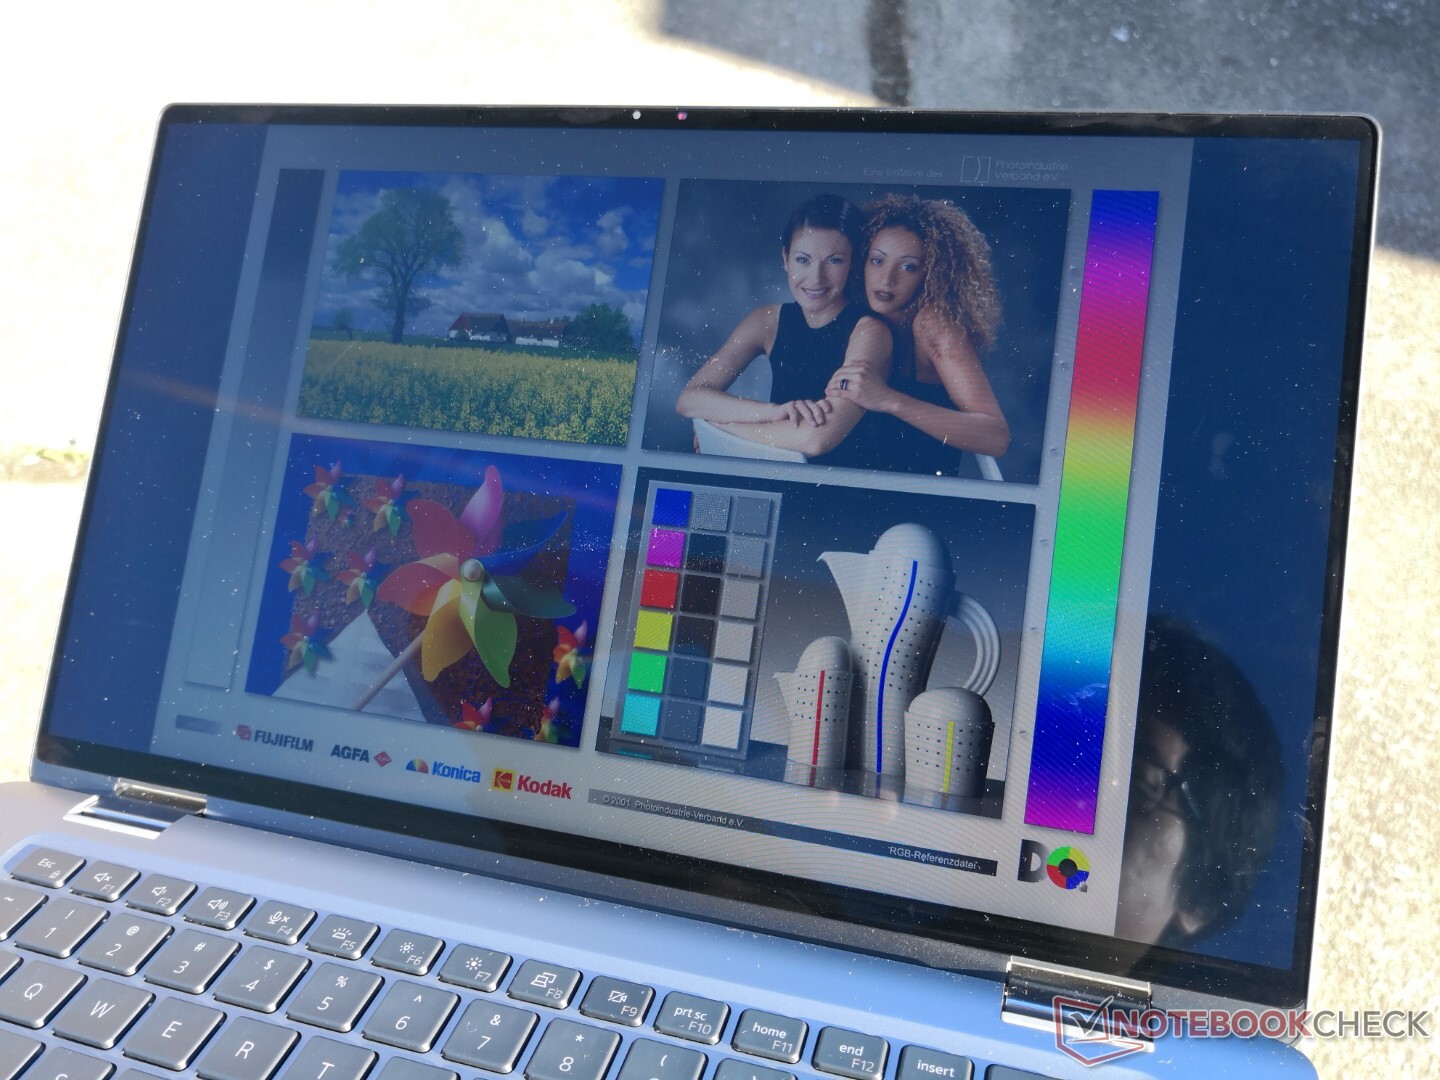
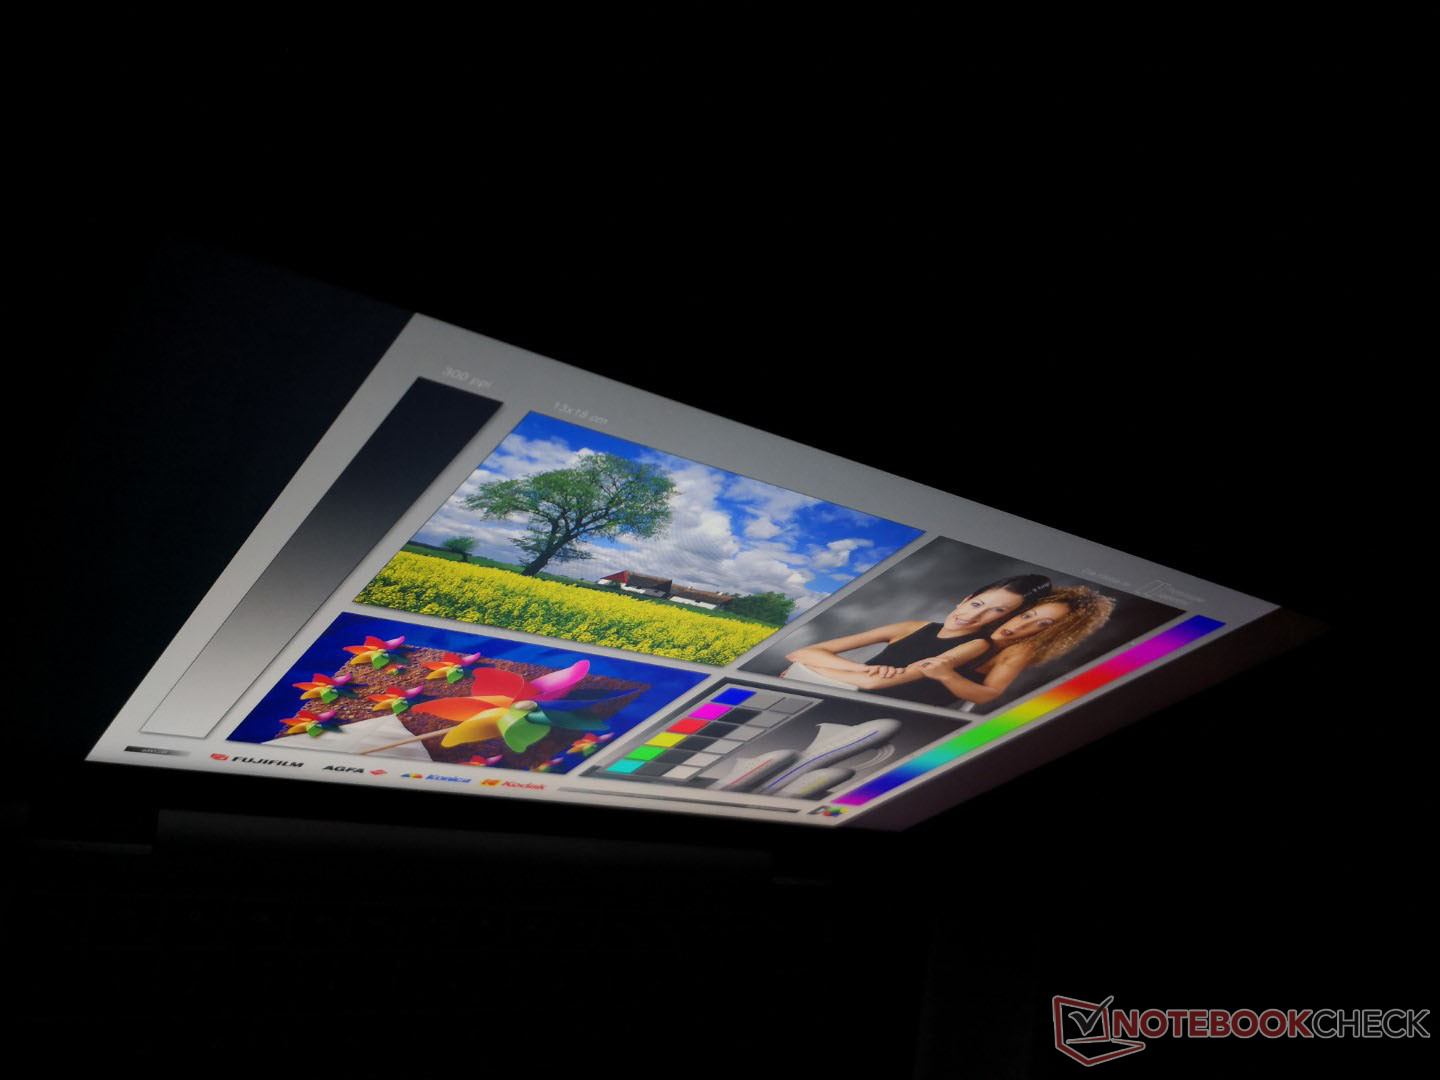
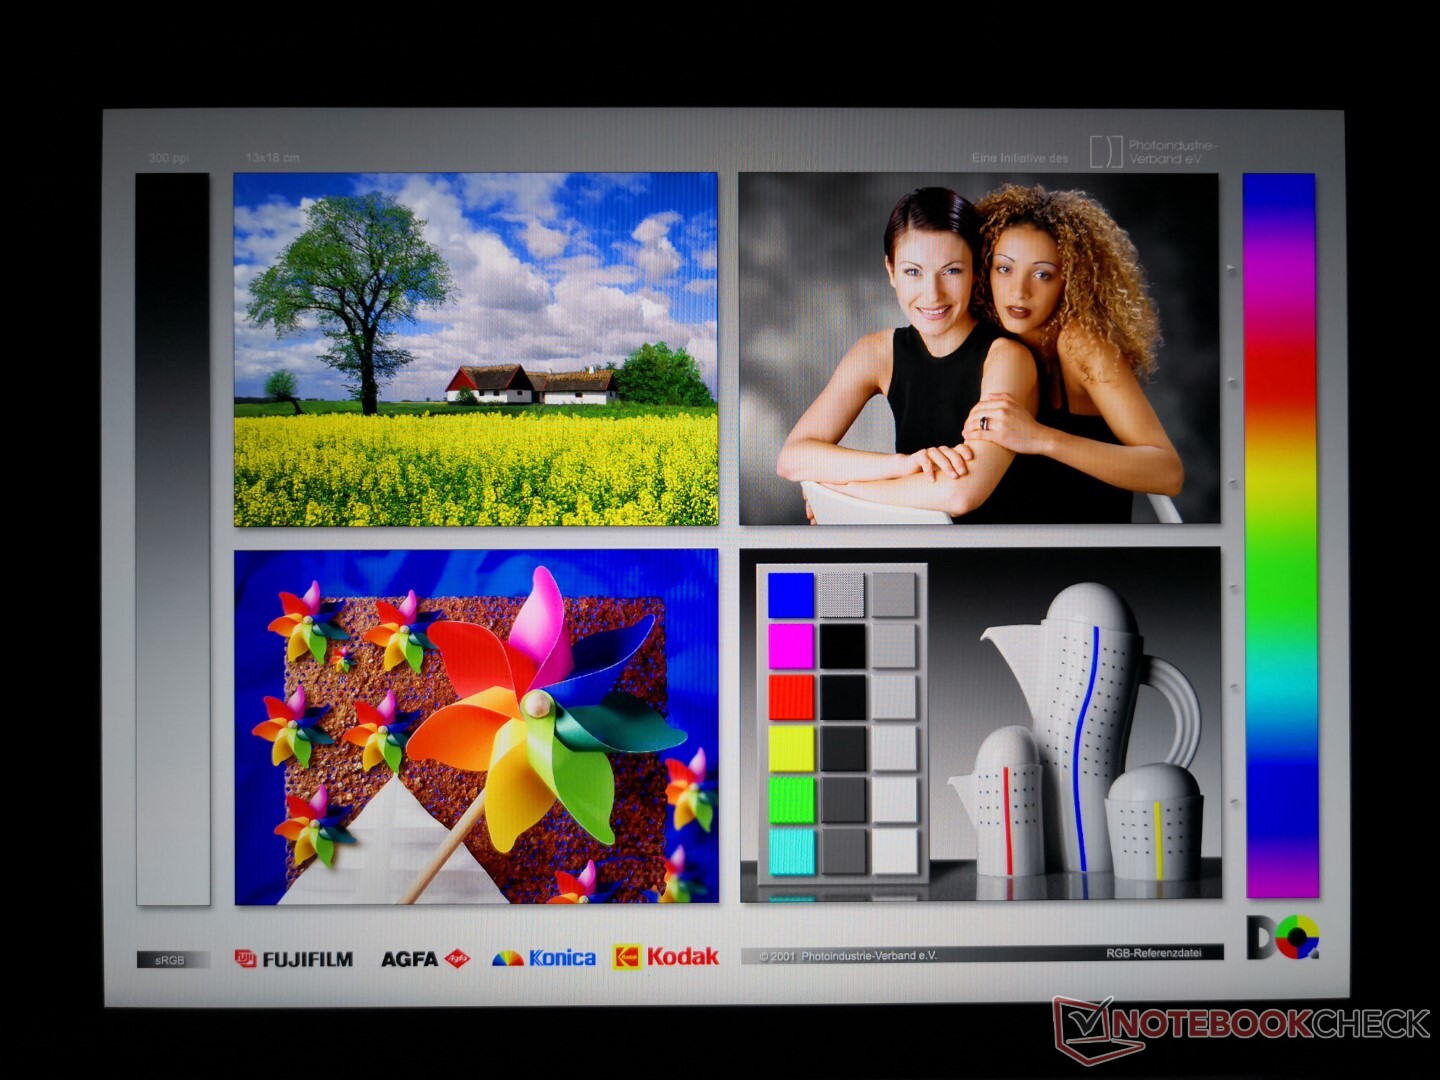
戴尔在Latitude 9510二合一和9520二合一之间使用相同的AU Optronics B150HAN IPS面板,使它们之间有类似的视觉体验。不幸的是,9520二合一产品没有新的面板选择。如果能在未来的Latitude 2合1版本上看到4K或OLED选项就更好了。
| |||||||||||||||||||||||||
Brightness Distribution: 84 %
Center on Battery: 403.6 cd/m²
Contrast: 1835:1 (Black: 0.22 cd/m²)
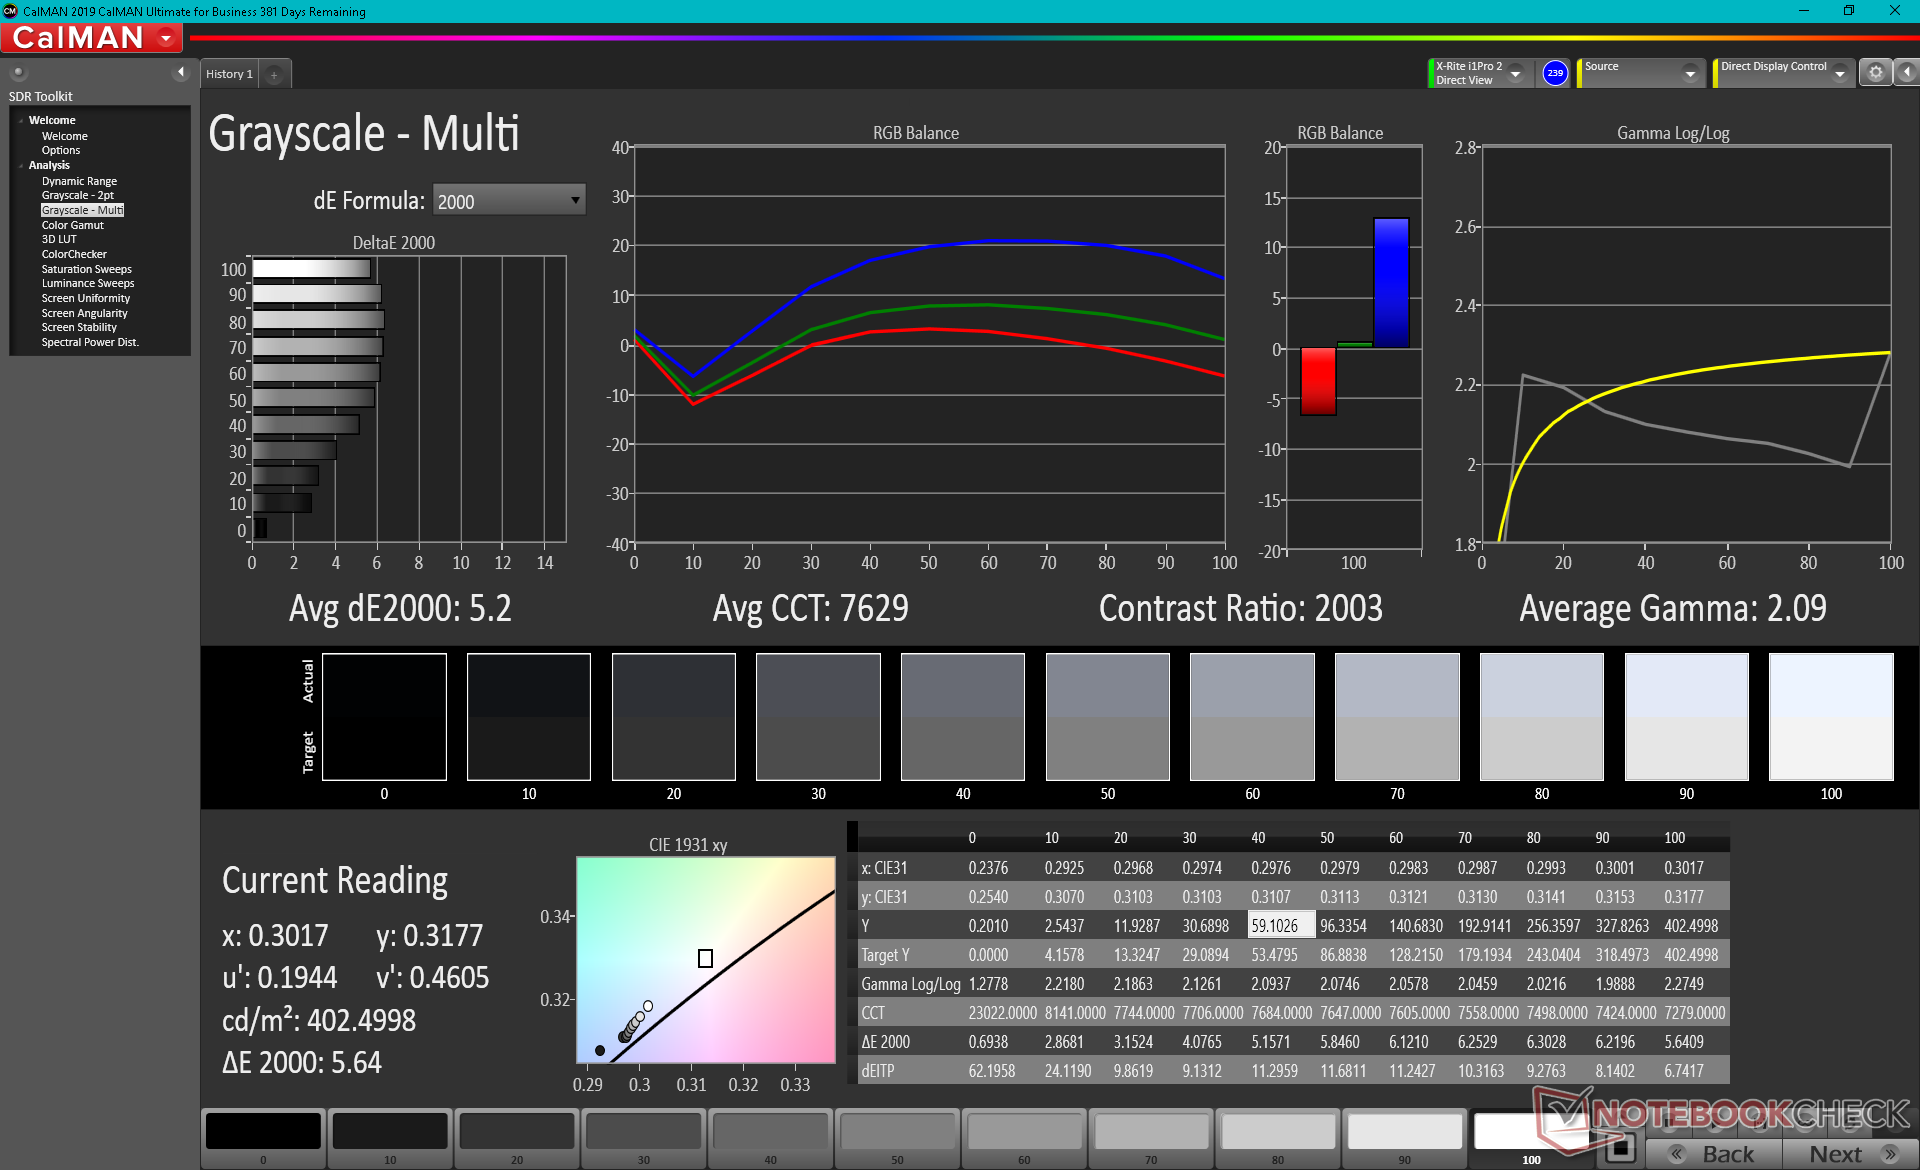
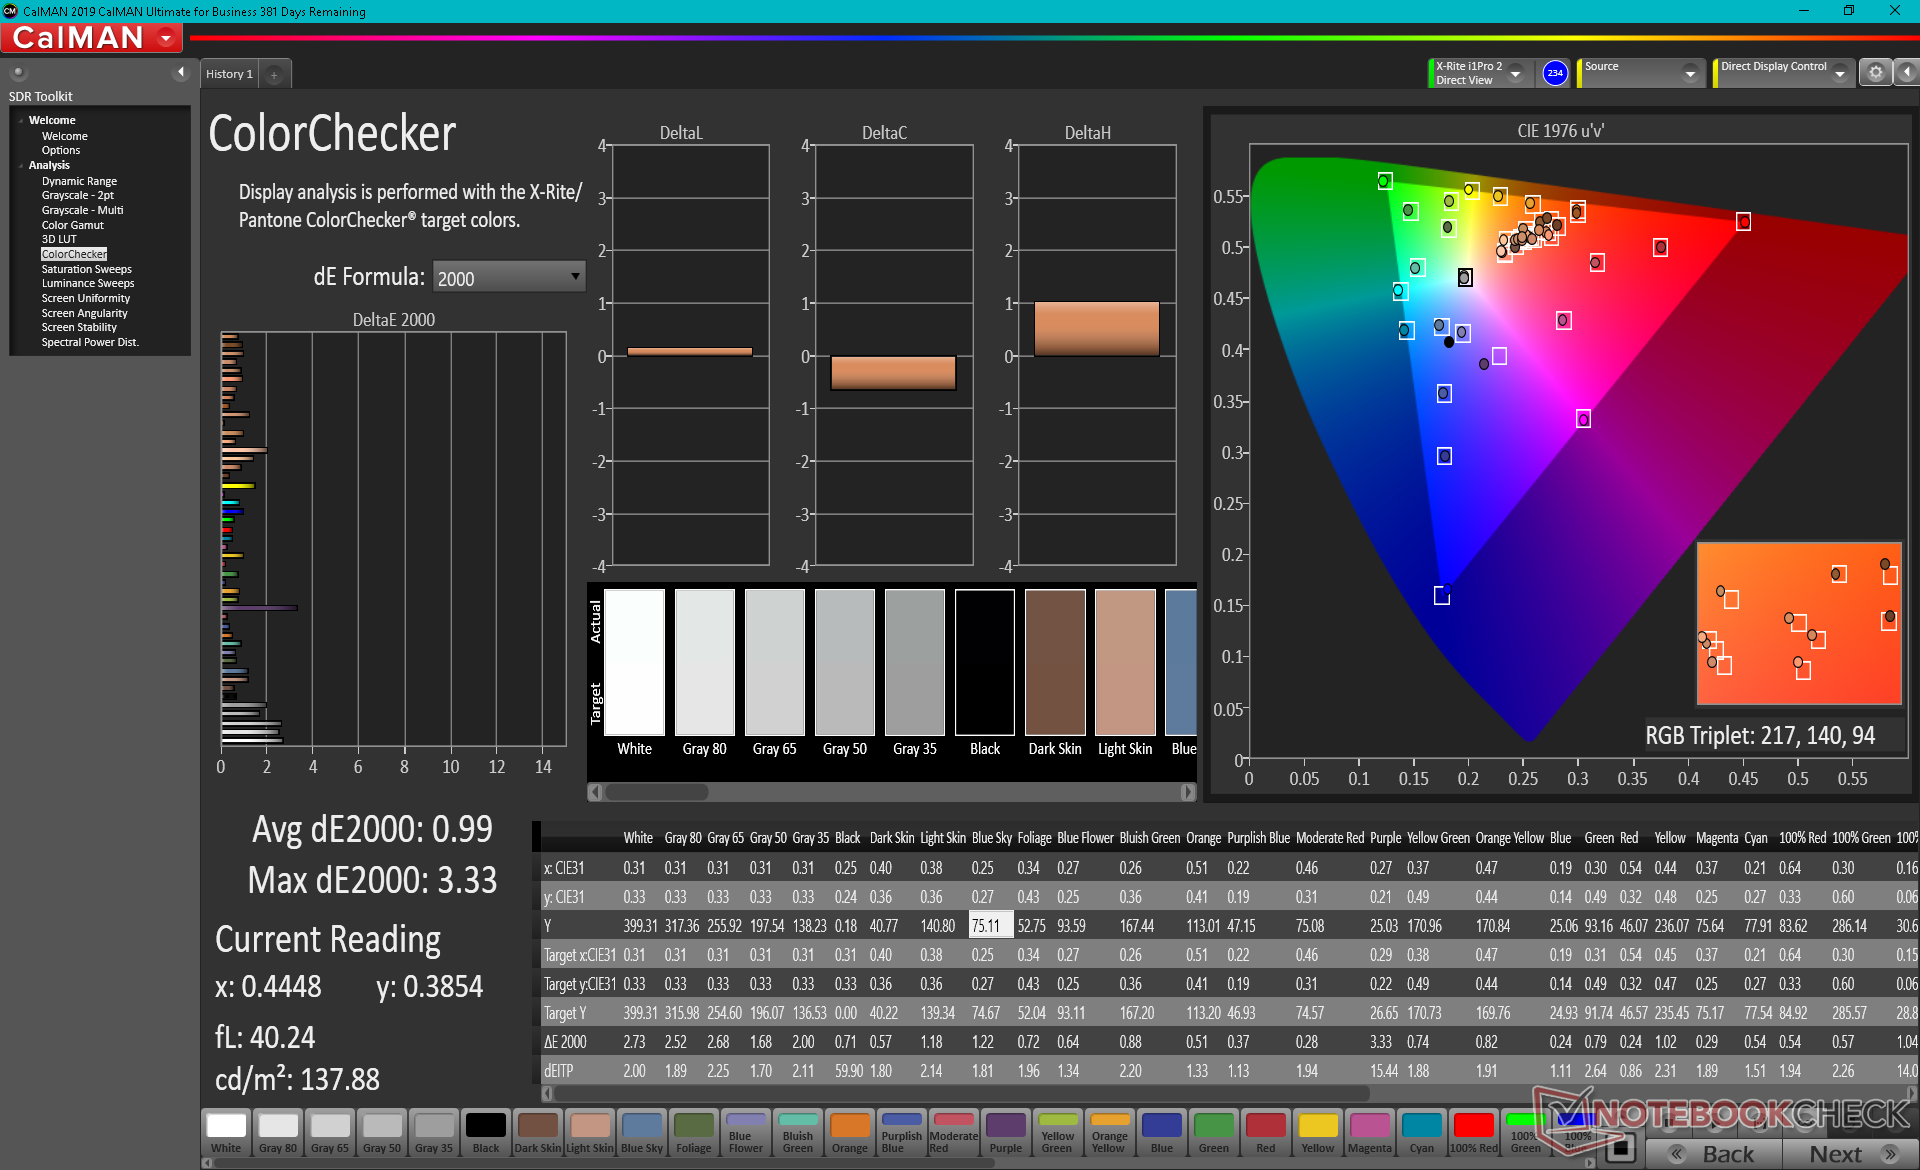
ΔE ColorChecker Calman: 3.34 | ∀{0.5-29.43 Ø4.71}
calibrated: 0.99
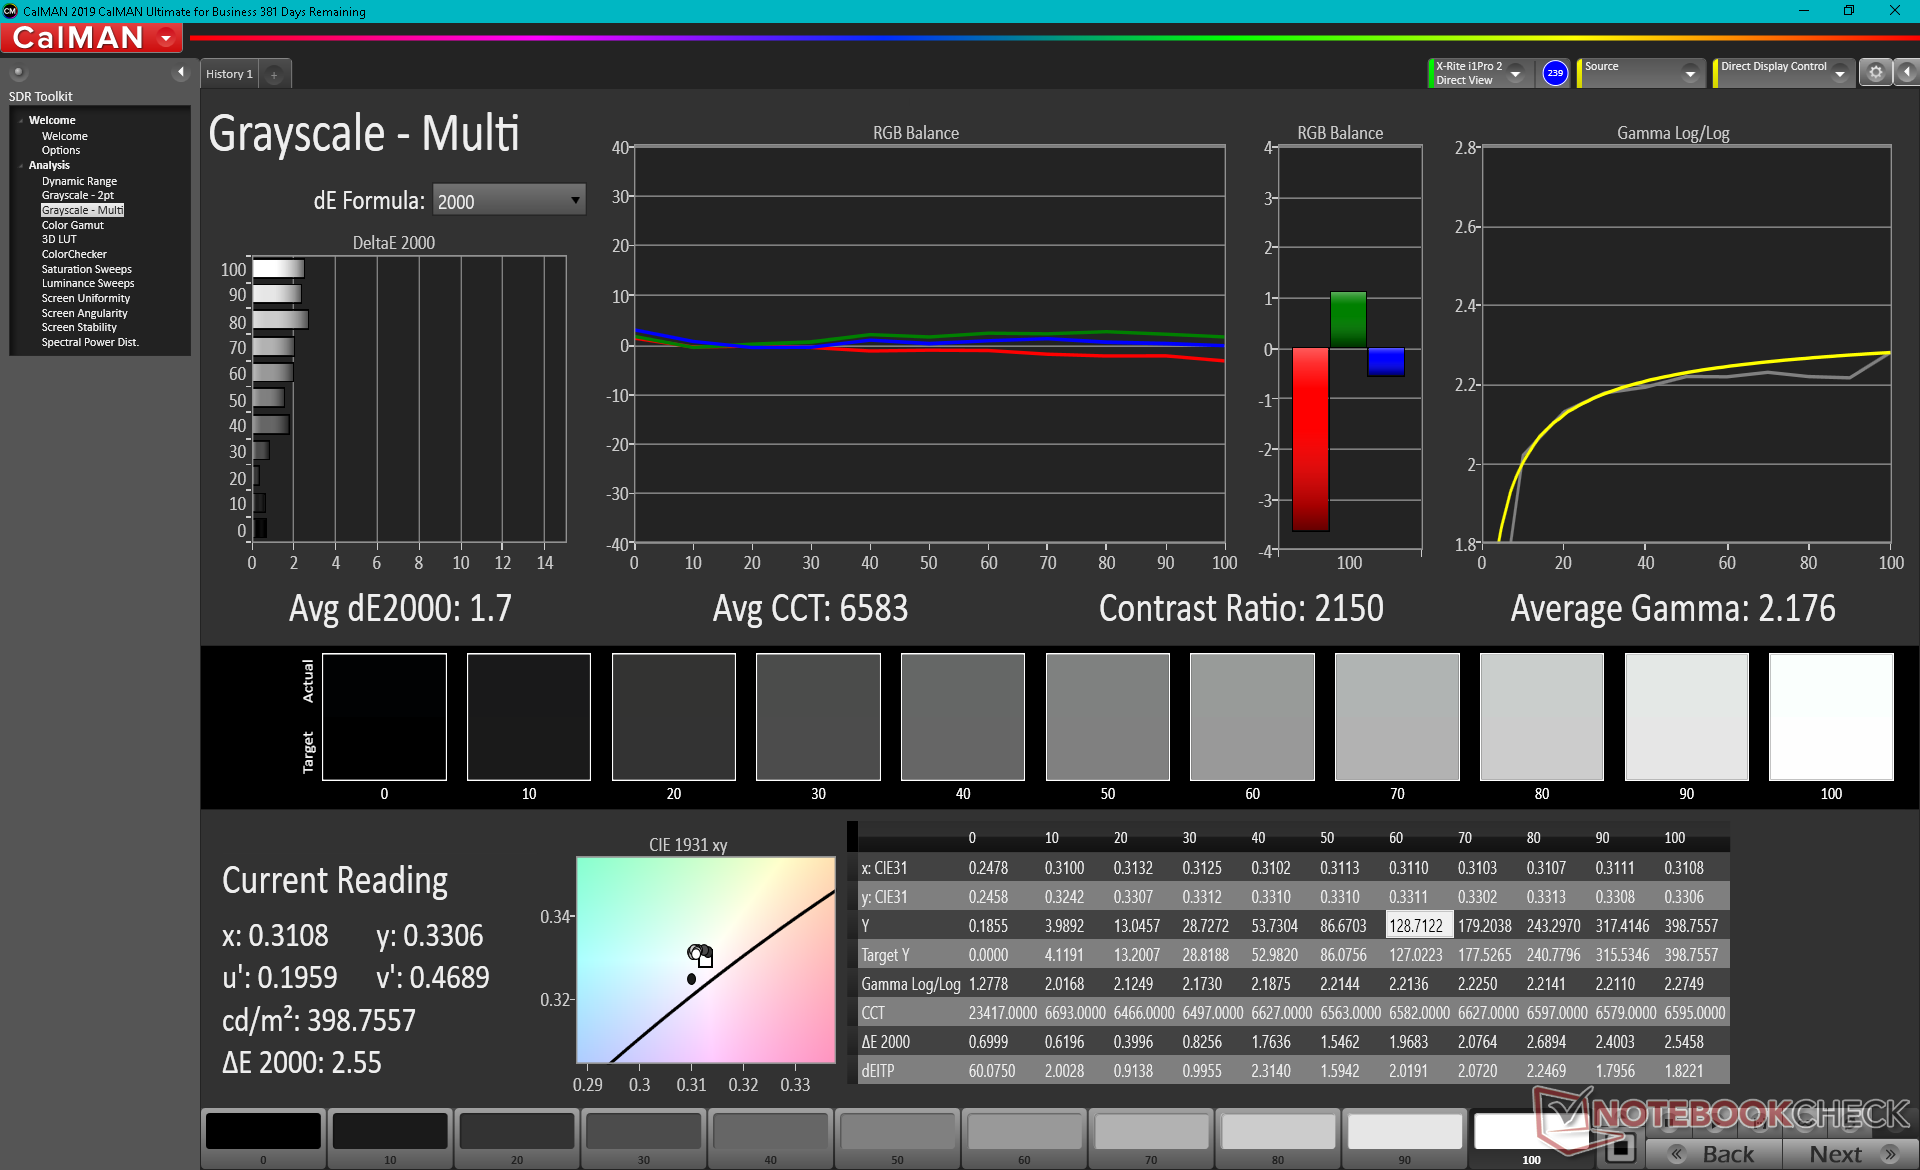
ΔE Greyscale Calman: 5.2 | ∀{0.09-98 Ø4.96}
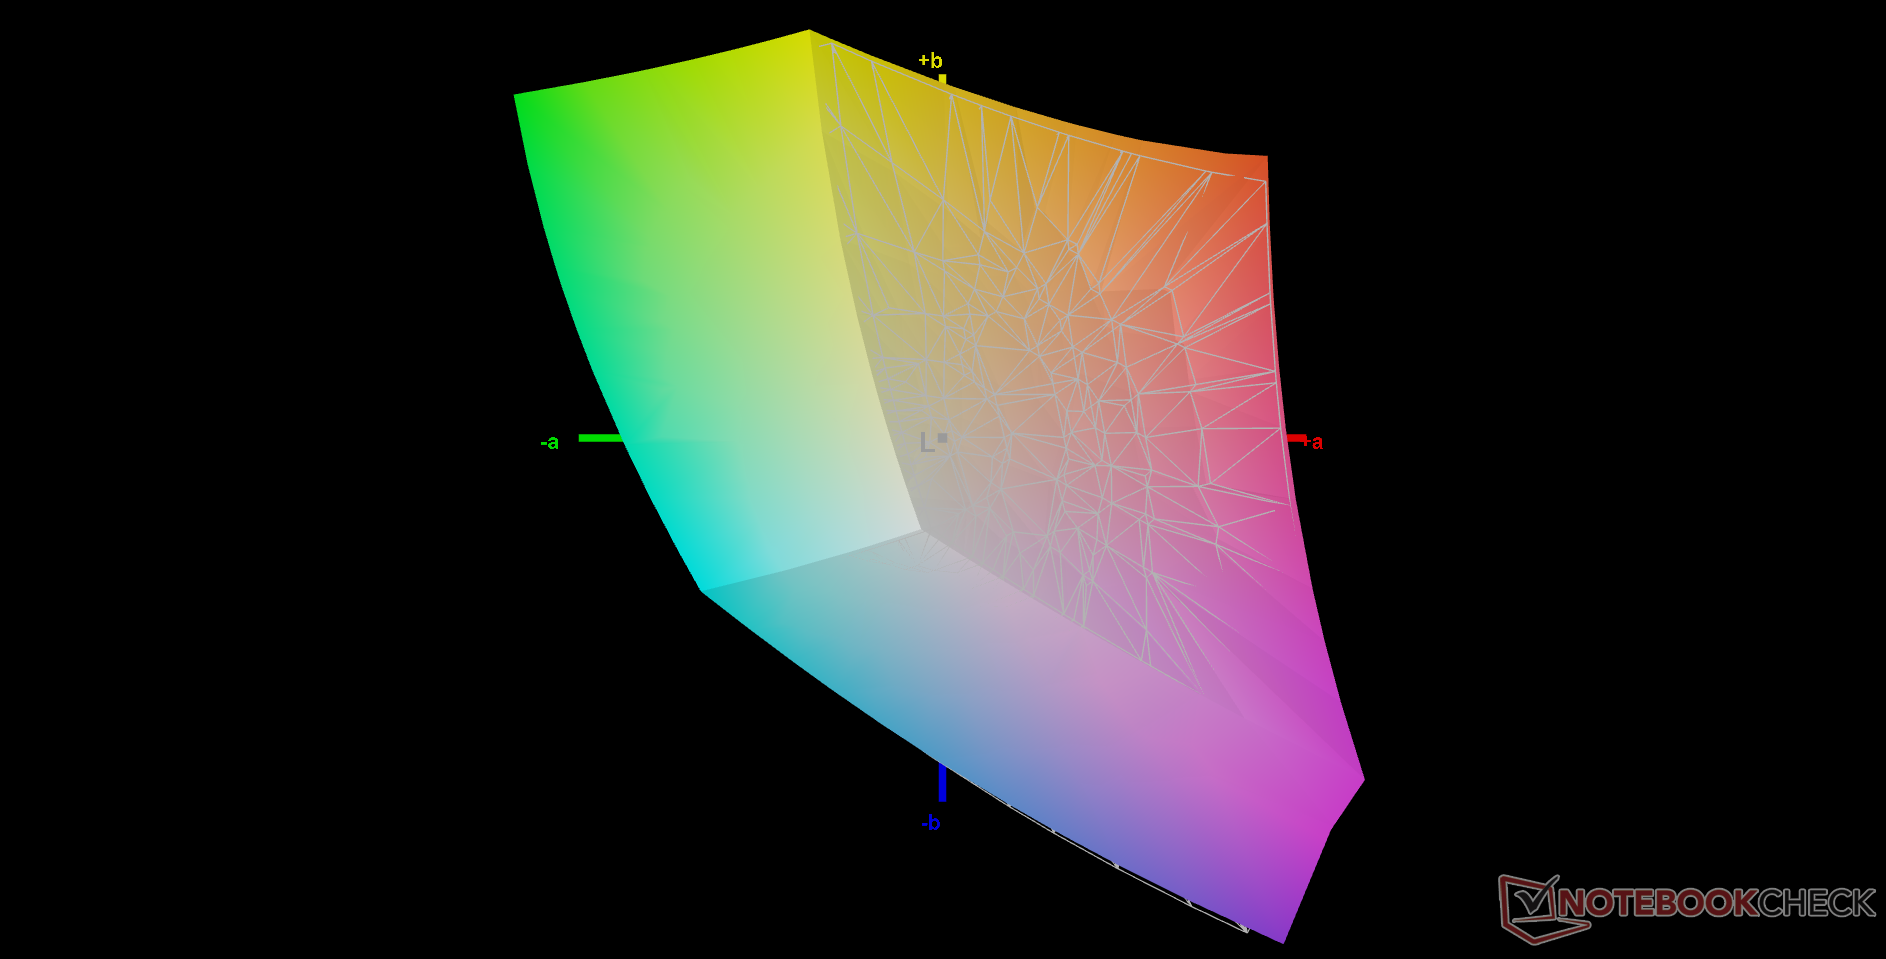
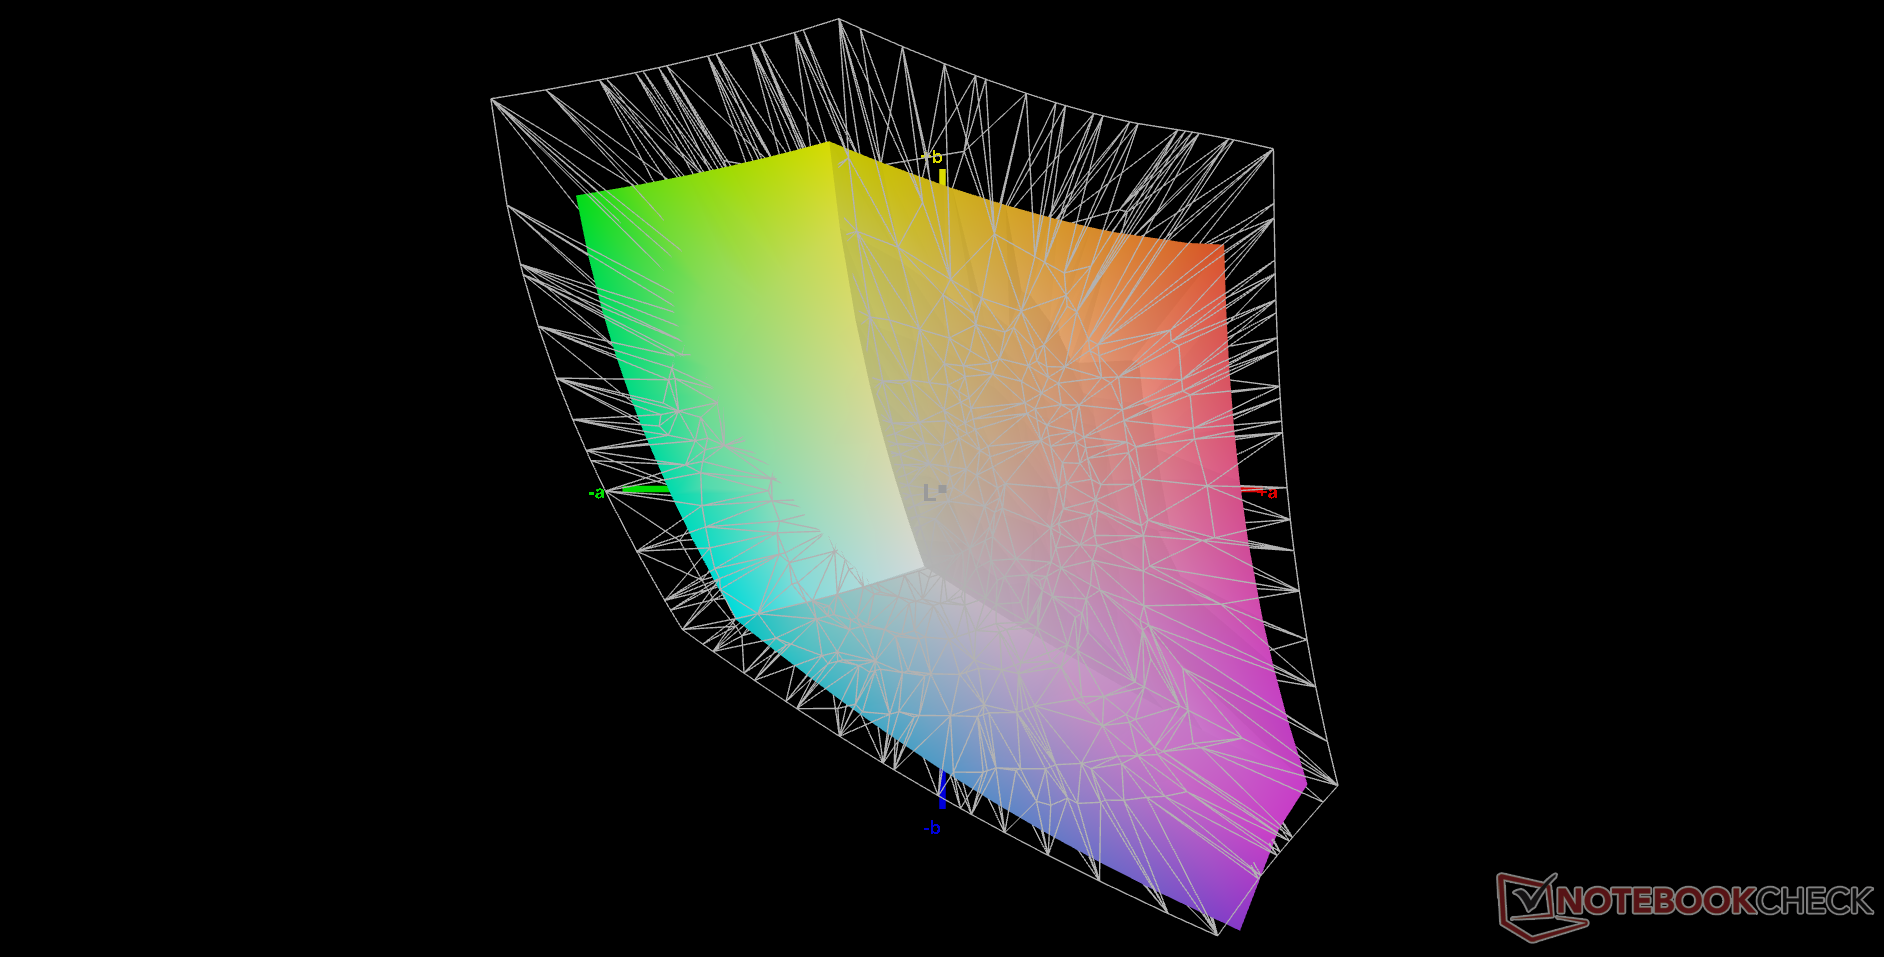
70.4% AdobeRGB 1998 (Argyll 3D)
98.7% sRGB (Argyll 3D)
69.9% Display P3 (Argyll 3D)
Gamma: 2.09
CCT: 7629 K
| Dell Latitude 15 9520 2-in-1 AU Optronics B150HAN, IPS, 1920x1080, 15" | Dell Latitude 9510 2-in-1 AU Optronics B150HAN, IPS, 1920x1080, 15" | HP EliteBook 850 G8 3C7Z8EA InfoVision X156NVF8 R1, I, 1920x1080, 15.6" | Lenovo ThinkPad L15 G2 AMD N156HCA-EAB, IPS LED, 1920x1080, 15.6" | MSI Summit B15 A11M Chi Mei N156HCE-EN1, IPS, 1920x1080, 15.6" | Microsoft Surface Laptop 4 15 AMD TFF_00028 SHP14B4, IPS, 2496x1664, 15" | |
|---|---|---|---|---|---|---|
| Display | 1% | -6% | -35% | -7% | -4% | |
| Display P3 Coverage (%) | 69.9 | 71.2 2% | 43.8 -37% | 65.7 -6% | 65.2 -7% | |
| sRGB Coverage (%) | 98.7 | 99.3 1% | 95 -4% | 65.7 -33% | 90.6 -8% | 97.7 -1% |
| AdobeRGB 1998 Coverage (%) | 70.4 | 71.3 1% | 65 -8% | 45.3 -36% | 66 -6% | 67.3 -4% |
| Response Times | -27% | -19% | -6% | -11% | -32% | |
| Response Time Grey 50% / Grey 80% * (ms) | 39.2 ? | 52.8 ? -35% | 47 ? -20% | 40 -2% | 40.4 ? -3% | 58.4 ? -49% |
| Response Time Black / White * (ms) | 27.2 ? | 32 ? -18% | 32 ? -18% | 30 -10% | 32.4 ? -19% | 31.2 ? -15% |
| PWM Frequency (Hz) | 312 ? | 25510 ? | 21550 ? | |||
| Screen | -27% | 7% | -49% | -71% | 6% | |
| Brightness middle (cd/m²) | 403.6 | 426.7 6% | 802 99% | 298 -26% | 341.3 -15% | 405 0% |
| Brightness (cd/m²) | 368 | 394 7% | 702 91% | 276 -25% | 310 -16% | 379 3% |
| Brightness Distribution (%) | 84 | 87 4% | 77 -8% | 86 2% | 81 -4% | 79 -6% |
| Black Level * (cd/m²) | 0.22 | 0.3 -36% | 0.245 -11% | 0.26 -18% | 0.45 -105% | 0.26 -18% |
| Contrast (:1) | 1835 | 1422 -23% | 3273 78% | 1146 -38% | 758 -59% | 1558 -15% |
| Colorchecker dE 2000 * | 3.34 | 4.28 -28% | 6.22 -86% | 3.7 -11% | 6.17 -85% | 2.6 22% |
| Colorchecker dE 2000 max. * | 6.29 | 10.43 -66% | 9.92 -58% | 15 -138% | 11.75 -87% | 6.6 -5% |
| Colorchecker dE 2000 calibrated * | 0.99 | 1.46 -47% | 3.5 -254% | 3.3 -233% | 0.9 9% | |
| Greyscale dE 2000 * | 5.2 | 8.1 -56% | 7.69 -48% | 1.7 67% | 7.1 -37% | 1.9 63% |
| Gamma | 2.09 105% | 2.26 97% | 2.75 80% | 2.21 100% | 2.2 100% | 2.11 104% |
| CCT | 7629 85% | 7993 81% | 6135 106% | 6588 99% | 6842 95% | 6825 95% |
| Color Space (Percent of AdobeRGB 1998) (%) | 65.2 | 65 | 58.7 | 62 | ||
| Color Space (Percent of sRGB) (%) | 99.2 | 95 | 90.1 | 97.7 | ||
| Total Average (Program / Settings) | -18% /
-21% | -6% /
1% | -30% /
-40% | -30% /
-49% | -10% /
-2% |
* ... smaller is better
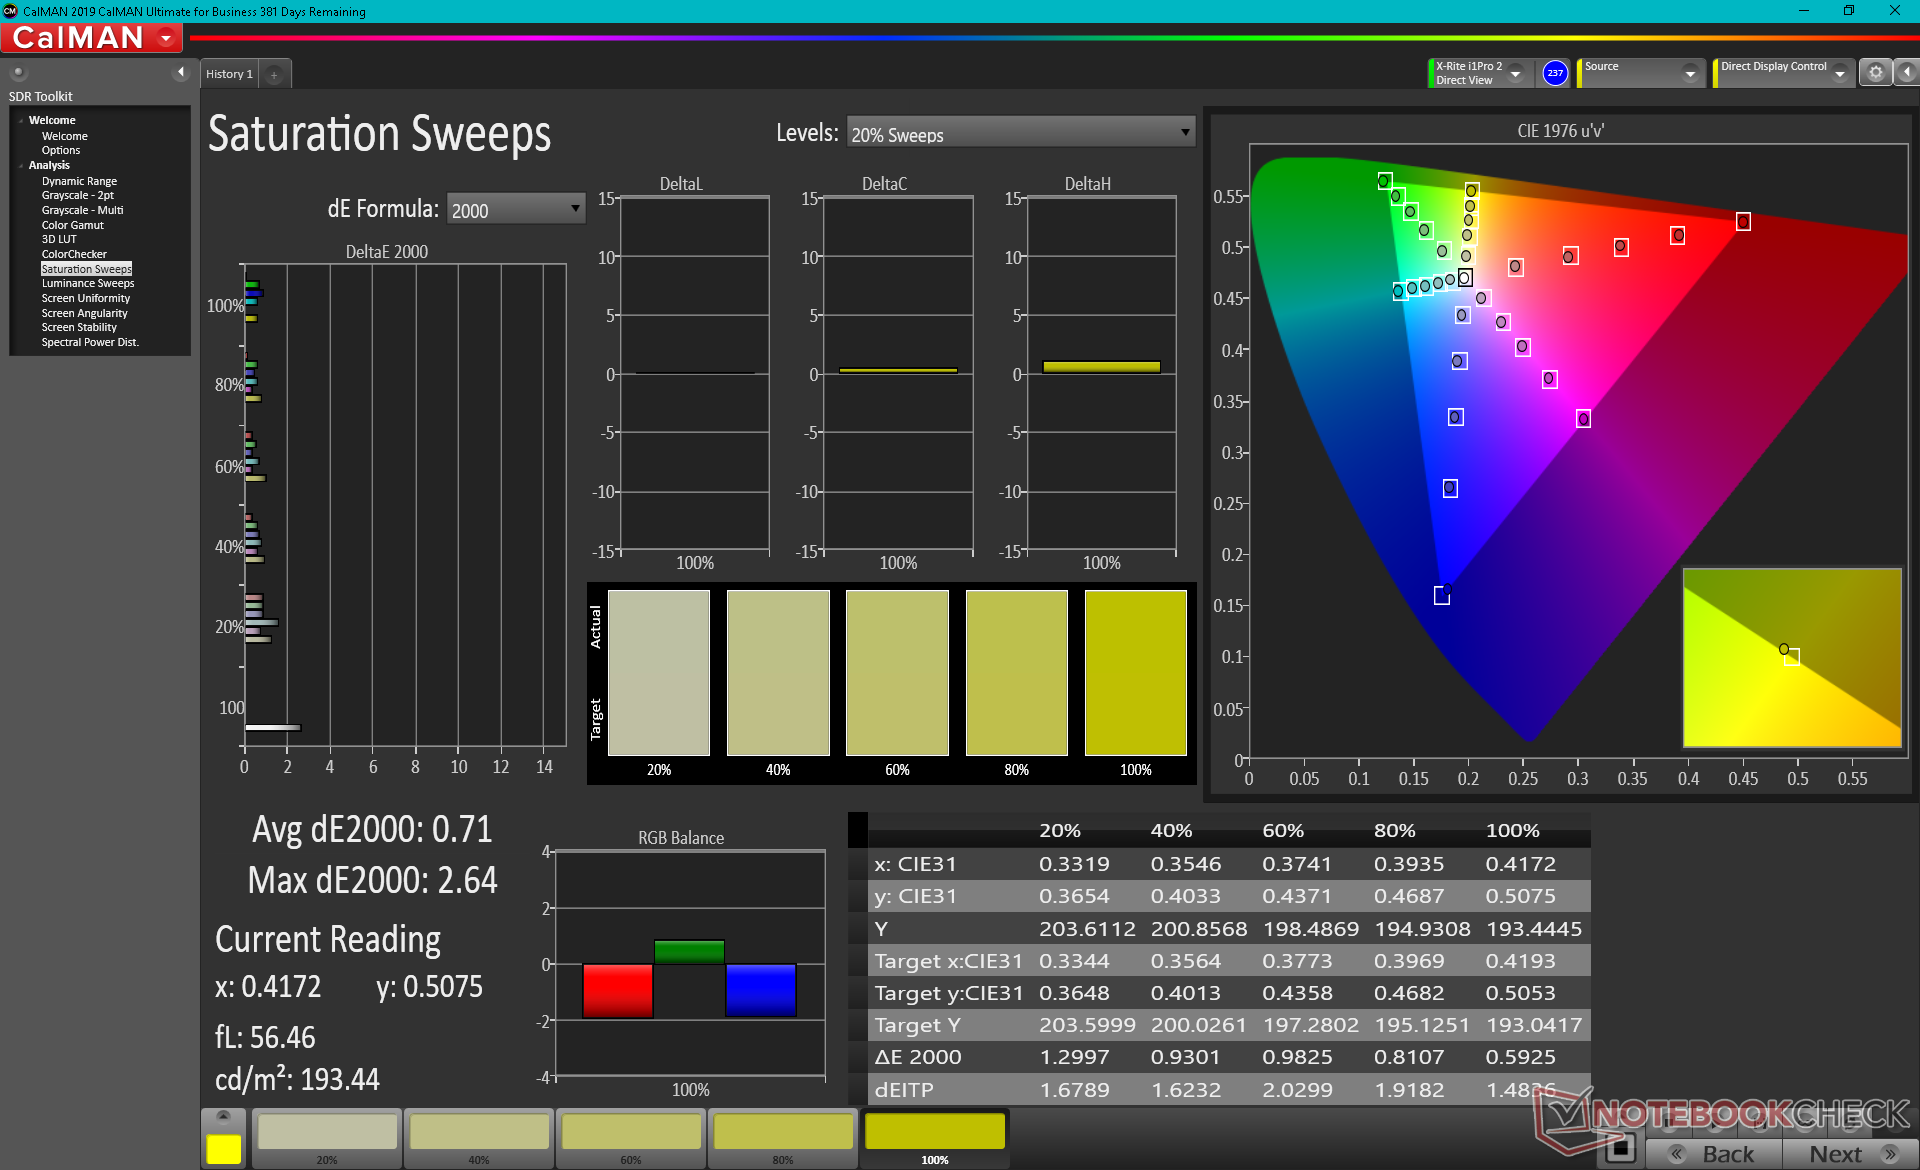
这款显示器在开箱后就得到了很好的校准,平均灰度和色彩deltaE值分别只有5.2和3.34。正如我们下面的CalMAN屏幕截图所示,适当的终端用户校准可以将这些值减少到<2以下。
Display Response Times
| ↔ Response Time Black to White | ||
|---|---|---|
| 27.2 ms ... rise ↗ and fall ↘ combined | ↗ 14 ms rise | 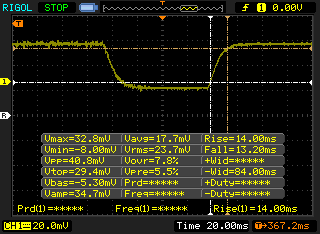 |
| ↘ 13.2 ms fall | ||
| The screen shows relatively slow response rates in our tests and may be too slow for gamers. In comparison, all tested devices range from 0.1 (minimum) to 240 (maximum) ms. » 69 % of all devices are better. This means that the measured response time is worse than the average of all tested devices (19.8 ms). | ||
| ↔ Response Time 50% Grey to 80% Grey | ||
| 39.2 ms ... rise ↗ and fall ↘ combined | ↗ 19.2 ms rise | 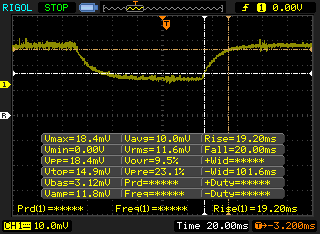 |
| ↘ 20 ms fall | ||
| The screen shows slow response rates in our tests and will be unsatisfactory for gamers. In comparison, all tested devices range from 0.165 (minimum) to 636 (maximum) ms. » 60 % of all devices are better. This means that the measured response time is worse than the average of all tested devices (31 ms). | ||
Screen Flickering / PWM (Pulse-Width Modulation)
| Screen flickering / PWM not detected | 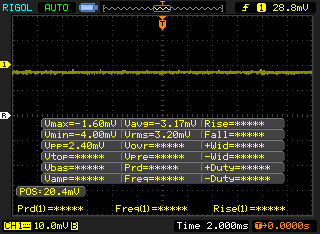 | ||
In comparison: 52 % of all tested devices do not use PWM to dim the display. If PWM was detected, an average of 7754 (minimum: 5 - maximum: 343500) Hz was measured. | |||
业绩
测试条件
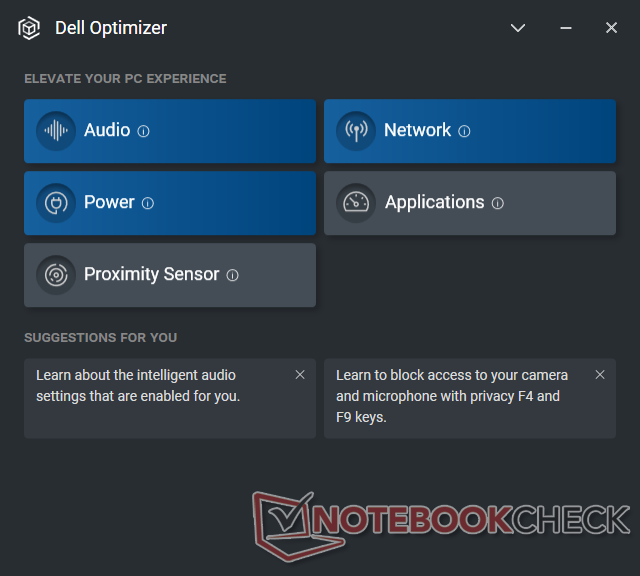
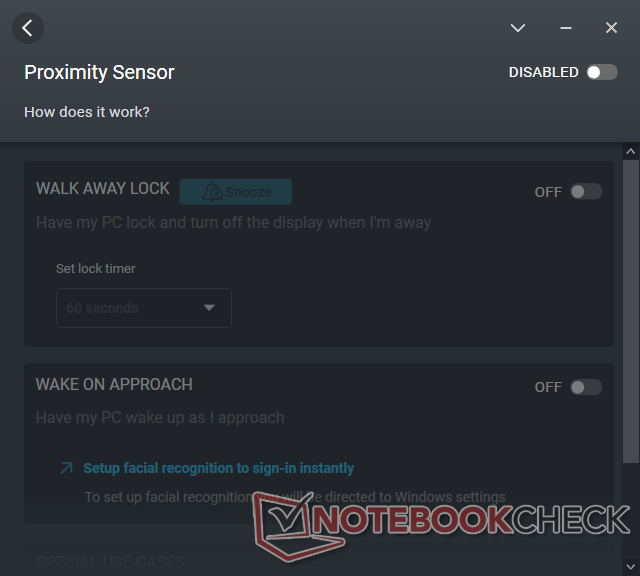
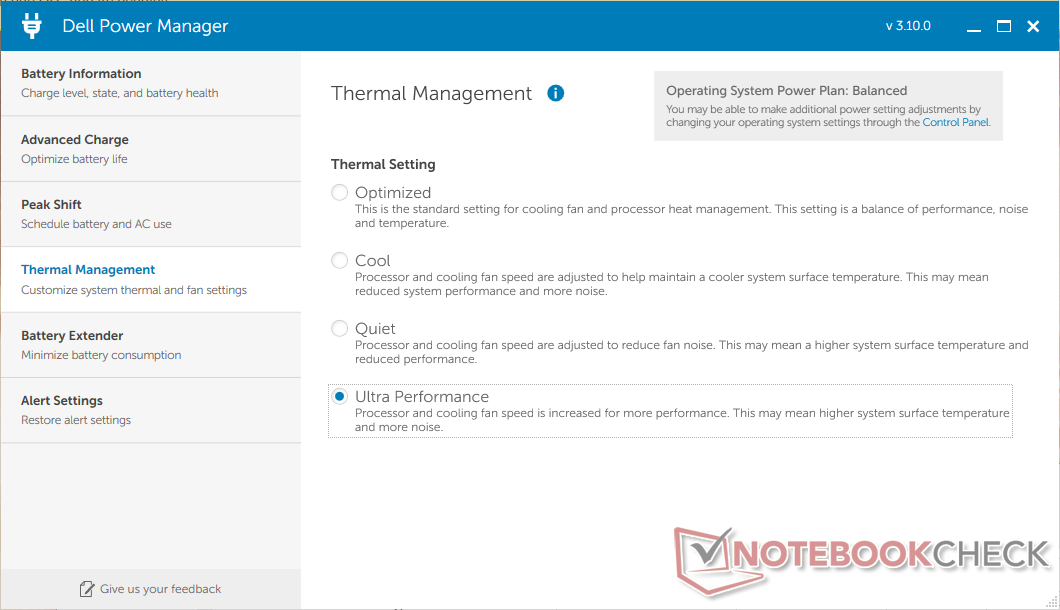
我们的系统被设置为Windows "最佳性能 "模式,并在运行以下任何基准测试之前将戴尔电源管理器设置为超性能,以获得可能的最高分数。用户还应该熟悉预装的戴尔优化软件,其中包括音频、网络和免提登录的接近传感器的额外设置。
处理器
多线程CPU的性能是一个混合包,因为 酷睿i7-1185G7比去年的酷睿i7-10810U少了两个内核。 酷睿i7-10810U缩减了大约25%到35%。由于我们的Latitude 9520二合一电脑中的i7-1185G7比使用完全相同的CPU的大多数其他笔记本电脑的性能至少要慢15%至20%,所以这个差距比预期的要大。微星隐身15M中的酷睿i7-1185G7处理器 MSI Stealth 15M例如,它的多线程性能比我们的戴尔快50%。
值得庆幸的是,相对于普通的酷睿i7-1185G7来说,单线程性能应该是在那里。在这方面,用户可以期待比酷睿i7-10810U快30%左右的性能。
Cinebench R15 Multi Loop
Cinebench R23: Multi Core | Single Core
Cinebench R20: CPU (Multi Core) | CPU (Single Core)
Cinebench R15: CPU Multi 64Bit | CPU Single 64Bit
Blender: v2.79 BMW27 CPU
7-Zip 18.03: 7z b 4 | 7z b 4 -mmt1
Geekbench 5.5: Multi-Core | Single-Core
HWBOT x265 Benchmark v2.2: 4k Preset
LibreOffice : 20 Documents To PDF
R Benchmark 2.5: Overall mean
| CPU Performance rating | |
| HP Pavilion Aero 13 be0097nr -2! | |
| Lenovo ThinkPad E15 G3-20YG003UGE | |
| Microsoft Surface Laptop 4 15 AMD TFF_00028 | |
| Lenovo ThinkPad L15 G2 AMD | |
| MSI Prestige 15 A10SC -10! | |
| Average Intel Core i7-1185G7 | |
| HP EliteBook 850 G8 3C7Z8EA | |
| Asus ZenBook 15 UX534FT-DB77 -10! | |
| Dell Latitude 15 9520 2-in-1 -2! | |
| Asus ExpertBook B1 B1500CEAE, i5-1135G7 | |
| Samsung Galaxy Book Flex 15-NP950 -2! | |
| Dell Latitude 9510 2-in-1 -2! | |
| LG Gram 15Z90N -3! | |
| Cinebench R20 / CPU (Multi Core) | |
| Lenovo ThinkPad E15 G3-20YG003UGE | |
| Microsoft Surface Laptop 4 15 AMD TFF_00028 | |
| HP Pavilion Aero 13 be0097nr | |
| Lenovo ThinkPad L15 G2 AMD | |
| MSI Prestige 15 A10SC | |
| Dell Latitude 9510 2-in-1 | |
| Average Intel Core i7-1185G7 (1425 - 2493, n=28) | |
| Samsung Galaxy Book Flex 15-NP950 | |
| HP EliteBook 850 G8 3C7Z8EA | |
| Dell Latitude 15 9520 2-in-1 | |
| Asus ExpertBook B1 B1500CEAE, i5-1135G7 | |
| Asus ZenBook 15 UX534FT-DB77 | |
| LG Gram 15Z90N | |
| Cinebench R20 / CPU (Single Core) | |
| HP EliteBook 850 G8 3C7Z8EA | |
| Average Intel Core i7-1185G7 (489 - 593, n=28) | |
| HP Pavilion Aero 13 be0097nr | |
| Dell Latitude 15 9520 2-in-1 | |
| Lenovo ThinkPad L15 G2 AMD | |
| Microsoft Surface Laptop 4 15 AMD TFF_00028 | |
| Lenovo ThinkPad E15 G3-20YG003UGE | |
| Asus ExpertBook B1 B1500CEAE, i5-1135G7 | |
| Samsung Galaxy Book Flex 15-NP950 | |
| MSI Prestige 15 A10SC | |
| Asus ZenBook 15 UX534FT-DB77 | |
| Dell Latitude 9510 2-in-1 | |
| LG Gram 15Z90N | |
| Cinebench R15 / CPU Multi 64Bit | |
| Microsoft Surface Laptop 4 15 AMD TFF_00028 | |
| Lenovo ThinkPad E15 G3-20YG003UGE | |
| HP Pavilion Aero 13 be0097nr | |
| Lenovo ThinkPad L15 G2 AMD | |
| MSI Prestige 15 A10SC | |
| Dell Latitude 9510 2-in-1 | |
| Average Intel Core i7-1185G7 (617 - 1066, n=32) | |
| Asus ExpertBook B1 B1500CEAE, i5-1135G7 | |
| Samsung Galaxy Book Flex 15-NP950 | |
| HP EliteBook 850 G8 3C7Z8EA | |
| Dell Latitude 15 9520 2-in-1 | |
| Asus ZenBook 15 UX534FT-DB77 | |
| LG Gram 15Z90N | |
| Cinebench R15 / CPU Single 64Bit | |
| HP Pavilion Aero 13 be0097nr | |
| Lenovo ThinkPad L15 G2 AMD | |
| HP EliteBook 850 G8 3C7Z8EA | |
| Average Intel Core i7-1185G7 (168 - 230, n=27) | |
| Dell Latitude 15 9520 2-in-1 | |
| Asus ExpertBook B1 B1500CEAE, i5-1135G7 | |
| MSI Prestige 15 A10SC | |
| Lenovo ThinkPad E15 G3-20YG003UGE | |
| Microsoft Surface Laptop 4 15 AMD TFF_00028 | |
| Asus ZenBook 15 UX534FT-DB77 | |
| Samsung Galaxy Book Flex 15-NP950 | |
| Dell Latitude 9510 2-in-1 | |
| LG Gram 15Z90N | |
| Blender / v2.79 BMW27 CPU | |
| LG Gram 15Z90N | |
| Dell Latitude 9510 2-in-1 | |
| Samsung Galaxy Book Flex 15-NP950 | |
| Asus ExpertBook B1 B1500CEAE, i5-1135G7 | |
| HP EliteBook 850 G8 3C7Z8EA | |
| Dell Latitude 15 9520 2-in-1 | |
| Average Intel Core i7-1185G7 (478 - 745, n=28) | |
| Lenovo ThinkPad L15 G2 AMD | |
| Microsoft Surface Laptop 4 15 AMD TFF_00028 | |
| HP Pavilion Aero 13 be0097nr | |
| Lenovo ThinkPad E15 G3-20YG003UGE | |
| 7-Zip 18.03 / 7z b 4 | |
| HP Pavilion Aero 13 be0097nr | |
| Microsoft Surface Laptop 4 15 AMD TFF_00028 | |
| Lenovo ThinkPad E15 G3-20YG003UGE | |
| Lenovo ThinkPad L15 G2 AMD | |
| Average Intel Core i7-1185G7 (18812 - 27693, n=27) | |
| Samsung Galaxy Book Flex 15-NP950 | |
| Dell Latitude 15 9520 2-in-1 | |
| HP EliteBook 850 G8 3C7Z8EA | |
| Asus ExpertBook B1 B1500CEAE, i5-1135G7 | |
| Dell Latitude 9510 2-in-1 | |
| LG Gram 15Z90N | |
| 7-Zip 18.03 / 7z b 4 -mmt1 | |
| HP Pavilion Aero 13 be0097nr | |
| HP EliteBook 850 G8 3C7Z8EA | |
| Lenovo ThinkPad L15 G2 AMD | |
| Average Intel Core i7-1185G7 (3678 - 5507, n=27) | |
| Dell Latitude 15 9520 2-in-1 | |
| Asus ExpertBook B1 B1500CEAE, i5-1135G7 | |
| Samsung Galaxy Book Flex 15-NP950 | |
| Lenovo ThinkPad E15 G3-20YG003UGE | |
| Dell Latitude 9510 2-in-1 | |
| Microsoft Surface Laptop 4 15 AMD TFF_00028 | |
| LG Gram 15Z90N | |
| Geekbench 5.5 / Multi-Core | |
| Microsoft Surface Laptop 4 15 AMD TFF_00028 | |
| Lenovo ThinkPad E15 G3-20YG003UGE | |
| HP EliteBook 850 G8 3C7Z8EA | |
| Average Intel Core i7-1185G7 (4620 - 5944, n=21) | |
| Lenovo ThinkPad L15 G2 AMD | |
| Samsung Galaxy Book Flex 15-NP950 | |
| Asus ExpertBook B1 B1500CEAE, i5-1135G7 | |
| Dell Latitude 9510 2-in-1 | |
| LG Gram 15Z90N | |
| Geekbench 5.5 / Single-Core | |
| HP EliteBook 850 G8 3C7Z8EA | |
| Average Intel Core i7-1185G7 (1398 - 1626, n=21) | |
| Lenovo ThinkPad L15 G2 AMD | |
| Asus ExpertBook B1 B1500CEAE, i5-1135G7 | |
| Samsung Galaxy Book Flex 15-NP950 | |
| Dell Latitude 9510 2-in-1 | |
| Lenovo ThinkPad E15 G3-20YG003UGE | |
| LG Gram 15Z90N | |
| Microsoft Surface Laptop 4 15 AMD TFF_00028 | |
| HWBOT x265 Benchmark v2.2 / 4k Preset | |
| HP Pavilion Aero 13 be0097nr | |
| Lenovo ThinkPad E15 G3-20YG003UGE | |
| Microsoft Surface Laptop 4 15 AMD TFF_00028 | |
| Lenovo ThinkPad L15 G2 AMD | |
| Average Intel Core i7-1185G7 (5.02 - 8.13, n=27) | |
| Samsung Galaxy Book Flex 15-NP950 | |
| HP EliteBook 850 G8 3C7Z8EA | |
| Dell Latitude 15 9520 2-in-1 | |
| Asus ExpertBook B1 B1500CEAE, i5-1135G7 | |
| Dell Latitude 9510 2-in-1 | |
| LibreOffice / 20 Documents To PDF | |
| Microsoft Surface Laptop 4 15 AMD TFF_00028 | |
| Dell Latitude 9510 2-in-1 | |
| Lenovo ThinkPad E15 G3-20YG003UGE | |
| Samsung Galaxy Book Flex 15-NP950 | |
| HP EliteBook 850 G8 3C7Z8EA | |
| HP Pavilion Aero 13 be0097nr | |
| Dell Latitude 15 9520 2-in-1 | |
| Asus ExpertBook B1 B1500CEAE, i5-1135G7 | |
| Average Intel Core i7-1185G7 (41.3 - 61.7, n=26) | |
| Lenovo ThinkPad L15 G2 AMD | |
| LG Gram 15Z90N | |
| R Benchmark 2.5 / Overall mean | |
| LG Gram 15Z90N | |
| Dell Latitude 9510 2-in-1 | |
| Samsung Galaxy Book Flex 15-NP950 | |
| Asus ExpertBook B1 B1500CEAE, i5-1135G7 | |
| Microsoft Surface Laptop 4 15 AMD TFF_00028 | |
| Dell Latitude 15 9520 2-in-1 | |
| Lenovo ThinkPad E15 G3-20YG003UGE | |
| Average Intel Core i7-1185G7 (0.55 - 0.615, n=27) | |
| HP EliteBook 850 G8 3C7Z8EA | |
| Lenovo ThinkPad L15 G2 AMD | |
| HP Pavilion Aero 13 be0097nr | |
Cinebench R23: Multi Core | Single Core
Cinebench R20: CPU (Multi Core) | CPU (Single Core)
Cinebench R15: CPU Multi 64Bit | CPU Single 64Bit
Blender: v2.79 BMW27 CPU
7-Zip 18.03: 7z b 4 | 7z b 4 -mmt1
Geekbench 5.5: Multi-Core | Single-Core
HWBOT x265 Benchmark v2.2: 4k Preset
LibreOffice : 20 Documents To PDF
R Benchmark 2.5: Overall mean
* ... smaller is better
AIDA64: FP32 Ray-Trace | FPU Julia | CPU SHA3 | CPU Queen | FPU SinJulia | FPU Mandel | CPU AES | CPU ZLib | FP64 Ray-Trace | CPU PhotoWorxx
| Performance rating | |
| Microsoft Surface Laptop 4 15 AMD TFF_00028 | |
| Lenovo ThinkPad L15 G2 AMD | |
| MSI Summit B15 A11M | |
| Average Intel Core i7-1185G7 | |
| HP EliteBook 850 G8 3C7Z8EA | |
| Dell Latitude 15 9520 2-in-1 | |
| Dell Latitude 9510 2-in-1 | |
| AIDA64 / FP32 Ray-Trace | |
| Microsoft Surface Laptop 4 15 AMD TFF_00028 | |
| Lenovo ThinkPad L15 G2 AMD | |
| MSI Summit B15 A11M | |
| Average Intel Core i7-1185G7 (5621 - 7453, n=20) | |
| HP EliteBook 850 G8 3C7Z8EA | |
| Dell Latitude 15 9520 2-in-1 | |
| Dell Latitude 9510 2-in-1 | |
| AIDA64 / FPU Julia | |
| Microsoft Surface Laptop 4 15 AMD TFF_00028 | |
| Lenovo ThinkPad L15 G2 AMD | |
| Dell Latitude 9510 2-in-1 | |
| MSI Summit B15 A11M | |
| Average Intel Core i7-1185G7 (23248 - 32614, n=20) | |
| HP EliteBook 850 G8 3C7Z8EA | |
| Dell Latitude 15 9520 2-in-1 | |
| AIDA64 / CPU SHA3 | |
| Microsoft Surface Laptop 4 15 AMD TFF_00028 | |
| MSI Summit B15 A11M | |
| Lenovo ThinkPad L15 G2 AMD | |
| Average Intel Core i7-1185G7 (1530 - 2209, n=20) | |
| HP EliteBook 850 G8 3C7Z8EA | |
| Dell Latitude 15 9520 2-in-1 | |
| Dell Latitude 9510 2-in-1 | |
| AIDA64 / CPU Queen | |
| Microsoft Surface Laptop 4 15 AMD TFF_00028 | |
| Lenovo ThinkPad L15 G2 AMD | |
| Dell Latitude 9510 2-in-1 | |
| HP EliteBook 850 G8 3C7Z8EA | |
| Average Intel Core i7-1185G7 (44677 - 52815, n=20) | |
| Dell Latitude 15 9520 2-in-1 | |
| MSI Summit B15 A11M | |
| AIDA64 / FPU SinJulia | |
| Microsoft Surface Laptop 4 15 AMD TFF_00028 | |
| Lenovo ThinkPad L15 G2 AMD | |
| Dell Latitude 9510 2-in-1 | |
| MSI Summit B15 A11M | |
| Average Intel Core i7-1185G7 (3870 - 5027, n=20) | |
| HP EliteBook 850 G8 3C7Z8EA | |
| Dell Latitude 15 9520 2-in-1 | |
| AIDA64 / FPU Mandel | |
| Microsoft Surface Laptop 4 15 AMD TFF_00028 | |
| Lenovo ThinkPad L15 G2 AMD | |
| MSI Summit B15 A11M | |
| Average Intel Core i7-1185G7 (14584 - 19594, n=20) | |
| HP EliteBook 850 G8 3C7Z8EA | |
| Dell Latitude 15 9520 2-in-1 | |
| Dell Latitude 9510 2-in-1 | |
| AIDA64 / CPU AES | |
| Lenovo ThinkPad L15 G2 AMD | |
| HP EliteBook 850 G8 3C7Z8EA | |
| Average Intel Core i7-1185G7 (33002 - 76826, n=20) | |
| MSI Summit B15 A11M | |
| Microsoft Surface Laptop 4 15 AMD TFF_00028 | |
| Dell Latitude 15 9520 2-in-1 | |
| Dell Latitude 9510 2-in-1 | |
| AIDA64 / CPU ZLib | |
| Microsoft Surface Laptop 4 15 AMD TFF_00028 | |
| Lenovo ThinkPad L15 G2 AMD | |
| Dell Latitude 9510 2-in-1 | |
| MSI Summit B15 A11M | |
| HP EliteBook 850 G8 3C7Z8EA | |
| Average Intel Core i7-1185G7 (258 - 412, n=22) | |
| Dell Latitude 15 9520 2-in-1 | |
| AIDA64 / FP64 Ray-Trace | |
| Microsoft Surface Laptop 4 15 AMD TFF_00028 | |
| Lenovo ThinkPad L15 G2 AMD | |
| MSI Summit B15 A11M | |
| Average Intel Core i7-1185G7 (2821 - 4094, n=20) | |
| HP EliteBook 850 G8 3C7Z8EA | |
| Dell Latitude 15 9520 2-in-1 | |
| Dell Latitude 9510 2-in-1 | |
| AIDA64 / CPU PhotoWorxx | |
| Dell Latitude 15 9520 2-in-1 | |
| Average Intel Core i7-1185G7 (22349 - 43701, n=20) | |
| MSI Summit B15 A11M | |
| HP EliteBook 850 G8 3C7Z8EA | |
| Microsoft Surface Laptop 4 15 AMD TFF_00028 | |
| Dell Latitude 9510 2-in-1 | |
| Lenovo ThinkPad L15 G2 AMD | |
系统性能
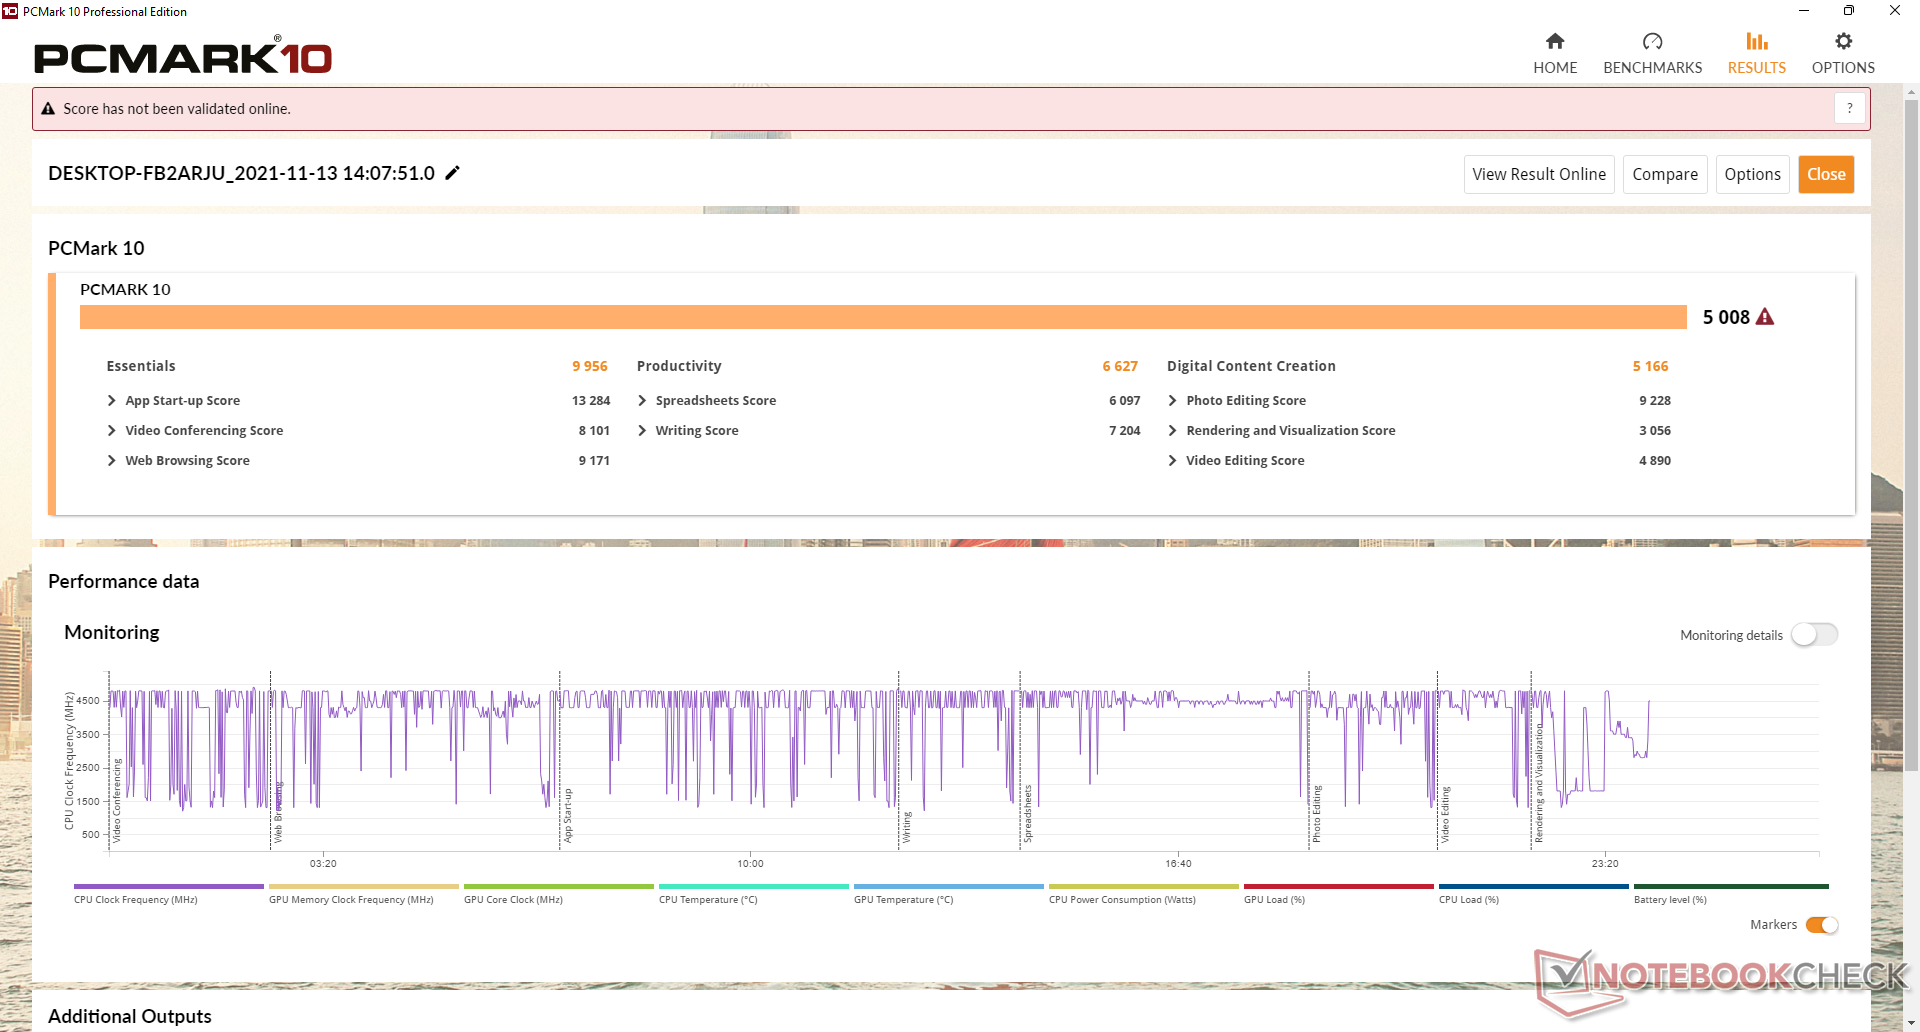
PCMark 10的得分通常高于我们在Latitude 9510 2-in-1上的记录,特别是在数字内容创作方面,图形最重要。老款机型的生产力得分较高,可能是由于其优越的多线程性能。
| PCMark 10 / Score | |
| Lenovo ThinkPad L15 G2 AMD | |
| Microsoft Surface Laptop 4 15 AMD TFF_00028 | |
| Dell Latitude 15 9520 2-in-1 | |
| Average Intel Core i7-1185G7, Intel Iris Xe Graphics G7 96EUs (4746 - 5561, n=20) | |
| HP EliteBook 850 G8 3C7Z8EA | |
| MSI Summit B15 A11M | |
| Dell Latitude 9510 2-in-1 | |
| PCMark 10 / Essentials | |
| Lenovo ThinkPad L15 G2 AMD | |
| Dell Latitude 15 9520 2-in-1 | |
| Average Intel Core i7-1185G7, Intel Iris Xe Graphics G7 96EUs (8279 - 10664, n=20) | |
| Dell Latitude 9510 2-in-1 | |
| MSI Summit B15 A11M | |
| HP EliteBook 850 G8 3C7Z8EA | |
| Microsoft Surface Laptop 4 15 AMD TFF_00028 | |
| PCMark 10 / Productivity | |
| Lenovo ThinkPad L15 G2 AMD | |
| Microsoft Surface Laptop 4 15 AMD TFF_00028 | |
| Dell Latitude 9510 2-in-1 | |
| HP EliteBook 850 G8 3C7Z8EA | |
| Average Intel Core i7-1185G7, Intel Iris Xe Graphics G7 96EUs (5799 - 8770, n=20) | |
| Dell Latitude 15 9520 2-in-1 | |
| MSI Summit B15 A11M | |
| PCMark 10 / Digital Content Creation | |
| Microsoft Surface Laptop 4 15 AMD TFF_00028 | |
| Dell Latitude 15 9520 2-in-1 | |
| Average Intel Core i7-1185G7, Intel Iris Xe Graphics G7 96EUs (4424 - 5684, n=20) | |
| HP EliteBook 850 G8 3C7Z8EA | |
| Lenovo ThinkPad L15 G2 AMD | |
| MSI Summit B15 A11M | |
| Dell Latitude 9510 2-in-1 | |
| PCMark 10 Score | 5008 points | |
Help | ||
| AIDA64 / Memory Copy | |
| Dell Latitude 15 9520 2-in-1 | |
| Average Intel Core i7-1185G7 (36515 - 68450, n=20) | |
| HP EliteBook 850 G8 3C7Z8EA | |
| Microsoft Surface Laptop 4 15 AMD TFF_00028 | |
| MSI Summit B15 A11M | |
| Dell Latitude 9510 2-in-1 | |
| Lenovo ThinkPad L15 G2 AMD | |
| AIDA64 / Memory Read | |
| Dell Latitude 15 9520 2-in-1 | |
| Average Intel Core i7-1185G7 (38394 - 64291, n=20) | |
| HP EliteBook 850 G8 3C7Z8EA | |
| Microsoft Surface Laptop 4 15 AMD TFF_00028 | |
| MSI Summit B15 A11M | |
| Dell Latitude 9510 2-in-1 | |
| Lenovo ThinkPad L15 G2 AMD | |
| AIDA64 / Memory Write | |
| Dell Latitude 15 9520 2-in-1 | |
| Average Intel Core i7-1185G7 (37684 - 66873, n=20) | |
| HP EliteBook 850 G8 3C7Z8EA | |
| MSI Summit B15 A11M | |
| Microsoft Surface Laptop 4 15 AMD TFF_00028 | |
| Dell Latitude 9510 2-in-1 | |
| Lenovo ThinkPad L15 G2 AMD | |
| AIDA64 / Memory Latency | |
| Microsoft Surface Laptop 4 15 AMD TFF_00028 | |
| Dell Latitude 15 9520 2-in-1 | |
| Dell Latitude 9510 2-in-1 | |
| Lenovo ThinkPad L15 G2 AMD | |
| Average Intel Core i7-1185G7 (78.3 - 117, n=22) | |
| MSI Summit B15 A11M | |
| HP EliteBook 850 G8 3C7Z8EA | |
* ... smaller is better
DPC延时
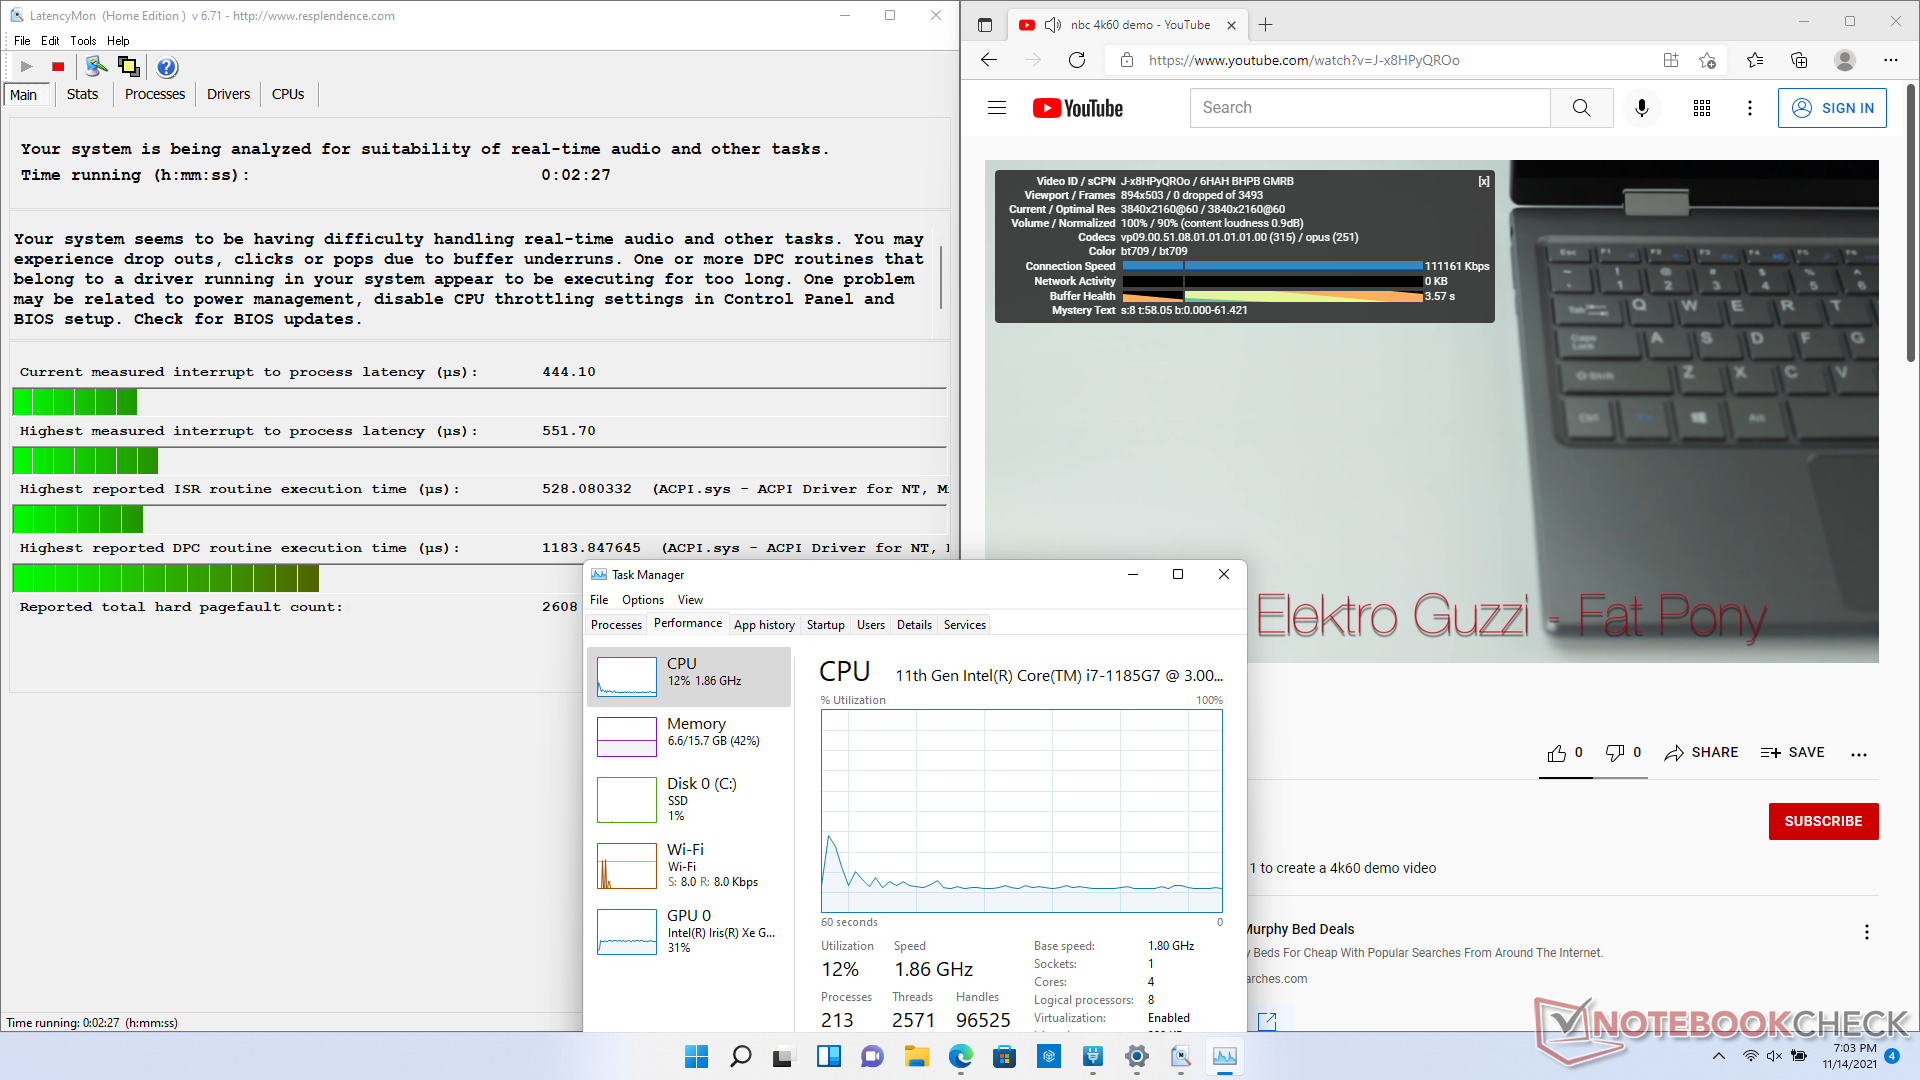
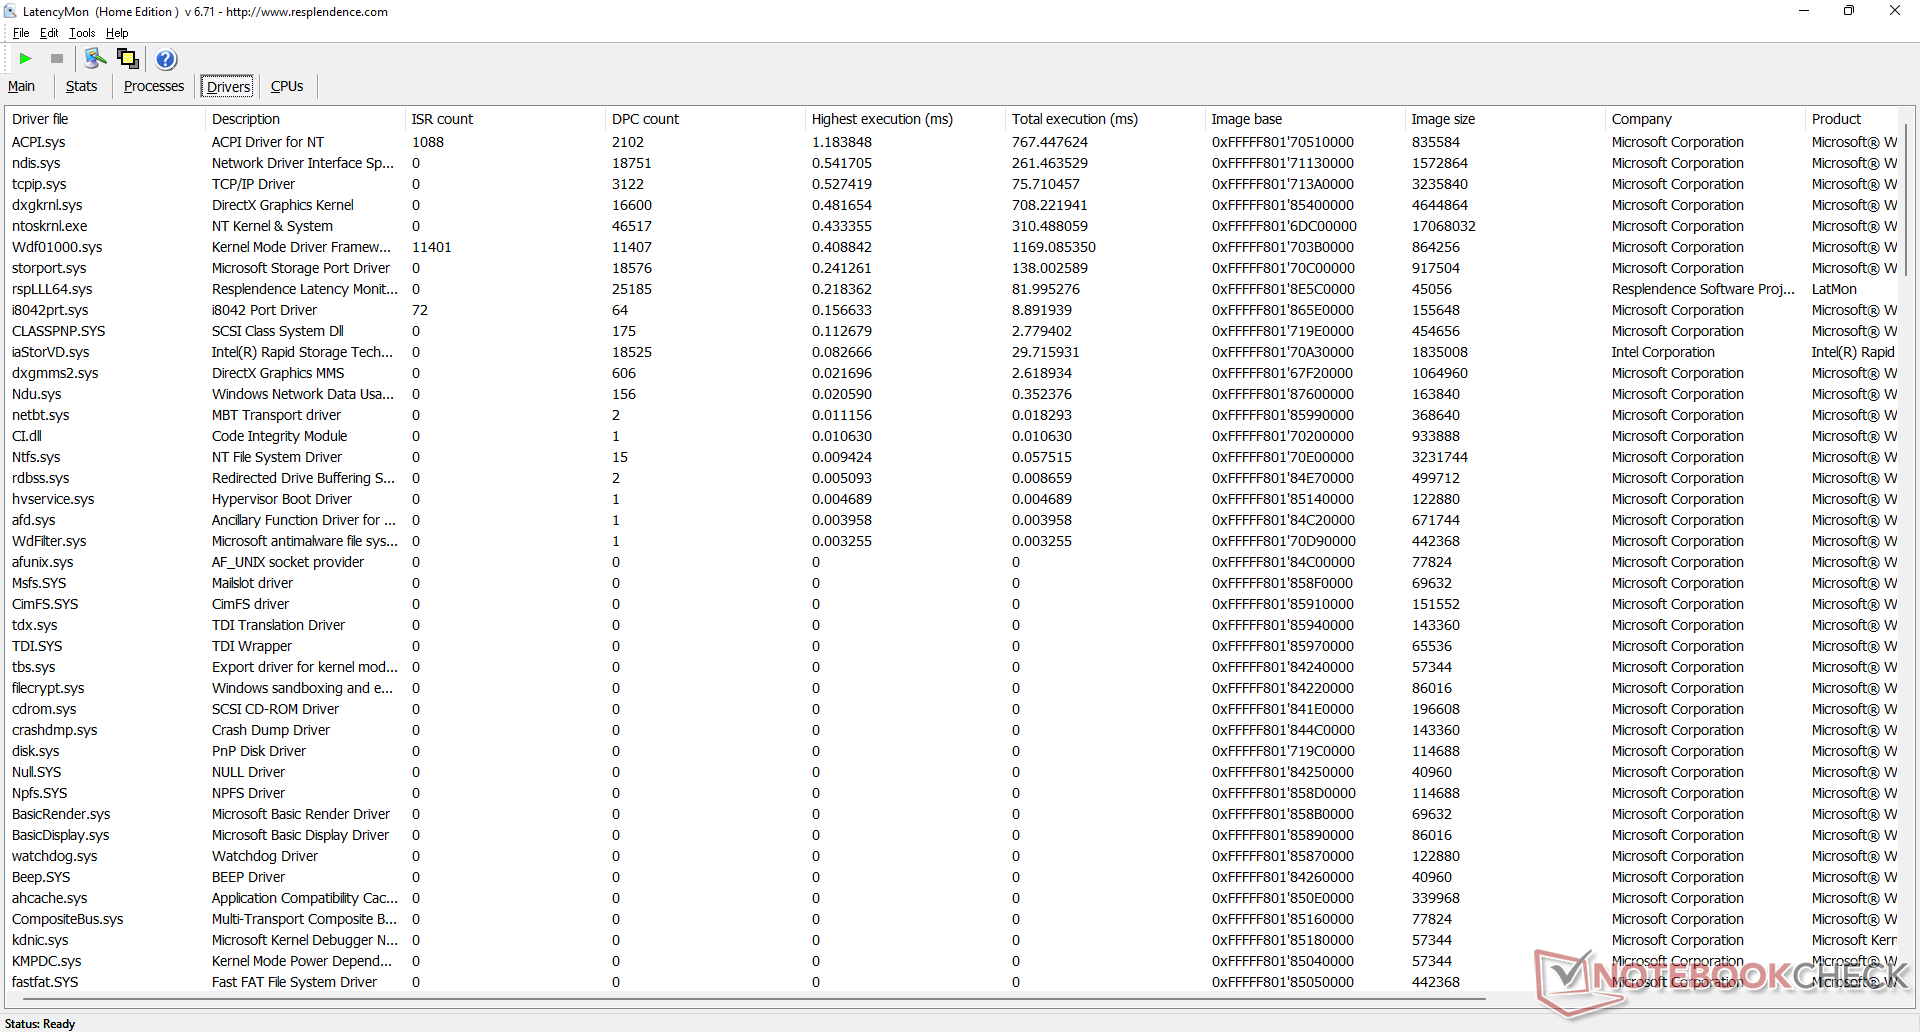
LatencyMon显示,在打开我们的主页的多个浏览器标签时,与ACPI.sys有关的轻微DPC延迟问题。尽管如此,与我们在去年的模型上观察到的情况相比,它仍然是一个改进。
在60 FPS下的4K视频播放仍然完美,没有丢帧,而且比UHD Graphics 620的GPU利用率更高。
| DPC Latencies / LatencyMon - interrupt to process latency (max), Web, Youtube, Prime95 | |
| Dell Latitude 9510 2-in-1 | |
| Lenovo ThinkPad L15 G2 AMD | |
| HP EliteBook 850 G8 3C7Z8EA | |
| MSI Summit B15 A11M | |
| Microsoft Surface Laptop 4 15 AMD TFF_00028 | |
| Dell Latitude 15 9520 2-in-1 | |
* ... smaller is better
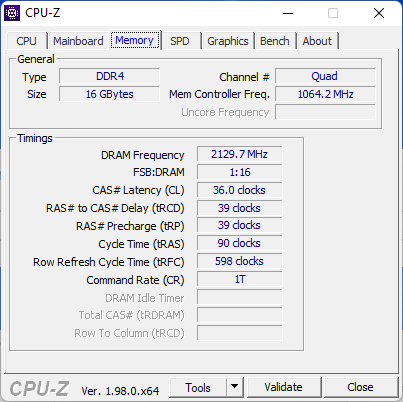
存储设备
我们的测试装置使用相同的PCIe3 x4 东芝KBG40ZNS512G NVMe Latitude 9510 2合1上的M.2 2230 SSD。戴尔目前没有提供PCIe4选项,尽管英特尔芯片组理论上应该能够支持这种SSD。然而,缺乏散热器将意味着任何PCIe4固态硬盘在短时间内可能会被扼杀。

| Drive Performance rating - Percent | |
| HP EliteBook 850 G8 3C7Z8EA | |
| Lenovo ThinkPad L15 G2 AMD | |
| MSI Summit B15 A11M | |
| Microsoft Surface Laptop 4 15 AMD TFF_00028 | |
| Dell Latitude 15 9520 2-in-1 | |
| Dell Latitude 9510 2-in-1 | |
* ... smaller is better
Disk Throttling: DiskSpd Read Loop, Queue Depth 8
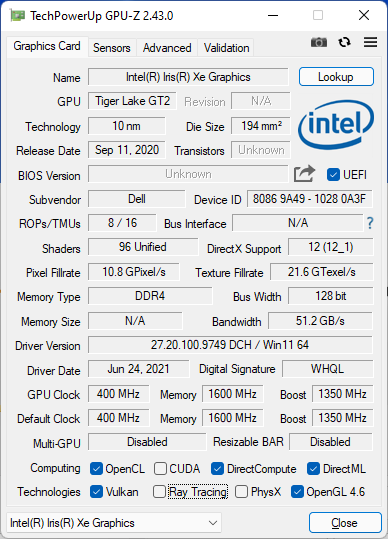
GPU性能
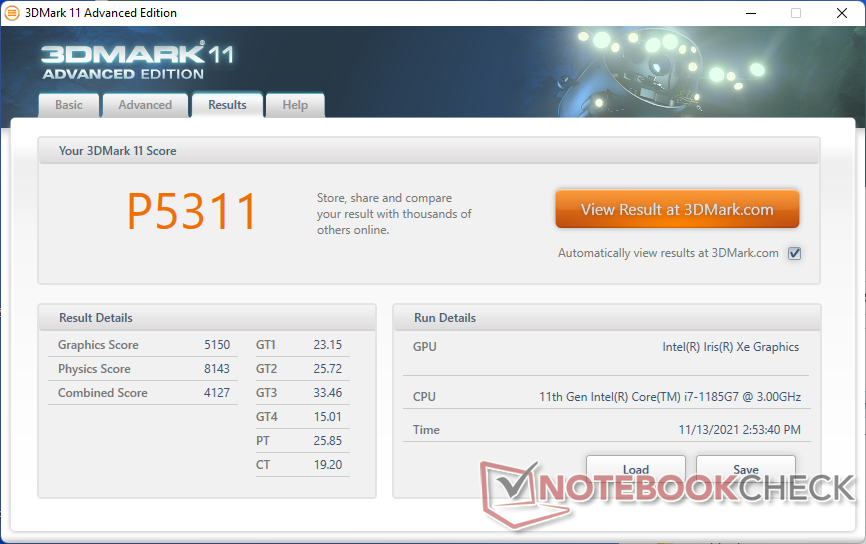
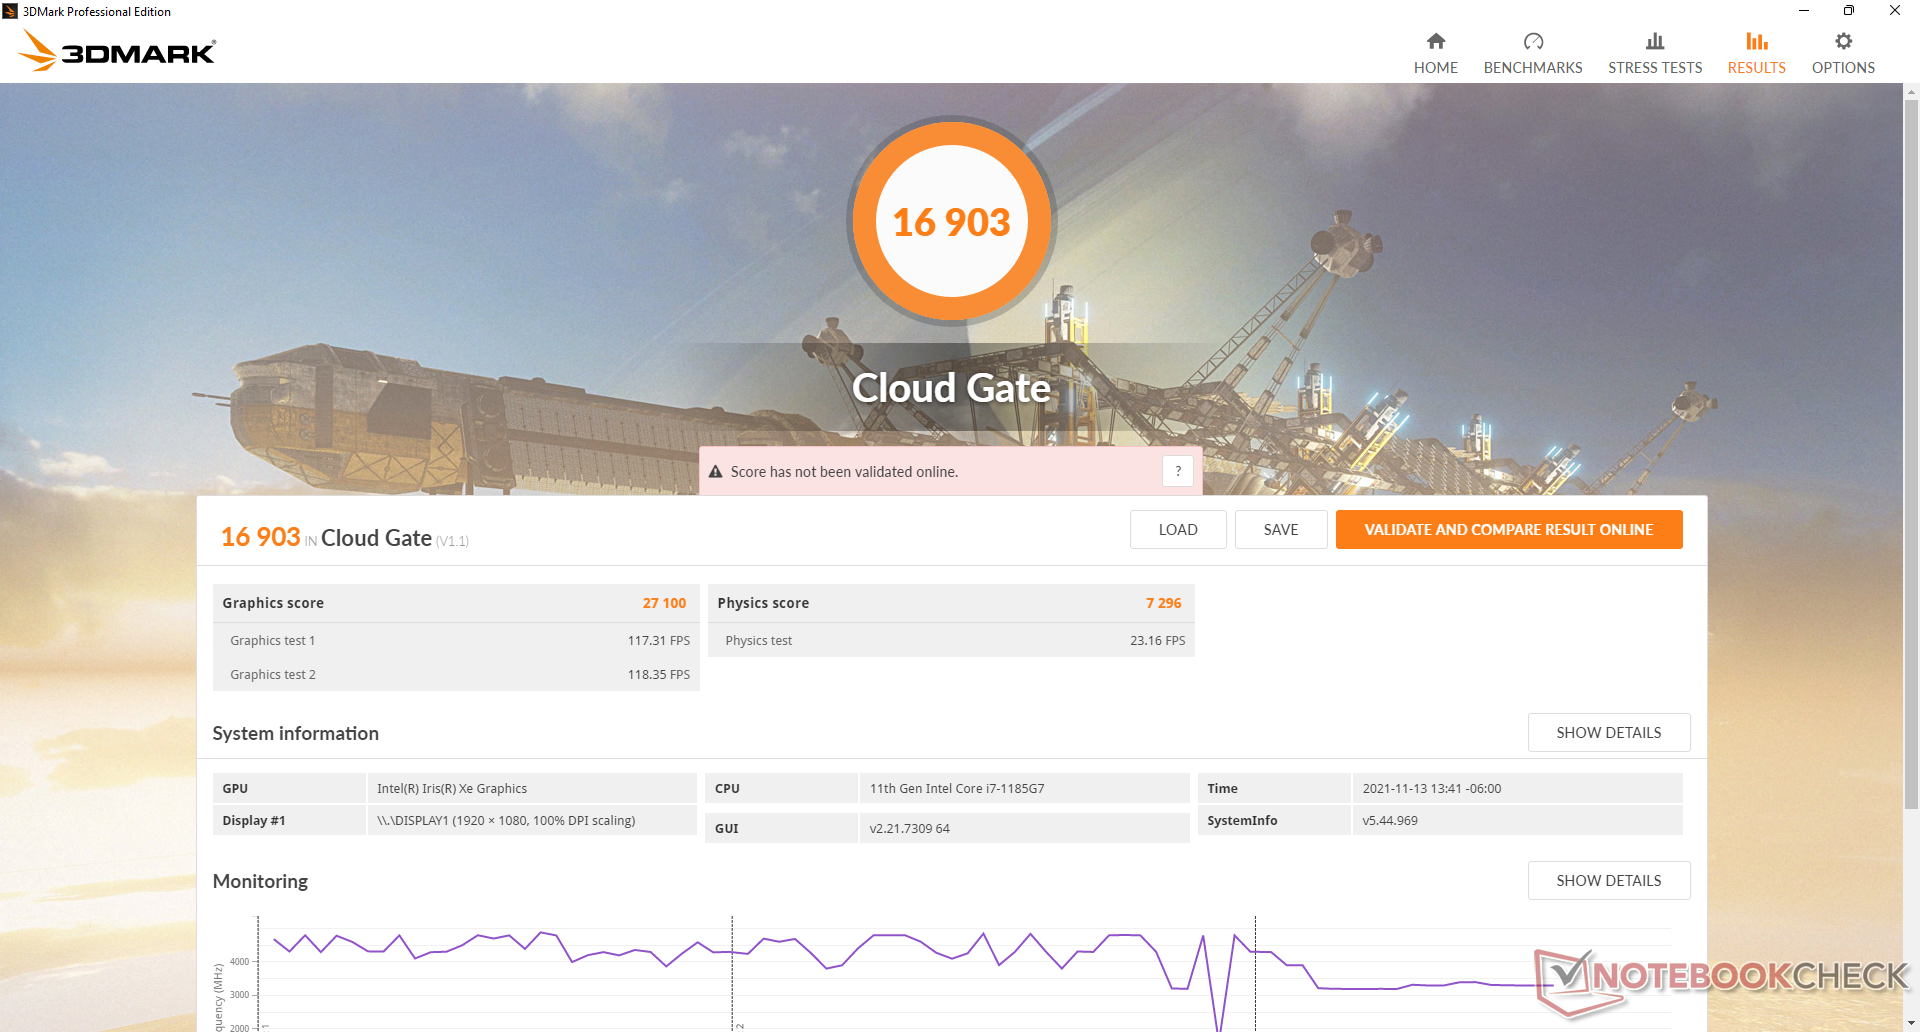
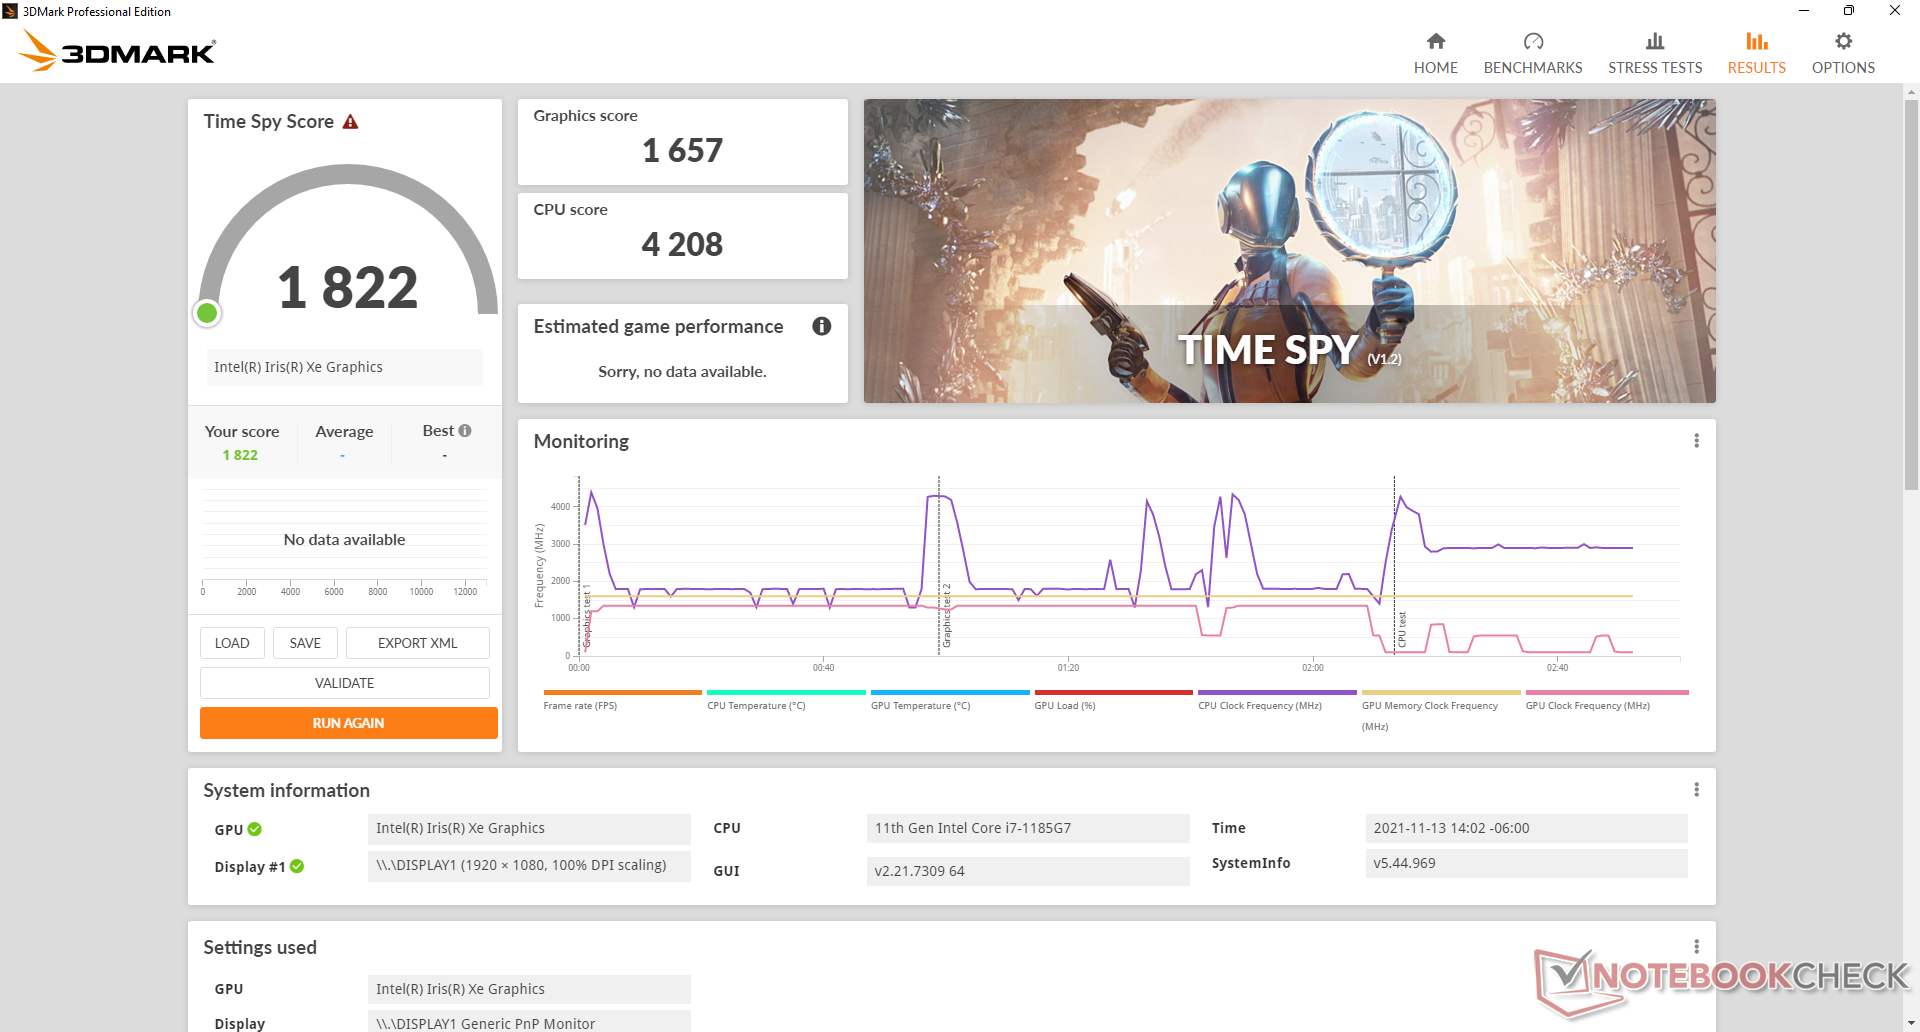
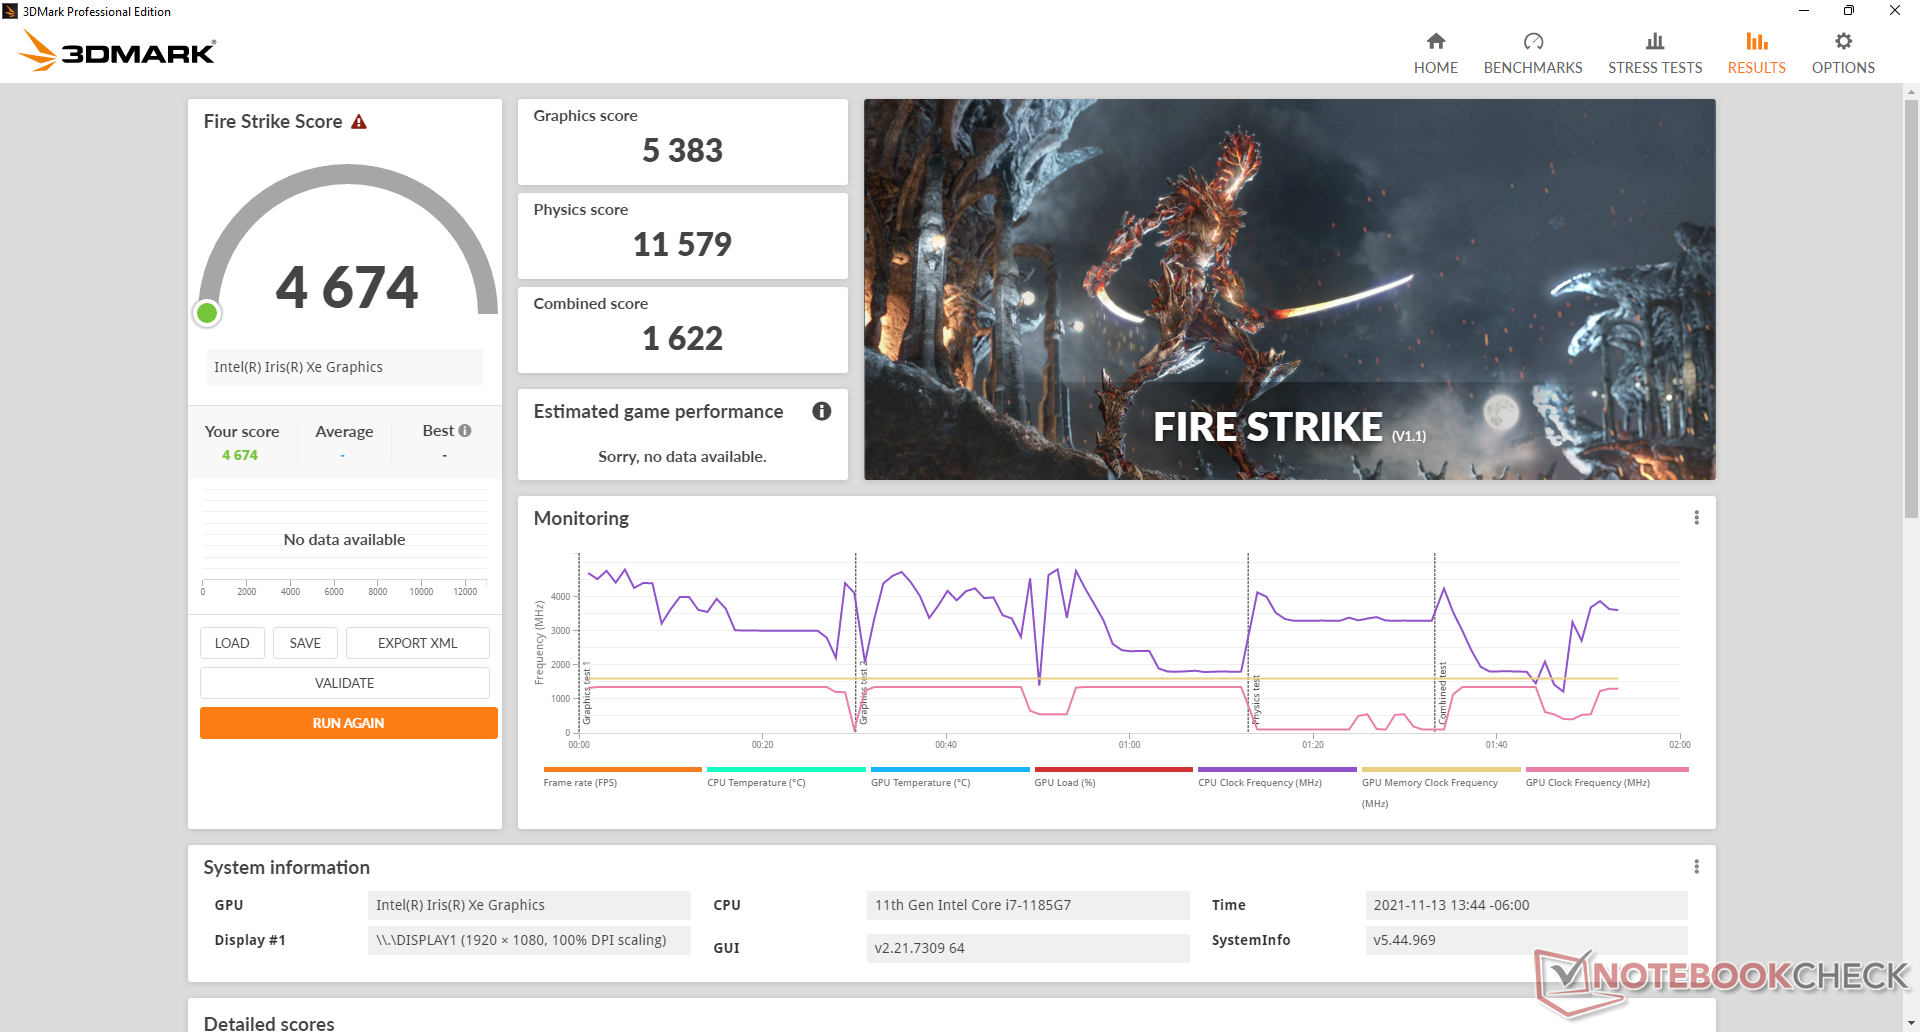
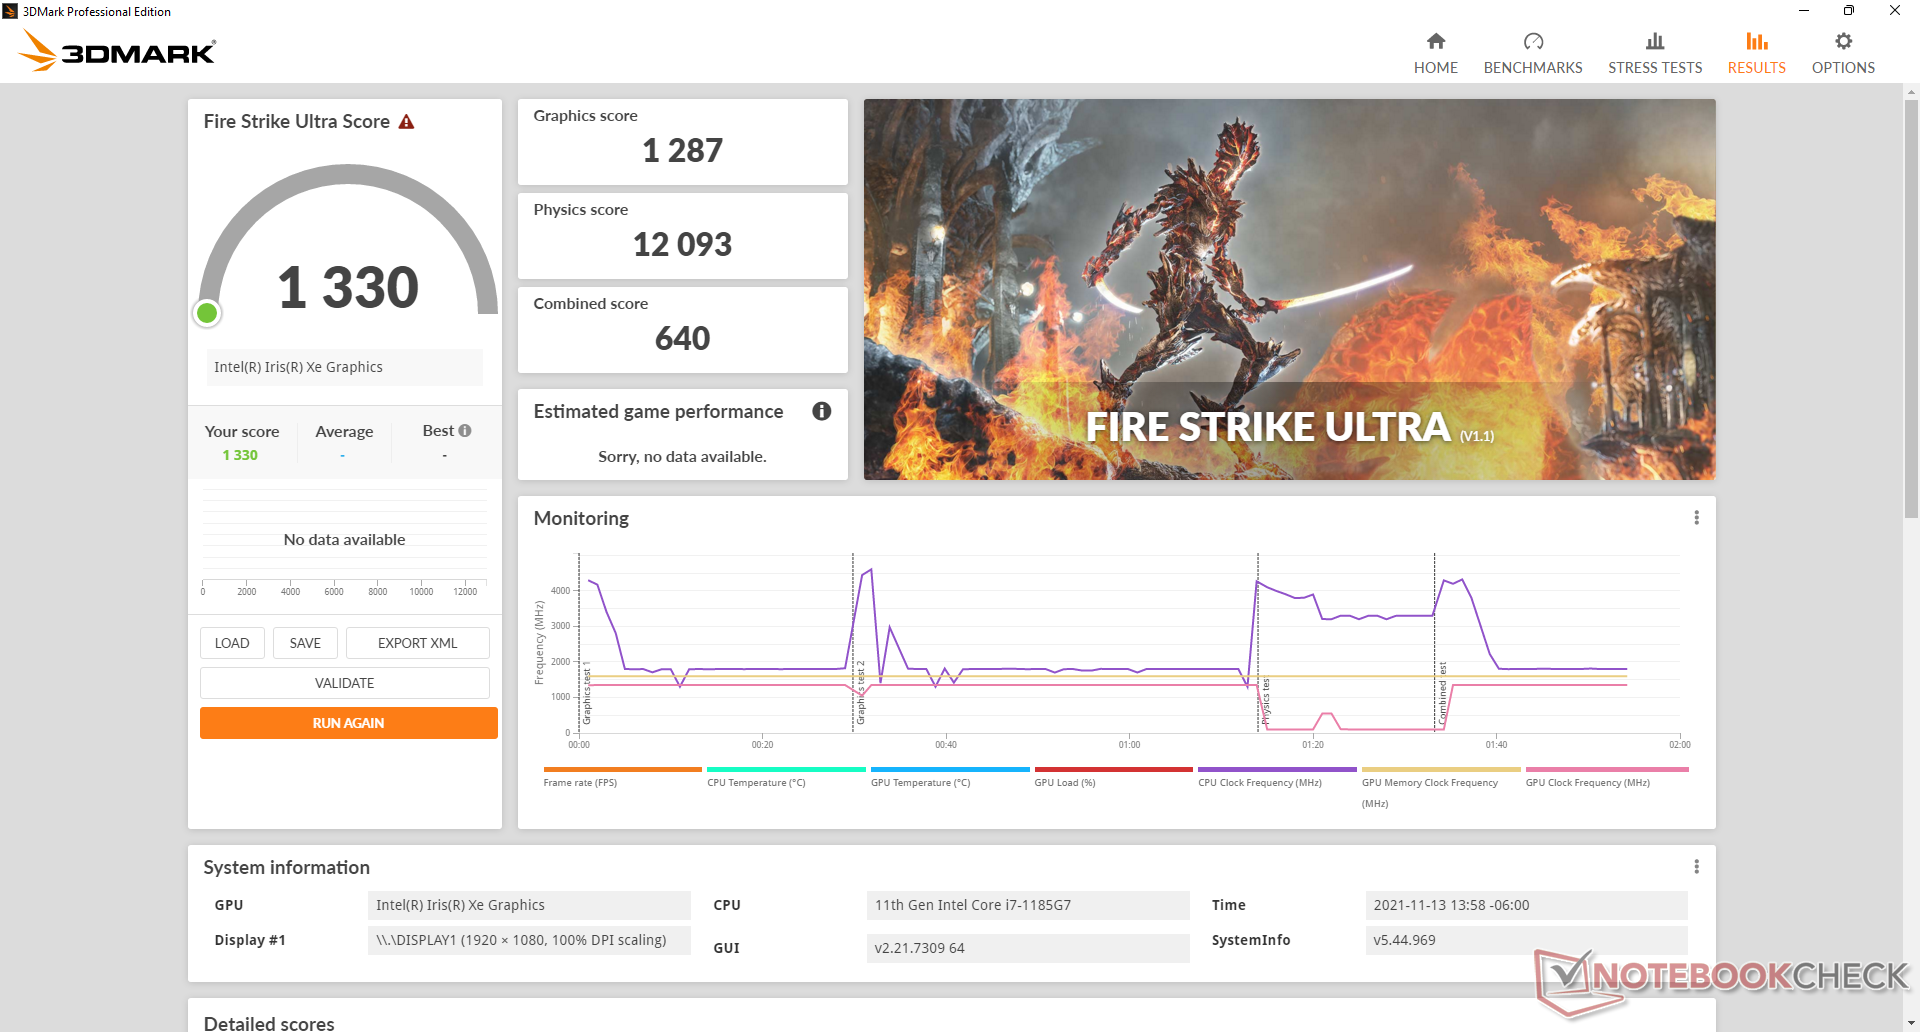
3DMark的分数显示 Iris Xe 96 EUs在我们的Latitude 9520 2-in-1中,相对于我们数据库中的其他Iris Xe笔记本电脑,表现良好。然而,细节决定成败,由于帧率波动异常大,现实世界的游戏性能很差。例如,帧率会在40 FPS和90 FPS之间不断跳动,当简单地在最低设置下空转时 Witcher 3在其最低设置下,而由Iris Xe驱动的 微星Summit B15的微星Summit B15则运行得更稳定,没有任何急剧的FPS下降。因此,虽然我们的Latitude 9520 2-in-1 Iris Xe的速度无疑比 UHD Graphics 620去年的Latitude 9510二合一的速度,但随着时间的推移,它的性能肯定会更加稳定。
| 3DMark Performance rating - Percent | |
| MSI Prestige 15 A10SC | |
| HP EliteBook 850 G8 3C7Z8EA | |
| Dell Latitude 15 9520 2-in-1 | |
| Average Intel Iris Xe Graphics G7 96EUs | |
| Asus Vivobook 15 K513EQ | |
| Microsoft Surface Laptop 4 15 AMD TFF_00028 | |
| HP Pavilion Aero 13 be0097nr | |
| Lenovo ThinkPad E15 G3-20YG003UGE | |
| Samsung Galaxy Book Flex 15-NP950 | |
| Asus VivoBook S15 S530UN-BQ097T | |
| Lenovo ThinkPad L15 G2 AMD | |
| Asus ExpertBook B1 B1500CEAE, i5-1135G7 | |
| LG Gram 15Z90N -2! | |
| Dell Latitude 9510 2-in-1 | |
| 3DMark 11 - 1280x720 Performance GPU | |
| MSI Prestige 15 A10SC | |
| HP EliteBook 850 G8 3C7Z8EA | |
| Average Intel Iris Xe Graphics G7 96EUs (2867 - 7676, n=209) | |
| Asus Vivobook 15 K513EQ | |
| Microsoft Surface Laptop 4 15 AMD TFF_00028 | |
| HP Pavilion Aero 13 be0097nr | |
| Lenovo ThinkPad E15 G3-20YG003UGE | |
| Dell Latitude 15 9520 2-in-1 | |
| Samsung Galaxy Book Flex 15-NP950 | |
| Asus VivoBook S15 S530UN-BQ097T | |
| Lenovo ThinkPad L15 G2 AMD | |
| Asus ExpertBook B1 B1500CEAE, i5-1135G7 | |
| LG Gram 15Z90N | |
| Dell Latitude 9510 2-in-1 | |
| 3DMark 11 Performance | 5311 points | |
| 3DMark Cloud Gate Standard Score | 16903 points | |
| 3DMark Fire Strike Score | 4674 points | |
| 3DMark Time Spy Score | 1822 points | |
Help | ||
Witcher 3 FPS Chart
| low | med. | high | ultra | |
|---|---|---|---|---|
| GTA V (2015) | 81 | 70.5 | 27.2 | 10.6 |
| The Witcher 3 (2015) | 86.8 | 59.4 | 33.5 | 14.3 |
| Dota 2 Reborn (2015) | 103 | 61.7 | 39.8 | 39.8 |
| Final Fantasy XV Benchmark (2018) | 35 | 20 | 14.6 | |
| X-Plane 11.11 (2018) | 36 | 34.4 | 27.5 | |
| Strange Brigade (2018) | 82.8 | 32.7 | 26.3 | 23.2 |
排放
系统噪音
当在平衡或优化模式或更低的模式下空转或浏览网页时,内部风扇的噪音为24.1 dN(A)。它可能偶尔会跳到25.8分贝(A),但这在大多数环境中是难以察觉的。用户在运行游戏等高负荷时,可以达到略低于40分贝(A)的最大风扇噪音。
如果在浏览或视频流时设置为高性能模式,风扇噪音会更频繁地脉冲。因此,如果担心风扇噪音,一定要适当地设置电源配置文件。
Noise level
| Idle |
| 24.1 / 24.1 / 25.8 dB(A) |
| Load |
| 34.2 / 39.6 dB(A) |
 | ||
30 dB silent 40 dB(A) audible 50 dB(A) loud |
||
min: | ||
| Dell Latitude 15 9520 2-in-1 Iris Xe G7 96EUs, i7-1185G7, Toshiba KBG40ZNS512G NVMe | Dell Latitude 9510 2-in-1 UHD Graphics 620, i7-10810U, Toshiba KBG40ZNS512G NVMe | HP EliteBook 850 G8 3C7Z8EA Iris Xe G7 96EUs, i7-1165G7, Samsung PM981a MZVLB1T0HBLR | Lenovo ThinkPad L15 G2 AMD Vega 7, R5 5600U, SK Hynix HFS512 GDE9X081N | MSI Summit B15 A11M Iris Xe G7 96EUs, i7-1165G7, Kingston OM8PCP31024F | Microsoft Surface Laptop 4 15 AMD TFF_00028 Vega 8, R7 4980U, SK Hynix BC511 HFM512GDJTNI | |
|---|---|---|---|---|---|---|
| Noise | -7% | 0% | 6% | -1% | -2% | |
| off / environment * (dB) | 24 | 27.2 -13% | 26 -8% | 24.22 -1% | 25.2 -5% | 24.2 -1% |
| Idle Minimum * (dB) | 24.1 | 27.2 -13% | 26 -8% | 24.22 -0% | 26.4 -10% | 24.2 -0% |
| Idle Average * (dB) | 24.1 | 27.2 -13% | 26 -8% | 24.22 -0% | 26.4 -10% | 24.2 -0% |
| Idle Maximum * (dB) | 25.8 | 27.2 -5% | 26.2 -2% | 24.22 6% | 26.4 -2% | 24.2 6% |
| Load Average * (dB) | 34.2 | 33.4 2% | 29.5 14% | 25.84 24% | 26.8 22% | 39.9 -17% |
| Witcher 3 ultra * (dB) | 39.6 | 28 29% | 39.9 -1% | |||
| Load Maximum * (dB) | 39.6 | 39.5 -0% | 34 14% | 36.02 9% | 52.6 -33% | 39.9 -1% |
* ... smaller is better
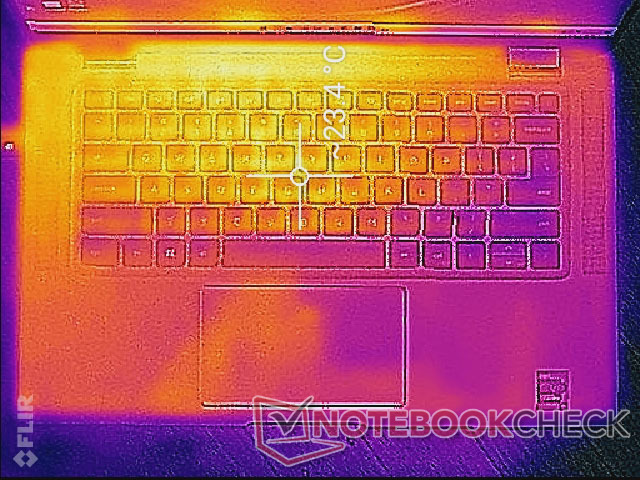
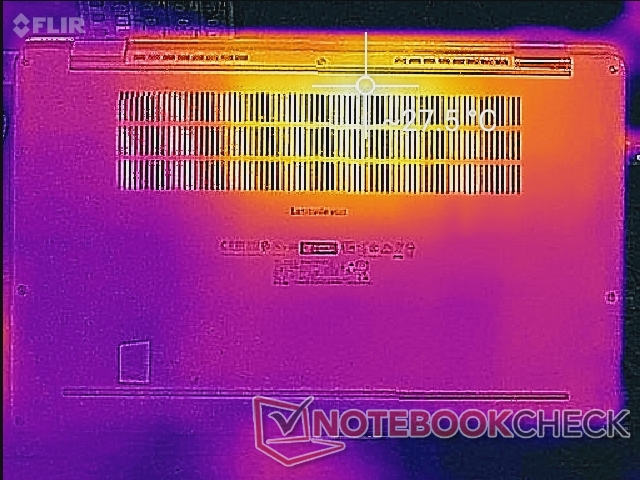
温度
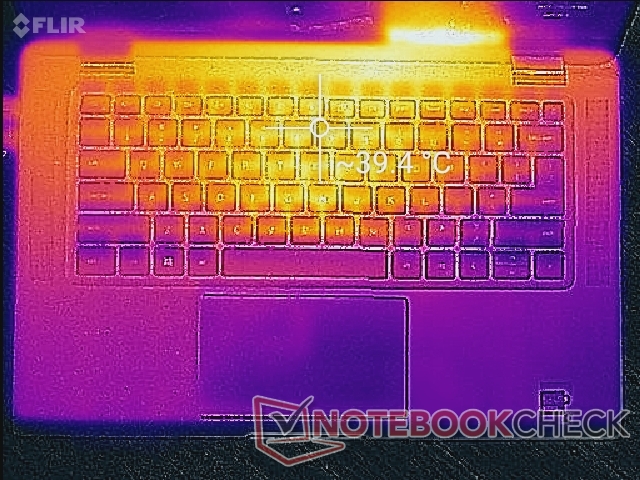
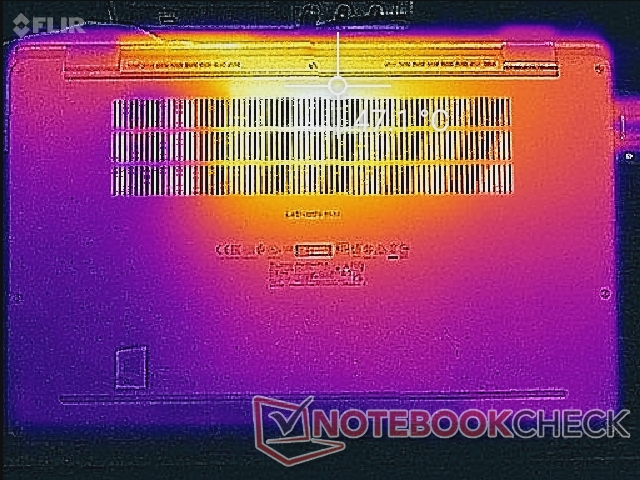
在运行低到中等负荷时,表面温度与Latitude 9510 2-in-1相似。然而,如果运行更高的负载,如游戏,Latitude 9520 2-in-1的底部热点可能比旧型号的温度要高几度。
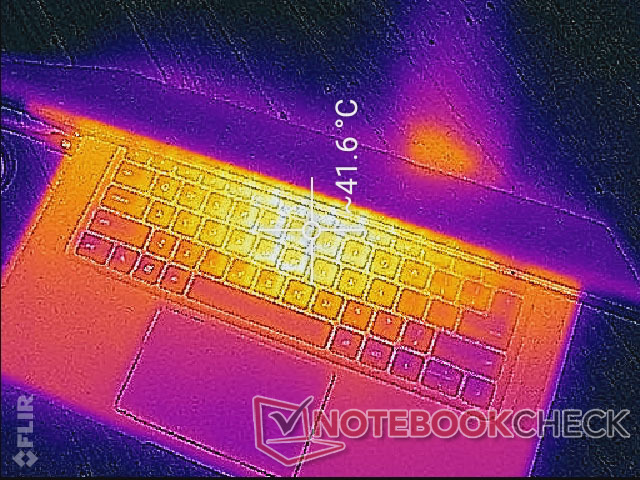
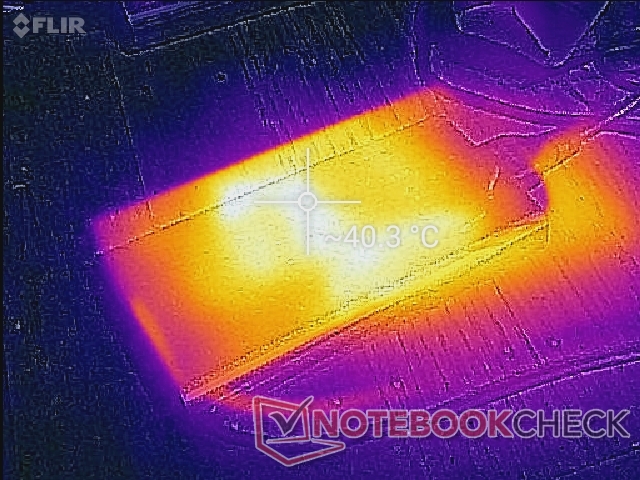
(±) The maximum temperature on the upper side is 40 °C / 104 F, compared to the average of 34.3 °C / 94 F, ranging from 21.2 to 62.5 °C for the class Office.
(-) The bottom heats up to a maximum of 47.2 °C / 117 F, compared to the average of 36.8 °C / 98 F
(+) In idle usage, the average temperature for the upper side is 22.5 °C / 73 F, compared to the device average of 29.5 °C / 85 F.
(+) The palmrests and touchpad are cooler than skin temperature with a maximum of 28.6 °C / 83.5 F and are therefore cool to the touch.
(±) The average temperature of the palmrest area of similar devices was 27.5 °C / 81.5 F (-1.1 °C / -2 F).
| Dell Latitude 15 9520 2-in-1 Intel Core i7-1185G7, Intel Iris Xe Graphics G7 96EUs | Dell Latitude 9510 2-in-1 Intel Core i7-10810U, Intel UHD Graphics 620 | HP EliteBook 850 G8 3C7Z8EA Intel Core i7-1165G7, Intel Iris Xe Graphics G7 96EUs | Lenovo ThinkPad L15 G2 AMD AMD Ryzen 5 5600U, AMD Radeon RX Vega 7 | MSI Summit B15 A11M Intel Core i7-1165G7, Intel Iris Xe Graphics G7 96EUs | Microsoft Surface Laptop 4 15 AMD TFF_00028 AMD Ryzen 7 4980U, AMD Radeon RX Vega 8 (Ryzen 4000/5000) | |
|---|---|---|---|---|---|---|
| Heat | -9% | -3% | -8% | -8% | 4% | |
| Maximum Upper Side * (°C) | 40 | 42.8 -7% | 37.9 5% | 42.8 -7% | 42.8 -7% | 41.8 -5% |
| Maximum Bottom * (°C) | 47.2 | 41.8 11% | 39 17% | 46 3% | 52.2 -11% | 44.8 5% |
| Idle Upper Side * (°C) | 23.4 | 29.2 -25% | 31 -32% | 26.9 -15% | 26 -11% | 23 2% |
| Idle Bottom * (°C) | 27.4 | 31 -13% | 27.8 -1% | 31.1 -14% | 28.2 -3% | 23.6 14% |
* ... smaller is better
压力测试
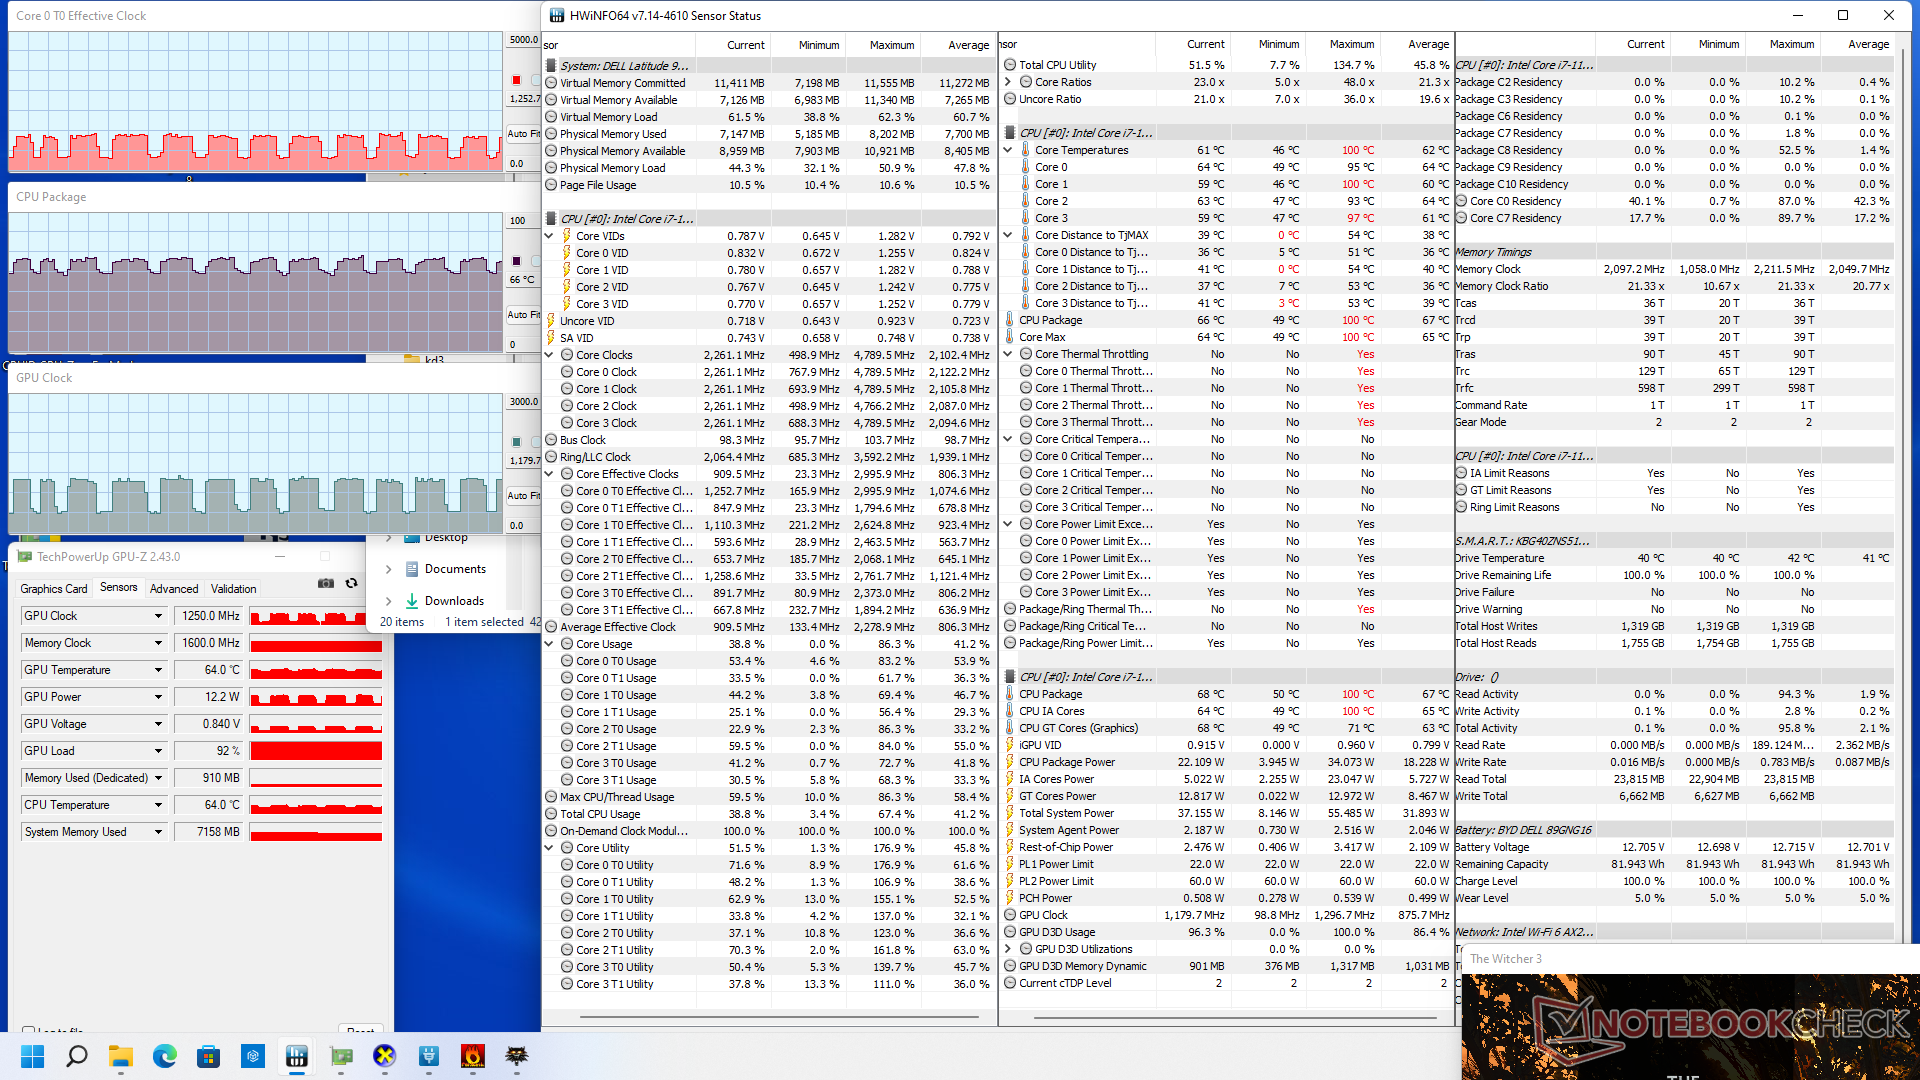
运行时的不稳定性能 Witcher 3如上所述,可以归因于CPU和GPU同时处于负载状态时的不稳定的时钟速率。在运行游戏时,GPU时钟速率会在500MHz和1200MHz之间翻转,而其他大多数Iris Xe笔记本电脑会在固定的时钟速率下保持稳定,以获得更稳定的性能。微星 MSI Summit B15例如,在与我们的戴尔相同的游戏条件下,它的GPU时钟速率稳定在1300MHz。这种不理想的GPU行为使Latitude 9520二合一产品成为图形密集型任务的相对较差的选择。
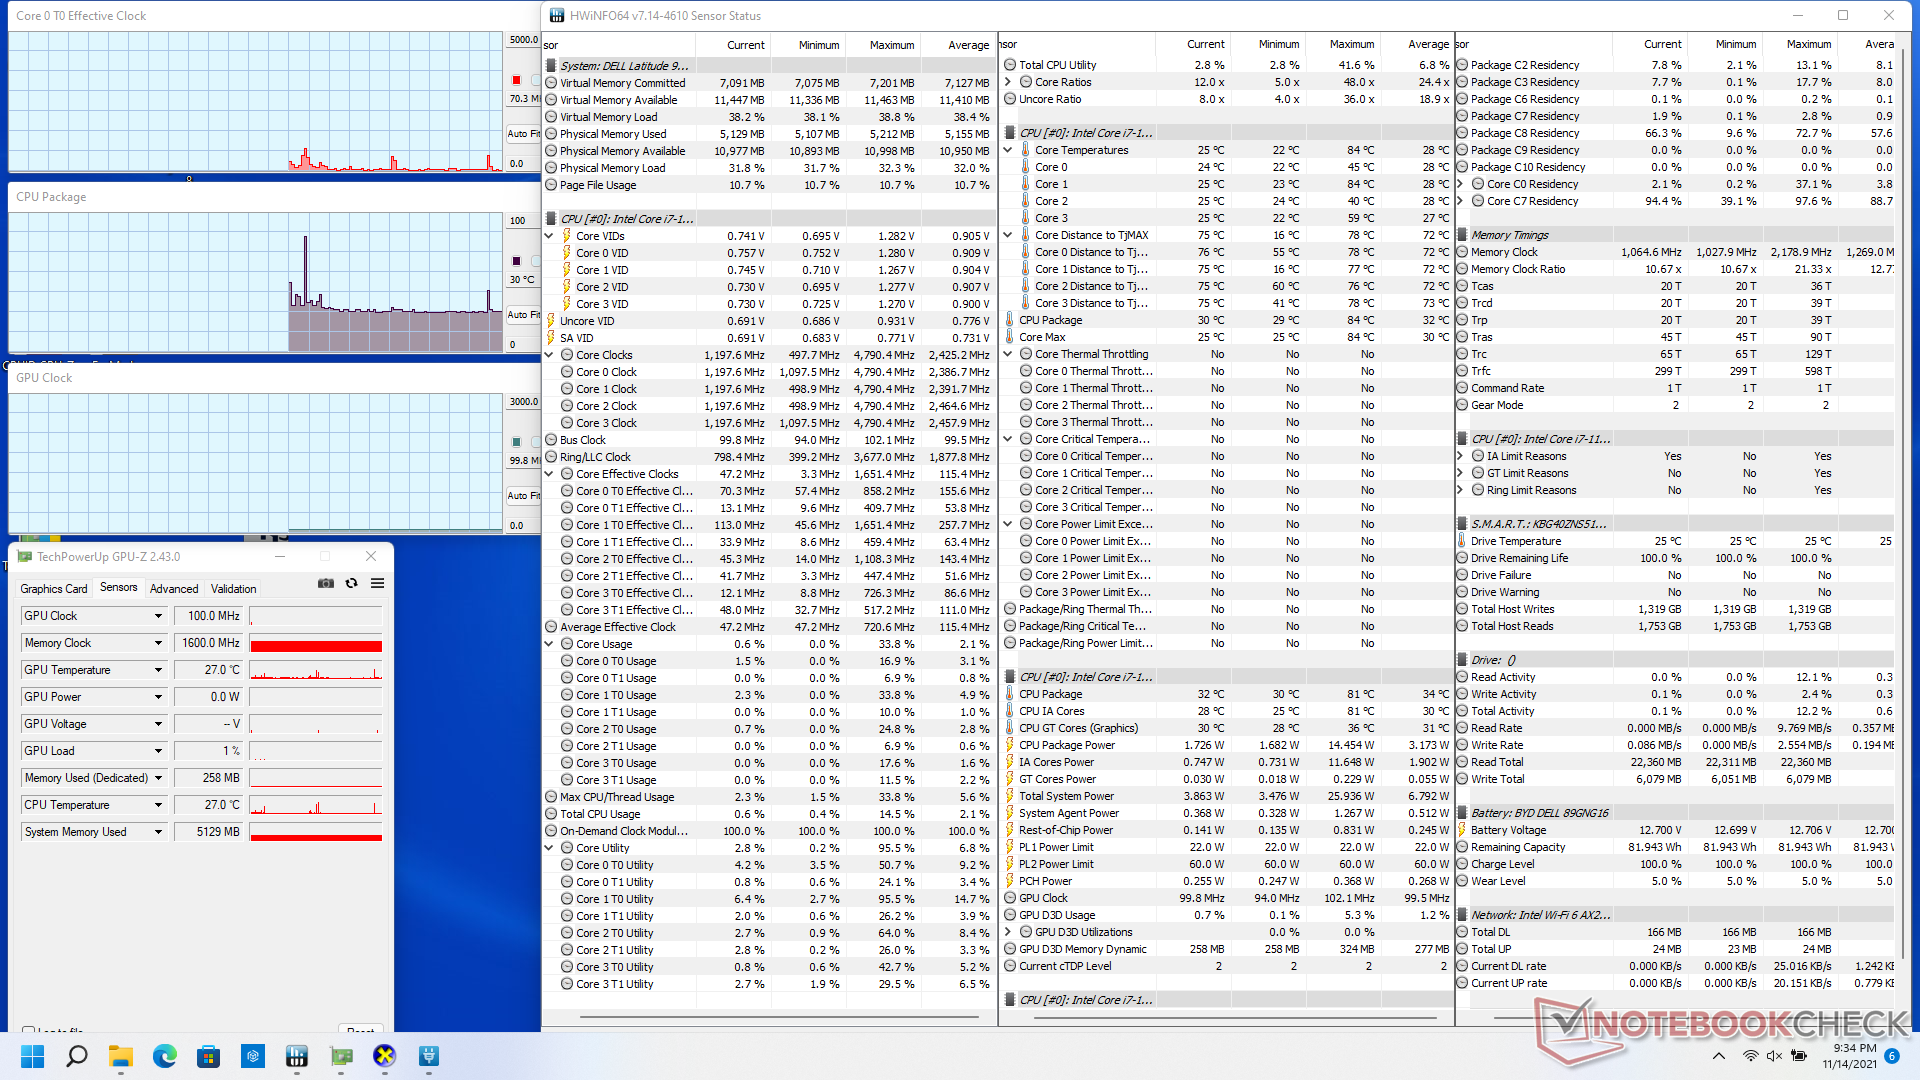
如果通过Prime95只对CPU施加压力,在核心温度为98摄氏度的情况下,时钟频率将在最初的几秒钟内提升到3.2GHz。此后,时钟频率将下降到2GHz的低范围,以保持75摄氏度左右的较低核心温度。
用电池供电运行不会限制性能,因为3DMark 11的分数在主电源和电池之间几乎是相同的。
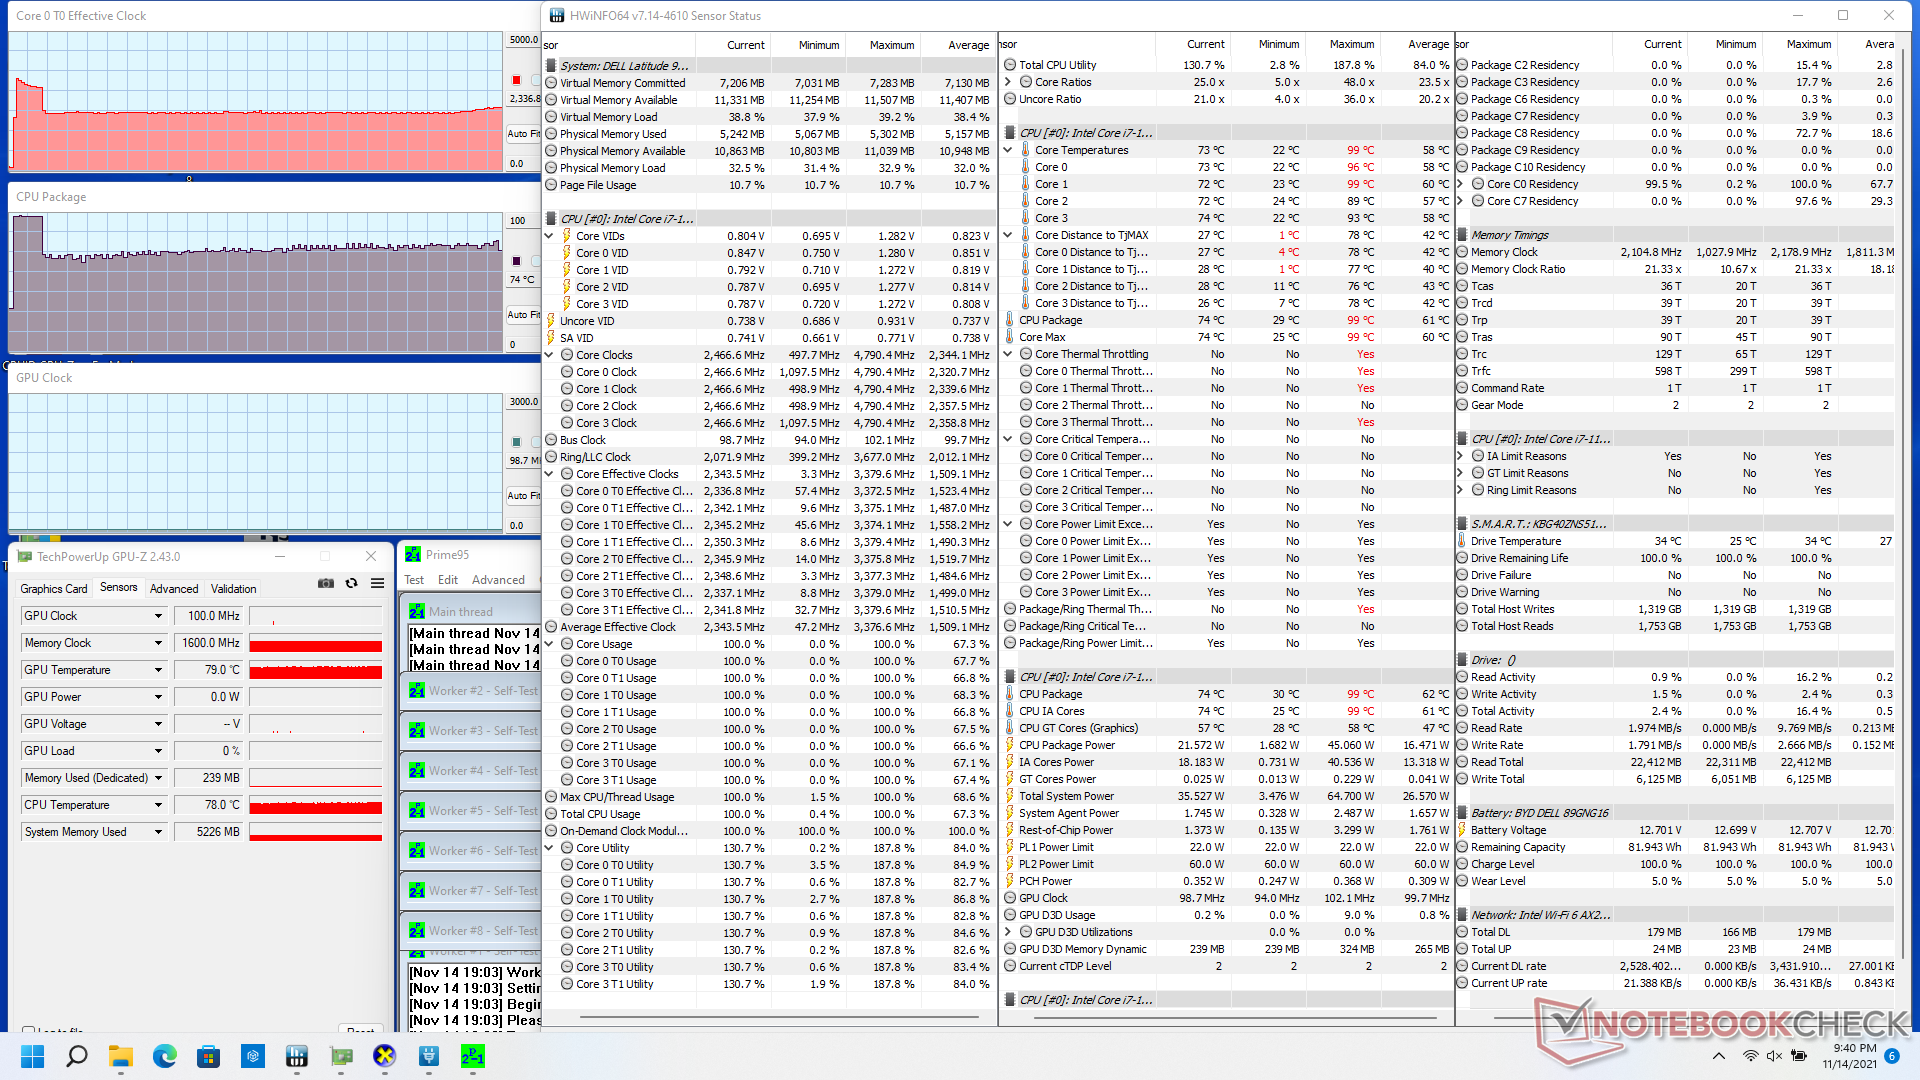
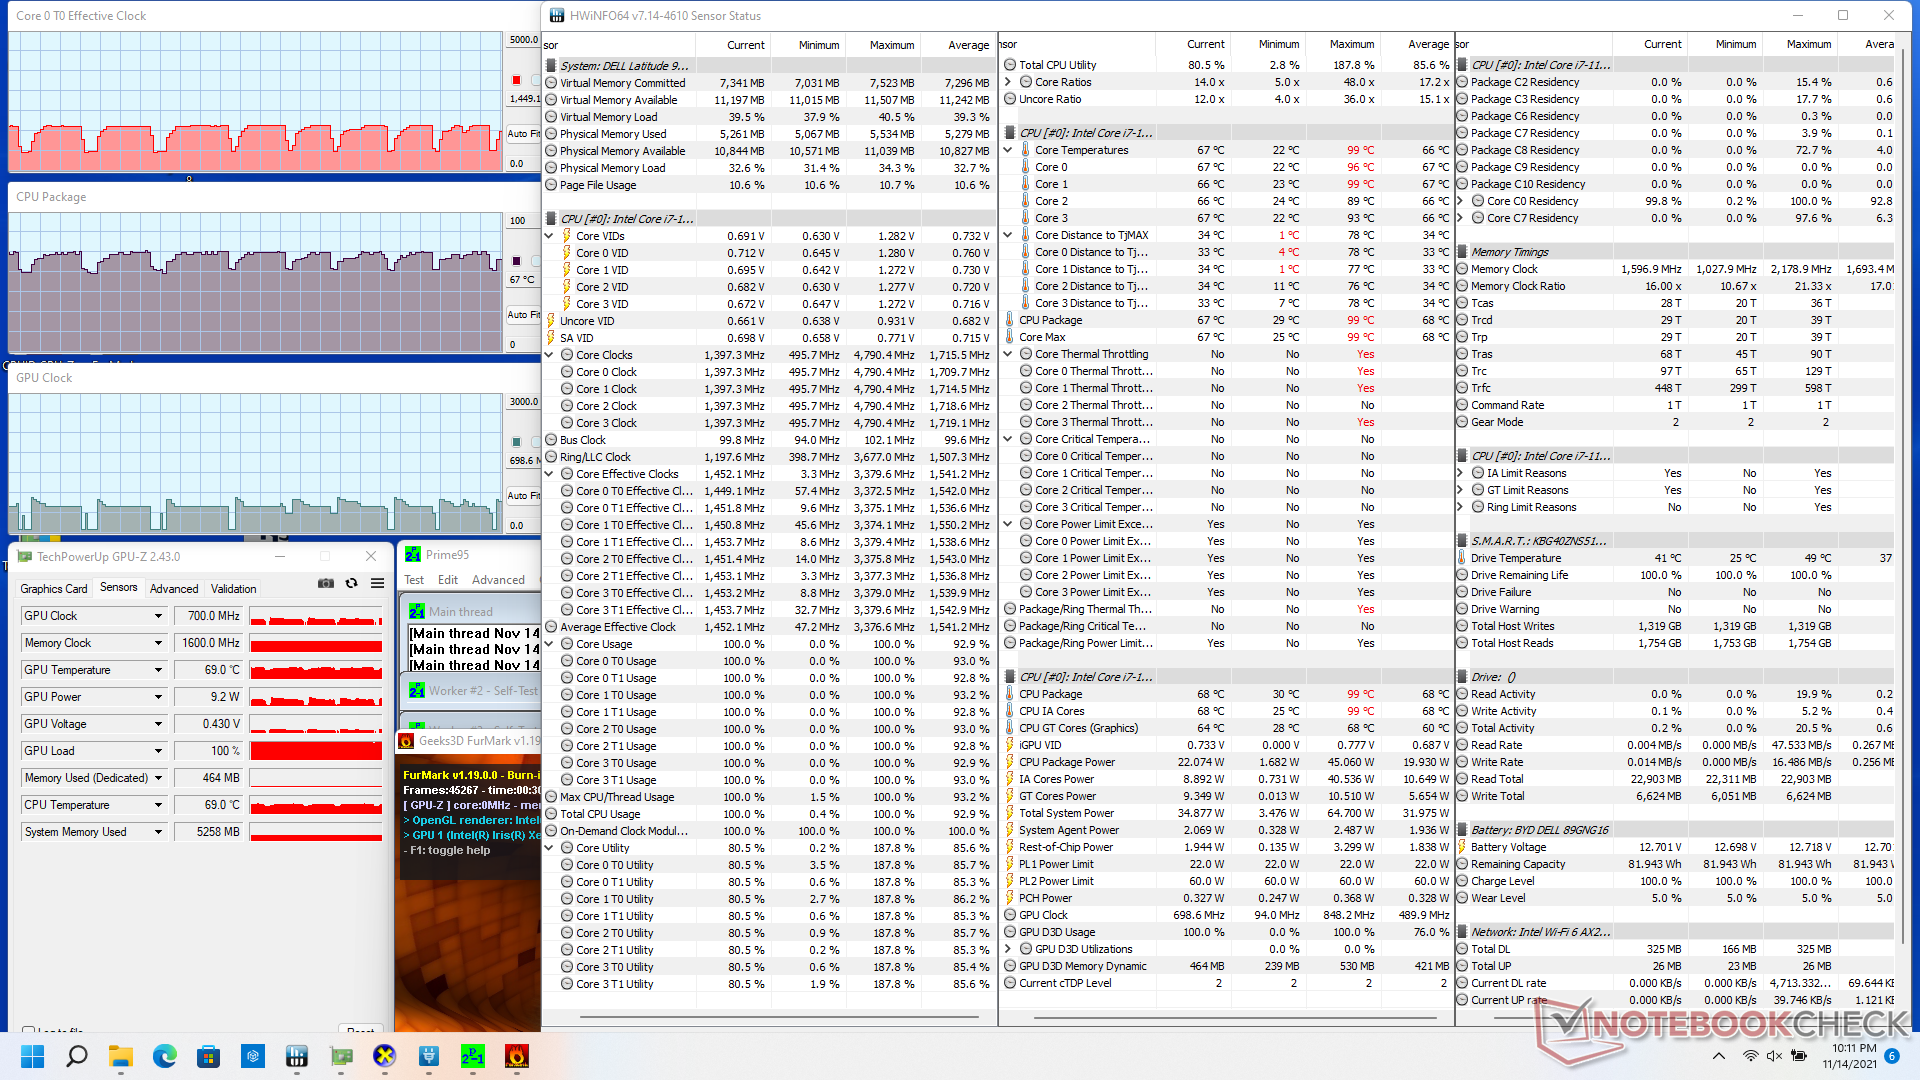
| CPU时钟(GHz) | GPU时钟(MHz) | CPU平均温度(℃) | |
| 系统空闲 | -- | -- | 30 |
| Prime95压力 | 2.2 | -- | 75 |
| Prime95 + FurMark压力 | 0.6 - 1.7 | 100 - 800 | 58 - 73 |
| Witcher 3 压力 | 0.5 - 1.3 | 500 - 1200 | 57 - 66 |
发言人
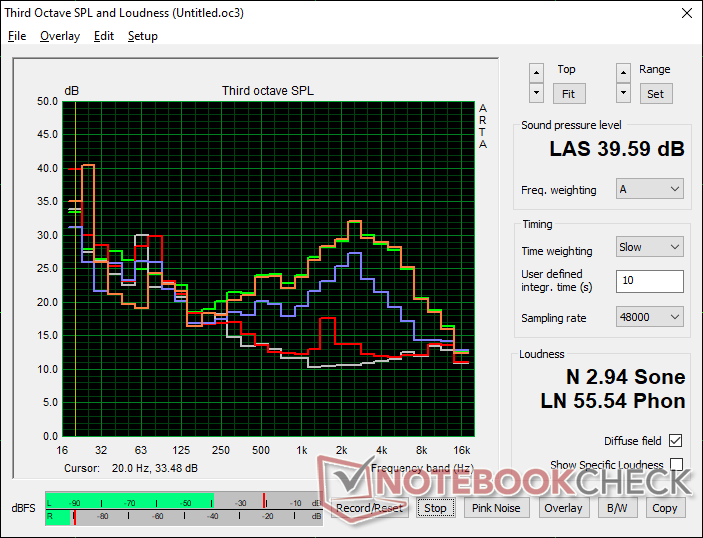
Dell Latitude 15 9520 2-in-1 audio analysis
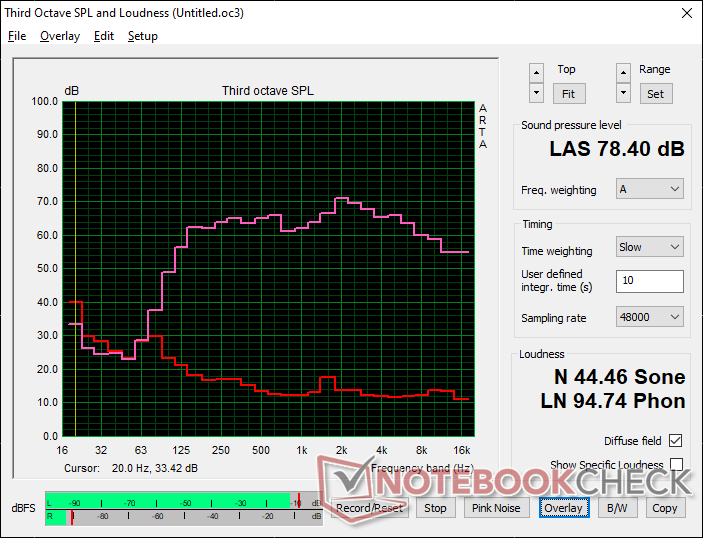
(±) | speaker loudness is average but good (78.4 dB)
Bass 100 - 315 Hz
(+) | good bass - only 4.4% away from median
(±) | linearity of bass is average (9.4% delta to prev. frequency)
Mids 400 - 2000 Hz
(+) | balanced mids - only 2.3% away from median
(+) | mids are linear (4.5% delta to prev. frequency)
Highs 2 - 16 kHz
(+) | balanced highs - only 3.3% away from median
(+) | highs are linear (3.9% delta to prev. frequency)
Overall 100 - 16.000 Hz
(+) | overall sound is linear (9.5% difference to median)
Compared to same class
» 1% of all tested devices in this class were better, 0% similar, 99% worse
» The best had a delta of 7%, average was 21%, worst was 53%
Compared to all devices tested
» 4% of all tested devices were better, 1% similar, 95% worse
» The best had a delta of 4%, average was 23%, worst was 134%
Apple MacBook 12 (Early 2016) 1.1 GHz audio analysis
(+) | speakers can play relatively loud (83.6 dB)
Bass 100 - 315 Hz
(±) | reduced bass - on average 11.3% lower than median
(±) | linearity of bass is average (14.2% delta to prev. frequency)
Mids 400 - 2000 Hz
(+) | balanced mids - only 2.4% away from median
(+) | mids are linear (5.5% delta to prev. frequency)
Highs 2 - 16 kHz
(+) | balanced highs - only 2% away from median
(+) | highs are linear (4.5% delta to prev. frequency)
Overall 100 - 16.000 Hz
(+) | overall sound is linear (10.2% difference to median)
Compared to same class
» 7% of all tested devices in this class were better, 2% similar, 90% worse
» The best had a delta of 5%, average was 18%, worst was 53%
Compared to all devices tested
» 5% of all tested devices were better, 1% similar, 94% worse
» The best had a delta of 4%, average was 23%, worst was 134%
能源管理
消耗功率
在我们的Latitude 9520 2-in-1上运行3DMark 06将只消耗44W,而在Latitude 9510 2-in-1上则消耗46W,尽管较新的型号上的图形性能有了巨大的提高。因此,用户在相同的功率包络下获得了平均3倍的GPU性能提升。每瓦特性能的逐年增长是不可低估的。
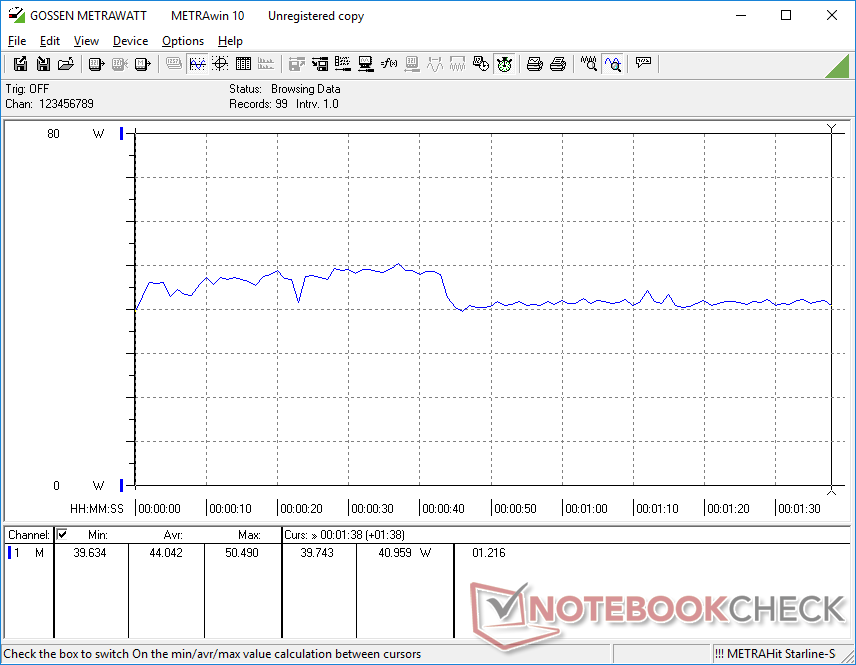
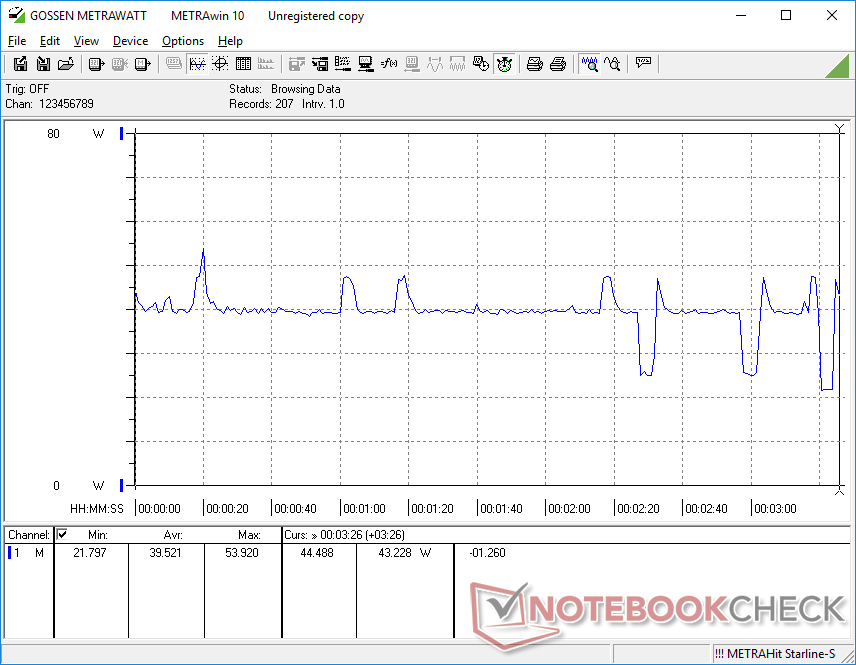
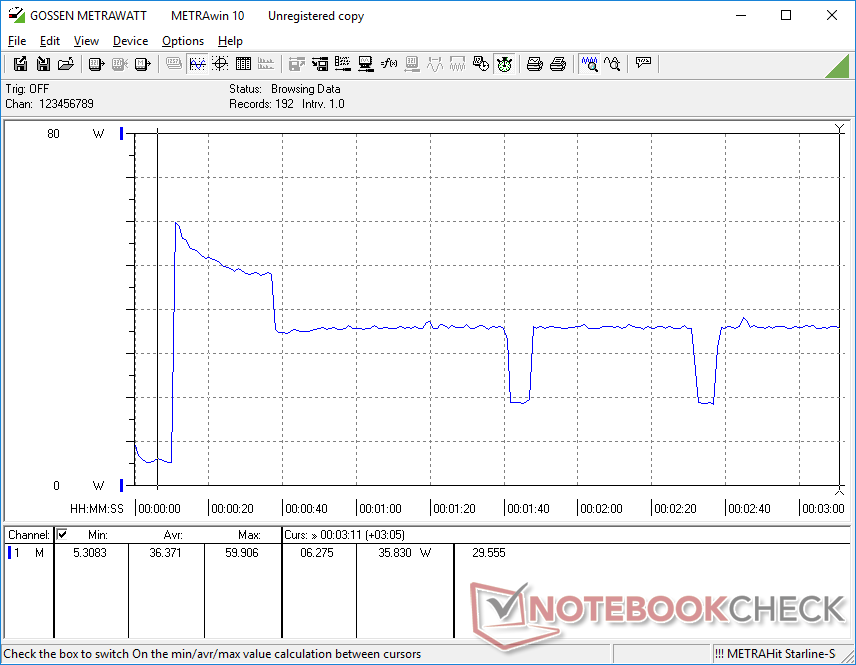
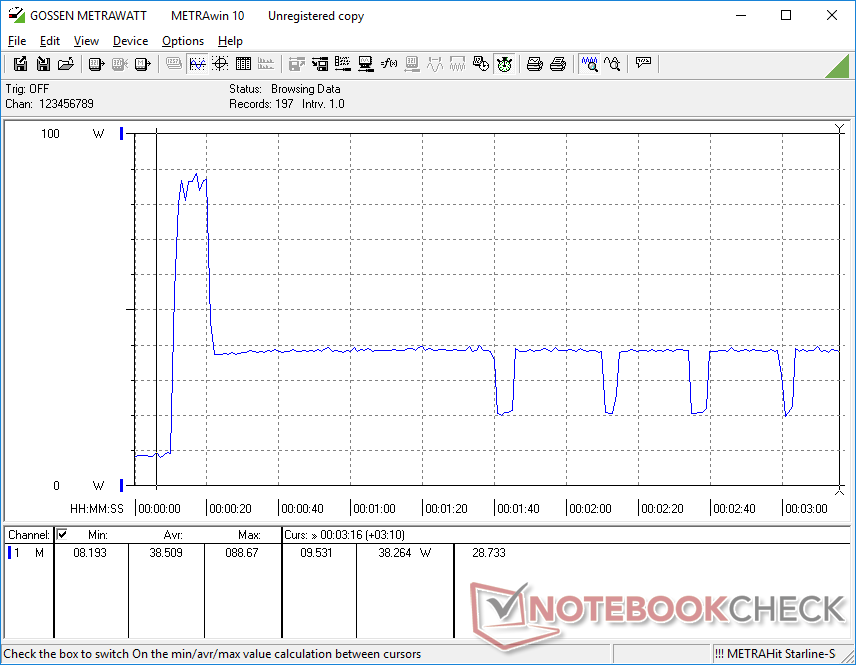
不幸的是,上面提到的不稳定的GPU性能反映在不稳定的功耗率上,正如我们下面的图表所示。当运行 Witcher 3代表游戏负载时,功耗将在21瓦至40瓦之间,而在惠普EliteBook 850 G8上则稳定在仅34瓦。 HP EliteBook 850 G8配备了类似的酷睿i7-1165G7 CPU。
我们能够从小型(约13 x 6.6 x 2.3厘米)的90瓦交流适配器上记录到88.7瓦的最大消耗。由于散热限制,该系统无法保持这一速率超过几秒钟。
| Off / Standby | |
| Idle | |
| Load |
|
Key:
min: | |
| Dell Latitude 15 9520 2-in-1 i7-1185G7, Iris Xe G7 96EUs, Toshiba KBG40ZNS512G NVMe, IPS, 1920x1080, 15" | Dell Latitude 9510 2-in-1 i7-10810U, UHD Graphics 620, Toshiba KBG40ZNS512G NVMe, IPS, 1920x1080, 15" | HP EliteBook 850 G8 3C7Z8EA i7-1165G7, Iris Xe G7 96EUs, Samsung PM981a MZVLB1T0HBLR, I, 1920x1080, 15.6" | Lenovo ThinkPad L15 G2 AMD R5 5600U, Vega 7, SK Hynix HFS512 GDE9X081N, IPS LED, 1920x1080, 15.6" | MSI Summit B15 A11M i7-1165G7, Iris Xe G7 96EUs, Kingston OM8PCP31024F, IPS, 1920x1080, 15.6" | Microsoft Surface Laptop 4 15 AMD TFF_00028 R7 4980U, Vega 8, SK Hynix BC511 HFM512GDJTNI, IPS, 2496x1664, 15" | |
|---|---|---|---|---|---|---|
| Power Consumption | 8% | -27% | -14% | -15% | -14% | |
| Idle Minimum * (Watt) | 2.6 | 2.1 19% | 5.8 -123% | 4.57 -76% | 4.2 -62% | 3.6 -38% |
| Idle Average * (Watt) | 5 | 4.6 8% | 8.4 -68% | 8.2 -64% | 7.7 -54% | 6.5 -30% |
| Idle Maximum * (Watt) | 7.1 | 5.3 25% | 9.9 -39% | 9.3 -31% | 8.4 -18% | 8.9 -25% |
| Load Average * (Watt) | 44 | 45.8 -4% | 33 25% | 31.9 27% | 37.8 14% | 46.5 -6% |
| Witcher 3 ultra * (Watt) | 39.5 | 34.3 13% | 34.5 13% | 36.6 7% | 43.4 -10% | |
| Load Maximum * (Watt) | 88.7 | 96.3 -9% | 60 32% | 47.4 47% | 67.5 24% | 64.9 27% |
* ... smaller is better
Power Consumption Witcher 3 / Stresstest
电池寿命
运行时间比我们在去年的模型上记录的时间短了几个小时,尽管它们之间有相同的88Wh电池。即便如此,14个多小时的实际WLAN使用时间仍然没有什么可嘲笑的,而且远远高于这个尺寸类别的平均水平。
戴尔为那些不介意为更轻的设备牺牲电池寿命的用户提供了配备46Wh电池的SKU。
| Dell Latitude 15 9520 2-in-1 i7-1185G7, Iris Xe G7 96EUs, 88 Wh | Dell Latitude 9510 2-in-1 i7-10810U, UHD Graphics 620, 88 Wh | HP EliteBook 850 G8 3C7Z8EA i7-1165G7, Iris Xe G7 96EUs, 56 Wh | Lenovo ThinkPad L15 G2 AMD R5 5600U, Vega 7, 45 Wh | MSI Summit B15 A11M i7-1165G7, Iris Xe G7 96EUs, 52 Wh | Microsoft Surface Laptop 4 15 AMD TFF_00028 R7 4980U, Vega 8, 47.4 Wh | |
|---|---|---|---|---|---|---|
| Battery runtime | 26% | -43% | -47% | -55% | -30% | |
| WiFi v1.3 (h) | 14.8 | 18.7 26% | 8.5 -43% | 7.8 -47% | 6.6 -55% | 10.4 -30% |
| Reader / Idle (h) | 59 | 18.4 | ||||
| Load (h) | 4 | 2.3 | 1 | 2.5 | ||
| H.264 (h) | 6.6 | 14.8 |
Pros
Cons
判决书

Latitude 9520二合一在纸张上比Latitude 9510二合一有明显的性能优势。旧的UHD Graphics 620已经被淘汰了,因为Iris Xe越来越普遍。然而,在实践中,有一些潜在买家不应该忽视的注意事项。
首先,新的Latitude 中的Iris Xe GPU以循环的时钟频率运行,导致游戏时帧率循环,或运行GPU密集型任务时性能不稳定。帧率会以这样的极端方式循环,一些对稳定帧率至关重要的应用几乎无法播放。如果需要更稳定和更可靠的GPU性能,我们建议关注其他Tiger Lake-U笔记本电脑,如微星Summit E13 Flip 或HP EliteBook 840 Aero G8 。
与9510二合一产品相比,Latitude 9520二合一产品的主要卖点是其明显更快的集成图形性能。然而,较新机型上异常不稳定的图形性能可能会让许多感兴趣的买家感到失望。
其次,与Latitude 9510 2合1上的老式Core i7-10810U相比,我们的Core i7-1185G7 CPU的多线程性能较慢。尽管这一缺点并不是戴尔电脑所独有的,但Latitude 9520二合一中的i7-1185G7的运行速度比许多其他采用相同处理器的笔记本电脑慢。因此,多线程性能的不足在戴尔上被放大了。
选择Latitude 9520二合一而不是9510二合一的理由比我们希望的要小,特别是较新的机型在显示质量、网络摄像头质量或电池寿命方面没有提供新的东西。希望不均衡的GPU性能可以通过未来的更新得到解决。
价格和可用性
大多数主要零售商,如 亚马逊, 沃尔玛, 和Newegg 有Latitude 9520二合一的各种配置的库存。用户还可以直接从戴尔购买https://www.dell.com/en-us/work/shop/2-in-1-laptops-tablets/latitude-9520-laptop-or-2-in-1/spd/latitude-15-9520-2-in-1-laptop/s008l952015us#carousel-example-with-caption起价为2800美元的Core i5版本。
Dell Latitude 15 9520 2-in-1
- 11/22/2021 v7 (old)
Allen Ngo
Price comparison

