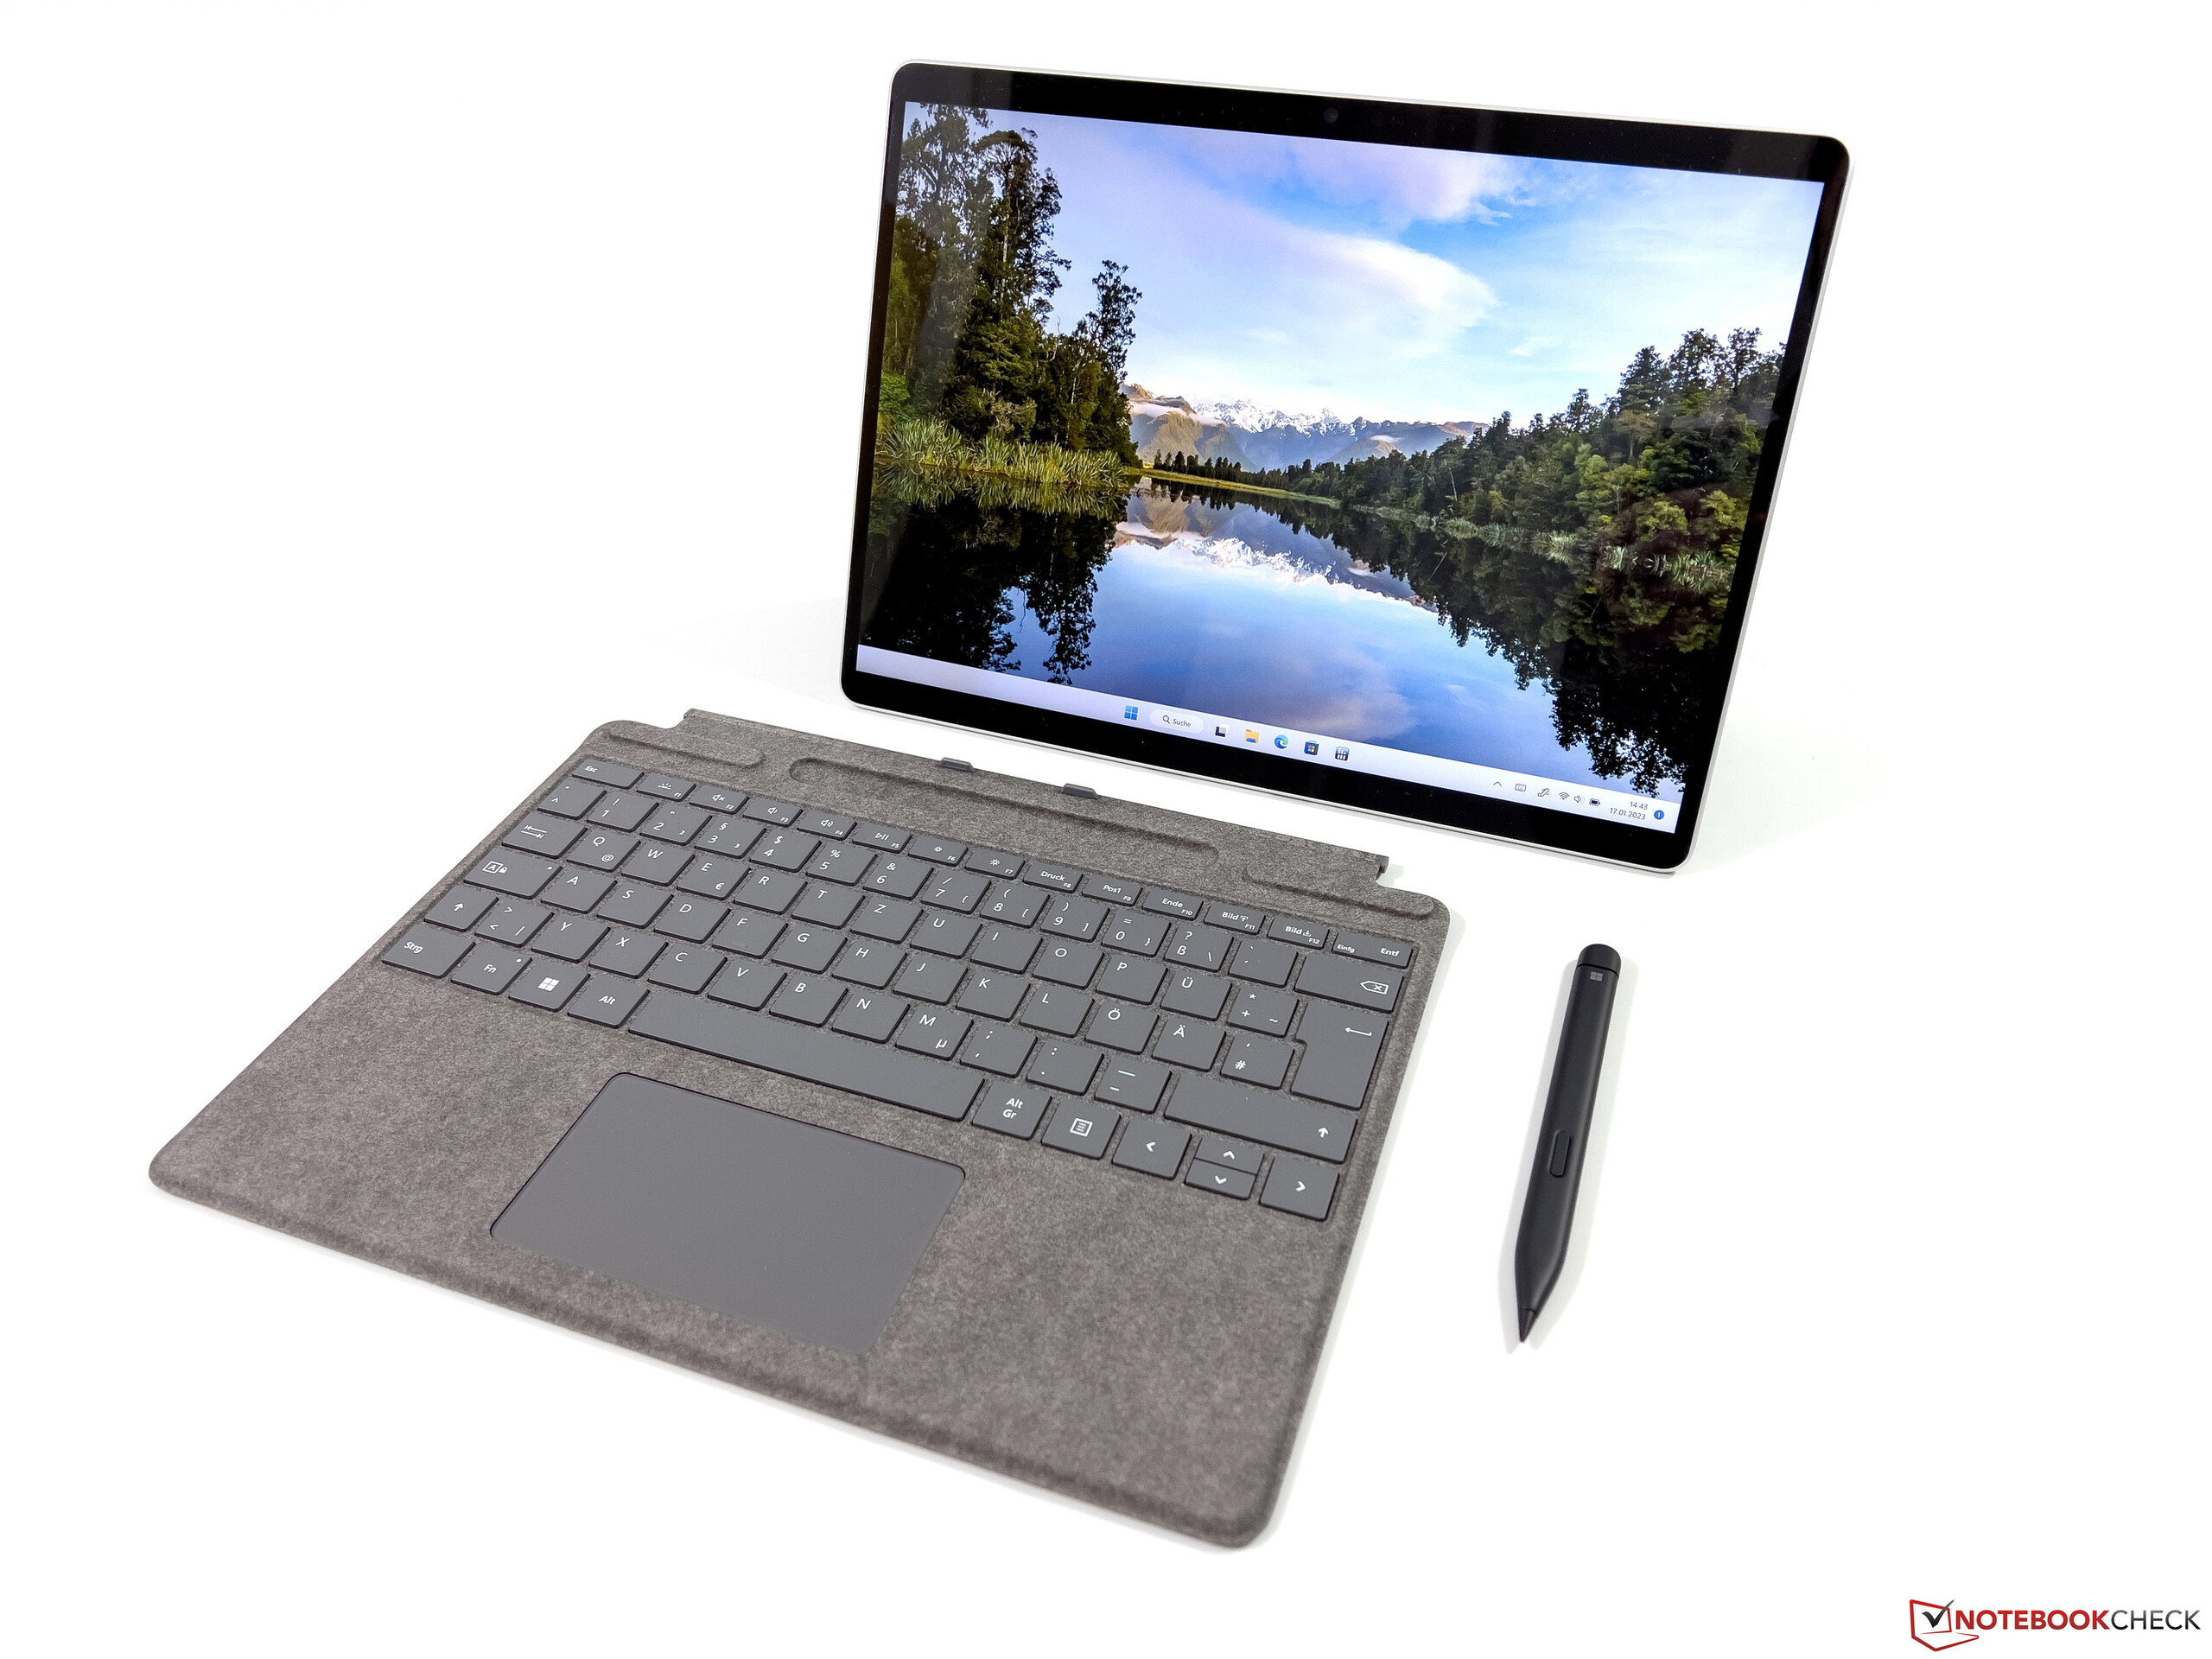
微软Surface Pro 9回顾。可折叠式的,现在有了明显更多的CPU功率

微软对其Surface产品做了一些改变,之前的Surface Pro X ARM平板电脑不再是独立的产品,今后将以Surface Pro 9的名义继续销售。这意味着Surface Pro 9现在有两个变种,即一个配备普通英特尔处理器(989,00美元起),另一个配备ARM芯片(1357,12美元),还支持5G连接。我们还将很快对配备微软SQ3 Adreno 8CX Gen3的新ARM变体进行评测,但配备Alder Lake-U处理器的Surface Pro 9是我们今天的第一个测试对象。
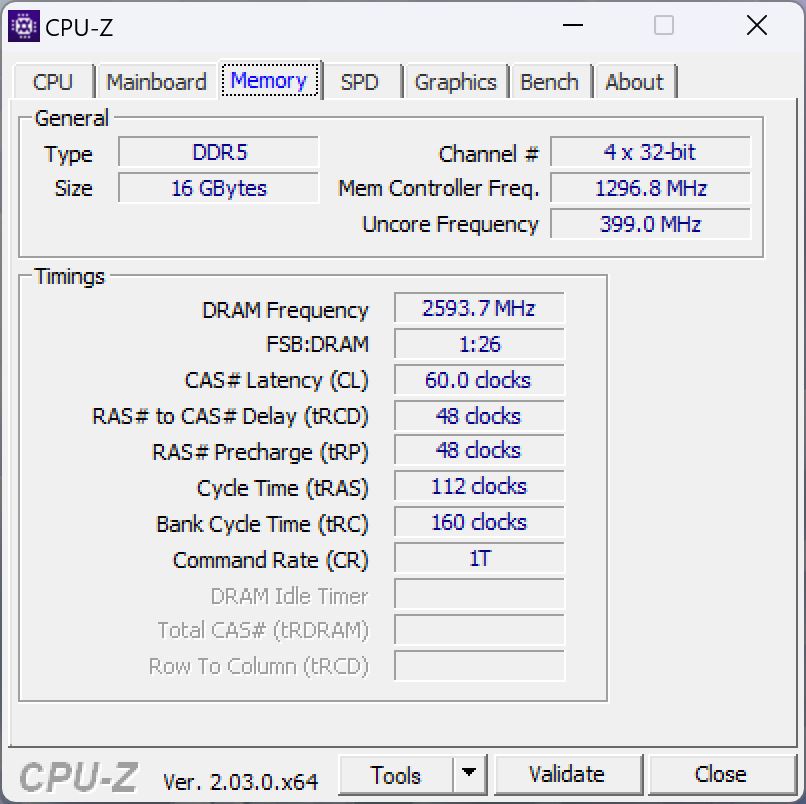
我们的审查样本是顶级CPU变体,配有Core i7 1255U,16GB内存和512GB PCI-SSD。在这种配置下,这台敞篷车的价格为1.879,99美元,尽管你必须考虑到另外300美元的签名键盘和Surface Slim Pen 2。一些在线零售商(取决于你的位置)可能会以更便宜的价格提供这种捆绑服务--例如,我们的捆绑服务可从2130欧元(约2320美元)起。另一个变化涉及Surface Pro 9的商务版,在英特尔版本中也不再提供WWAN模块。
除了新的Alder Lake处理器、更新的WLAN模块和取消音频插孔之外,Surface Pro本身和输入设备都没有重大技术变化。更多信息,我们可以参考我们对以前的Surface Pro型号的评论。
潜在的竞争对手比较
Rating | Date | Model | Weight | Height | Size | Resolution | Price |
|---|---|---|---|---|---|---|---|
| 88.4 % v7 (old) | 01 / 2023 | Microsoft Surface Pro 9, i7-1255U i7-1255U, Iris Xe G7 96EUs | 877 g | 9.3 mm | 13.00" | 2880x1920 | |
| 90.1 % v7 (old) | 11 / 2022 | Dell XPS 13 9315 2-in-1 Core i5-1230U i5-1230U, Iris Xe G7 80EUs | 764 g | 7.4 mm | 13.00" | 2880x1920 | |
| 88.5 % v7 (old) | 04 / 2021 | Lenovo ThinkPad X12 20UVS03G00 i7-1160G7, Iris Xe G7 96EUs | 1.1 kg | 14.5 mm | 12.30" | 1920x1280 | |
| 90.3 % v7 (old) | 12 / 2022 | HP Elite Dragonfly Folio 13.5 G3 i7-1265U, Iris Xe G7 96EUs | 1.4 kg | 17.8 mm | 13.50" | 1920x1280 | |
| 91.8 % v7 (old) | 11 / 2022 | Apple iPad Pro 12.9 2022 M2, M2 10-Core GPU | 682 g | 6.4 mm | 12.90" | 2732x2048 | |
| 86.8 % v7 (old) | 03 / 2022 | Asus ROG Flow Z13 GZ301ZE i9-12900H, GeForce RTX 3050 Ti Laptop GPU | 1.2 kg | 12 mm | 13.40" | 1920x1200 |
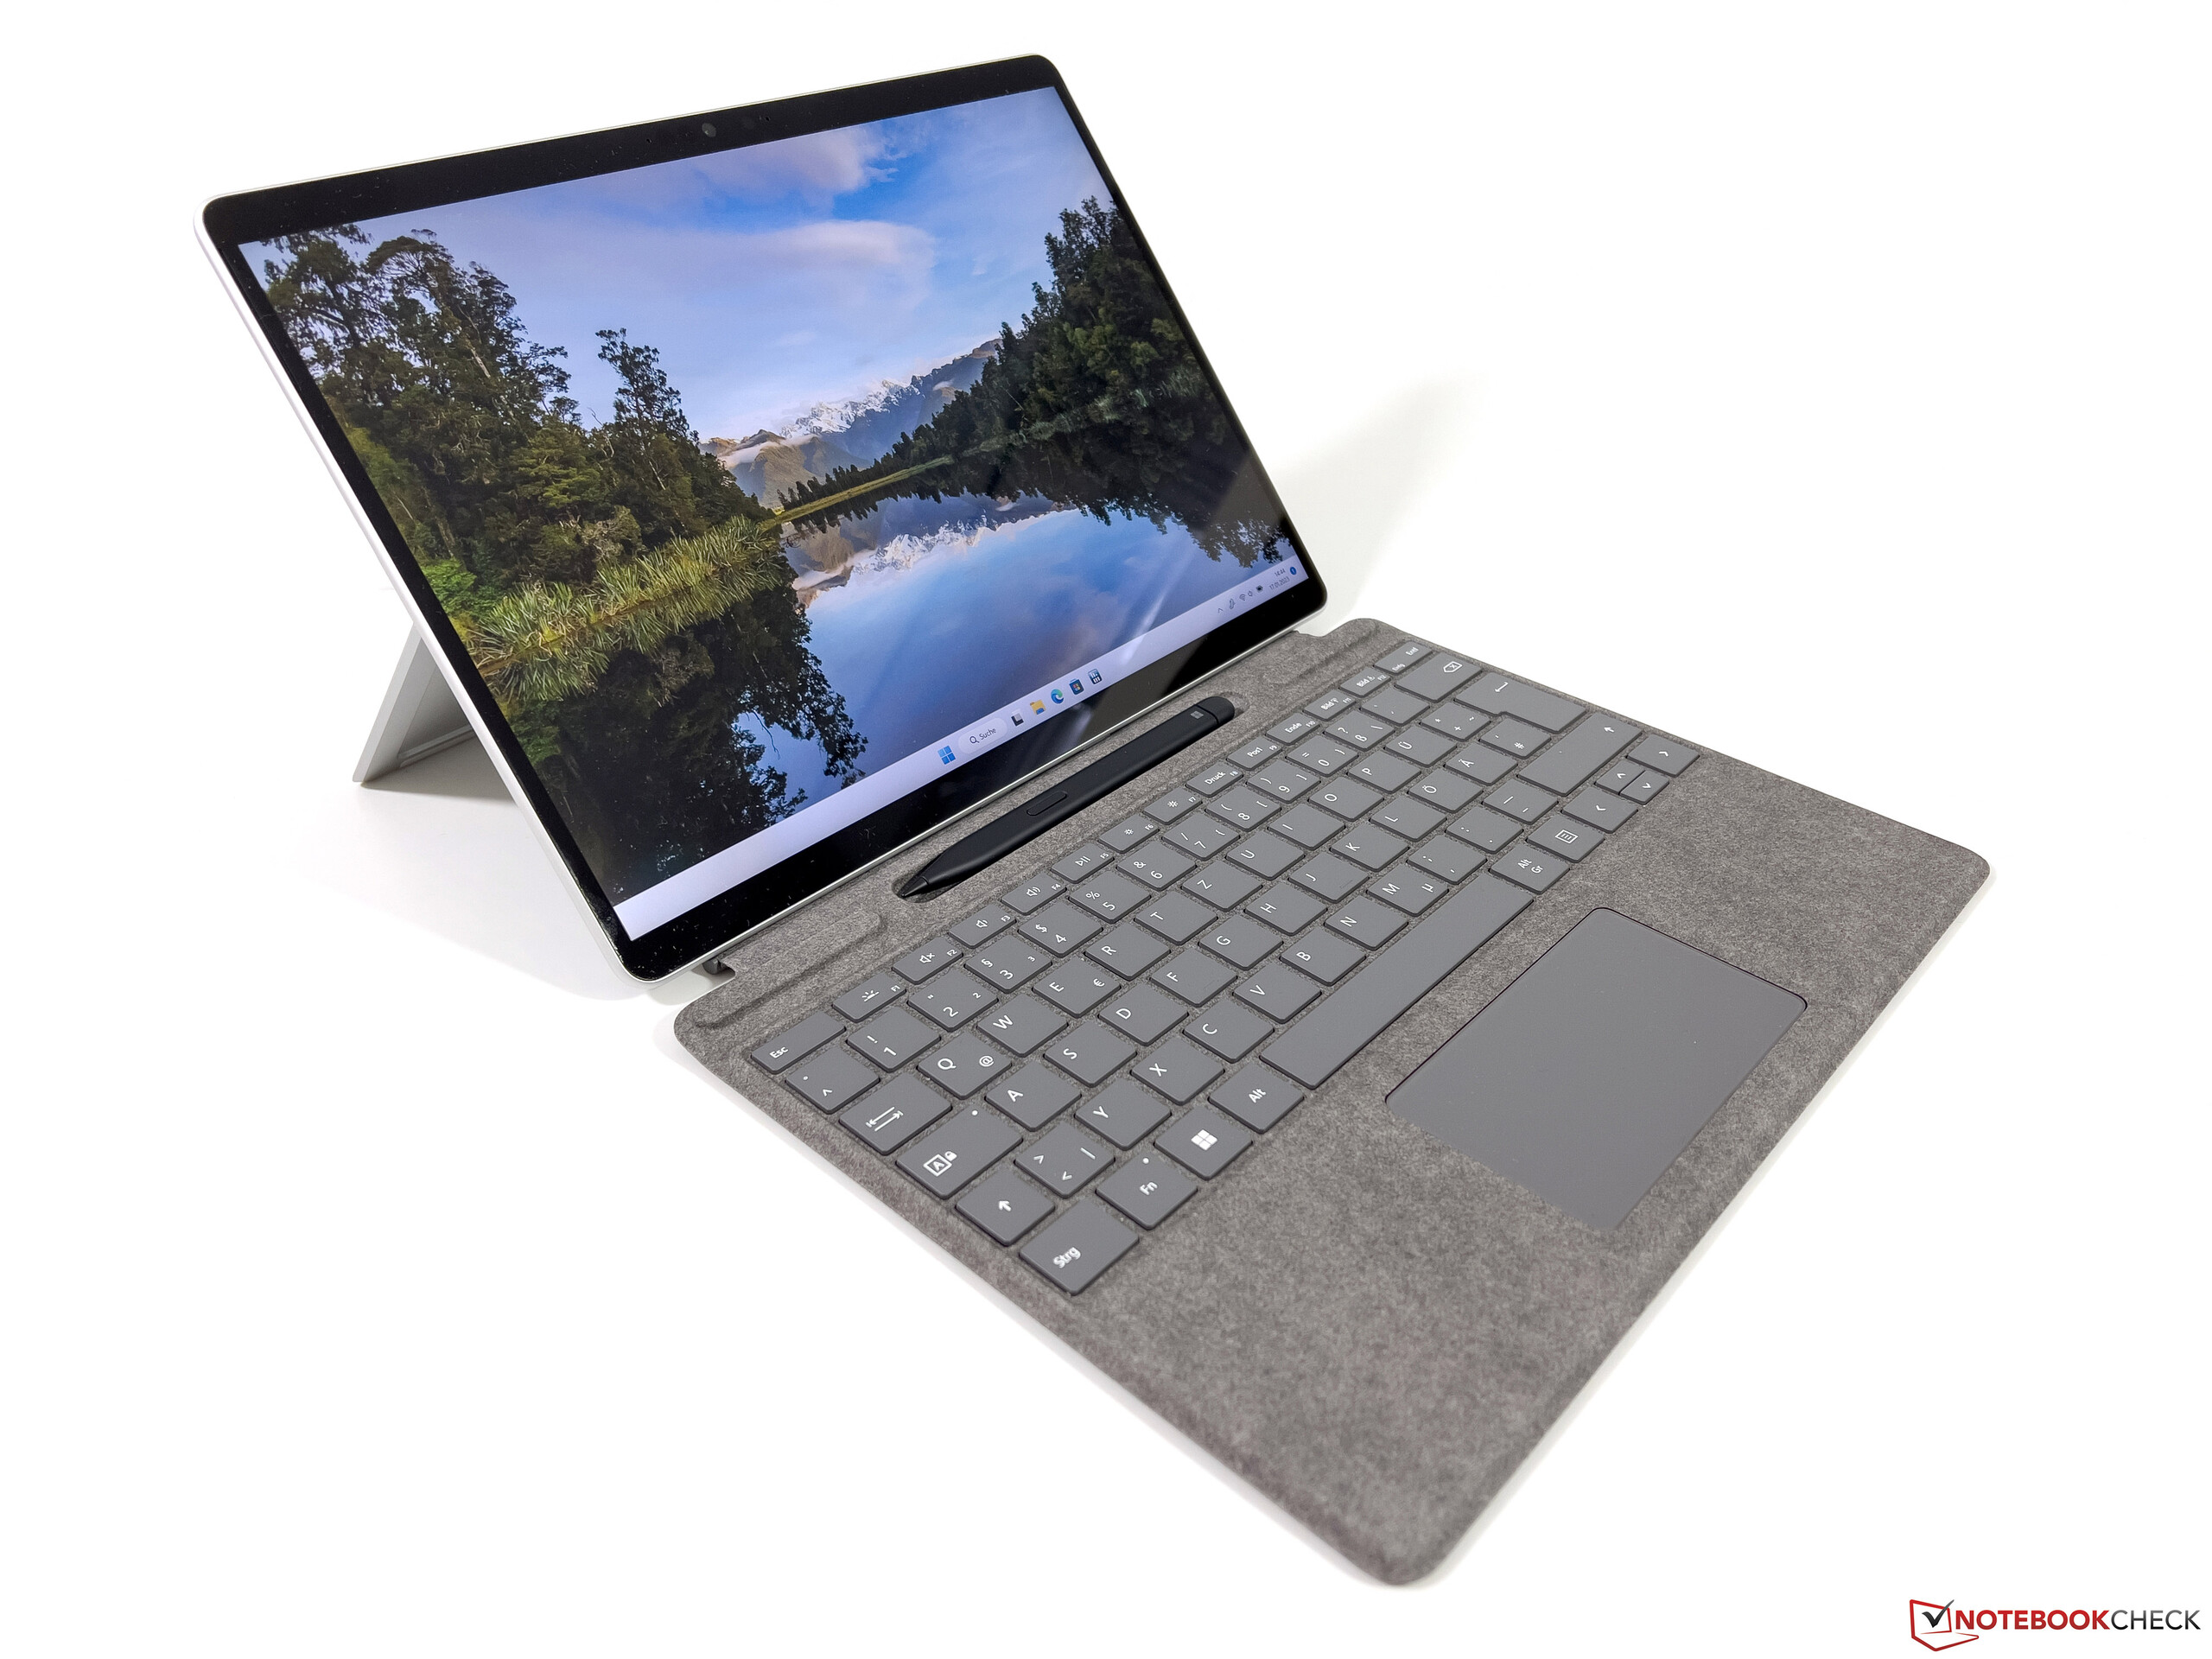
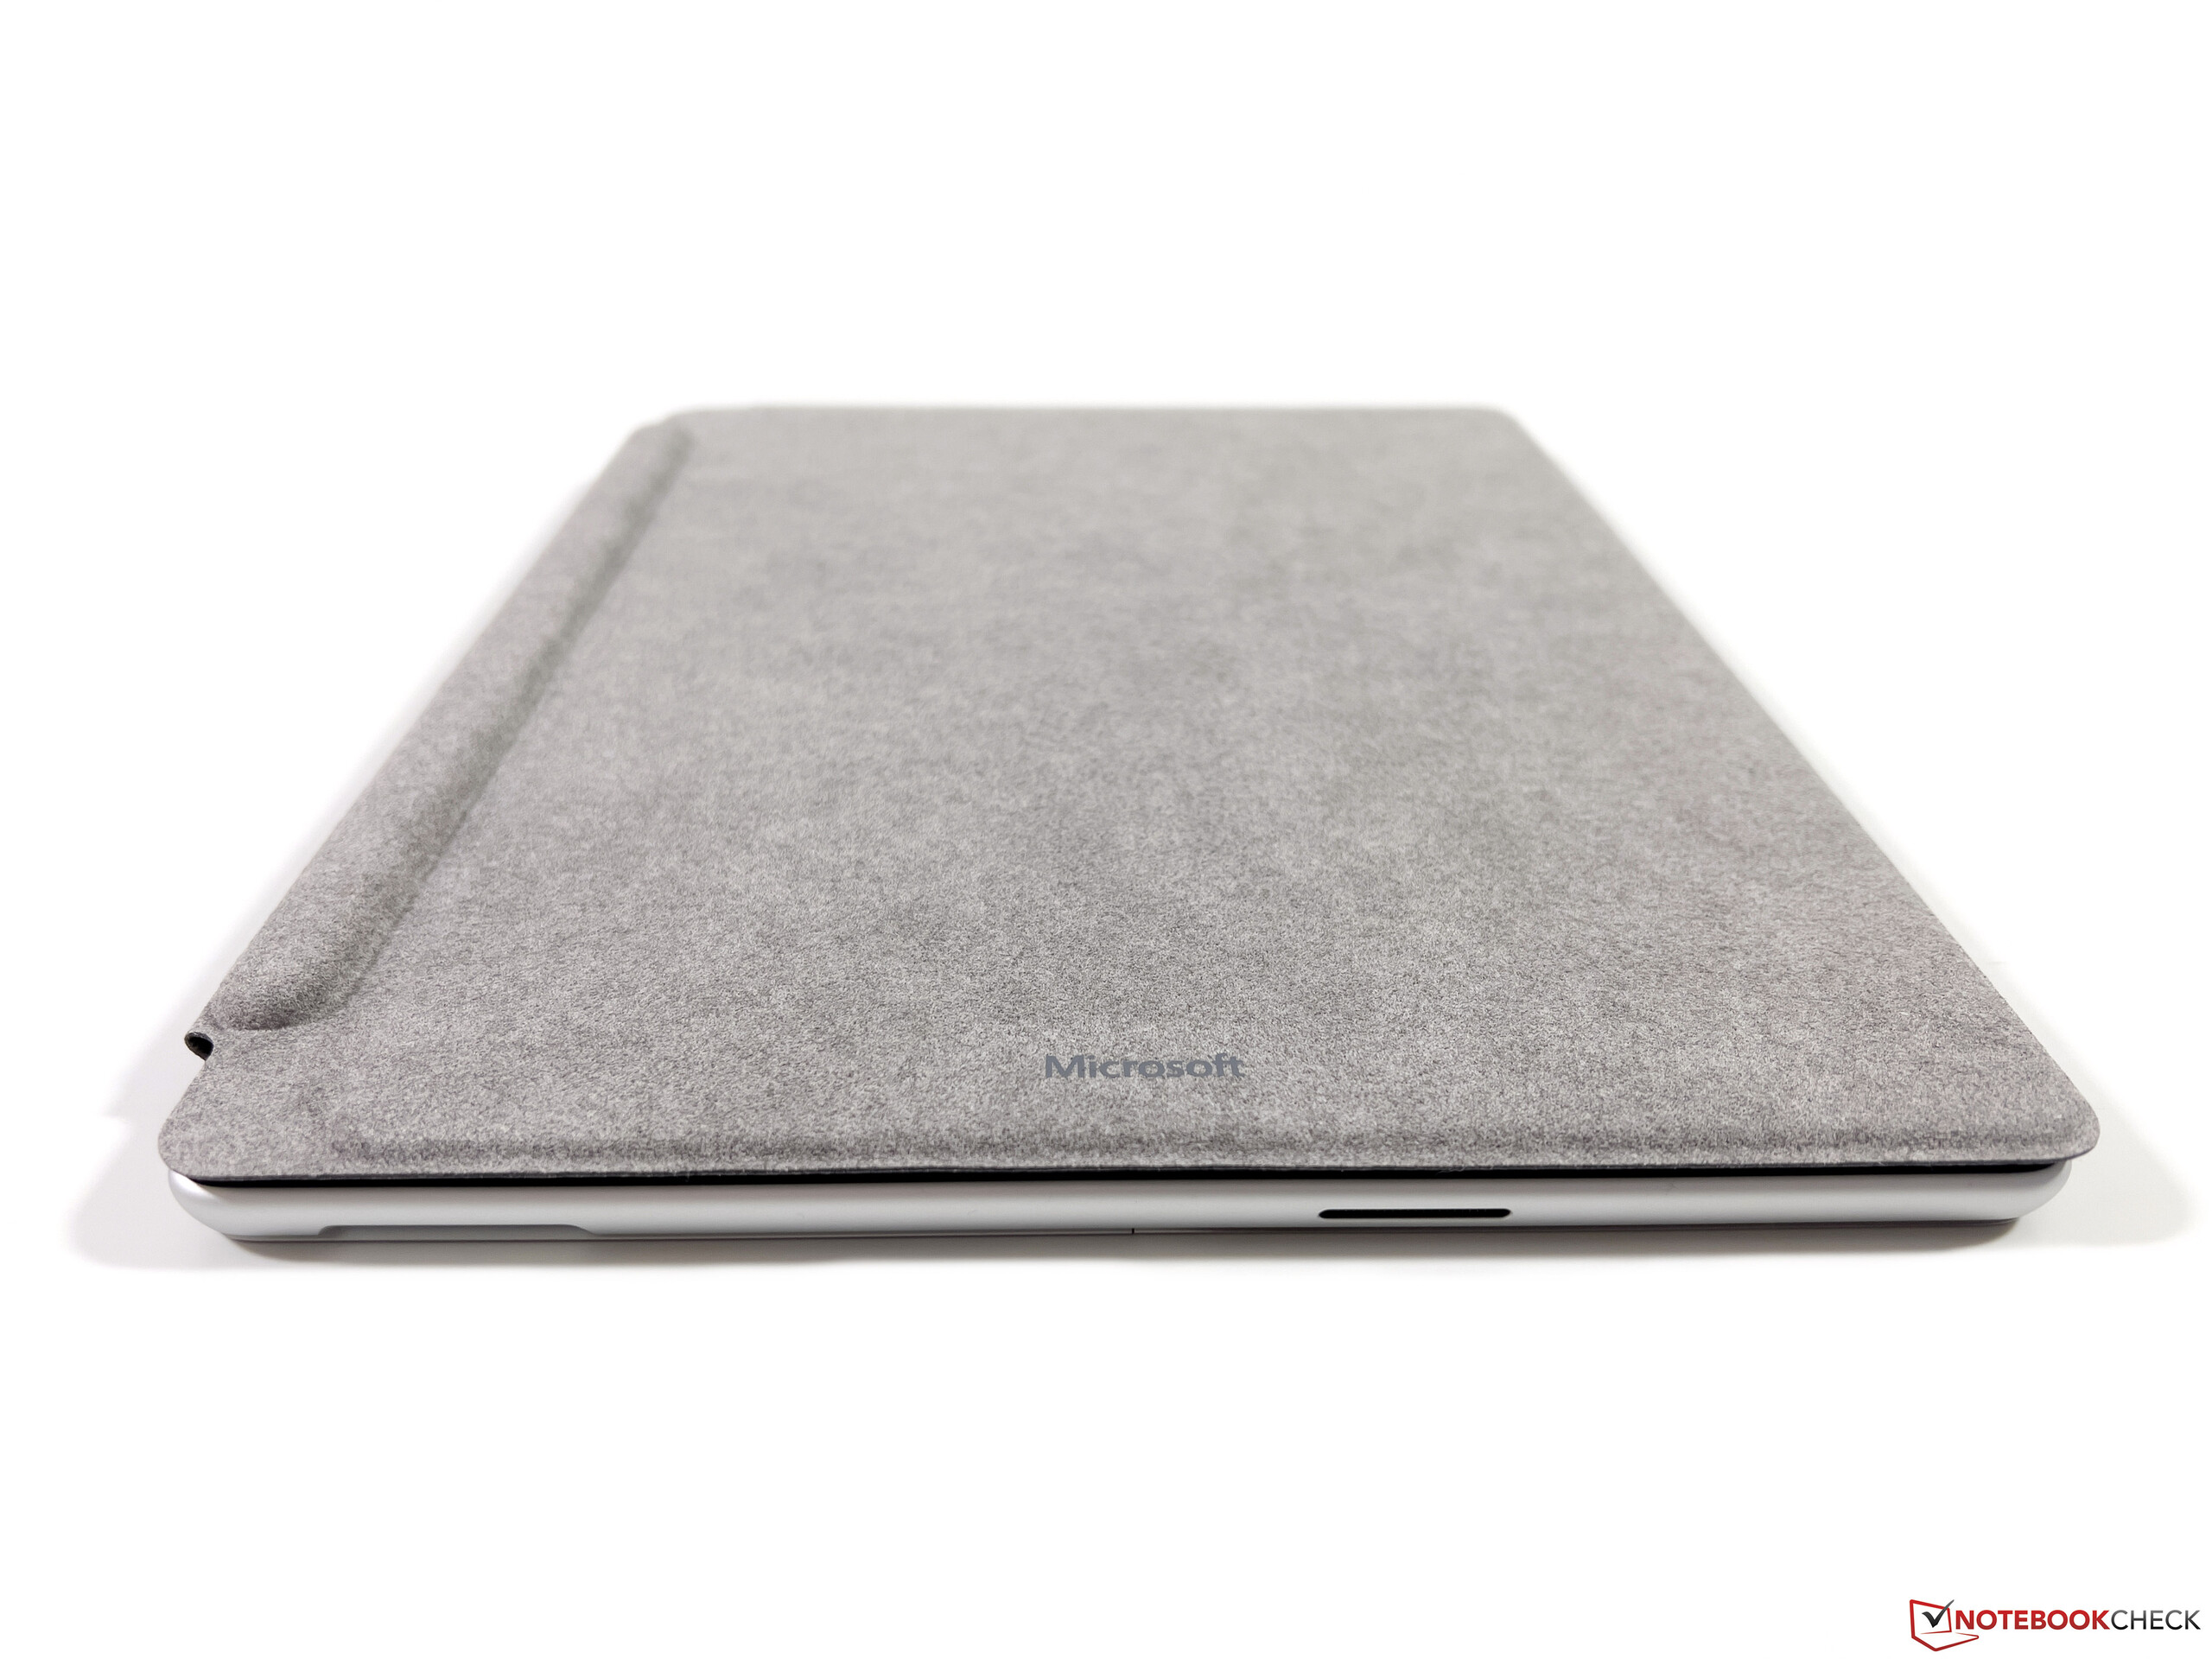
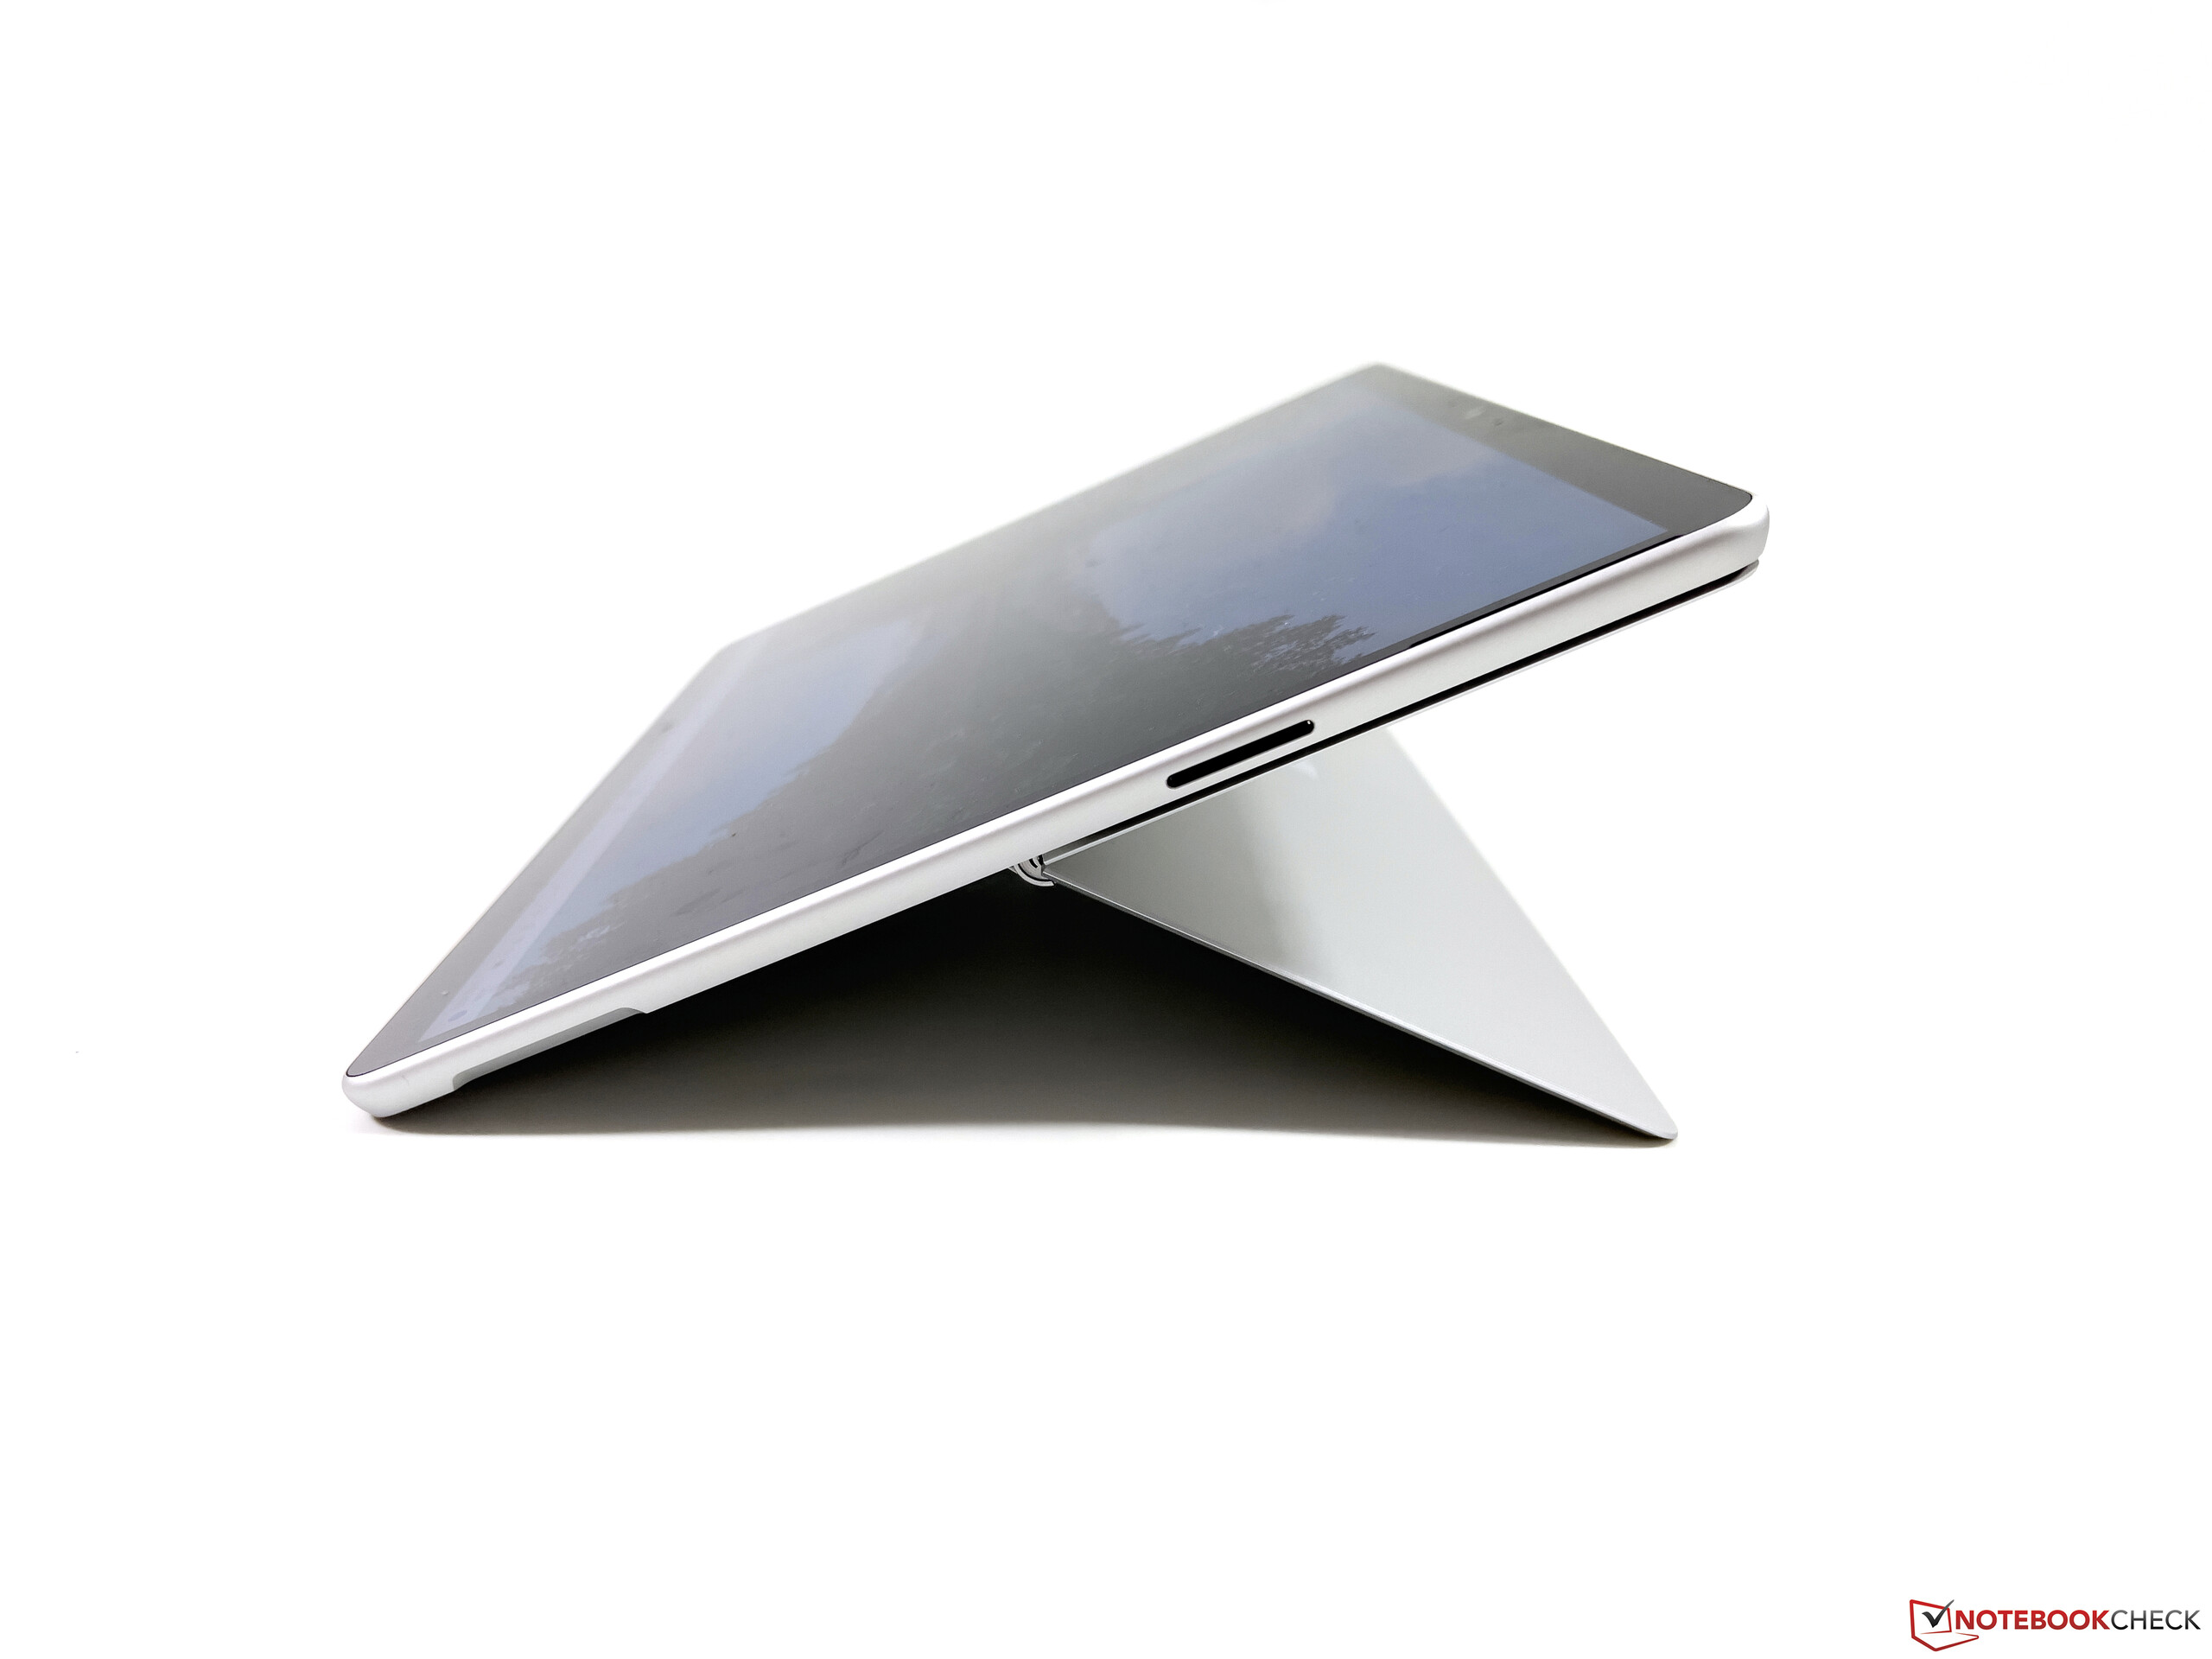
案例--对敞篷车的微小改动
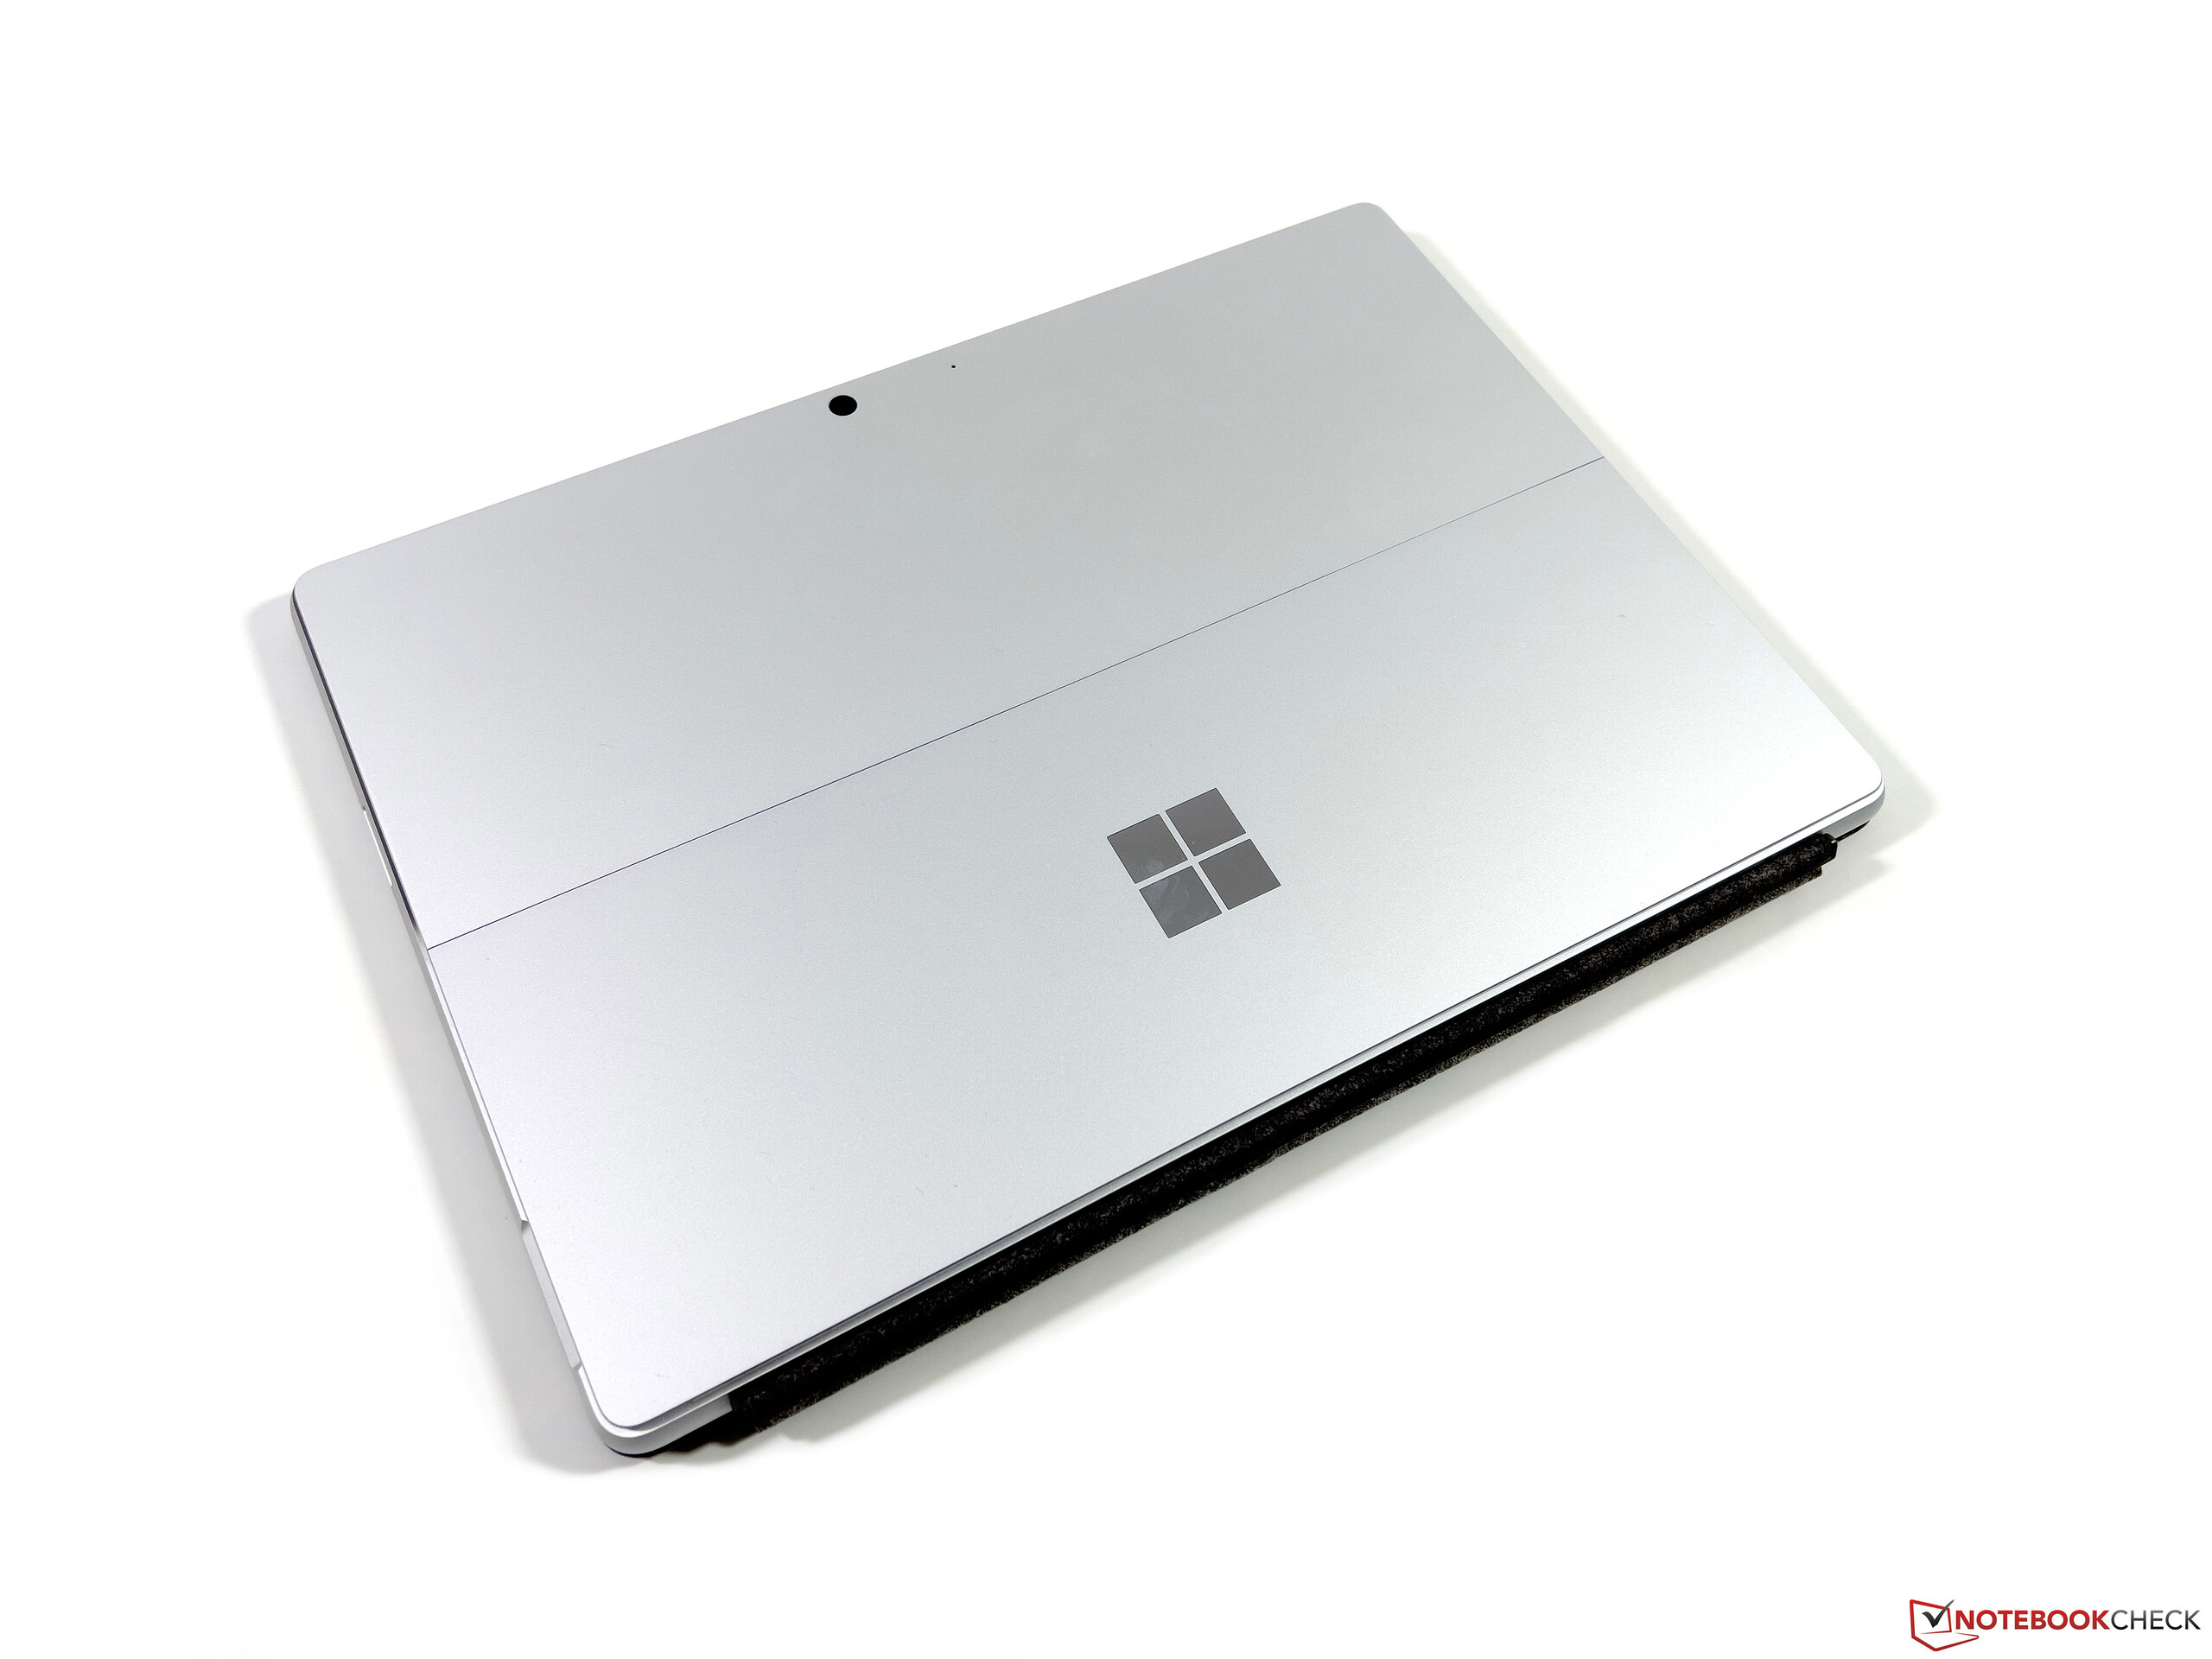
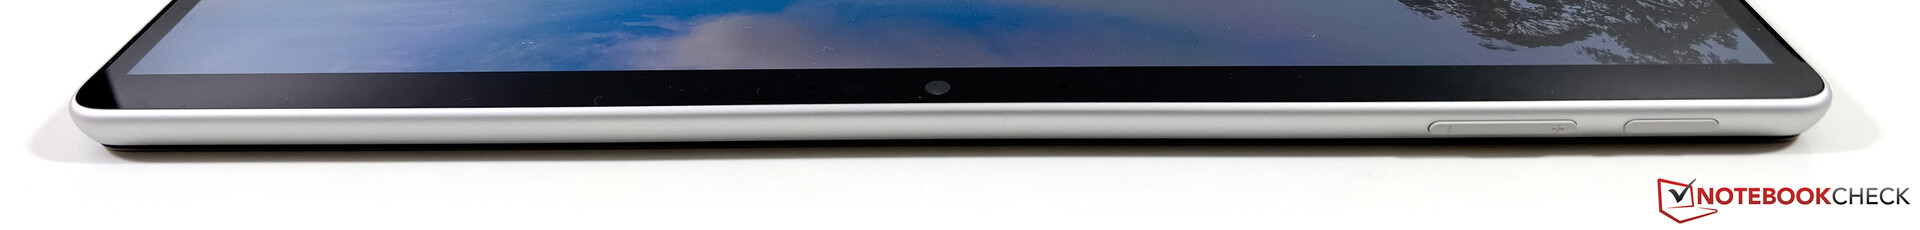
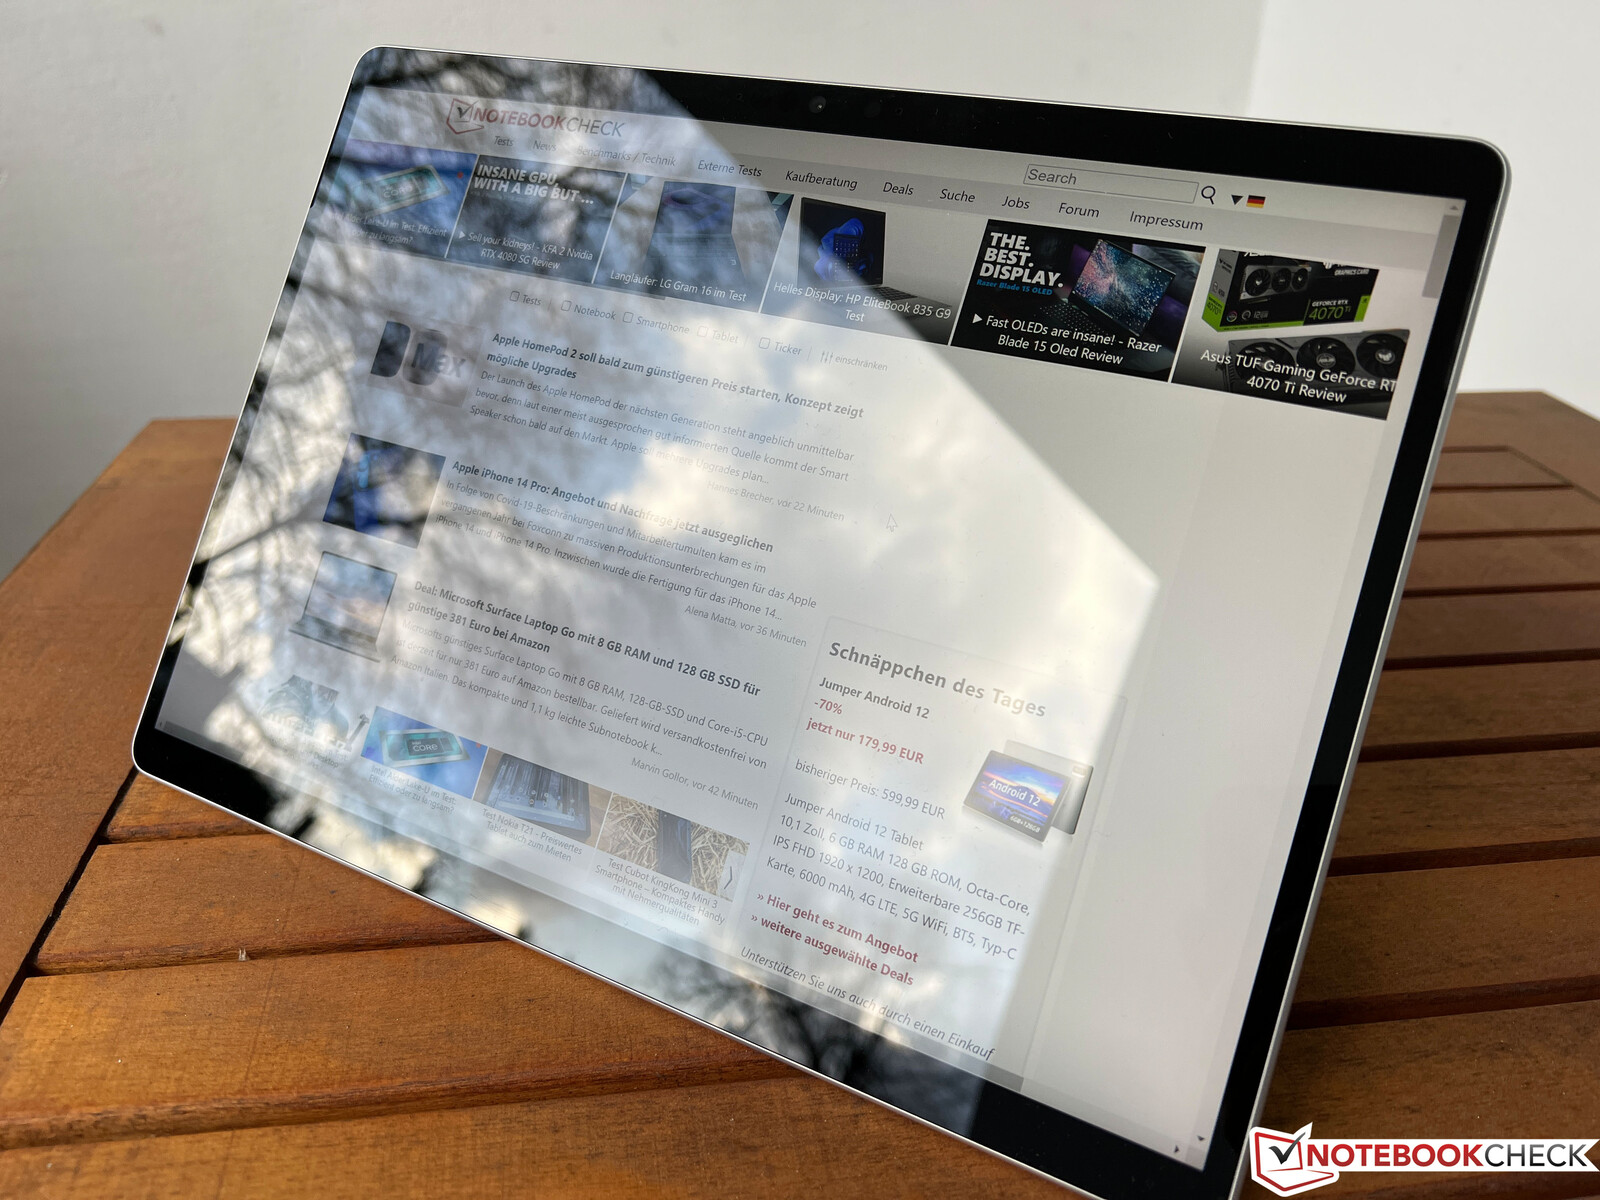
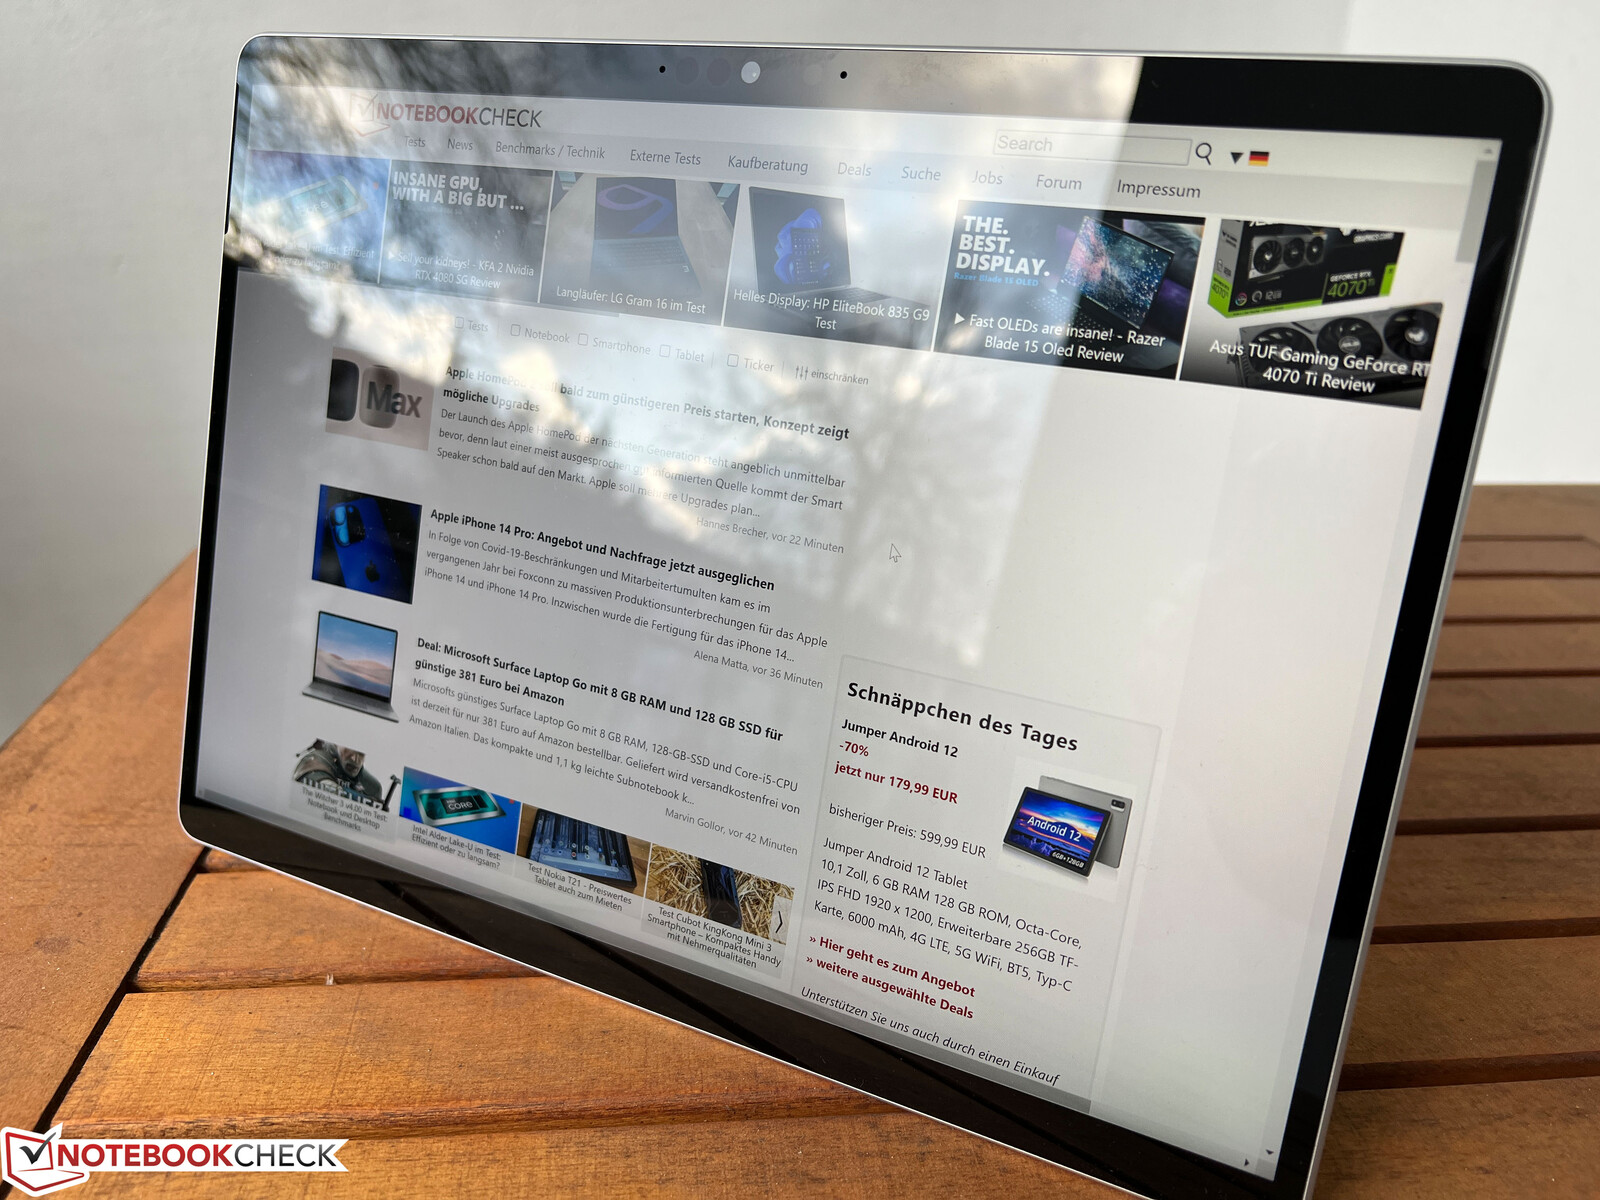
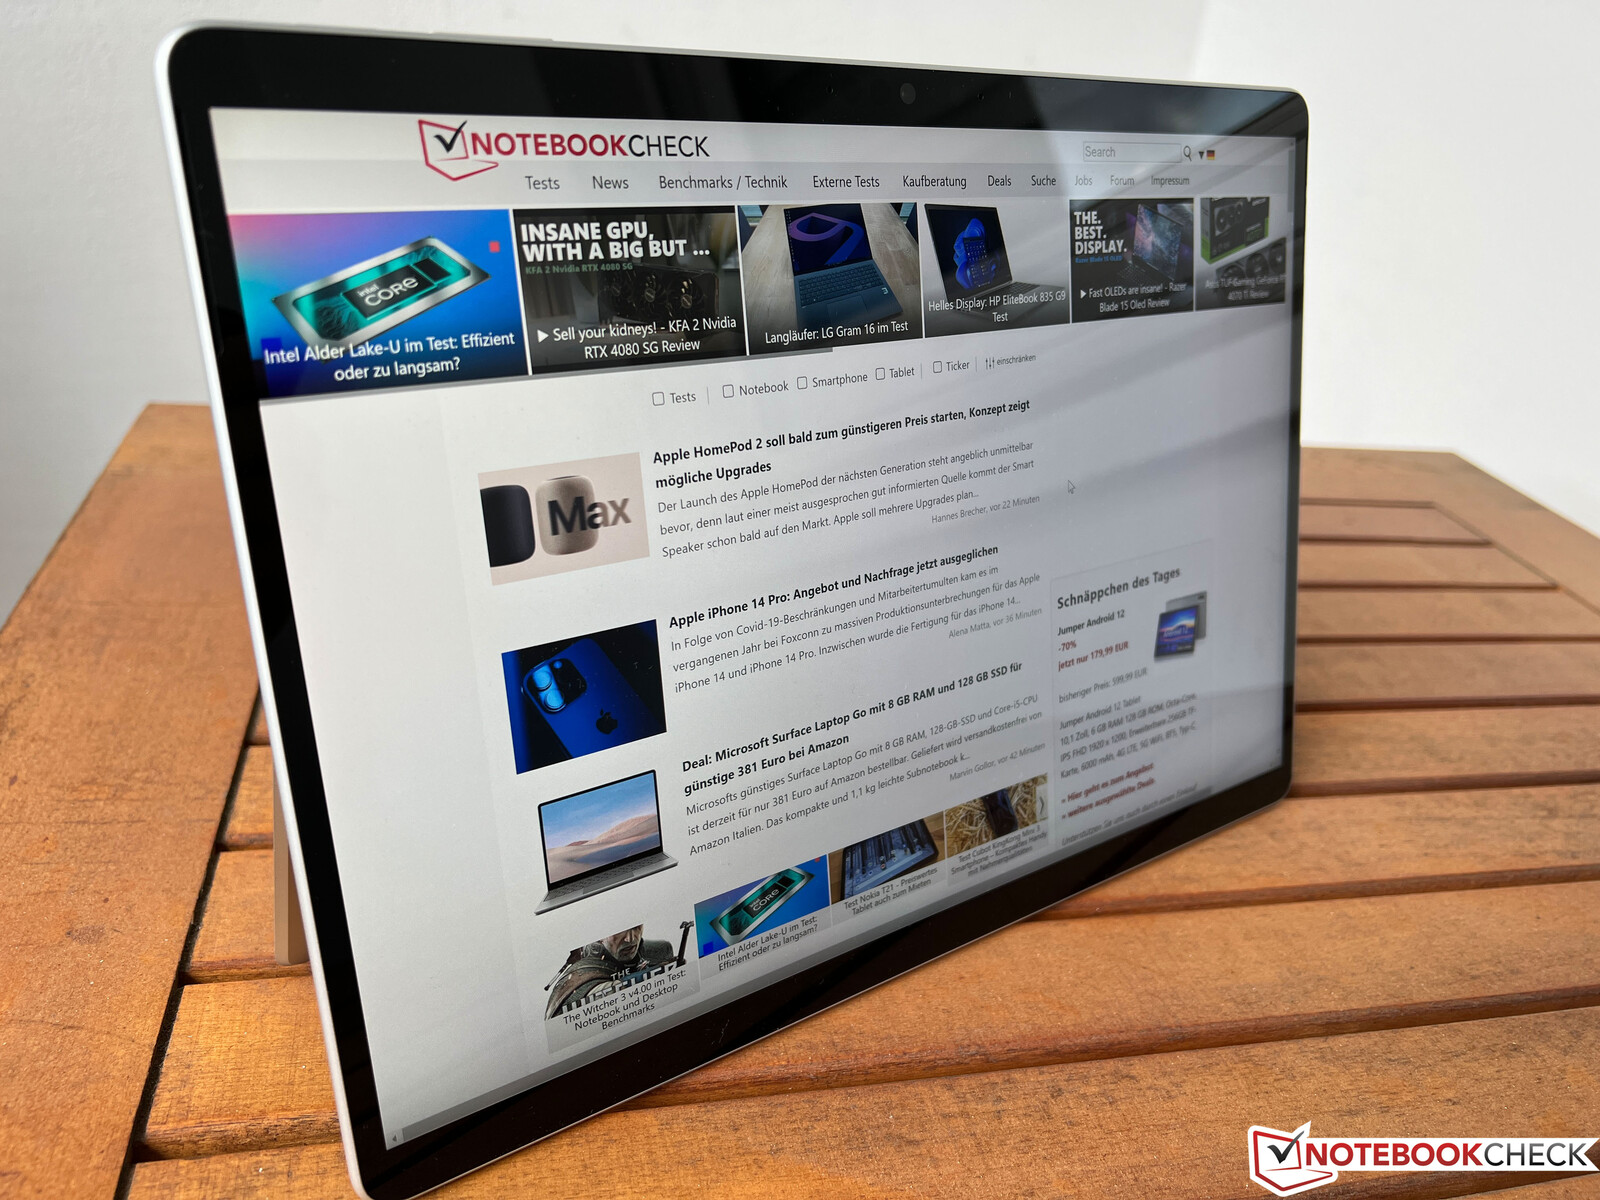
乍一看,除了端口的新安排外,Surface Pro 9的外壳没有任何变化。重量略有不同,因此内部布局可能也有细微变化。微软提供四种不同的颜色,从我们评测设备的银色(铂金)、宝石蓝、森林绿到石墨(深灰色)。与此相反,ARM机型只有铂金色可供选择。
和以前一样,建造质量是一流的,铝制外壳非常坚固。没有吱吱作响的声音或图像失真,尽管集成的脚架仍然是一个弱点。外壳非常薄,所以当你把Surface Pro 9放在大腿上时,边缘很快就会压到皮肤上,比如说。支架也非常灵活,铰链总是很好地完成它们的工作。
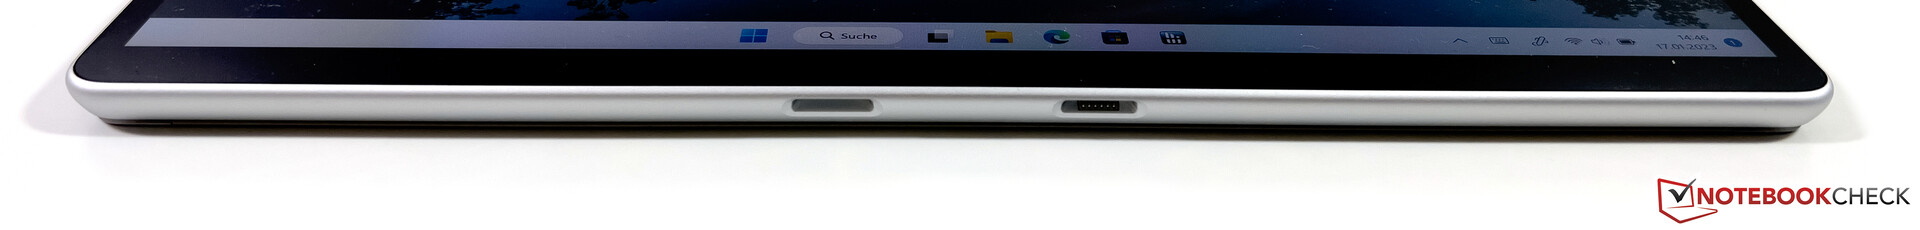
设备 - 带有Thunderbolt 4的Surface Pro
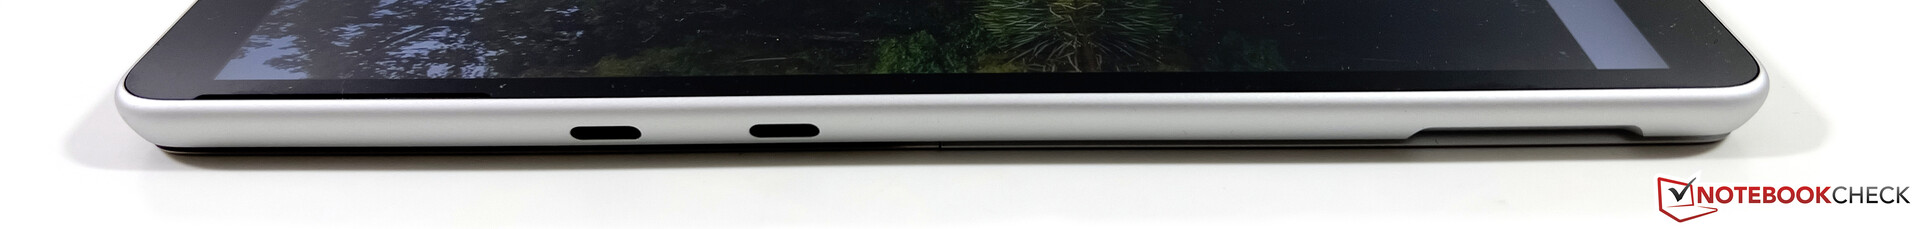
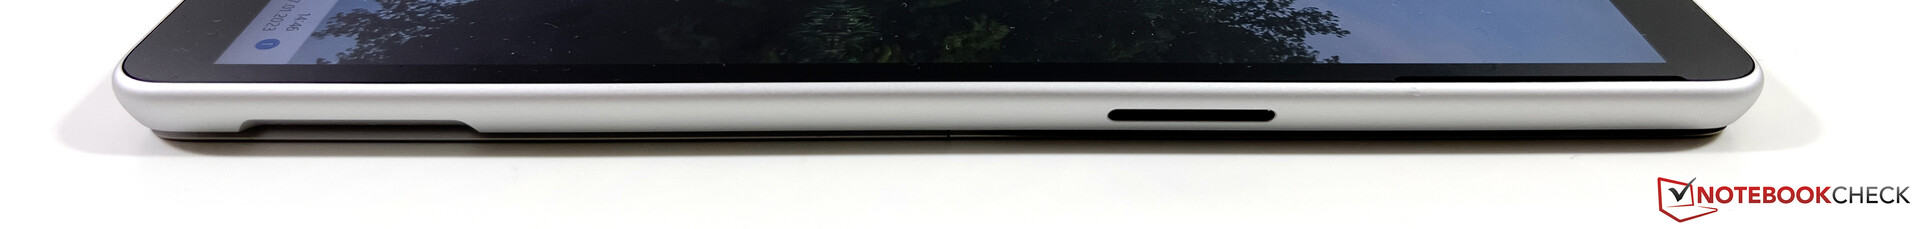
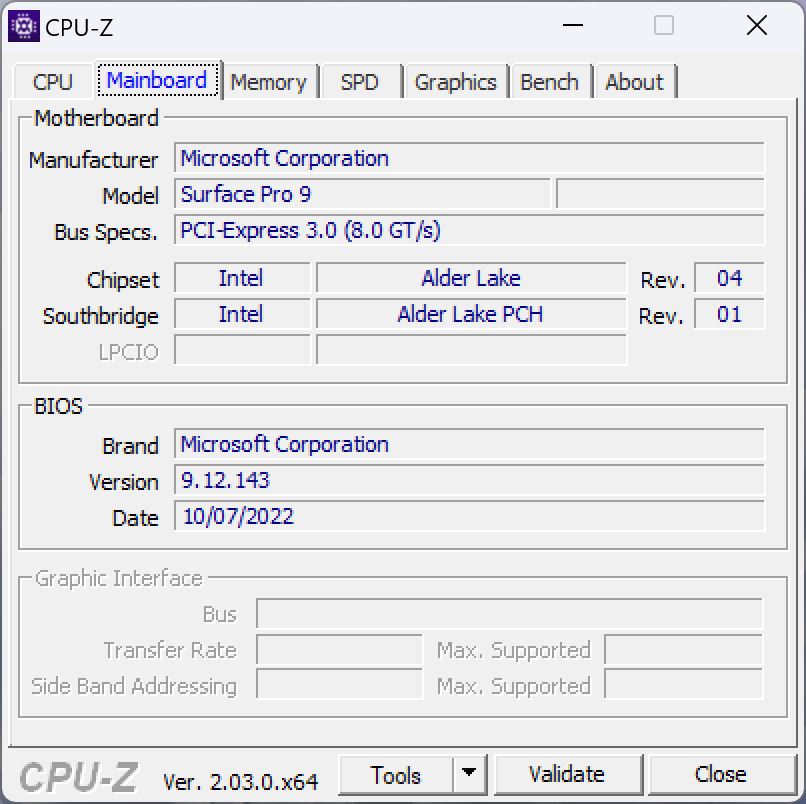
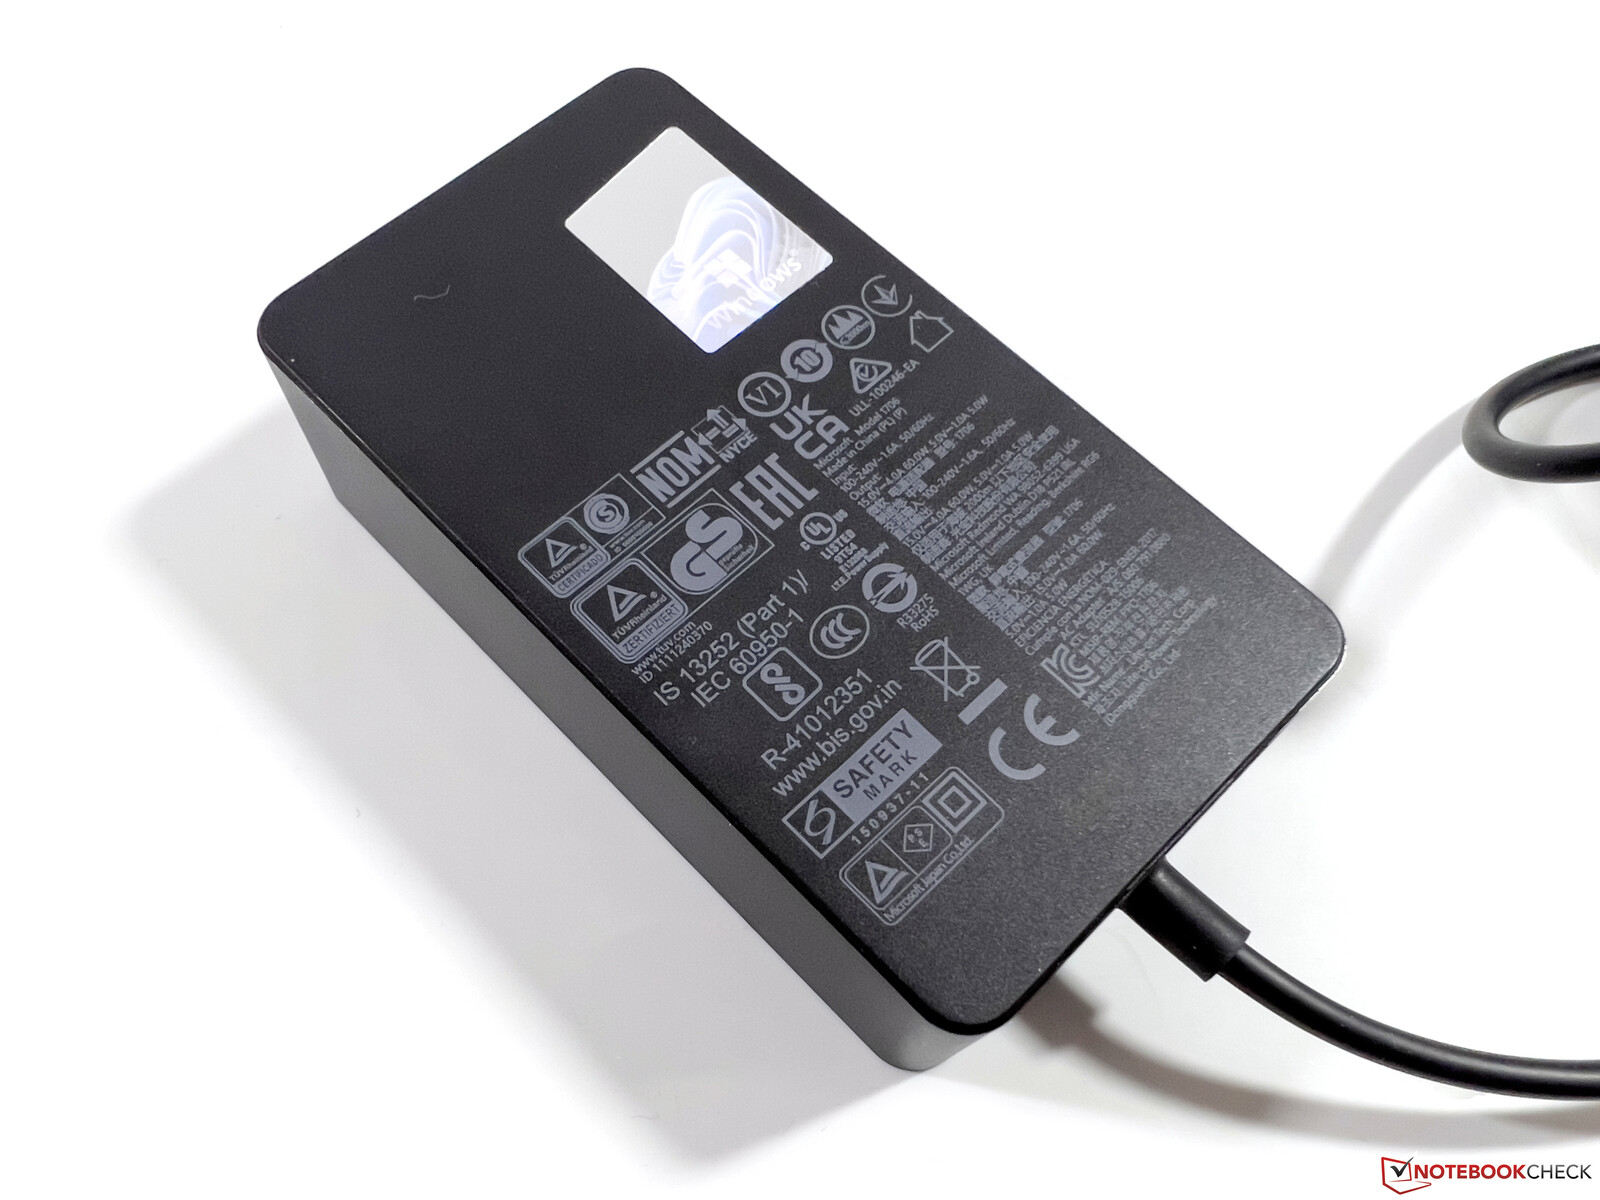
端口已经被重新定位,2个USB-C端口(包括Thunderbolt 4)以及专有的Surface Connect端口仍然保留,但微软已经删除了3.5毫米插孔。随之而来的电源适配器使用了Surface Connect端口,但可折叠机也可以通过USB-C充电。有点令人失望的是继续缺乏读卡器,在上一个型号中,读卡器已经被可选的Nano SIM卡槽所取代。由于英特尔型号现在不再配备WWAN模块,微软可以很容易地再次安装一个微型SD读卡器。
沟通
如前所述,只有Surface Pro 9的ARM版本提供移动互联网,而英特尔版本则没有。至少WLAN模块已经更新,由于英特尔的AX211模块,现在支持现代WiFi 6E标准。我们能够毫无问题地连接到华硕参考路由器的6GHZ网络,传输速率被证明是非常高和稳定的。
| Networking | |
| Microsoft Surface Pro 9, i7-1255U | |
| iperf3 receive AXE11000 6GHz | |
| iperf3 transmit AXE11000 6GHz | |
| Dell XPS 13 9315 2-in-1 Core i5-1230U | |
| iperf3 receive AXE11000 6GHz | |
| iperf3 transmit AXE11000 6GHz | |
| Lenovo ThinkPad X12 20UVS03G00 | |
| iperf3 transmit AX12 | |
| iperf3 receive AX12 | |
| HP Elite Dragonfly Folio 13.5 G3 | |
| iperf3 receive AXE11000 6GHz | |
| iperf3 receive AXE11000 | |
| iperf3 transmit AXE11000 6GHz | |
| iperf3 transmit AXE11000 | |
| Apple iPad Pro 12.9 2022 | |
| iperf3 receive AXE11000 6GHz | |
| iperf3 receive AXE11000 | |
| iperf3 transmit AXE11000 6GHz | |
| iperf3 transmit AXE11000 | |
| Asus ROG Flow Z13 GZ301ZE | |
| iperf3 transmit AX12 | |
| iperf3 receive AX12 | |
| Microsoft Surface Pro 8, i7-1185G7 | |
| iperf3 transmit AX12 | |
| iperf3 receive AX12 | |
网络摄像头
网络摄像头的配置没有变化,前面有一个500万像素的摄像头,后面有一个1000万像素的摄像头。因此,Surface Pro 9在相机性能方面仍然属于最好的Windows设备。在Surface Pro 9的ARM版本中,甚至提供了更多的相机功能,如对背景的柔焦(或虚化效果),自动眼球接触或自动图像裁剪。


维护
和以前一样,Surface Pro 9仍然为用户提供了更换紧凑的M.2-2230固态硬盘的可能性,而且微软已经使这个过程变得更加容易,因为不再需要SIM工具来打开盖子。相反,有一个小的凹槽,你把手指按进去,就可以打开对面的凹槽(用磁力固定),使盖子可以很容易地取出。然而,其余的内部组件是无法接触到的。
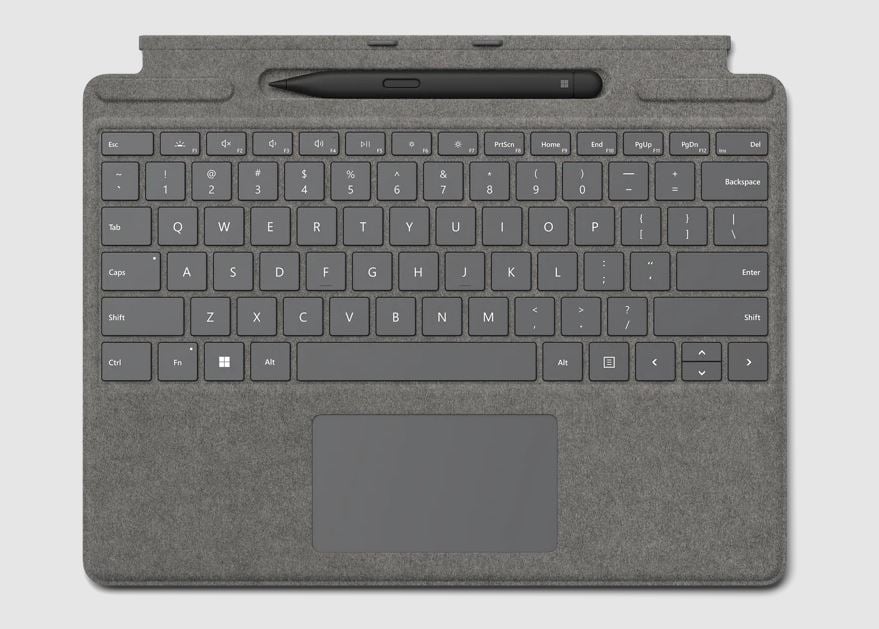
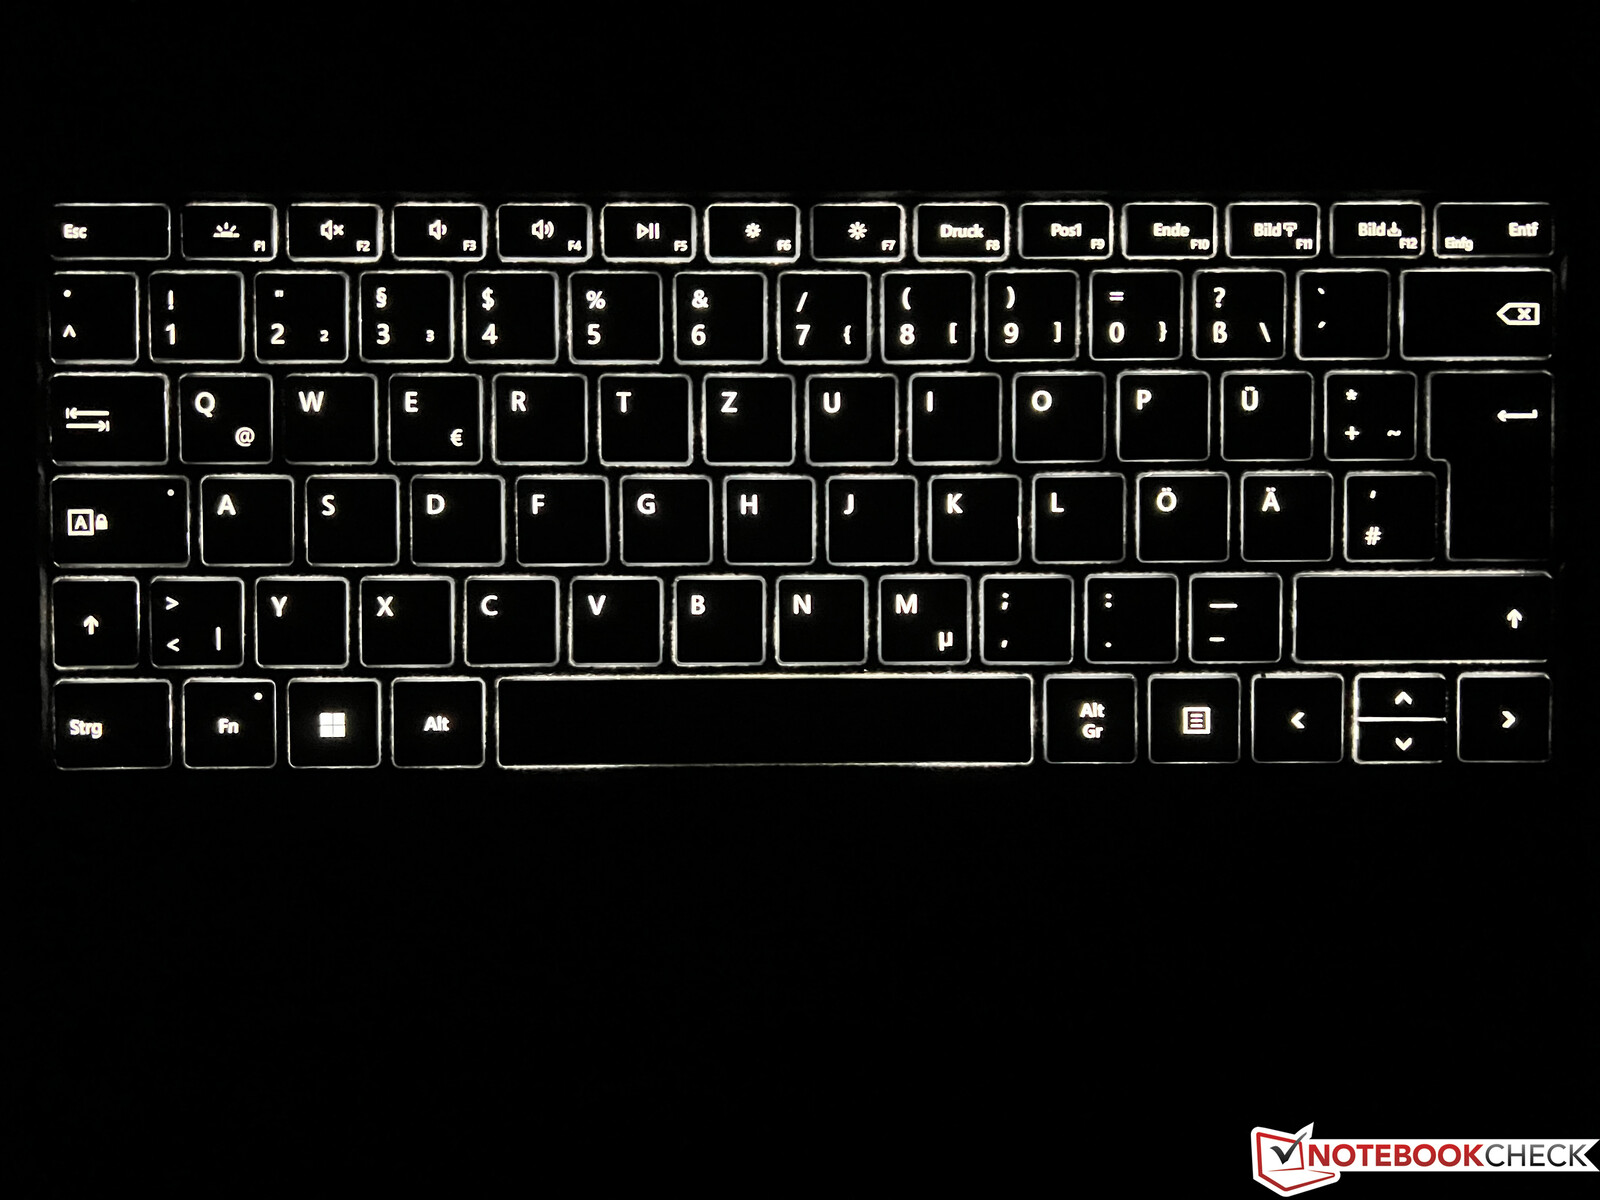
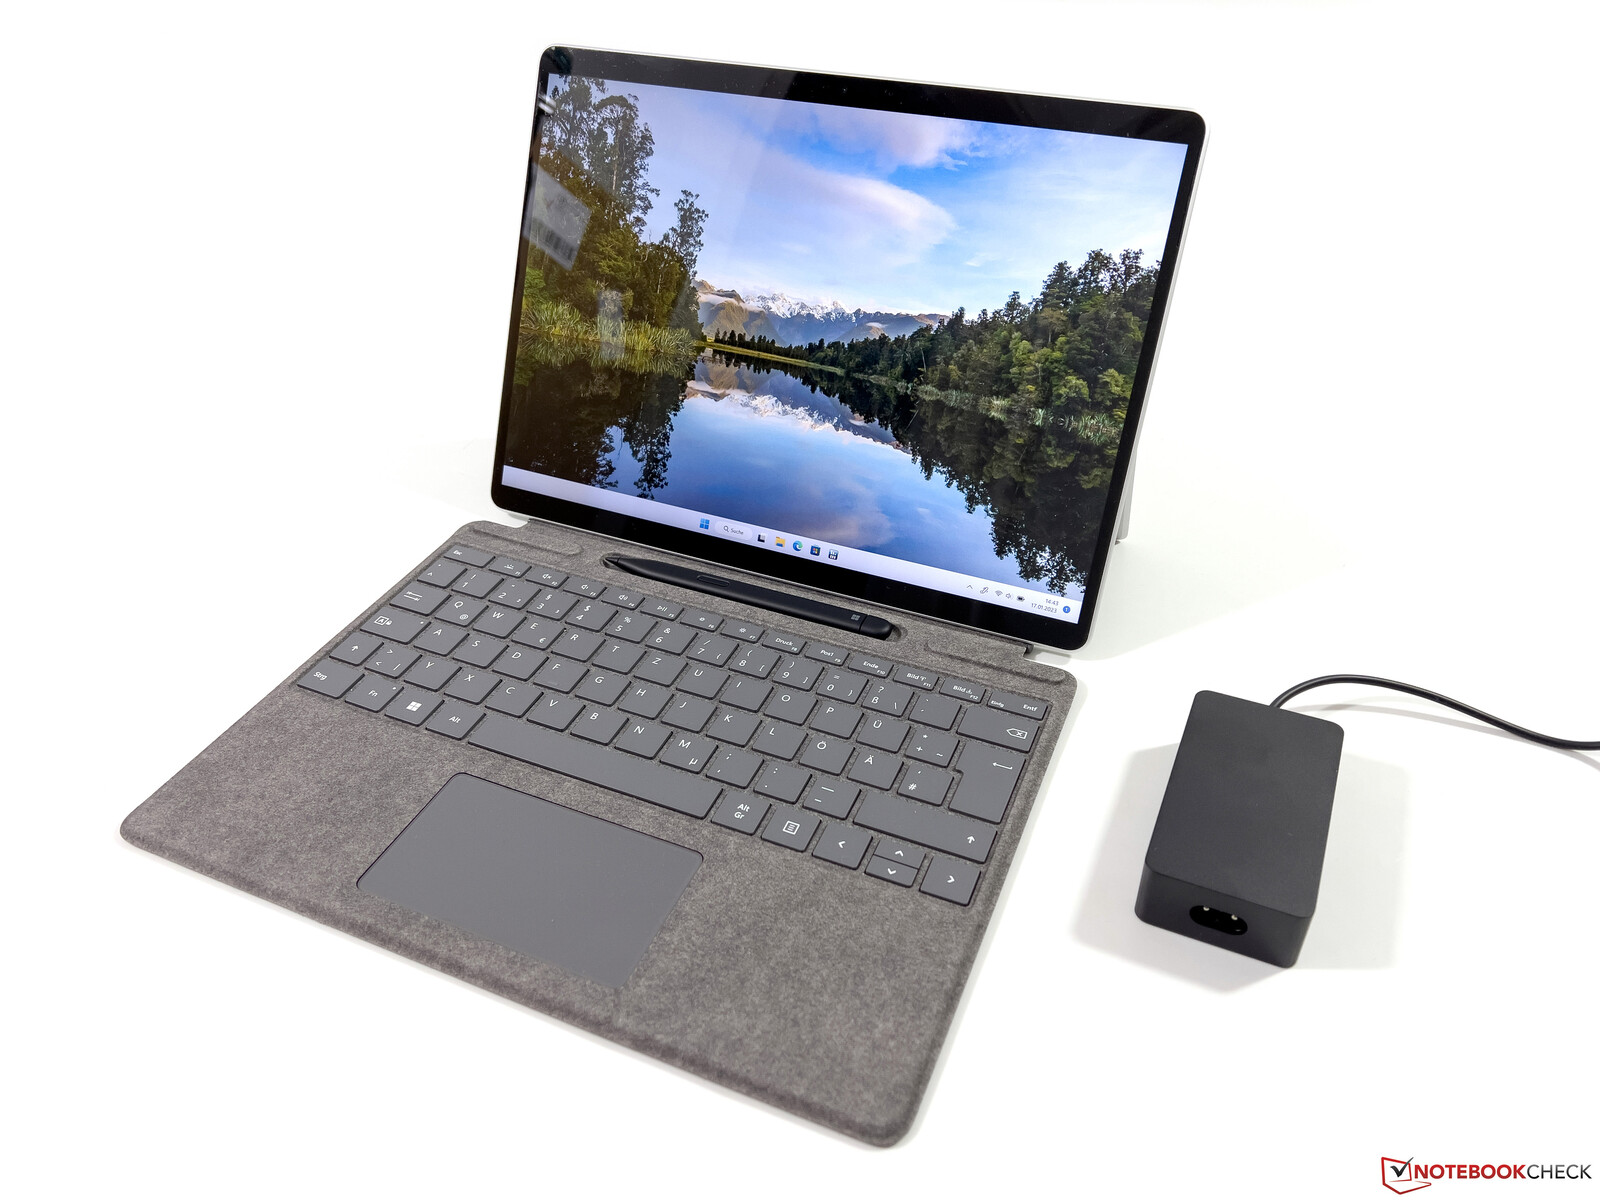
输入设备 - 签名键盘保持不变
由于Surface Pro的尺寸没有变化,微软继续提供两种不同的键盘盖。与上一个型号一样,我们又有了签名键盘和超薄笔2,它可以收起来并在键盘盖内充电。手写笔的功能仍然非常好,而且还支持触觉反馈。然而,由于其扁平的形状,笔的操作不再那么符合人体工程学。
键盘本身提供了一个体面的打字感觉,而且还带有背光。此外,键盘可以以轻微的角度放置(由于有磁铁),但稳定性变得有限。特别是在旅途中,打字的舒适度远不如普通笔记本电脑,而且由于内置的铰链,Surface总体上需要一个大的设置区域(但这也适用于大多数带有键盘盖的可转换产品)。
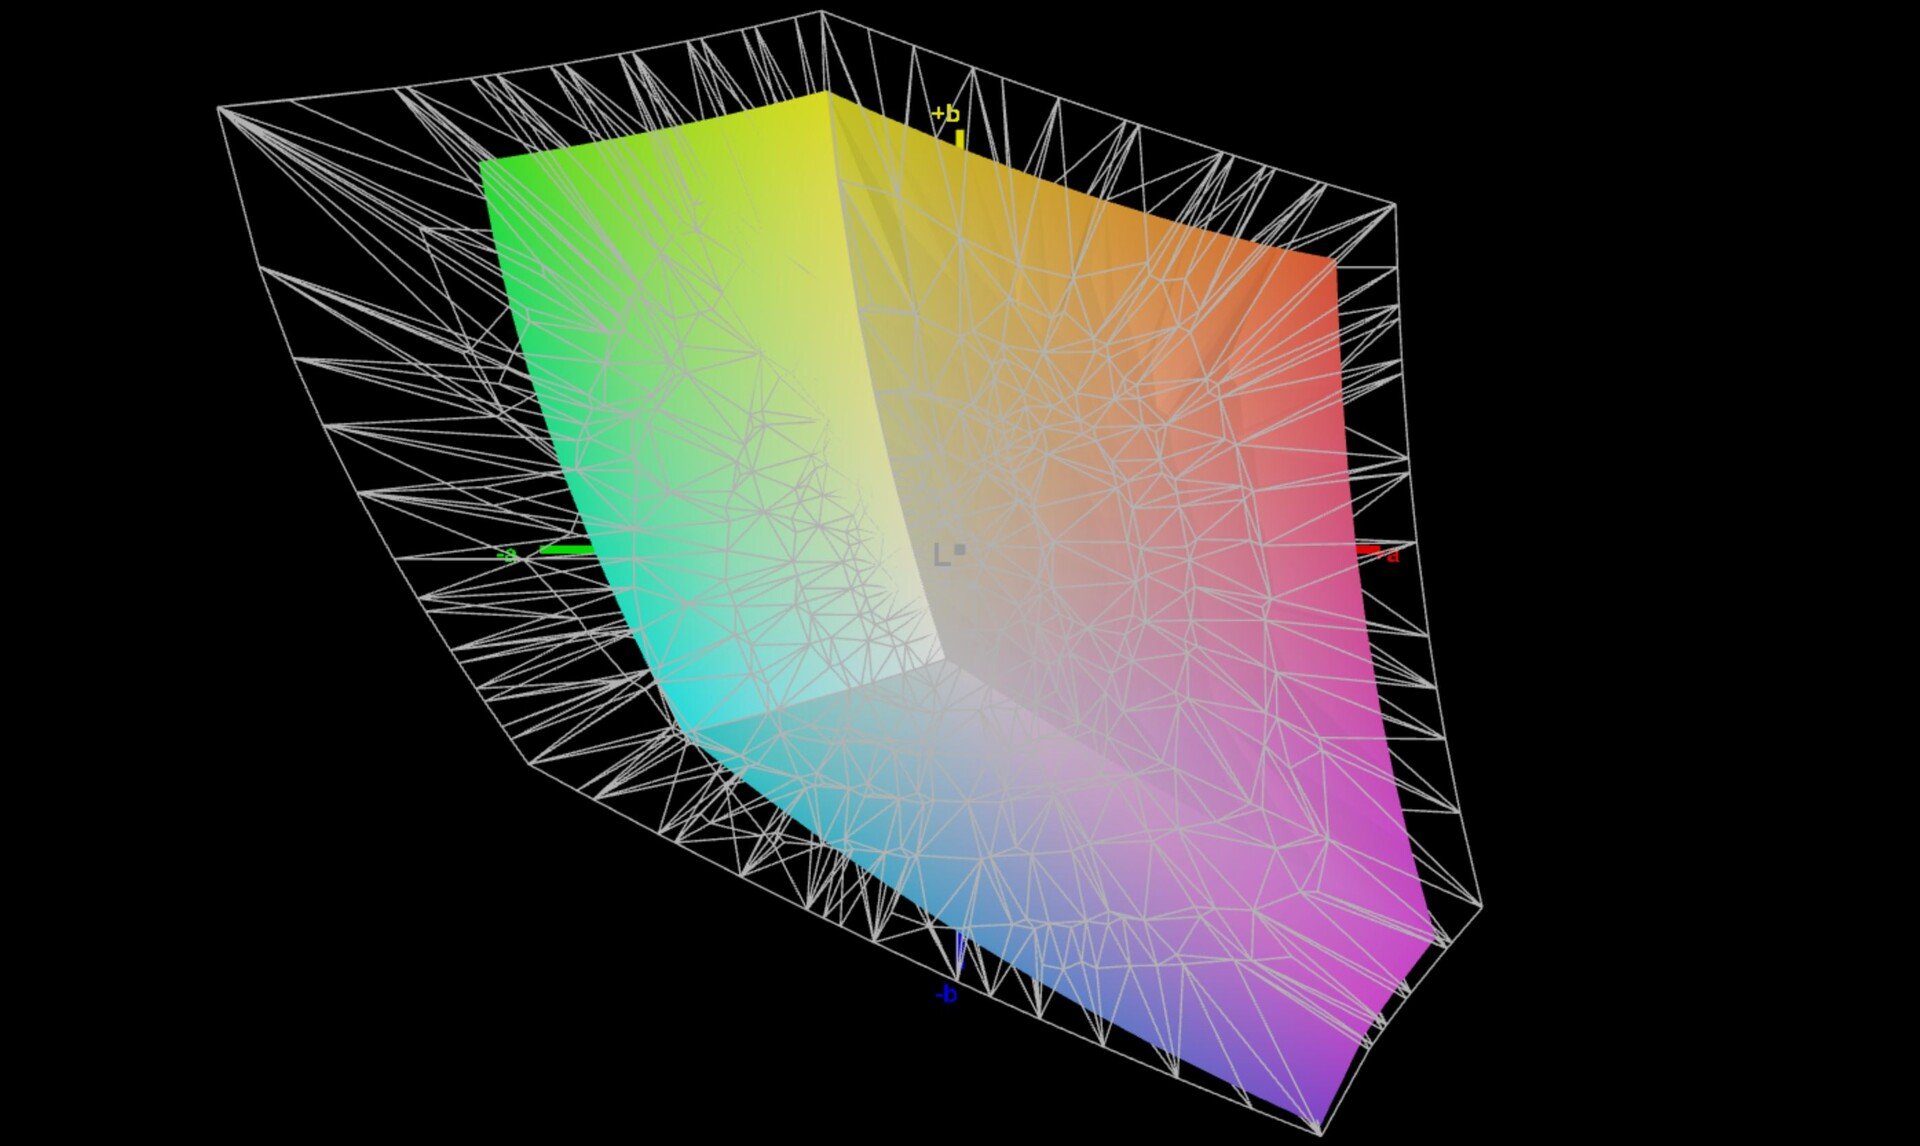
显示器 - 3:2 IPS,120 Hz
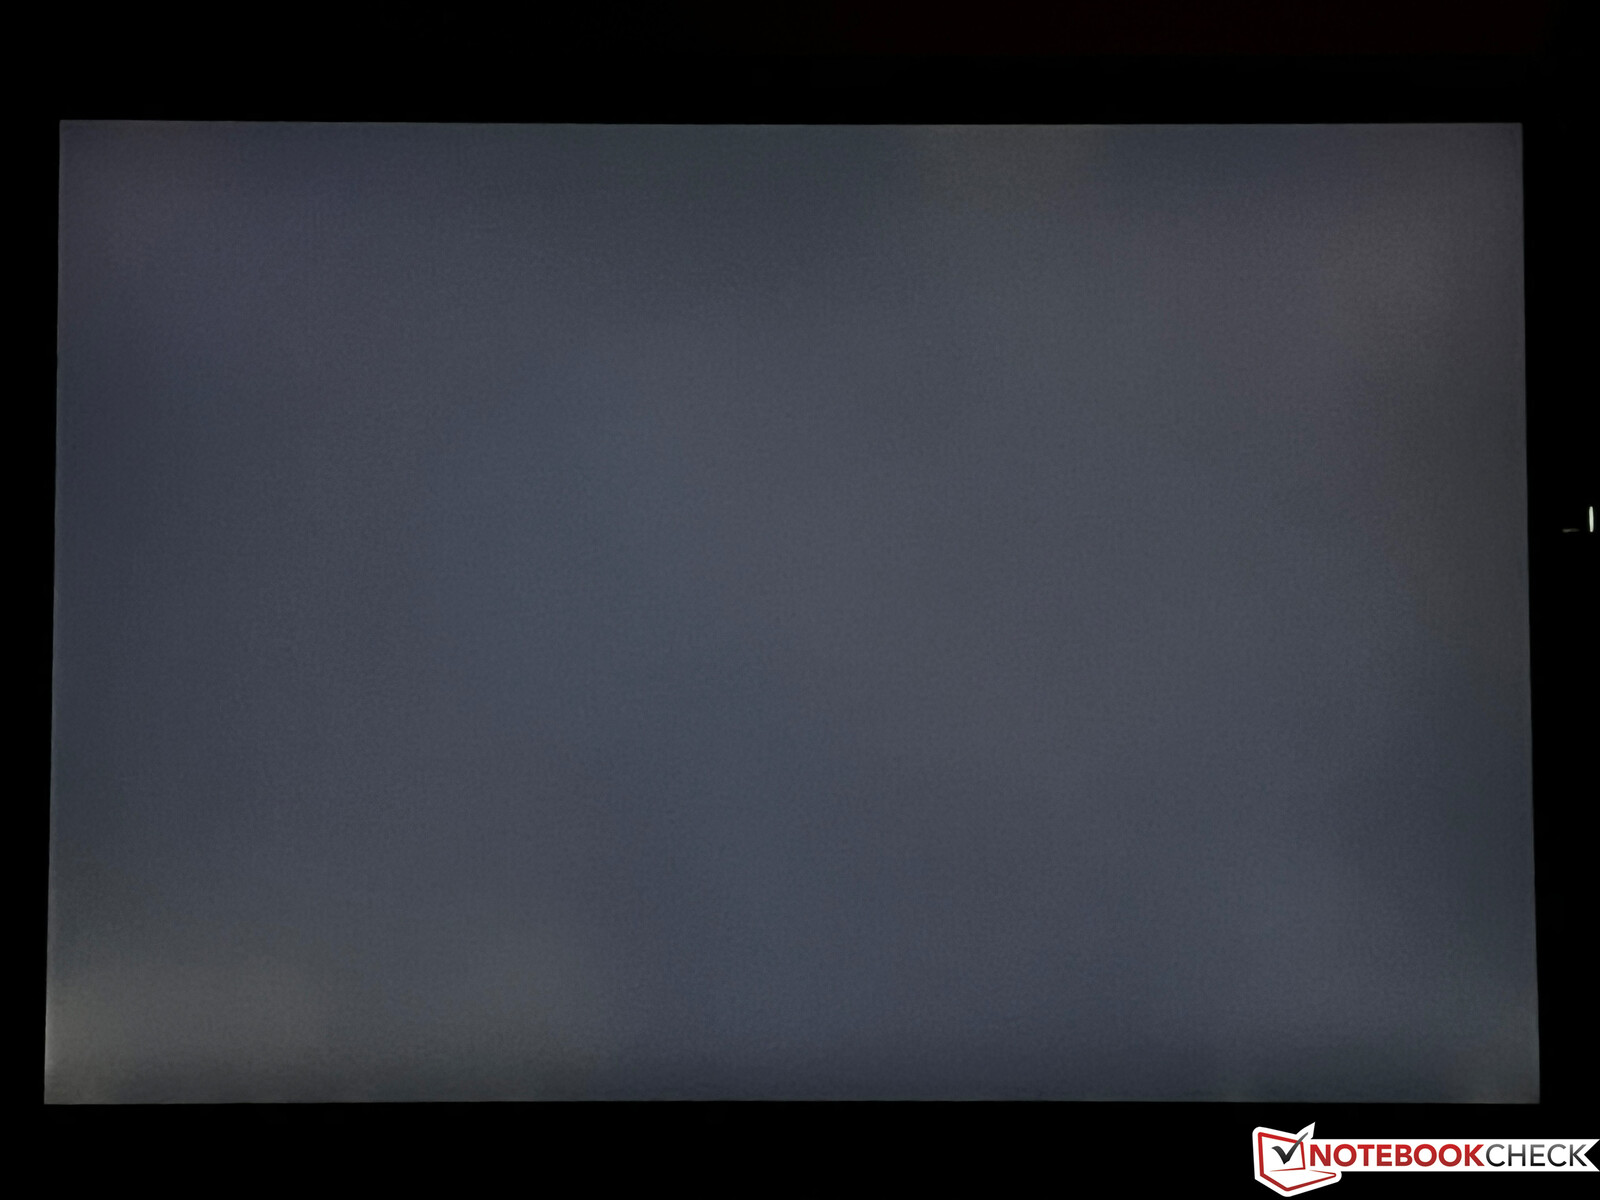
显示屏的基本特征没有变化,仍然是3:2格式的IPS触摸屏,提供2880 x 1920(267 PPI)的分辨率和高达120 Hz的刷新率。60赫兹被预设为默认速率,因此120赫兹必须在设置中手动选择。我们对光面屏幕的主观印象仍然很好。由于有了传感器,亮度和色温被自动调整,这也是很好的功能。
该面板再次来自LG飞利浦,但面板ID已经改变。从根本上说,这些数值是相当的,因为最大亮度再次徘徊在450cd/m²左右。黑色水平稍好,这也是为什么对比度几乎为1.200:1,显得稍好。但竞争设备在这里表现得更好,特别是在对比度方面,如iPad Pro的Mini-LED-显示屏。
没有典型的PWM闪烁,但我们再次记录了在55%或更低的亮度下约30KHz的闪烁。但由于频率高,这不应该是一个问题。这也适用于光晕,因为只有在全亮度下,我们才会注意到在黑暗的屏幕左下方有一个稍微明亮的点。
| |||||||||||||||||||||||||
Brightness Distribution: 94 %
Center on Battery: 454 cd/m²
Contrast: 1197:1 (Black: 0.38 cd/m²)
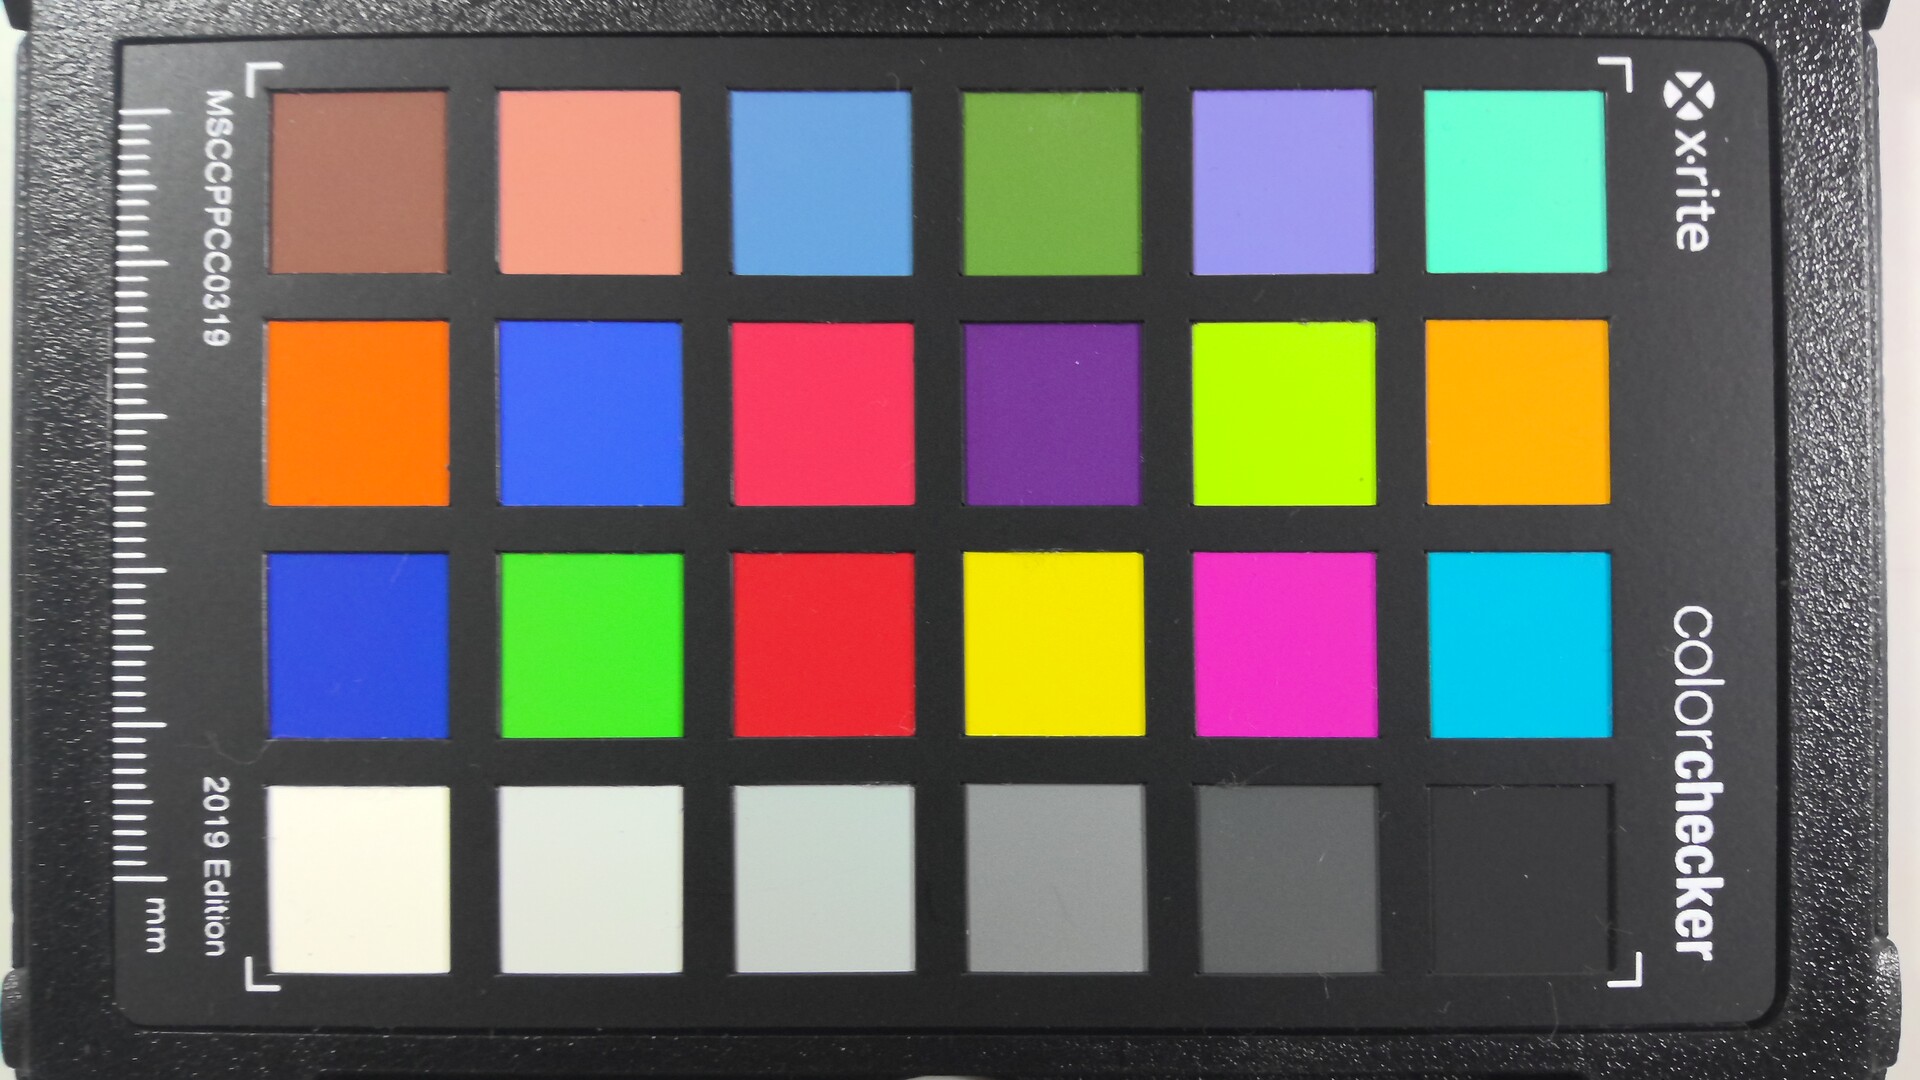
ΔE ColorChecker Calman: 1.7 | ∀{0.5-29.43 Ø4.71}
calibrated: 1.5
ΔE Greyscale Calman: 1.5 | ∀{0.09-98 Ø4.96}
67.7% AdobeRGB 1998 (Argyll 3D)
97.7% sRGB (Argyll 3D)
65.6% Display P3 (Argyll 3D)
Gamma: 2.17
CCT: 6761 K
| Microsoft Surface Pro 9, i7-1255U LP129WT2-SPA6, IPS, 2880x1920, 13" | Dell XPS 13 9315 2-in-1 Core i5-1230U BOE NE13A1M, IPS, 2880x1920, 13" | Lenovo ThinkPad X12 20UVS03G00 N123NCA-GS1, a-Si IPS LED, 1920x1280, 12.3" | HP Elite Dragonfly Folio 13.5 G3 Chi Mei CMN13C0, IPS, 1920x1280, 13.5" | Apple iPad Pro 12.9 2022 Liquid Retina XDR Display, Mini-LED, 2732x2048, 12.9" | Asus ROG Flow Z13 GZ301ZE LQ134N1JW54, IPS, 1920x1200, 13.4" | Microsoft Surface Pro 8, i7-1185G7 LP129WT212166, IPS, 2880x1920, 13" | |
|---|---|---|---|---|---|---|---|
| Display | 6% | 2% | 3% | 1% | 12% | ||
| Display P3 Coverage (%) | 65.6 | 70.7 8% | 67 2% | 68.3 4% | 67.5 3% | 78.2 19% | |
| sRGB Coverage (%) | 97.7 | 99.8 2% | 99.2 2% | 98.6 1% | 97.1 -1% | 100 2% | |
| AdobeRGB 1998 Coverage (%) | 67.7 | 72.6 7% | 68.8 2% | 70.2 4% | 69.3 2% | 77.6 15% | |
| Response Times | -133% | -236% | -272% | -133% | -115% | -139% | |
| Response Time Grey 50% / Grey 80% * (ms) | 13 ? | 44 ? -238% | 63.2 ? -386% | 66.8 ? -414% | 35.3 ? -172% | 44 ? -238% | 46.4 ? -257% |
| Response Time Black / White * (ms) | 19.4 ? | 24.8 ? -28% | 36 ? -86% | 44.4 ? -129% | 37.53 ? -93% | 17.6 ? 9% | 23.2 ? -20% |
| PWM Frequency (Hz) | 29896 ? | 6401 ? | 29760 ? | ||||
| Screen | 8% | 24% | -9% | 7% | -0% | -7% | |
| Brightness middle (cd/m²) | 455 | 507 11% | 419 -8% | 369.5 -19% | 611 34% | 515 13% | 444 -2% |
| Brightness (cd/m²) | 453 | 486 7% | 406 -10% | 350 -23% | 605 34% | 476 5% | 451 0% |
| Brightness Distribution (%) | 94 | 87 -7% | 94 0% | 87 -7% | 92 -2% | 87 -7% | 91 -3% |
| Black Level * (cd/m²) | 0.38 | 0.34 11% | 0.23 39% | 0.24 37% | 0.35 8% | 0.43 -13% | |
| Contrast (:1) | 1197 | 1491 25% | 1822 52% | 1540 29% | 1471 23% | 1033 -14% | |
| Colorchecker dE 2000 * | 1.7 | 2.04 -20% | 1.1 35% | 2.3 -35% | 1.4 18% | 1.6 6% | 2 -18% |
| Colorchecker dE 2000 max. * | 3.8 | 3.1 18% | 2.2 42% | 4.34 -14% | 3.3 13% | 4 -5% | 3.2 16% |
| Colorchecker dE 2000 calibrated * | 1.5 | 0.86 43% | 0.5 67% | 0.6 60% | 1.2 20% | 1.7 -13% | |
| Greyscale dE 2000 * | 1.5 | 1.8 -20% | 1.5 -0% | 3.1 -107% | 2.3 -53% | 2.5 -67% | 1.8 -20% |
| Gamma | 2.17 101% | 2.12 104% | 2.06 107% | 2.1 105% | 2.22 99% | 2.2 100% | 2.11 104% |
| CCT | 6761 96% | 6561 99% | 6524 100% | 6248 104% | 6930 94% | 6939 94% | 6417 101% |
| Color Space (Percent of AdobeRGB 1998) (%) | 62.8 | ||||||
| Color Space (Percent of sRGB) (%) | 99.2 | ||||||
| Total Average (Program / Settings) | -40% /
-13% | -70% /
-18% | -93% /
-44% | -63% /
-28% | -38% /
-16% | -45% /
-22% |
* ... smaller is better
我们使用专业的CalMAN软件(X-Rite i1 Pro 2)测试了该面板:它在交付状态下的表现已经非常好,尽管我们无法检测到sRGB和Vivid配置文件之间的任何差异。灰度显示出轻微的偏色,但这在实践中并不明显。色彩偏差符合目标;只有100%的颜色显示出稍大的偏差(其中只有绿色高于3的目标值)。我们能够通过我们自己的校准(上面有免费下载的配置文件)来改善这些值,但这并不是真的需要。然而,在色彩空间覆盖率方面,新的面板有些糟糕,因为sRGB只达到了97.7%的覆盖率(以前是100%),P3和AdobeRGB也比以前低一些。
Display Response Times
| ↔ Response Time Black to White | ||
|---|---|---|
| 19.4 ms ... rise ↗ and fall ↘ combined | ↗ 6.8 ms rise | 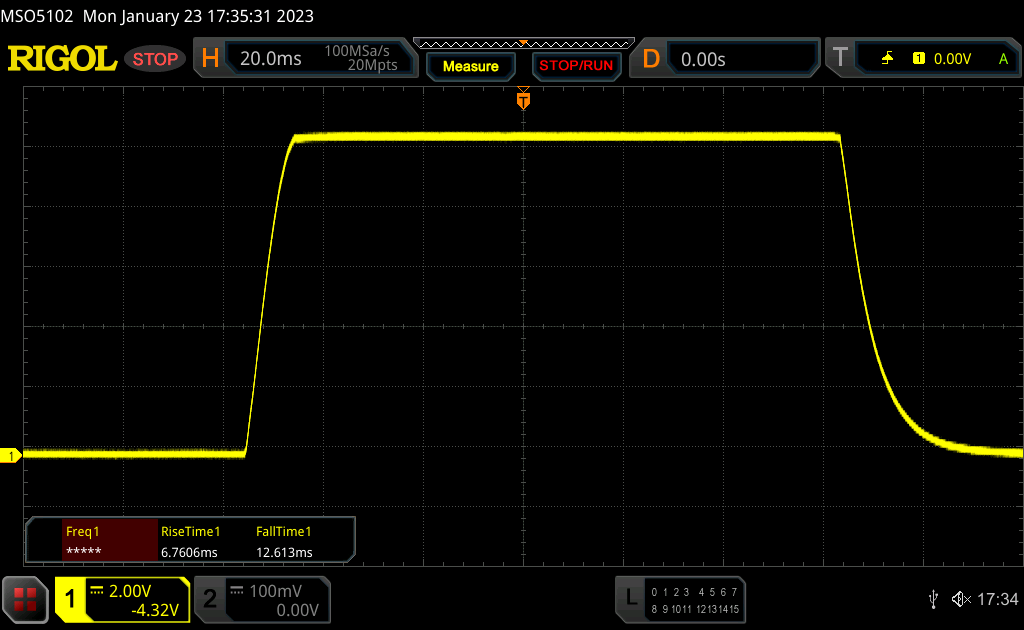 |
| ↘ 12.6 ms fall | ||
| The screen shows good response rates in our tests, but may be too slow for competitive gamers. In comparison, all tested devices range from 0.1 (minimum) to 240 (maximum) ms. » 43 % of all devices are better. This means that the measured response time is similar to the average of all tested devices (19.8 ms). | ||
| ↔ Response Time 50% Grey to 80% Grey | ||
| 13 ms ... rise ↗ and fall ↘ combined | ↗ 6 ms rise | 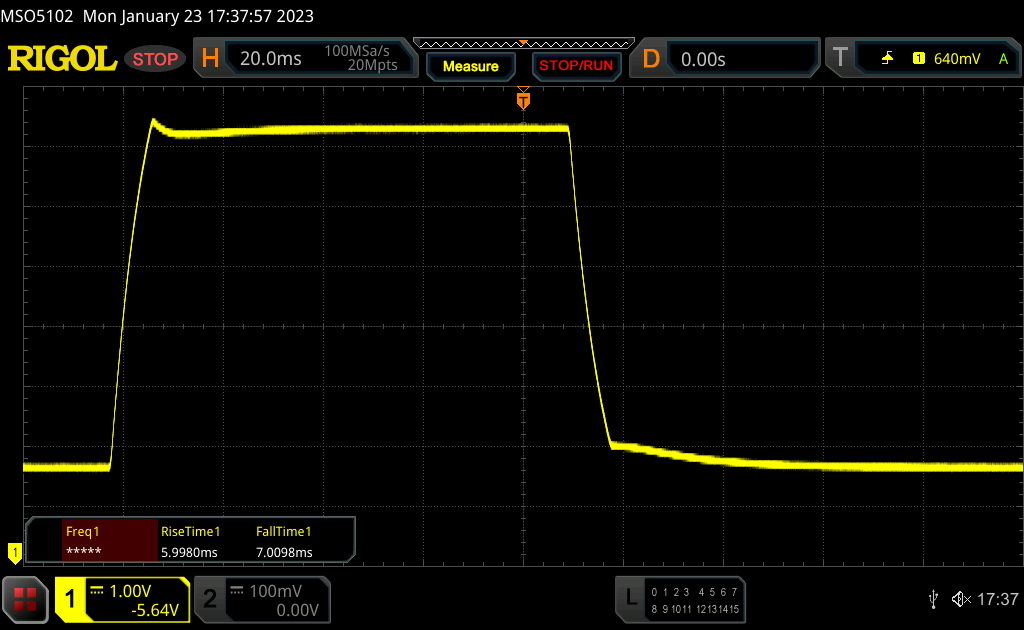 |
| ↘ 7 ms fall | ||
| The screen shows good response rates in our tests, but may be too slow for competitive gamers. In comparison, all tested devices range from 0.165 (minimum) to 636 (maximum) ms. » 27 % of all devices are better. This means that the measured response time is better than the average of all tested devices (31 ms). | ||
Screen Flickering / PWM (Pulse-Width Modulation)
| Screen flickering / PWM detected | 29896 Hz | ≤ 55 % brightness setting | 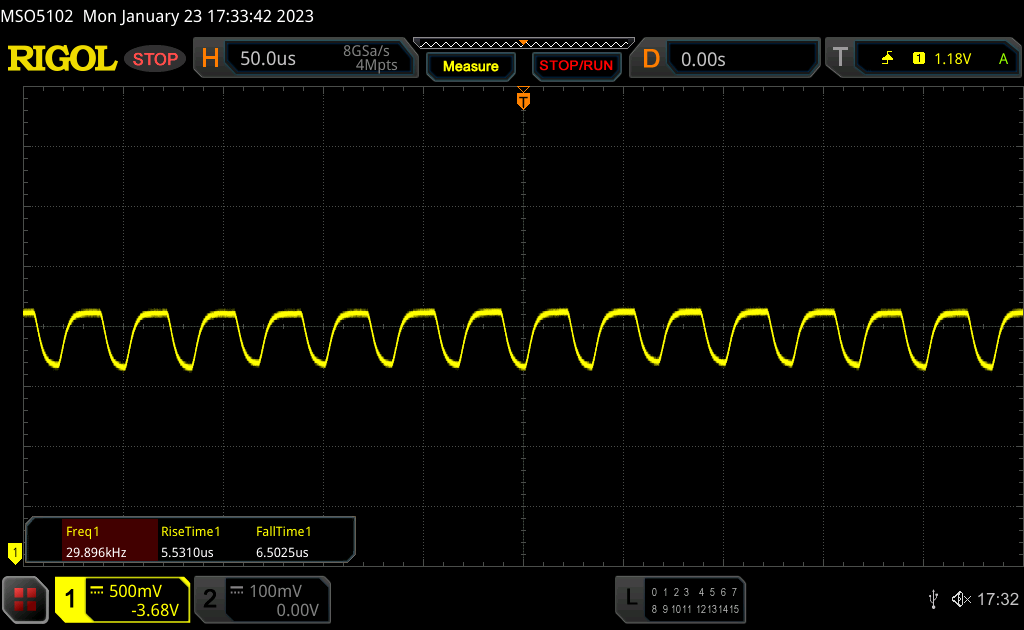 |
The display backlight flickers at 29896 Hz (worst case, e.g., utilizing PWM) Flickering detected at a brightness setting of 55 % and below. There should be no flickering or PWM above this brightness setting. The frequency of 29896 Hz is quite high, so most users sensitive to PWM should not notice any flickering. In comparison: 52 % of all tested devices do not use PWM to dim the display. If PWM was detected, an average of 7754 (minimum: 5 - maximum: 343500) Hz was measured. | |||
光滑的屏幕表面并不适合在户外使用,所以你基本上要尽可能地避免光源的反射。只有这样,最大亮度水平才足以让人舒适地观看显示内容。视角的稳定性没有留下任何批评的余地。
性能--Alder Lake-U提供明显更多的动力
新款Surface Pro 9的英特尔型号只提供15瓦级的Alder Lake处理器,要么就是 酷睿i5 1235U或酷睿i7 1255U。那些需要16GB内存或256GB存储空间的人将不得不选择i7变体。最大32GB内存和1TB SDD是可能的(2499.99美元)。
测试条件
微软只使用Windows的电源设置,其名称与其他Windows设备略有不同(推荐、更好的性能和最佳性能)。我们使用 "最佳性能"进行基准测试,并使用默认的60赫兹模式进行能量测量。
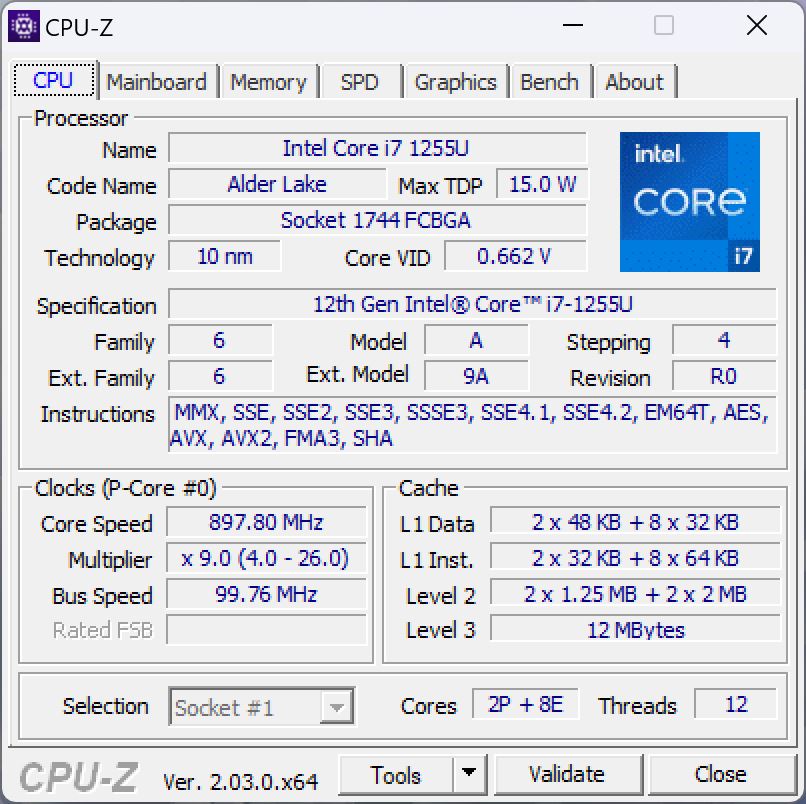
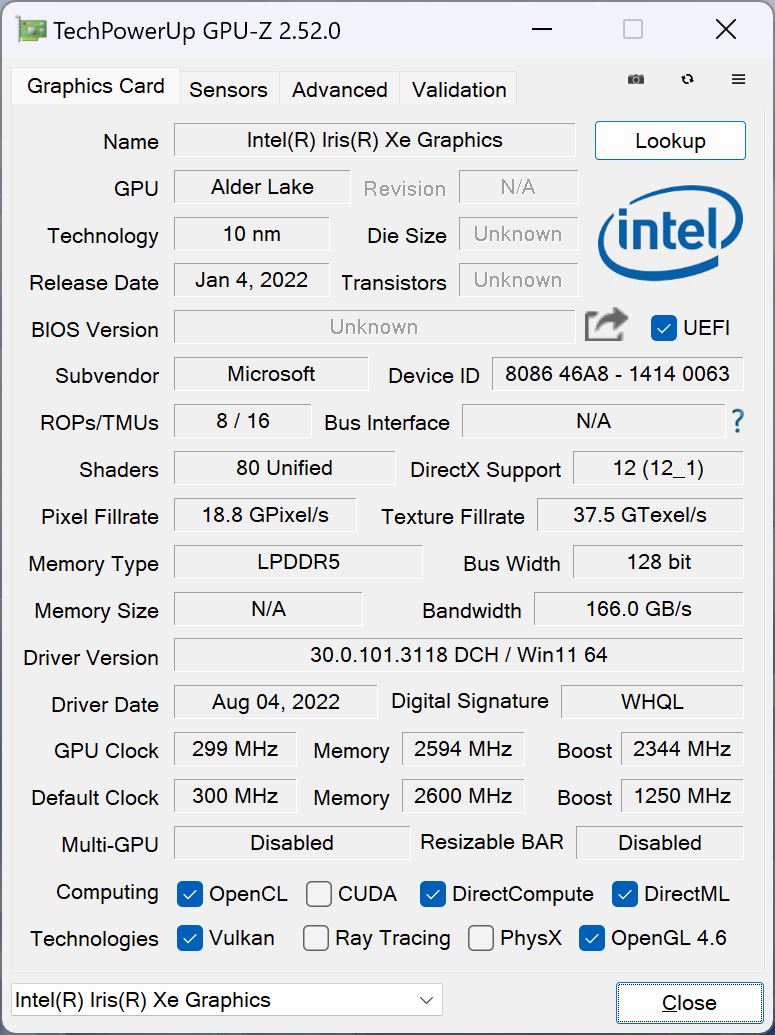
处理器 - 酷睿i7-1255U
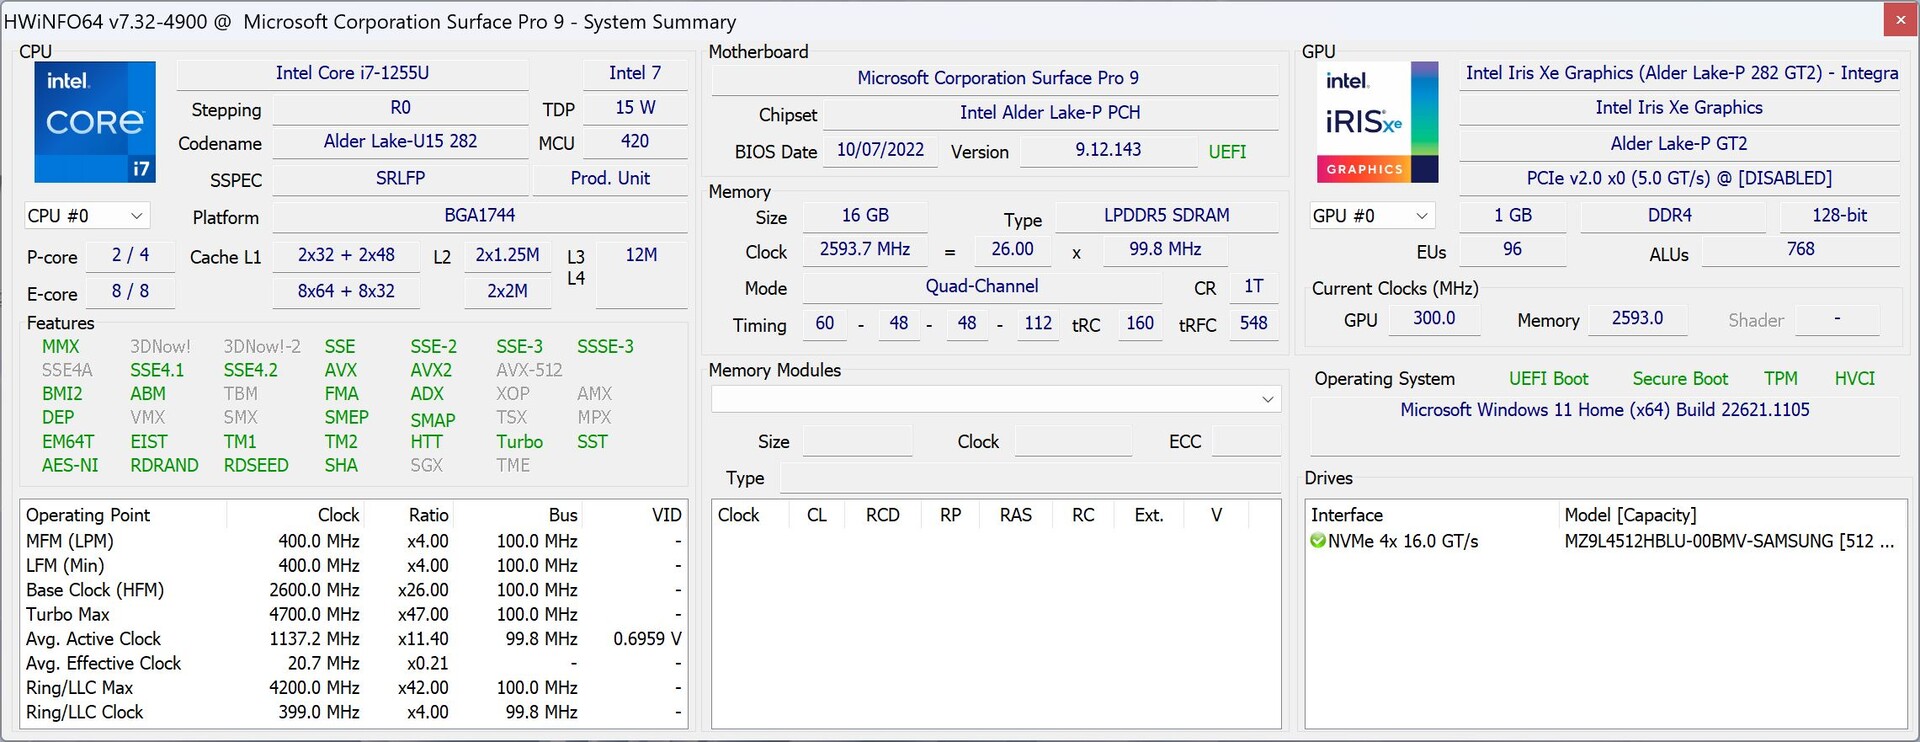
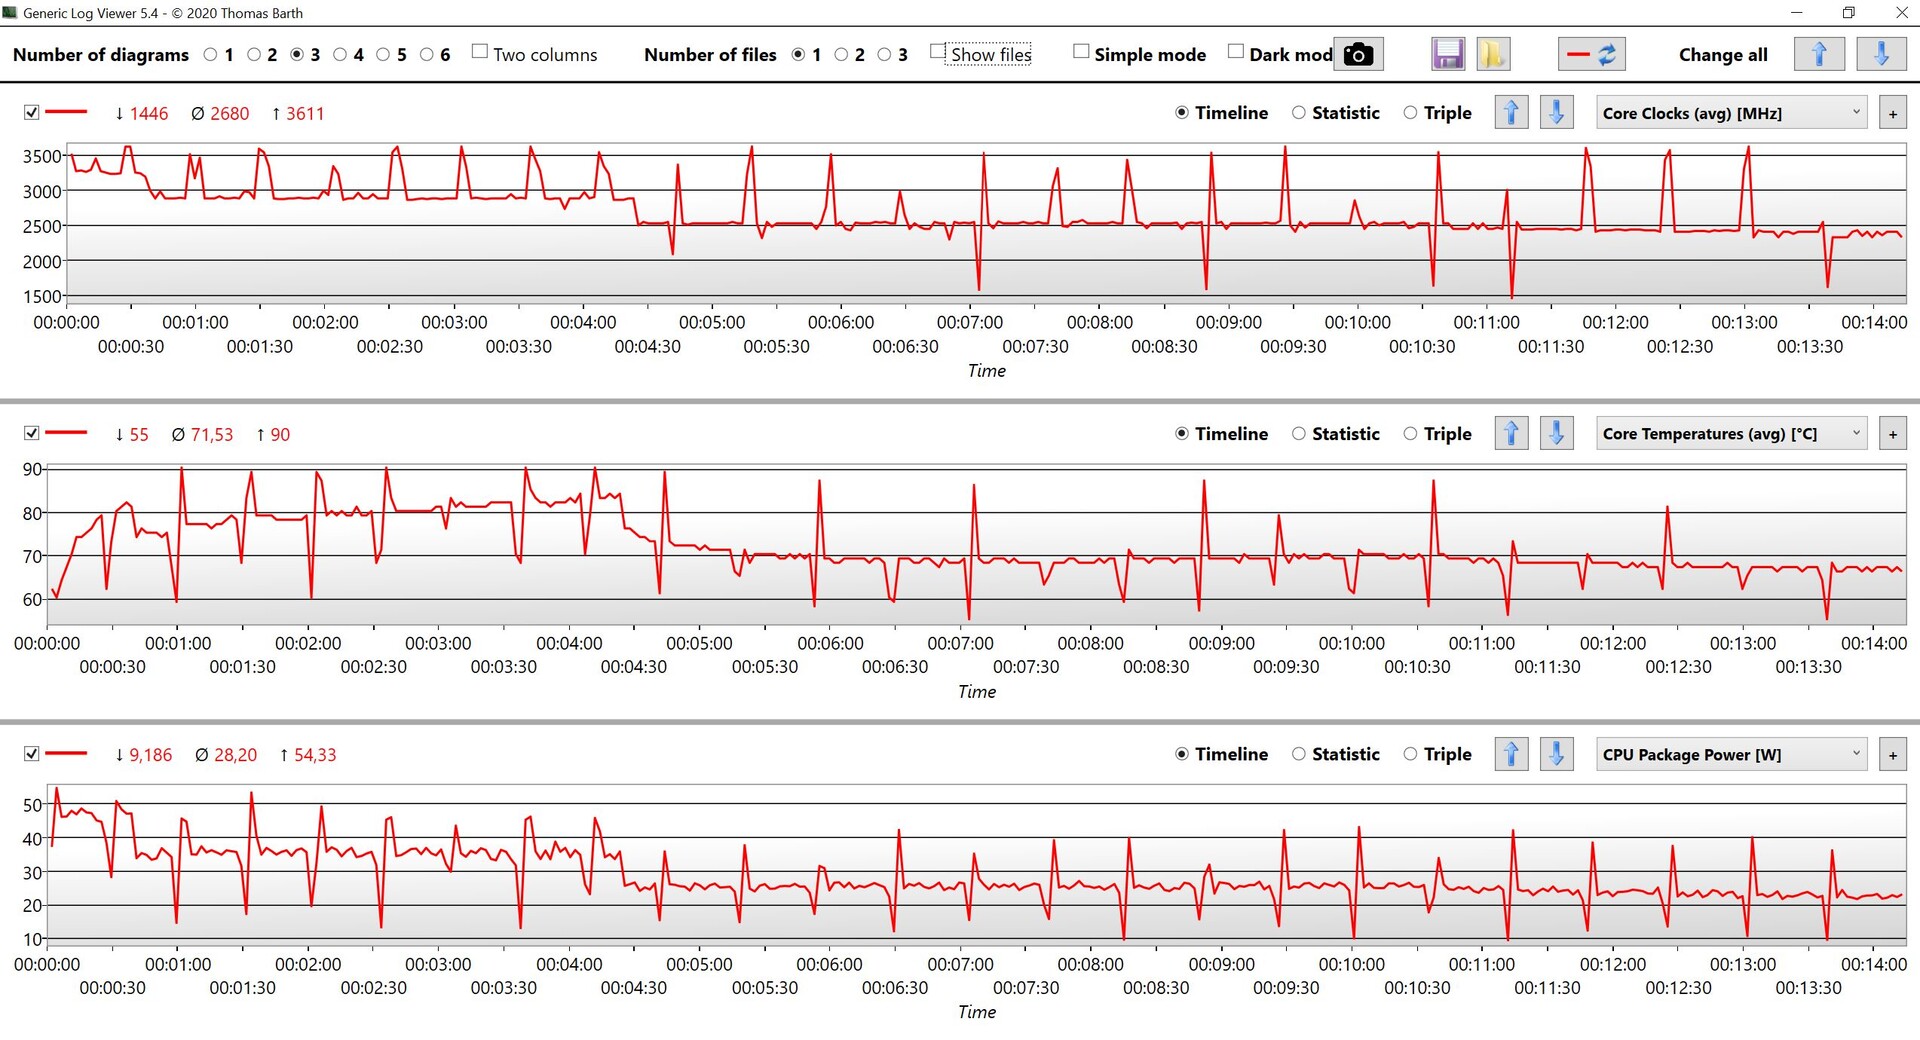
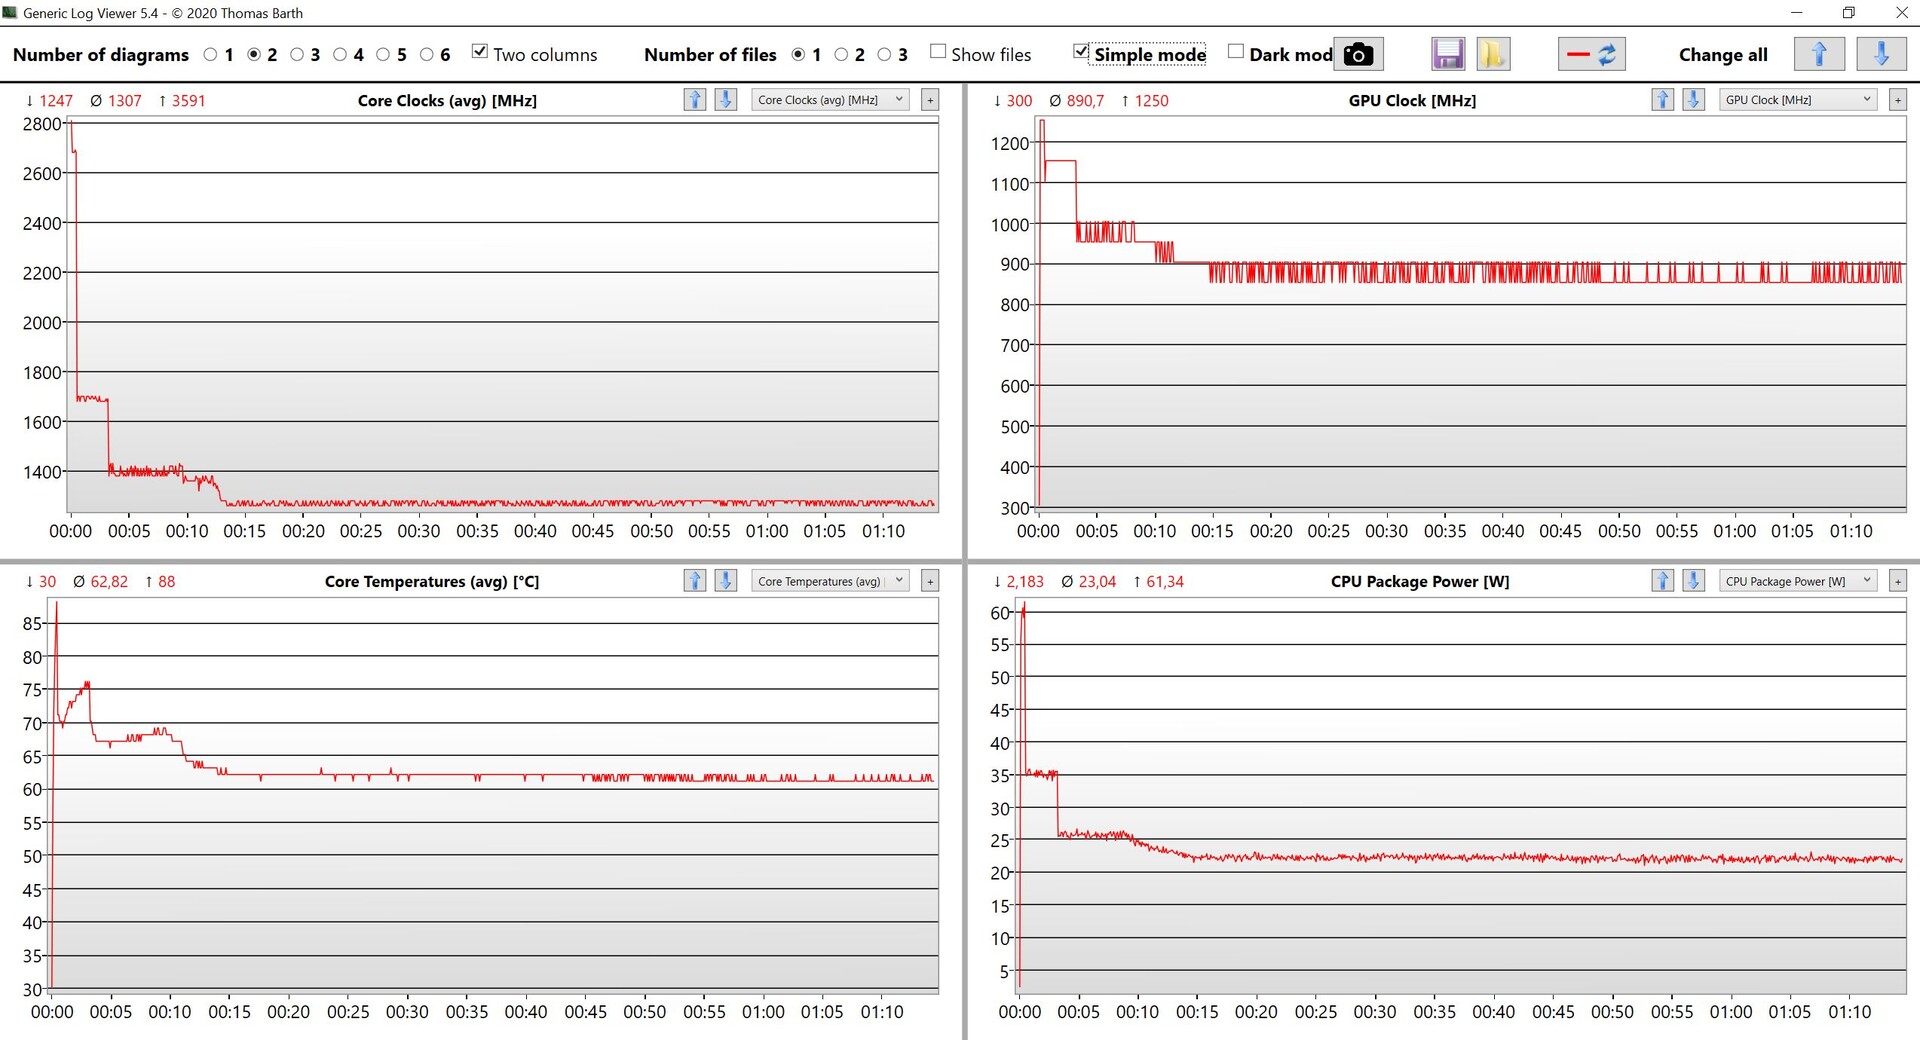
芯片 酷睿i7 1255U属于英特尔目前的Alder Lake一代,结合了两个快速性能核心和8个效率核心。它基本上是一个15瓦的CPU,但微软在这里给了处理器自由发挥的空间,我们观察到在单核负载下最大消耗约为20瓦,在多核负载下高达54瓦,这也接近英特尔规定的Alder Lake-U处理器的最大极限。当然,这些数值只维持了很短的时间,但Surface Pro 9在恒定负载下可以维持35瓦,大约4.5分钟后降至25瓦左右,甚至进一步降至22瓦。当然,这些高数值是否有意义是另一个问题,因为 我们最近对Alder Lake-U CPU的分析显示,Alder Lake-P芯片(例如 酷睿i7 1260P)有两个额外的核心,在这样的数值下能提供更多的性能。
Cinebench R15 Multi Sustained Load
在CPU测试中,Surface Pro 9仅被华硕ROG Z13击败。华硕ROG Flow Z13胜出,后者也配备了 Core i9 12900H。单核和多核性能都明显优于旧的 Surface Pro 8与其配备的 酷睿i7 1185G7.为了与 M2处理器中的 iPad Pro的M2处理器进行比较。我们已经包括了 MacBook Air因为iPad上不支持所有的基准测试。Apple M2的速度不大,但效率更高(单核~5瓦,多核~20瓦)。
在电池模式下,CPU性能略差,因为功率限制降低到45/30瓦。在Cinebench R23多核测试中,这导致性能下降略低于5%,但单核性能并不差。更多CPU基准测试可在这里.
Cinebench R23: Multi Core | Single Core
Cinebench R20: CPU (Multi Core) | CPU (Single Core)
Cinebench R15: CPU Multi 64Bit | CPU Single 64Bit
Blender: v2.79 BMW27 CPU
7-Zip 18.03: 7z b 4 | 7z b 4 -mmt1
Geekbench 5.5: Multi-Core | Single-Core
HWBOT x265 Benchmark v2.2: 4k Preset
LibreOffice : 20 Documents To PDF
R Benchmark 2.5: Overall mean
| CPU Performance rating | |
| Asus ROG Flow Z13 GZ301ZE | |
| Average of class Convertible | |
| Microsoft Surface Pro 9, i7-1255U | |
| Apple MacBook Air M2 10C GPU -5! | |
| HP Elite Dragonfly Folio 13.5 G3 | |
| Average Intel Core i7-1255U | |
| Dell XPS 13 9315 2-in-1 Core i5-1230U | |
| Microsoft Surface Pro 8, i7-1185G7 | |
| Lenovo ThinkPad X12 20UVS03G00 -1! | |
| Cinebench R23 / Multi Core | |
| Asus ROG Flow Z13 GZ301ZE | |
| Average of class Convertible (1317 - 30959, n=48, last 2 years) | |
| Microsoft Surface Pro 9, i7-1255U | |
| Apple MacBook Air M2 10C GPU | |
| Average Intel Core i7-1255U (5269 - 9628, n=11) | |
| HP Elite Dragonfly Folio 13.5 G3 | |
| Dell XPS 13 9315 2-in-1 Core i5-1230U | |
| Microsoft Surface Pro 8, i7-1185G7 | |
| Lenovo ThinkPad X12 20UVS03G00 | |
| Cinebench R23 / Single Core | |
| Asus ROG Flow Z13 GZ301ZE | |
| Average of class Convertible (740 - 2188, n=48, last 2 years) | |
| HP Elite Dragonfly Folio 13.5 G3 | |
| Microsoft Surface Pro 9, i7-1255U | |
| Average Intel Core i7-1255U (1408 - 1775, n=11) | |
| Apple MacBook Air M2 10C GPU | |
| Microsoft Surface Pro 8, i7-1185G7 | |
| Dell XPS 13 9315 2-in-1 Core i5-1230U | |
| Lenovo ThinkPad X12 20UVS03G00 | |
| Cinebench R20 / CPU (Multi Core) | |
| Asus ROG Flow Z13 GZ301ZE | |
| Average of class Convertible (595 - 12102, n=48, last 2 years) | |
| Microsoft Surface Pro 9, i7-1255U | |
| Average Intel Core i7-1255U (2095 - 3702, n=11) | |
| HP Elite Dragonfly Folio 13.5 G3 | |
| Dell XPS 13 9315 2-in-1 Core i5-1230U | |
| Apple MacBook Air M2 10C GPU | |
| Microsoft Surface Pro 8, i7-1185G7 | |
| Lenovo ThinkPad X12 20UVS03G00 | |
| Cinebench R20 / CPU (Single Core) | |
| Asus ROG Flow Z13 GZ301ZE | |
| Average of class Convertible (273 - 834, n=48, last 2 years) | |
| HP Elite Dragonfly Folio 13.5 G3 | |
| Microsoft Surface Pro 9, i7-1255U | |
| Average Intel Core i7-1255U (550 - 682, n=11) | |
| Dell XPS 13 9315 2-in-1 Core i5-1230U | |
| Microsoft Surface Pro 8, i7-1185G7 | |
| Lenovo ThinkPad X12 20UVS03G00 | |
| Apple MacBook Air M2 10C GPU | |
| Cinebench R15 / CPU Multi 64Bit | |
| Asus ROG Flow Z13 GZ301ZE | |
| Average of class Convertible (478 - 4940, n=47, last 2 years) | |
| Microsoft Surface Pro 9, i7-1255U | |
| HP Elite Dragonfly Folio 13.5 G3 | |
| Average Intel Core i7-1255U (919 - 1577, n=11) | |
| Dell XPS 13 9315 2-in-1 Core i5-1230U | |
| Apple MacBook Air M2 10C GPU | |
| Microsoft Surface Pro 8, i7-1185G7 | |
| Lenovo ThinkPad X12 20UVS03G00 | |
| Cinebench R15 / CPU Single 64Bit | |
| Asus ROG Flow Z13 GZ301ZE | |
| Average of class Convertible (149.8 - 317, n=47, last 2 years) | |
| HP Elite Dragonfly Folio 13.5 G3 | |
| Average Intel Core i7-1255U (161 - 251, n=12) | |
| Microsoft Surface Pro 8, i7-1185G7 | |
| Apple MacBook Air M2 10C GPU | |
| Microsoft Surface Pro 9, i7-1255U | |
| Dell XPS 13 9315 2-in-1 Core i5-1230U | |
| Lenovo ThinkPad X12 20UVS03G00 | |
| Blender / v2.79 BMW27 CPU | |
| Lenovo ThinkPad X12 20UVS03G00 | |
| Apple MacBook Air M2 10C GPU | |
| Microsoft Surface Pro 8, i7-1185G7 | |
| Dell XPS 13 9315 2-in-1 Core i5-1230U | |
| Average Intel Core i7-1255U (372 - 601, n=11) | |
| HP Elite Dragonfly Folio 13.5 G3 | |
| Microsoft Surface Pro 9, i7-1255U | |
| Average of class Convertible (105 - 1051, n=47, last 2 years) | |
| Asus ROG Flow Z13 GZ301ZE | |
| 7-Zip 18.03 / 7z b 4 | |
| Asus ROG Flow Z13 GZ301ZE | |
| Average of class Convertible (12977 - 121368, n=47, last 2 years) | |
| Microsoft Surface Pro 9, i7-1255U | |
| Dell XPS 13 9315 2-in-1 Core i5-1230U | |
| HP Elite Dragonfly Folio 13.5 G3 | |
| Average Intel Core i7-1255U (24126 - 37365, n=11) | |
| Microsoft Surface Pro 8, i7-1185G7 | |
| Lenovo ThinkPad X12 20UVS03G00 | |
| 7-Zip 18.03 / 7z b 4 -mmt1 | |
| Asus ROG Flow Z13 GZ301ZE | |
| Average of class Convertible (3672 - 6655, n=47, last 2 years) | |
| Average Intel Core i7-1255U (5059 - 5529, n=11) | |
| HP Elite Dragonfly Folio 13.5 G3 | |
| Microsoft Surface Pro 8, i7-1185G7 | |
| Microsoft Surface Pro 9, i7-1255U | |
| Dell XPS 13 9315 2-in-1 Core i5-1230U | |
| Geekbench 5.5 / Multi-Core | |
| Asus ROG Flow Z13 GZ301ZE | |
| Average of class Convertible (1608 - 22023, n=48, last 2 years) | |
| Apple MacBook Air M2 10C GPU | |
| Microsoft Surface Pro 9, i7-1255U | |
| HP Elite Dragonfly Folio 13.5 G3 | |
| Average Intel Core i7-1255U (4463 - 8821, n=12) | |
| Dell XPS 13 9315 2-in-1 Core i5-1230U | |
| Microsoft Surface Pro 8, i7-1185G7 | |
| Lenovo ThinkPad X12 20UVS03G00 | |
| Geekbench 5.5 / Single-Core | |
| Apple MacBook Air M2 10C GPU | |
| Asus ROG Flow Z13 GZ301ZE | |
| Average of class Convertible (806 - 2275, n=48, last 2 years) | |
| Microsoft Surface Pro 9, i7-1255U | |
| HP Elite Dragonfly Folio 13.5 G3 | |
| Average Intel Core i7-1255U (1560 - 1712, n=12) | |
| Microsoft Surface Pro 8, i7-1185G7 | |
| Dell XPS 13 9315 2-in-1 Core i5-1230U | |
| Lenovo ThinkPad X12 20UVS03G00 | |
| HWBOT x265 Benchmark v2.2 / 4k Preset | |
| Asus ROG Flow Z13 GZ301ZE | |
| Average of class Convertible (3.43 - 36.2, n=47, last 2 years) | |
| Microsoft Surface Pro 9, i7-1255U | |
| HP Elite Dragonfly Folio 13.5 G3 | |
| Average Intel Core i7-1255U (6.31 - 10.1, n=11) | |
| Dell XPS 13 9315 2-in-1 Core i5-1230U | |
| Microsoft Surface Pro 8, i7-1185G7 | |
| Lenovo ThinkPad X12 20UVS03G00 | |
| LibreOffice / 20 Documents To PDF | |
| Lenovo ThinkPad X12 20UVS03G00 | |
| Average of class Convertible (42.5 - 84.3, n=47, last 2 years) | |
| Microsoft Surface Pro 9, i7-1255U | |
| Dell XPS 13 9315 2-in-1 Core i5-1230U | |
| Microsoft Surface Pro 8, i7-1185G7 | |
| HP Elite Dragonfly Folio 13.5 G3 | |
| Average Intel Core i7-1255U (35.6 - 52.5, n=11) | |
| Asus ROG Flow Z13 GZ301ZE | |
| R Benchmark 2.5 / Overall mean | |
| Lenovo ThinkPad X12 20UVS03G00 | |
| Microsoft Surface Pro 8, i7-1185G7 | |
| Dell XPS 13 9315 2-in-1 Core i5-1230U | |
| Microsoft Surface Pro 9, i7-1255U | |
| Average Intel Core i7-1255U (0.4688 - 0.558, n=11) | |
| Average of class Convertible (0.3915 - 0.84, n=47, last 2 years) | |
| HP Elite Dragonfly Folio 13.5 G3 | |
| Asus ROG Flow Z13 GZ301ZE | |
* ... smaller is better
AIDA64: FP32 Ray-Trace | FPU Julia | CPU SHA3 | CPU Queen | FPU SinJulia | FPU Mandel | CPU AES | CPU ZLib | FP64 Ray-Trace | CPU PhotoWorxx
| Performance rating | |
| Average of class Convertible | |
| Asus ROG Flow Z13 GZ301ZE | |
| Microsoft Surface Pro 9, i7-1255U | |
| HP Elite Dragonfly Folio 13.5 G3 | |
| Average Intel Core i7-1255U | |
| Microsoft Surface Pro 8, i7-1185G7 | |
| Dell XPS 13 9315 2-in-1 Core i5-1230U | |
| Lenovo ThinkPad X12 20UVS03G00 | |
| AIDA64 / FP32 Ray-Trace | |
| Average of class Convertible (1480 - 64158, n=47, last 2 years) | |
| Microsoft Surface Pro 9, i7-1255U | |
| Asus ROG Flow Z13 GZ301ZE | |
| Microsoft Surface Pro 8, i7-1185G7 | |
| Average Intel Core i7-1255U (4313 - 8127, n=11) | |
| HP Elite Dragonfly Folio 13.5 G3 | |
| Dell XPS 13 9315 2-in-1 Core i5-1230U | |
| Lenovo ThinkPad X12 20UVS03G00 | |
| AIDA64 / FPU Julia | |
| Average of class Convertible (11392 - 184800, n=47, last 2 years) | |
| Microsoft Surface Pro 9, i7-1255U | |
| Asus ROG Flow Z13 GZ301ZE | |
| HP Elite Dragonfly Folio 13.5 G3 | |
| Average Intel Core i7-1255U (19813 - 41353, n=11) | |
| Dell XPS 13 9315 2-in-1 Core i5-1230U | |
| Microsoft Surface Pro 8, i7-1185G7 | |
| Lenovo ThinkPad X12 20UVS03G00 | |
| AIDA64 / CPU SHA3 | |
| Average of class Convertible (797 - 8291, n=47, last 2 years) | |
| Asus ROG Flow Z13 GZ301ZE | |
| Microsoft Surface Pro 9, i7-1255U | |
| Microsoft Surface Pro 8, i7-1185G7 | |
| Average Intel Core i7-1255U (1325 - 2135, n=11) | |
| HP Elite Dragonfly Folio 13.5 G3 | |
| Dell XPS 13 9315 2-in-1 Core i5-1230U | |
| Lenovo ThinkPad X12 20UVS03G00 | |
| AIDA64 / CPU Queen | |
| Asus ROG Flow Z13 GZ301ZE | |
| Microsoft Surface Pro 9, i7-1255U | |
| HP Elite Dragonfly Folio 13.5 G3 | |
| Average Intel Core i7-1255U (61375 - 65892, n=11) | |
| Average of class Convertible (14686 - 148874, n=38, last 2 years) | |
| Dell XPS 13 9315 2-in-1 Core i5-1230U | |
| Microsoft Surface Pro 8, i7-1185G7 | |
| Lenovo ThinkPad X12 20UVS03G00 | |
| AIDA64 / FPU SinJulia | |
| Asus ROG Flow Z13 GZ301ZE | |
| Average of class Convertible (1120 - 29155, n=47, last 2 years) | |
| Microsoft Surface Pro 9, i7-1255U | |
| Microsoft Surface Pro 8, i7-1185G7 | |
| Average Intel Core i7-1255U (3577 - 5095, n=11) | |
| HP Elite Dragonfly Folio 13.5 G3 | |
| Dell XPS 13 9315 2-in-1 Core i5-1230U | |
| Lenovo ThinkPad X12 20UVS03G00 | |
| AIDA64 / FPU Mandel | |
| Average of class Convertible (4929 - 97193, n=47, last 2 years) | |
| Asus ROG Flow Z13 GZ301ZE | |
| Microsoft Surface Pro 9, i7-1255U | |
| Microsoft Surface Pro 8, i7-1185G7 | |
| HP Elite Dragonfly Folio 13.5 G3 | |
| Average Intel Core i7-1255U (11759 - 20187, n=11) | |
| Dell XPS 13 9315 2-in-1 Core i5-1230U | |
| Lenovo ThinkPad X12 20UVS03G00 | |
| AIDA64 / CPU AES | |
| Asus ROG Flow Z13 GZ301ZE | |
| Lenovo ThinkPad X12 20UVS03G00 | |
| Average of class Convertible (5271 - 190280, n=47, last 2 years) | |
| Microsoft Surface Pro 9, i7-1255U | |
| Microsoft Surface Pro 8, i7-1185G7 | |
| Average Intel Core i7-1255U (27900 - 67458, n=11) | |
| HP Elite Dragonfly Folio 13.5 G3 | |
| Dell XPS 13 9315 2-in-1 Core i5-1230U | |
| AIDA64 / CPU ZLib | |
| Asus ROG Flow Z13 GZ301ZE | |
| Average of class Convertible (218 - 2017, n=47, last 2 years) | |
| Microsoft Surface Pro 9, i7-1255U | |
| Average Intel Core i7-1255U (393 - 640, n=11) | |
| HP Elite Dragonfly Folio 13.5 G3 | |
| Dell XPS 13 9315 2-in-1 Core i5-1230U | |
| Microsoft Surface Pro 8, i7-1185G7 | |
| Lenovo ThinkPad X12 20UVS03G00 | |
| AIDA64 / FP64 Ray-Trace | |
| Average of class Convertible (1169 - 34297, n=47, last 2 years) | |
| Asus ROG Flow Z13 GZ301ZE | |
| Microsoft Surface Pro 9, i7-1255U | |
| Microsoft Surface Pro 8, i7-1185G7 | |
| HP Elite Dragonfly Folio 13.5 G3 | |
| Average Intel Core i7-1255U (2474 - 4400, n=11) | |
| Dell XPS 13 9315 2-in-1 Core i5-1230U | |
| Lenovo ThinkPad X12 20UVS03G00 | |
| AIDA64 / CPU PhotoWorxx | |
| Average of class Convertible (14193 - 85327, n=47, last 2 years) | |
| Microsoft Surface Pro 9, i7-1255U | |
| Asus ROG Flow Z13 GZ301ZE | |
| HP Elite Dragonfly Folio 13.5 G3 | |
| Microsoft Surface Pro 8, i7-1185G7 | |
| Lenovo ThinkPad X12 20UVS03G00 | |
| Dell XPS 13 9315 2-in-1 Core i5-1230U | |
| Average Intel Core i7-1255U (13899 - 44054, n=11) | |
系统性能
Surface Pro 9的主观性能非常好,所有输入都能实现,没有延迟或挂起。PCIe固态硬盘无疑要对此负责。合成基准中的性能也非常好。
CrossMark: Overall | Productivity | Creativity | Responsiveness
Jetstream 2: 2.0 Total
Speedometer 2.0: Result 2.0
WebXPRT 3: Overall
WebXPRT 4: Overall
| PCMark 10 / Score | |
| Average of class Convertible (3229 - 10123, n=45, last 2 years) | |
| Asus ROG Flow Z13 GZ301ZE | |
| HP Elite Dragonfly Folio 13.5 G3 | |
| Average Intel Core i7-1255U, Intel Iris Xe Graphics G7 96EUs (4676 - 5523, n=9) | |
| Microsoft Surface Pro 9, i7-1255U | |
| Microsoft Surface Pro 8, i7-1185G7 | |
| Dell XPS 13 9315 2-in-1 Core i5-1230U | |
| Lenovo ThinkPad X12 20UVS03G00 | |
| PCMark 10 / Essentials | |
| HP Elite Dragonfly Folio 13.5 G3 | |
| Asus ROG Flow Z13 GZ301ZE | |
| Average of class Convertible (7233 - 12222, n=45, last 2 years) | |
| Average Intel Core i7-1255U, Intel Iris Xe Graphics G7 96EUs (9381 - 11654, n=9) | |
| Dell XPS 13 9315 2-in-1 Core i5-1230U | |
| Microsoft Surface Pro 9, i7-1255U | |
| Lenovo ThinkPad X12 20UVS03G00 | |
| Microsoft Surface Pro 8, i7-1185G7 | |
| PCMark 10 / Productivity | |
| Average of class Convertible (5062 - 17914, n=45, last 2 years) | |
| Asus ROG Flow Z13 GZ301ZE | |
| HP Elite Dragonfly Folio 13.5 G3 | |
| Average Intel Core i7-1255U, Intel Iris Xe Graphics G7 96EUs (6530 - 7418, n=9) | |
| Dell XPS 13 9315 2-in-1 Core i5-1230U | |
| Microsoft Surface Pro 9, i7-1255U | |
| Microsoft Surface Pro 8, i7-1185G7 | |
| Lenovo ThinkPad X12 20UVS03G00 | |
| PCMark 10 / Digital Content Creation | |
| Average of class Convertible (2496 - 16551, n=45, last 2 years) | |
| Asus ROG Flow Z13 GZ301ZE | |
| HP Elite Dragonfly Folio 13.5 G3 | |
| Microsoft Surface Pro 9, i7-1255U | |
| Average Intel Core i7-1255U, Intel Iris Xe Graphics G7 96EUs (4498 - 6203, n=9) | |
| Microsoft Surface Pro 8, i7-1185G7 | |
| Dell XPS 13 9315 2-in-1 Core i5-1230U | |
| Lenovo ThinkPad X12 20UVS03G00 | |
| CrossMark / Overall | |
| Asus ROG Flow Z13 GZ301ZE | |
| HP Elite Dragonfly Folio 13.5 G3 | |
| Average of class Convertible (524 - 2274, n=48, last 2 years) | |
| Apple iPad Pro 12.9 2022 | |
| Microsoft Surface Pro 9, i7-1255U | |
| Average Intel Core i7-1255U, Intel Iris Xe Graphics G7 96EUs (1329 - 1573, n=9) | |
| Microsoft Surface Pro 8, i7-1185G7 | |
| Dell XPS 13 9315 2-in-1 Core i5-1230U | |
| CrossMark / Productivity | |
| Asus ROG Flow Z13 GZ301ZE | |
| HP Elite Dragonfly Folio 13.5 G3 | |
| Average of class Convertible (554 - 1942, n=48, last 2 years) | |
| Microsoft Surface Pro 9, i7-1255U | |
| Average Intel Core i7-1255U, Intel Iris Xe Graphics G7 96EUs (1364 - 1554, n=9) | |
| Apple iPad Pro 12.9 2022 | |
| Microsoft Surface Pro 8, i7-1185G7 | |
| Dell XPS 13 9315 2-in-1 Core i5-1230U | |
| CrossMark / Creativity | |
| Asus ROG Flow Z13 GZ301ZE | |
| Apple iPad Pro 12.9 2022 | |
| Average of class Convertible (550 - 2949, n=48, last 2 years) | |
| HP Elite Dragonfly Folio 13.5 G3 | |
| Microsoft Surface Pro 9, i7-1255U | |
| Average Intel Core i7-1255U, Intel Iris Xe Graphics G7 96EUs (1372 - 1660, n=9) | |
| Microsoft Surface Pro 8, i7-1185G7 | |
| Dell XPS 13 9315 2-in-1 Core i5-1230U | |
| CrossMark / Responsiveness | |
| Asus ROG Flow Z13 GZ301ZE | |
| HP Elite Dragonfly Folio 13.5 G3 | |
| Average of class Convertible (381 - 1719, n=48, last 2 years) | |
| Microsoft Surface Pro 9, i7-1255U | |
| Average Intel Core i7-1255U, Intel Iris Xe Graphics G7 96EUs (1117 - 1434, n=9) | |
| Dell XPS 13 9315 2-in-1 Core i5-1230U | |
| Apple iPad Pro 12.9 2022 | |
| Microsoft Surface Pro 8, i7-1185G7 | |
| Jetstream 2 / 2.0 Total | |
| Average of class Convertible (127.2 - 454, n=15, last 2 years) | |
| Microsoft Surface Pro 9, i7-1255U | |
| Average Intel Core i7-1255U, Intel Iris Xe Graphics G7 96EUs (206 - 249, n=7) | |
| Dell XPS 13 9315 2-in-1 Core i5-1230U | |
| Apple iPad Pro 12.9 2022 | |
| Asus ROG Flow Z13 GZ301ZE | |
| Microsoft Surface Pro 8, i7-1185G7 | |
| Lenovo ThinkPad X12 20UVS03G00 | |
| Speedometer 2.0 / Result 2.0 | |
| Average of class Convertible (168.2 - 644, n=12, last 2 years) | |
| Apple iPad Pro 12.9 2022 | |
| Average Intel Core i7-1255U, Intel Iris Xe Graphics G7 96EUs (222 - 299, n=5) | |
| Microsoft Surface Pro 9, i7-1255U | |
| Microsoft Surface Pro 8, i7-1185G7 | |
| Asus ROG Flow Z13 GZ301ZE | |
| WebXPRT 3 / Overall | |
| Apple iPad Pro 12.9 2022 | |
| Asus ROG Flow Z13 GZ301ZE | |
| Average of class Convertible (171 - 426, n=48, last 2 years) | |
| HP Elite Dragonfly Folio 13.5 G3 | |
| Average Intel Core i7-1255U, Intel Iris Xe Graphics G7 96EUs (200 - 366, n=9) | |
| Microsoft Surface Pro 9, i7-1255U | |
| Microsoft Surface Pro 8, i7-1185G7 | |
| Dell XPS 13 9315 2-in-1 Core i5-1230U | |
| Lenovo ThinkPad X12 20UVS03G00 | |
| WebXPRT 4 / Overall | |
| Average of class Convertible (91.2 - 317, n=47, last 2 years) | |
| HP Elite Dragonfly Folio 13.5 G3 | |
| Average Intel Core i7-1255U, Intel Iris Xe Graphics G7 96EUs (183.4 - 249, n=9) | |
| Microsoft Surface Pro 9, i7-1255U | |
| Apple iPad Pro 12.9 2022 | |
| Dell XPS 13 9315 2-in-1 Core i5-1230U | |
| PCMark 10 Score | 5257 points | |
Help | ||
| AIDA64 / Memory Copy | |
| Average of class Convertible (23880 - 161475, n=47, last 2 years) | |
| Asus ROG Flow Z13 GZ301ZE | |
| Microsoft Surface Pro 9, i7-1255U | |
| HP Elite Dragonfly Folio 13.5 G3 | |
| Dell XPS 13 9315 2-in-1 Core i5-1230U | |
| Microsoft Surface Pro 8, i7-1185G7 | |
| Lenovo ThinkPad X12 20UVS03G00 | |
| Average Intel Core i7-1255U (22846 - 67017, n=11) | |
| AIDA64 / Memory Read | |
| Average of class Convertible (19931 - 131960, n=47, last 2 years) | |
| Asus ROG Flow Z13 GZ301ZE | |
| HP Elite Dragonfly Folio 13.5 G3 | |
| Microsoft Surface Pro 9, i7-1255U | |
| Microsoft Surface Pro 8, i7-1185G7 | |
| Lenovo ThinkPad X12 20UVS03G00 | |
| Dell XPS 13 9315 2-in-1 Core i5-1230U | |
| Average Intel Core i7-1255U (22877 - 67398, n=11) | |
| AIDA64 / Memory Write | |
| Average of class Convertible (17473 - 216896, n=47, last 2 years) | |
| HP Elite Dragonfly Folio 13.5 G3 | |
| Dell XPS 13 9315 2-in-1 Core i5-1230U | |
| Asus ROG Flow Z13 GZ301ZE | |
| Microsoft Surface Pro 9, i7-1255U | |
| Lenovo ThinkPad X12 20UVS03G00 | |
| Microsoft Surface Pro 8, i7-1185G7 | |
| Average Intel Core i7-1255U (22883 - 65839, n=11) | |
| AIDA64 / Memory Latency | |
| Average of class Convertible (6.9 - 536, n=47, last 2 years) | |
| HP Elite Dragonfly Folio 13.5 G3 | |
| Asus ROG Flow Z13 GZ301ZE | |
| Dell XPS 13 9315 2-in-1 Core i5-1230U | |
| Microsoft Surface Pro 9, i7-1255U | |
| Microsoft Surface Pro 8, i7-1185G7 | |
| Lenovo ThinkPad X12 20UVS03G00 | |
| Average Intel Core i7-1255U (76 - 163.2, n=11) | |
* ... smaller is better
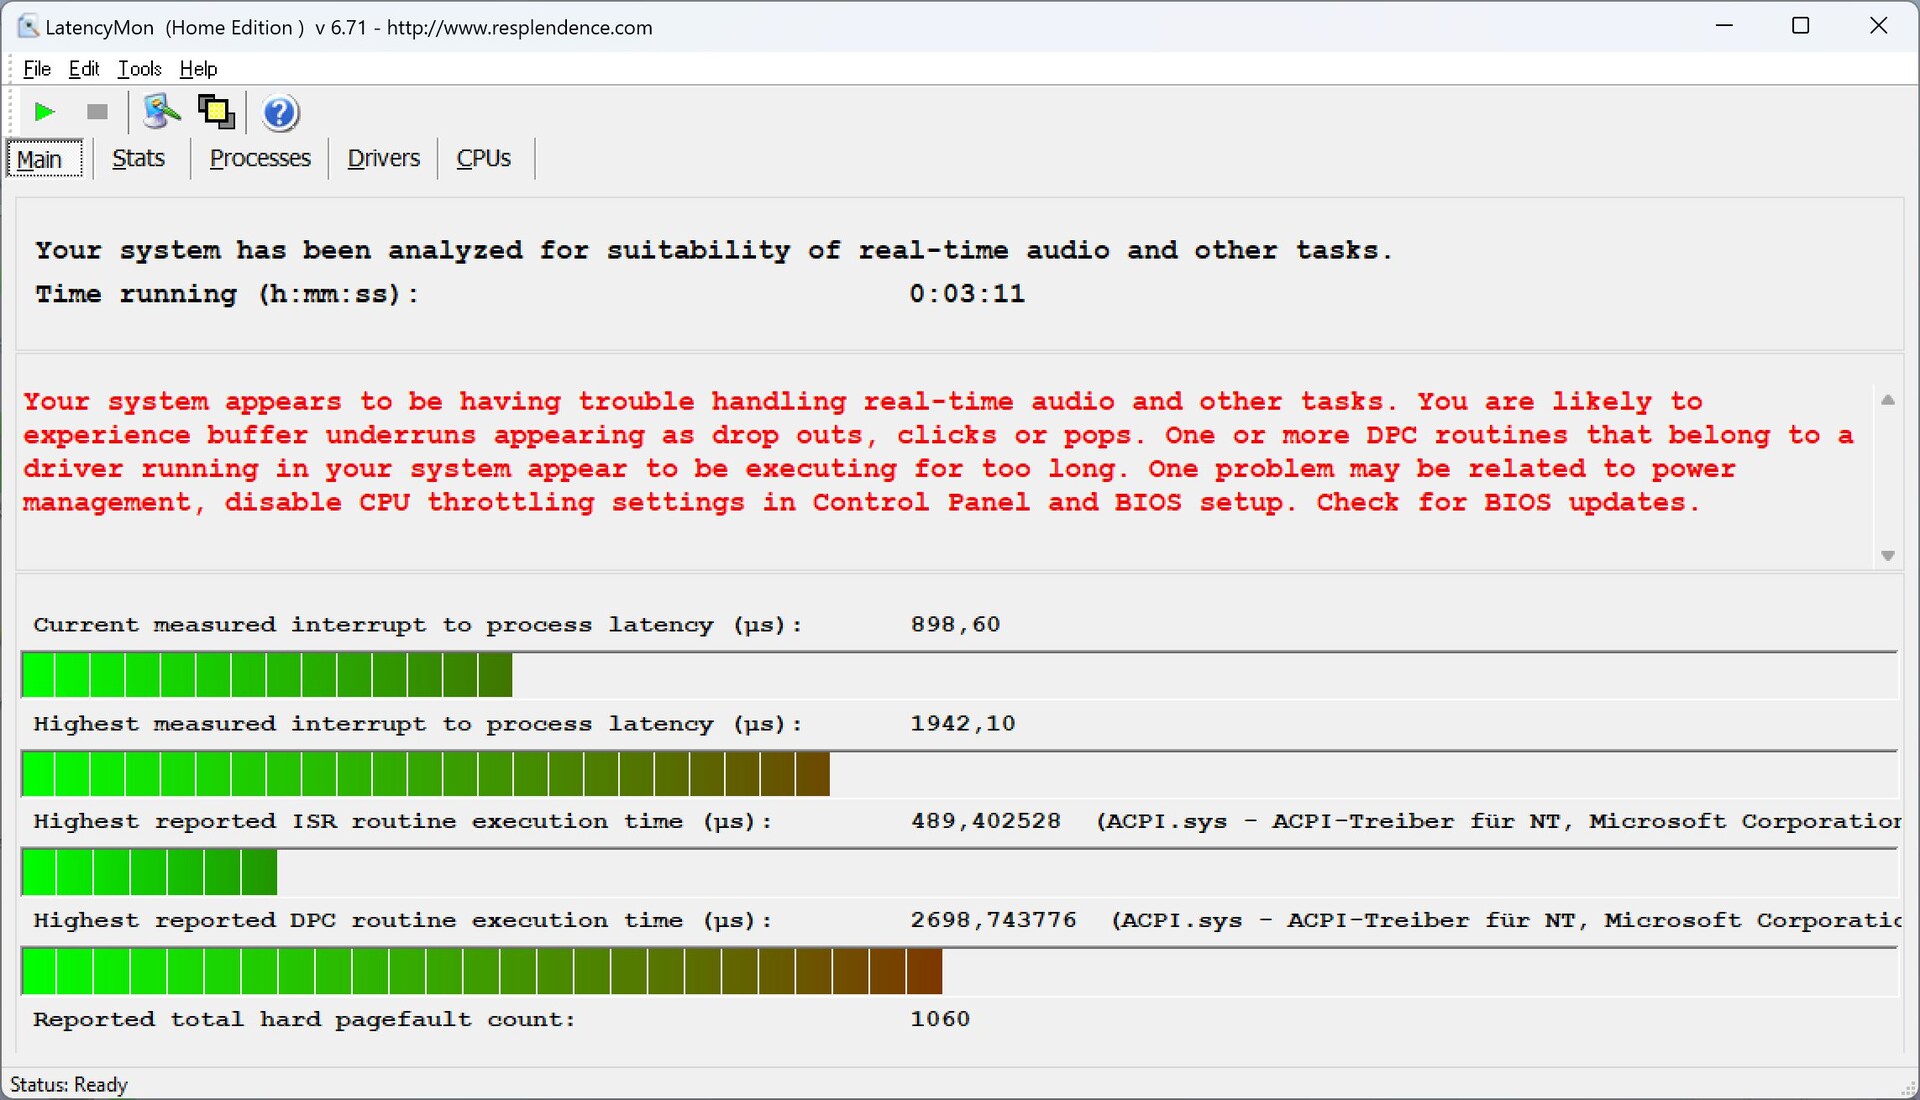
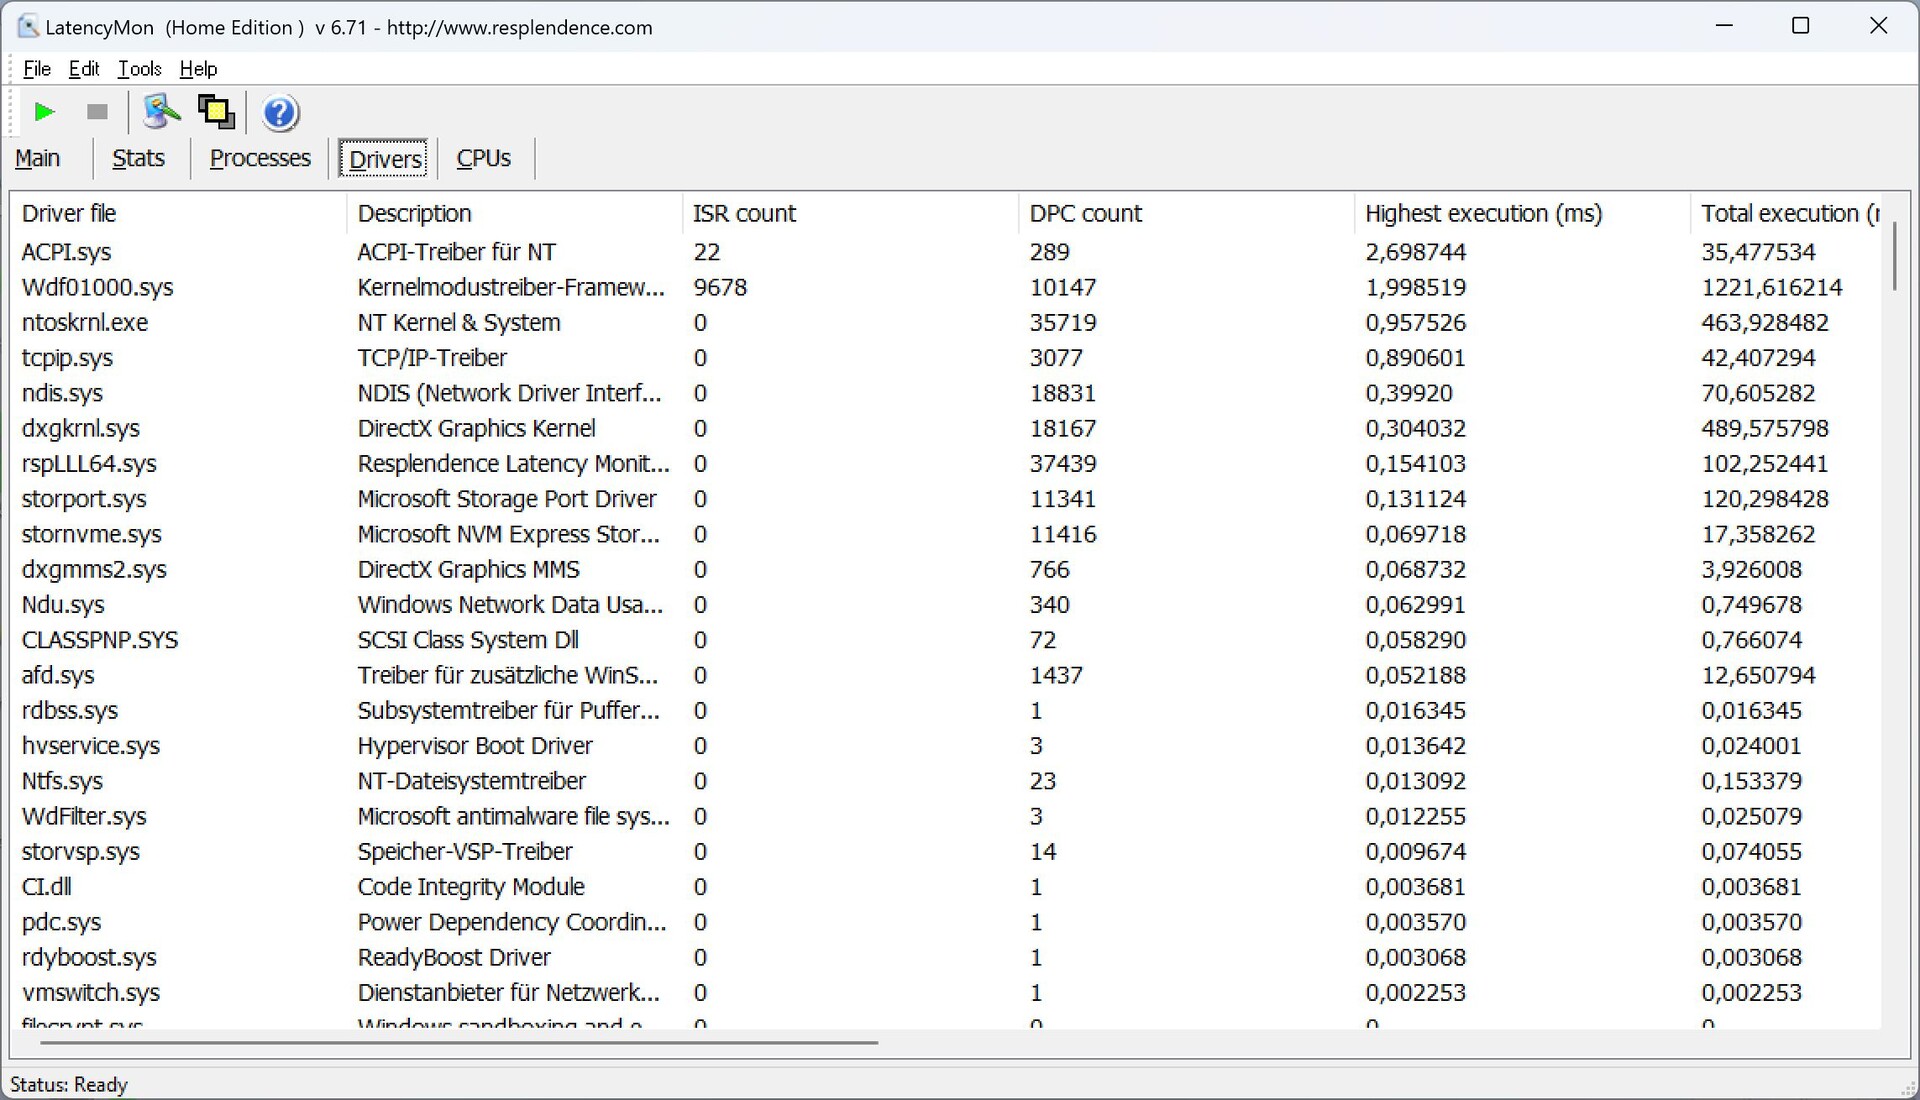
DPC延时
在我们的标准化延迟测试中(网页浏览、YouTube 4K播放、CPU负载),当前BIOS版本的新Surface Pro 9的表现比其前代产品因此只是有条件地适用于实时音频应用。
| DPC Latencies / LatencyMon - interrupt to process latency (max), Web, Youtube, Prime95 | |
| HP Elite Dragonfly Folio 13.5 G3 | |
| Dell XPS 13 9315 2-in-1 Core i5-1230U | |
| Microsoft Surface Pro 9, i7-1255U | |
| Asus ROG Flow Z13 GZ301ZE | |
| Microsoft Surface Pro 8, i7-1185G7 | |
| Lenovo ThinkPad X12 20UVS03G00 | |
* ... smaller is better
存储设备
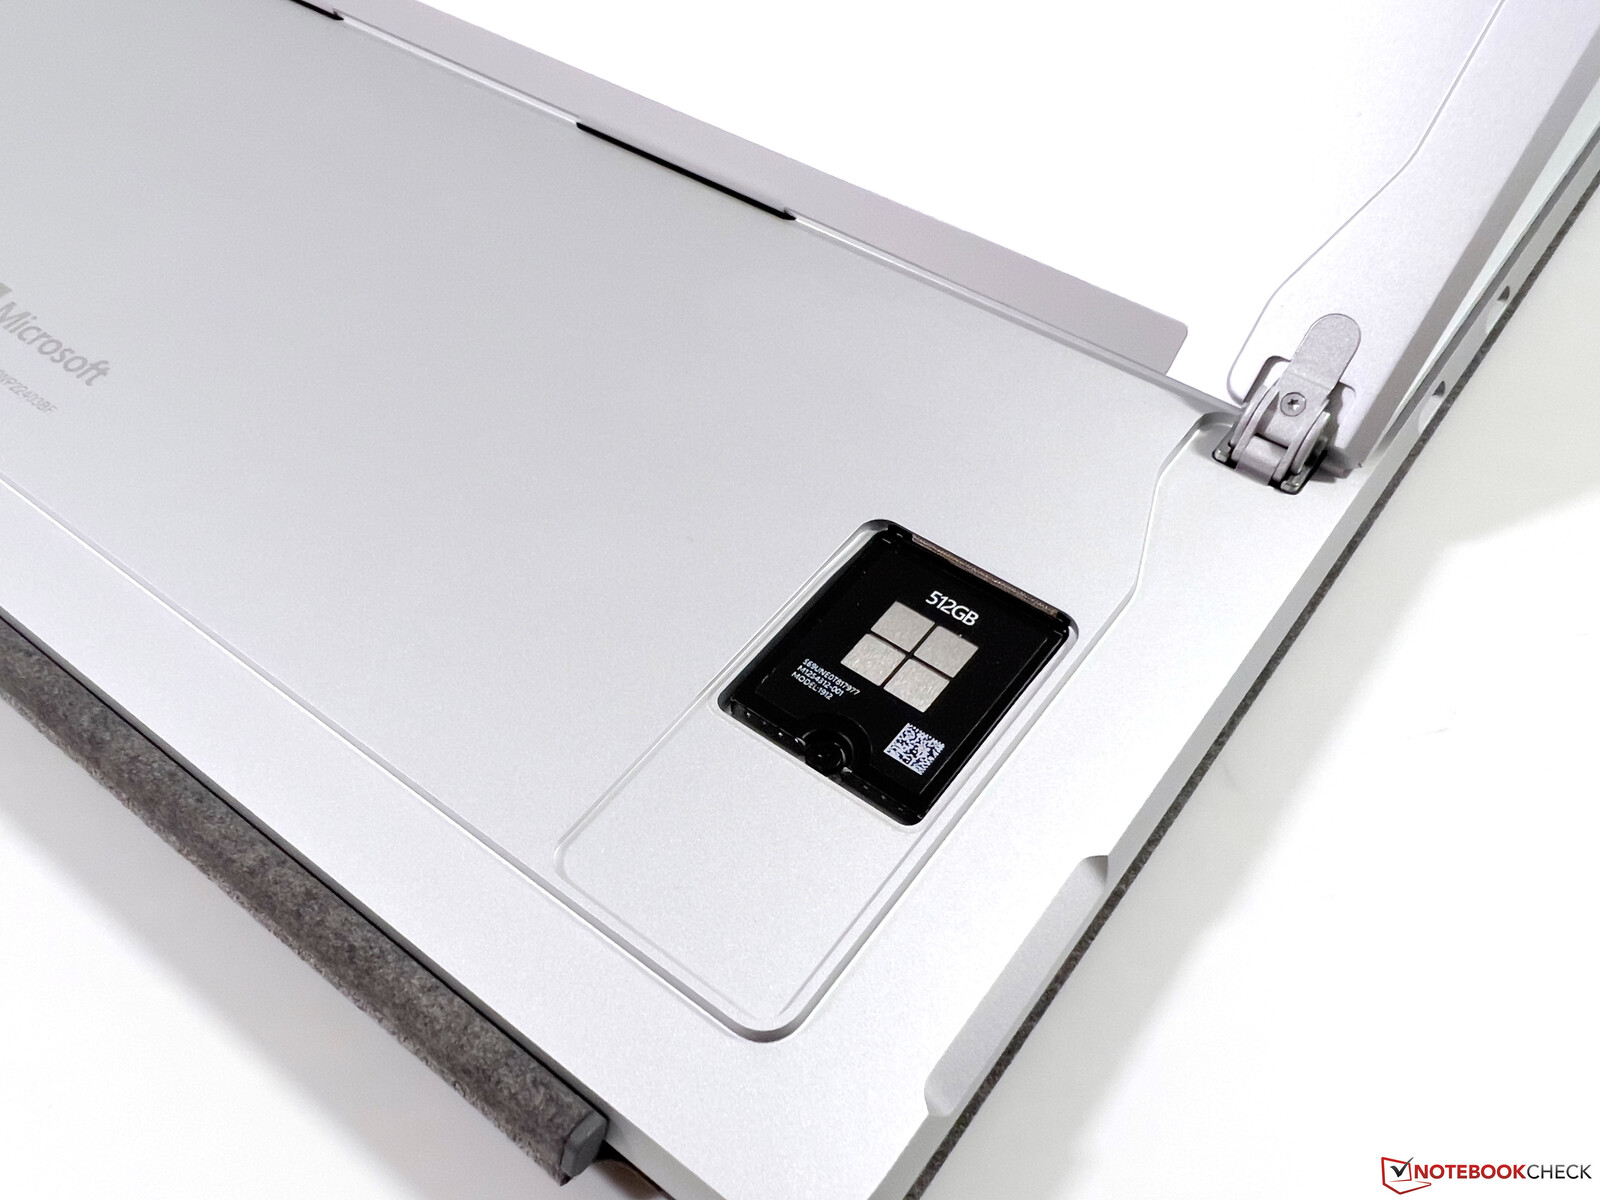
微软仍然使用紧凑的M.2-2230固态硬盘,这些设备也可以由用户更换。我们的评测样本中使用了三星的512GB驱动器,根据微软工具,它似乎是通过PCIe 4.0连接的。然而,最大传输率被限制在3.4GB/s左右,我们不知道到底是固态硬盘还是Surface Pro在这里的原因。话又说回来,这在日常使用中并不发挥主要作用,速度完全足够。在512GB中,安装操作系统后仍有429GB可用。更多的SSD基准测试列在我们的技术部分.

* ... smaller is better
Dauerleistung Lesen: DiskSpd Read Loop, Queue Depth 8
图形卡
英特尔的Alder Lake CPU仍然配备了著名的Iris Xe Graphics G7.结合酷睿i5 1235U,使用的是具有80个执行单元的芯片;在我们与酷睿i7的评测样本中,我们使用的是具有96个EU的更快芯片。在性能方面,与旧型号没有区别,来自AMD和Apple 的集成GPU明显更快(尽管目前实际上没有可与AMD硬件相比的转换器/平板电脑)。
其性能完全可以满足日常使用,高分辨率视频的运行也没有问题,但游戏通常被限制在最低或中等细节和降低分辨率。那些热衷于游戏的人可以连接一个外部GPU,或者应该看看ROG Flow Z13,它提供了更多的游戏性能,其 RTX 3050.
至少在长时间游戏过程中,GPU性能保持稳定。然而,在电池供电时,性能下降了约75%。更多的GPU基准测试可在这里.
| 3DMark 11 Performance | 6903 points | |
| 3DMark Fire Strike Score | 4873 points | |
| 3DMark Time Spy Score | 1821 points | |
Help | ||
* ... smaller is better
| The Witcher 3 - 1920x1080 Ultra Graphics & Postprocessing (HBAO+) | |
| Average of class Convertible (13.4 - 101, n=3, last 2 years) | |
| Asus ROG Flow Z13 GZ301ZE | |
| Microsoft Surface Pro 8, i7-1185G7 | |
| HP Elite Dragonfly Folio 13.5 G3 | |
| Microsoft Surface Pro 9, i7-1255U | |
| Dell XPS 13 9315 2-in-1 Core i5-1230U | |
| Final Fantasy XV Benchmark - 1920x1080 High Quality | |
| Asus ROG Flow Z13 GZ301ZE | |
| Average of class Convertible (4.48 - 86.6, n=44, last 2 years) | |
| Microsoft Surface Pro 8, i7-1185G7 | |
| Microsoft Surface Pro 9, i7-1255U | |
| HP Elite Dragonfly Folio 13.5 G3 | |
| Strange Brigade - 1920x1080 ultra AA:ultra AF:16 | |
| Asus ROG Flow Z13 GZ301ZE | |
| Average of class Convertible (10.8 - 176.8, n=44, last 2 years) | |
| Microsoft Surface Pro 8, i7-1185G7 | |
| Microsoft Surface Pro 9, i7-1255U | |
| HP Elite Dragonfly Folio 13.5 G3 | |
Witcher 3 FPS Chart
| low | med. | high | ultra | |
|---|---|---|---|---|
| GTA V (2015) | 104.3 | 93.1 | 24.7 | 10.6 |
| The Witcher 3 (2015) | 91 | 59 | 33 | 12.8 |
| Dota 2 Reborn (2015) | 104.2 | 82.2 | 64.8 | 57 |
| Final Fantasy XV Benchmark (2018) | 42.9 | 24.2 | 16.8 | |
| X-Plane 11.11 (2018) | 46.3 | 36.6 | 31.6 | |
| Far Cry 5 (2018) | 28 | 24 | 20 | |
| Strange Brigade (2018) | 88.9 | 41.7 | 32.5 | 26.2 |
| F1 2021 (2021) | 107.8 | 51.6 | 40.6 | 27.8 |
| Farming Simulator 22 (2021) | 81 | 37 | 28 | 26 |
| F1 22 (2022) | 47.4 | 43.5 | 30.7 |
排放 - 更快的CPU会导致更多的风扇活动
噪声
Surface Pro 9的风扇在最大速度下与旧版Surface Pro 8相当,在满负荷时达到近42 dB(A)。这个小风扇明显可以听到,但更有问题的是,由于高功率限制,风扇在日常使用中更频繁地启动。因此,你应该为简单的任务选择一个较弱的能源模式,那么在普通的使用中,可折叠机可以保持较长时间的安静。没有发现其他电子噪音。这两台 XPS 13 9315和 iPad Pro在这里都有明显的优势,当然,因为它们是被动冷却的,因此保持安静。
Noise level
| Idle |
| 24.3 / 24.3 / 24.3 dB(A) |
| Load |
| 37.9 / 41.8 dB(A) |
 | ||
30 dB silent 40 dB(A) audible 50 dB(A) loud |
||
min: | ||
| Microsoft Surface Pro 9, i7-1255U Iris Xe G7 96EUs, i7-1255U, Samsung MZ9L4512HBLU-00BMV | Dell XPS 13 9315 2-in-1 Core i5-1230U Iris Xe G7 80EUs, i5-1230U | Lenovo ThinkPad X12 20UVS03G00 Iris Xe G7 96EUs, i7-1160G7, Toshiba BG4 KBG40ZNT512G | HP Elite Dragonfly Folio 13.5 G3 Iris Xe G7 96EUs, i7-1265U, Samsung PM9A1 MZVL2512HCJQ | Apple iPad Pro 12.9 2022 M2 10-Core GPU, M2, 128 GB NVMe | Asus ROG Flow Z13 GZ301ZE GeForce RTX 3050 Ti Laptop GPU, i9-12900H, Micron 2450 1TB MTFDKBK1T0TFK | Microsoft Surface Pro 8, i7-1185G7 Iris Xe G7 96EUs, i7-1185G7, Toshiba KBG40ZNS256G NVMe | |
|---|---|---|---|---|---|---|---|
| Noise | 2% | 8% | -2% | -0% | |||
| off / environment * (dB) | 24.3 | 25.1 -3% | 24.6 -1% | 24.5 -1% | 24.7 -2% | ||
| Idle Minimum * (dB) | 24.3 | 25.1 -3% | 24.6 -1% | 24.5 -1% | 24.7 -2% | ||
| Idle Average * (dB) | 24.3 | 25.1 -3% | 24.6 -1% | 24.5 -1% | 24.7 -2% | ||
| Idle Maximum * (dB) | 24.3 | 26 -7% | 24.6 -1% | 24.5 -1% | 24.7 -2% | ||
| Load Average * (dB) | 37.9 | 34.6 9% | 27.8 27% | 41 -8% | 36.8 3% | ||
| Witcher 3 ultra * (dB) | 39.6 | 34.6 13% | 33.4 16% | 41 -4% | 36.8 7% | ||
| Load Maximum * (dB) | 41.8 | 37 11% | 33.4 20% | 41 2% | 43.8 -5% |
* ... smaller is better
温度
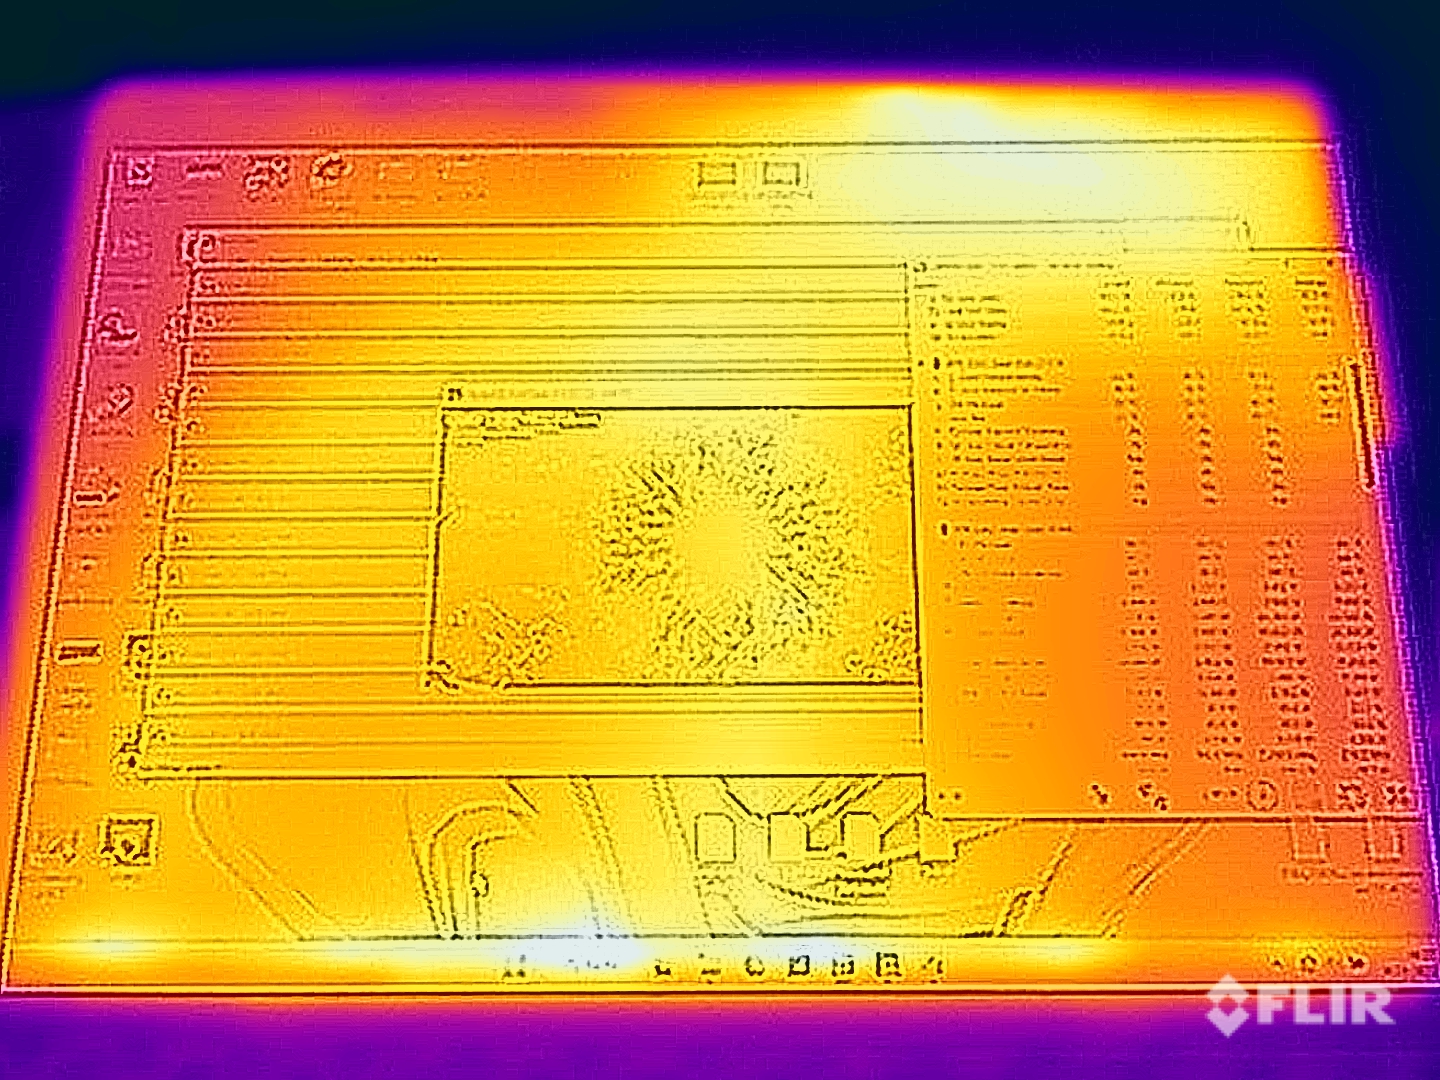
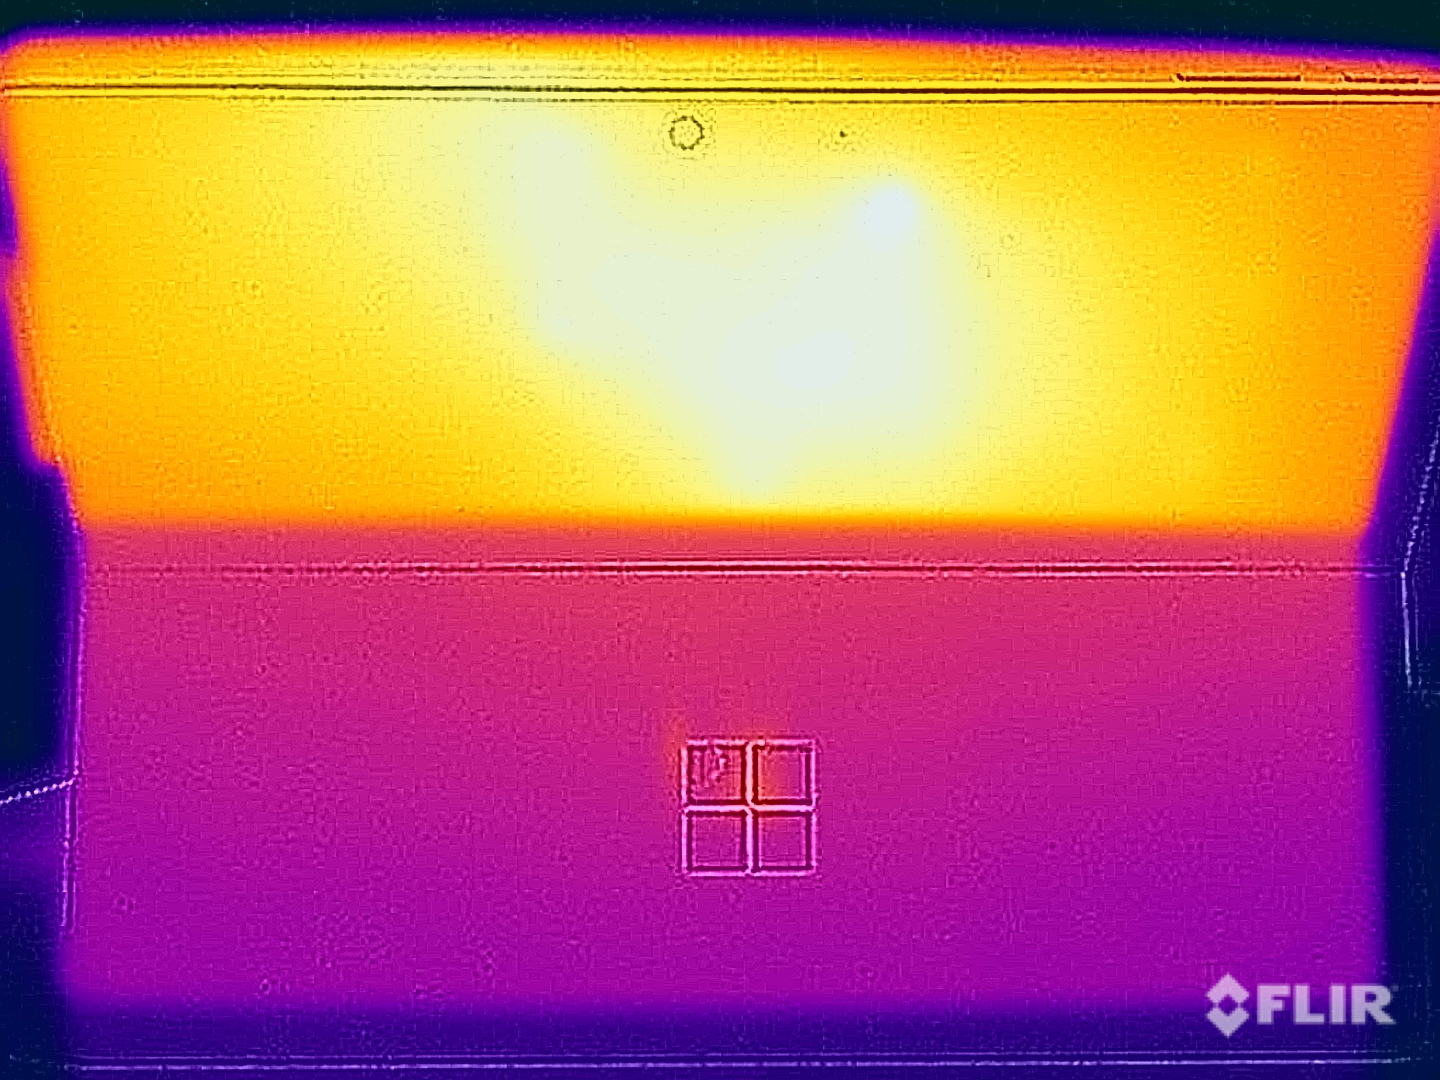
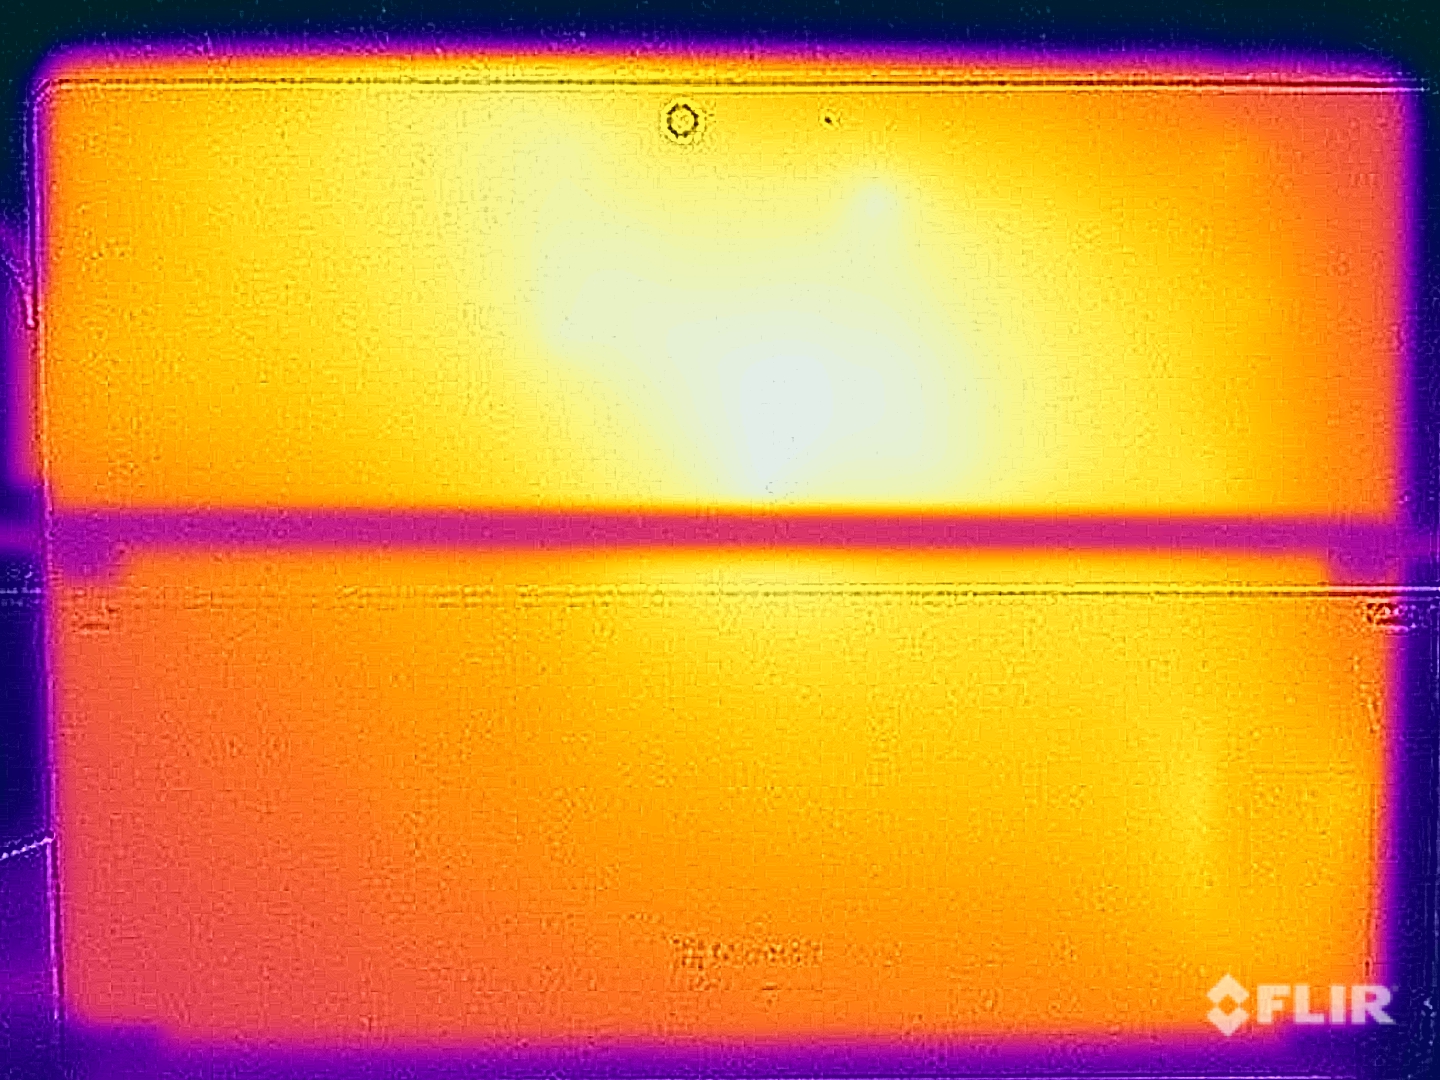
Surface Pro 9的金属外壳在日常使用和轻度任务中几乎不发热,但我们在高负荷情况下(例如CPU高负荷或游戏时)测得背面温度超过45℃。由于金属表面,这种感觉令人不快,在这种情况下,你不应该用手握住设备,而应该把它放在大腿或桌子上。
压力测试显示出与纯CPU负载时相同的行为。在达到60瓦的峰值后,处理器在几分钟内保持在35瓦,然后稳定在22瓦。值得注意的是,微软甚至超过了(英特尔)为Alder Lake-U CPU规定的55瓦的最大消耗。
(±) The maximum temperature on the upper side is 44.6 °C / 112 F, compared to the average of 35.4 °C / 96 F, ranging from 19.6 to 60 °C for the class Convertible.
(-) The bottom heats up to a maximum of 45.9 °C / 115 F, compared to the average of 36.9 °C / 98 F
(+) In idle usage, the average temperature for the upper side is 24.6 °C / 76 F, compared to the device average of 30.3 °C / 87 F.
(-) Playing The Witcher 3, the average temperature for the upper side is 41.5 °C / 107 F, compared to the device average of 30.3 °C / 87 F.
(-) The palmrests and touchpad can get very hot to the touch with a maximum of 42.6 °C / 108.7 F.
(-) The average temperature of the palmrest area of similar devices was 28 °C / 82.4 F (-14.6 °C / -26.3 F).
| Microsoft Surface Pro 9, i7-1255U Intel Core i7-1255U, Intel Iris Xe Graphics G7 96EUs | Dell XPS 13 9315 2-in-1 Core i5-1230U Intel Core i5-1230U, Intel Iris Xe Graphics G7 80EUs | Lenovo ThinkPad X12 20UVS03G00 Intel Core i7-1160G7, Intel Iris Xe Graphics G7 96EUs | HP Elite Dragonfly Folio 13.5 G3 Intel Core i7-1265U, Intel Iris Xe Graphics G7 96EUs | Apple iPad Pro 12.9 2022 Apple M2, Apple M2 10-Core GPU | Asus ROG Flow Z13 GZ301ZE Intel Core i9-12900H, NVIDIA GeForce RTX 3050 Ti Laptop GPU | Microsoft Surface Pro 8, i7-1185G7 Intel Core i7-1185G7, Intel Iris Xe Graphics G7 96EUs | |
|---|---|---|---|---|---|---|---|
| Heat | 1% | 5% | 14% | -3% | -11% | 2% | |
| Maximum Upper Side * (°C) | 44.6 | 41.8 6% | 39 13% | 32.8 26% | 36.9 17% | 45.3 -2% | 45 -1% |
| Maximum Bottom * (°C) | 45.9 | 38.2 17% | 41.7 9% | 33.4 27% | 37.6 18% | 48.3 -5% | 47.2 -3% |
| Idle Upper Side * (°C) | 24.8 | 27.4 -10% | 25.6 -3% | 24.6 1% | 31.9 -29% | 29.2 -18% | 24.1 3% |
| Idle Bottom * (°C) | 25.3 | 27.2 -8% | 25.6 -1% | 24.6 3% | 29.4 -16% | 30 -19% | 23.4 8% |
* ... smaller is better
发言人
两个立体声扬声器(2瓦)仍然非常好,听起来很有体积感。然而,你不应该在低音方面期望太多,这对这个设备类别来说通常是真实的(例如,也适用于iPad Pro的扬声器)。iPad Pro).
Microsoft Surface Pro 9, i7-1255U audio analysis
(±) | speaker loudness is average but good (79.4 dB)
Bass 100 - 315 Hz
(±) | reduced bass - on average 11.7% lower than median
(±) | linearity of bass is average (8.8% delta to prev. frequency)
Mids 400 - 2000 Hz
(±) | higher mids - on average 5.1% higher than median
(+) | mids are linear (3% delta to prev. frequency)
Highs 2 - 16 kHz
(+) | balanced highs - only 4% away from median
(+) | highs are linear (3.4% delta to prev. frequency)
Overall 100 - 16.000 Hz
(+) | overall sound is linear (14.9% difference to median)
Compared to same class
» 24% of all tested devices in this class were better, 5% similar, 72% worse
» The best had a delta of 6%, average was 20%, worst was 57%
Compared to all devices tested
» 20% of all tested devices were better, 4% similar, 76% worse
» The best had a delta of 4%, average was 23%, worst was 134%
Apple iPad Pro 12.9 2022 audio analysis
(+) | speakers can play relatively loud (84.3 dB)
Bass 100 - 315 Hz
(±) | reduced bass - on average 9.6% lower than median
(±) | linearity of bass is average (9% delta to prev. frequency)
Mids 400 - 2000 Hz
(+) | balanced mids - only 2.4% away from median
(+) | mids are linear (3.4% delta to prev. frequency)
Highs 2 - 16 kHz
(+) | balanced highs - only 1.5% away from median
(+) | highs are linear (3.2% delta to prev. frequency)
Overall 100 - 16.000 Hz
(+) | overall sound is linear (8.8% difference to median)
Compared to same class
» 2% of all tested devices in this class were better, 2% similar, 96% worse
» The best had a delta of 7%, average was 20%, worst was 129%
Compared to all devices tested
» 3% of all tested devices were better, 1% similar, 97% worse
» The best had a delta of 4%, average was 23%, worst was 134%
Dell XPS 13 9315 2-in-1 Core i5-1230U audio analysis
(±) | speaker loudness is average but good (80.3 dB)
Bass 100 - 315 Hz
(±) | reduced bass - on average 8.9% lower than median
(+) | bass is linear (5.7% delta to prev. frequency)
Mids 400 - 2000 Hz
(+) | balanced mids - only 2.2% away from median
(+) | mids are linear (5.2% delta to prev. frequency)
Highs 2 - 16 kHz
(±) | higher highs - on average 5.5% higher than median
(+) | highs are linear (6.8% delta to prev. frequency)
Overall 100 - 16.000 Hz
(+) | overall sound is linear (11.9% difference to median)
Compared to same class
» 11% of all tested devices in this class were better, 3% similar, 85% worse
» The best had a delta of 6%, average was 20%, worst was 57%
Compared to all devices tested
» 9% of all tested devices were better, 2% similar, 89% worse
» The best had a delta of 4%, average was 23%, worst was 134%
电源管理--120赫兹耗费电池寿命
消耗功率
我们还在60赫兹模式下进行了功率测量,但5.1至11.3瓦的空闲值比旧型号的略高。负载下的数值相似,但处理器的高功率限制在满载时变得很明显,因为我们在最初的~30秒内达到了电源的极限68瓦。在这里,设备不得不短暂地利用电池来提供所需的能量。之后,消耗量在较低的数值上趋于平稳(先是~58瓦,然后是~46瓦),所以60瓦的电源在实践中仍然是足够的。
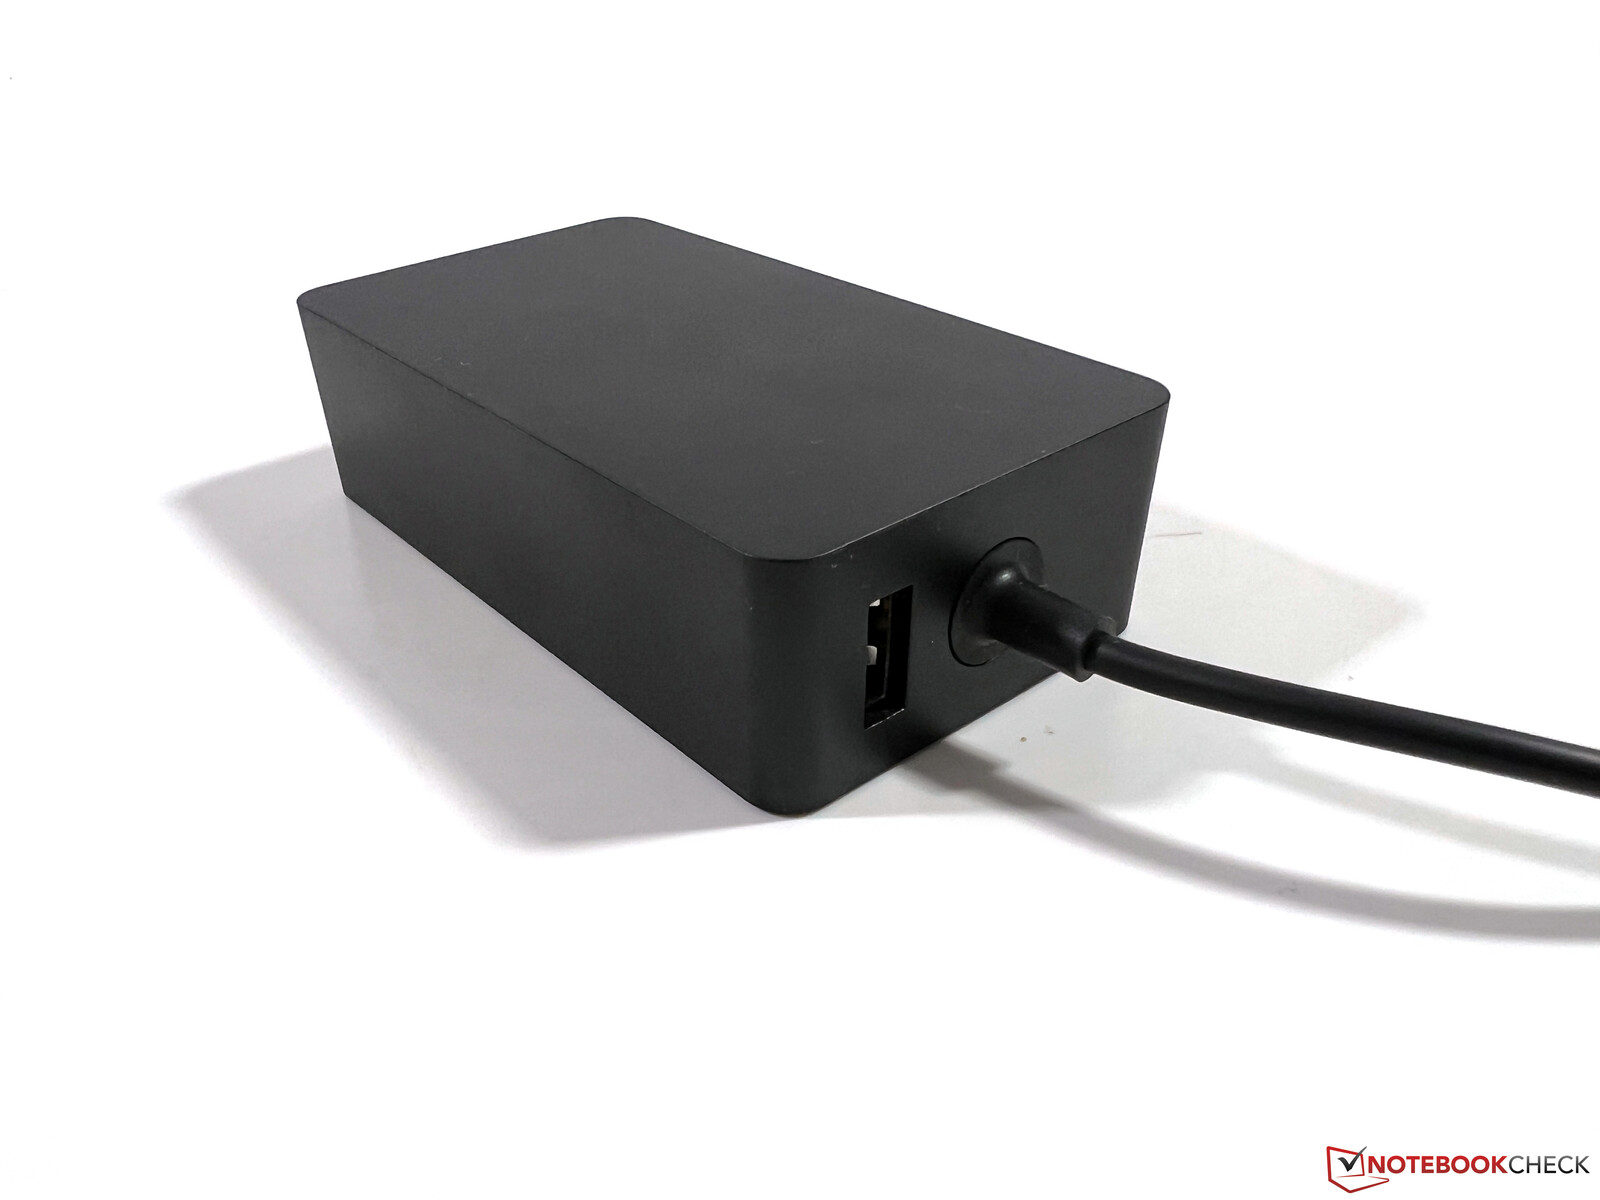
微软能够降低关机和待机时的功耗。该电源还提供一个USB-A端口,可以用来给智能手机充电,例如(最大5瓦)。
| Off / Standby | |
| Idle | |
| Load |
|
Key:
min: | |
| Microsoft Surface Pro 9, i7-1255U i7-1255U, Iris Xe G7 96EUs, Samsung MZ9L4512HBLU-00BMV, IPS, 2880x1920, 13" | Dell XPS 13 9315 2-in-1 Core i5-1230U i5-1230U, Iris Xe G7 80EUs, , IPS, 2880x1920, 13" | Lenovo ThinkPad X12 20UVS03G00 i7-1160G7, Iris Xe G7 96EUs, Toshiba BG4 KBG40ZNT512G, a-Si IPS LED, 1920x1280, 12.3" | HP Elite Dragonfly Folio 13.5 G3 i7-1265U, Iris Xe G7 96EUs, Samsung PM9A1 MZVL2512HCJQ, IPS, 1920x1280, 13.5" | Apple iPad Pro 12.9 2022 M2, M2 10-Core GPU, 128 GB NVMe, Mini-LED, 2732x2048, 12.9" | Asus ROG Flow Z13 GZ301ZE i9-12900H, GeForce RTX 3050 Ti Laptop GPU, Micron 2450 1TB MTFDKBK1T0TFK, IPS, 1920x1200, 13.4" | Microsoft Surface Pro 8, i7-1185G7 i7-1185G7, Iris Xe G7 96EUs, Toshiba KBG40ZNS256G NVMe, IPS, 2880x1920, 13" | Average Intel Iris Xe Graphics G7 96EUs | Average of class Convertible | |
|---|---|---|---|---|---|---|---|---|---|
| Power Consumption | 22% | 26% | 19% | 36% | -54% | 7% | 3% | 16% | |
| Idle Minimum * (Watt) | 5.1 | 5.2 -2% | 4 22% | 3.4 33% | 2.54 50% | 8.8 -73% | 3.9 24% | 5.51 ? -8% | 4.2 ? 18% |
| Idle Average * (Watt) | 9.8 | 7.9 19% | 5.9 40% | 4.9 50% | 11.24 -15% | 12.1 -23% | 8.5 13% | 8.66 ? 12% | 6.89 ? 30% |
| Idle Maximum * (Watt) | 11.3 | 8 29% | 8.3 27% | 9.3 18% | 11.48 -2% | 12.7 -12% | 9.8 13% | 10.9 ? 4% | 8.63 ? 24% |
| Load Average * (Watt) | 47.5 | 31.2 34% | 30.1 37% | 41.9 12% | 12.97 73% | 72.3 -52% | 48 -1% | 45.6 ? 4% | 44.1 ? 7% |
| Witcher 3 ultra * (Watt) | 36 | 28.2 22% | 30.8 14% | 36.4 -1% | 77.3 -115% | 41.5 -15% | |||
| Load Maximum * (Watt) | 68.5 | 47.6 31% | 59 14% | 67.5 1% | 16.6 76% | 103.1 -51% | 63 8% | 67.8 ? 1% | 66.5 ? 3% |
* ... smaller is better
Power Consumption Witcher 3 / Stress Test
Power Consumption with an External Monitor
电池寿命
微软已经将电池容量从51.5Wh减少到47.7Wh,但总体而言,运行时间与旧的 Surface Pro 8。在150cd/m²的亮度下(相当于评测设备上最大亮度的62%)。在视频测试中,几乎可以达到9.5小时,而Wi-Fi测试为7.5小时。我们的Wi-Fi测试在最大亮度下运行的时间刚刚超过5小时。
只要你切换到120赫兹模式,运行时间再次明显下降。我们在下表中列出了三种情况下的数值。因此,在路上时,你应该避免使用120赫兹模式。
| WLAN测试最大亮度 | WLAN测试150cd/m² | 视频测试 | |
|---|---|---|---|
| 60 Hz | 314 分钟 | 451 分钟 | 562 分钟 |
| 120 Hz | 274分钟 | 369分钟 | 529分钟 |
与其竞争对手相比,Surface Pro 9仅领先于华硕ROG Flow Z13游戏机,但所有其他竞争对手提供了更多的耐力。在设备开启的情况下,充满电需要2小时左右,而21分钟后可达到35%,63分钟左右可达到80%。
注:微软的电池寿命要求明显更高,典型使用时间可达15.5小时,但也包括待机模式下的时间。
| Microsoft Surface Pro 9, i7-1255U i7-1255U, Iris Xe G7 96EUs, 47.7 Wh | Dell XPS 13 9315 2-in-1 Core i5-1230U i5-1230U, Iris Xe G7 80EUs, 49.5 Wh | Lenovo ThinkPad X12 20UVS03G00 i7-1160G7, Iris Xe G7 96EUs, 42 Wh | HP Elite Dragonfly Folio 13.5 G3 i7-1265U, Iris Xe G7 96EUs, 53 Wh | Apple iPad Pro 12.9 2022 M2, M2 10-Core GPU, 40.88 Wh | Asus ROG Flow Z13 GZ301ZE i9-12900H, GeForce RTX 3050 Ti Laptop GPU, 56 Wh | Microsoft Surface Pro 8, i7-1185G7 i7-1185G7, Iris Xe G7 96EUs, 51.5 Wh | Average of class Convertible | |
|---|---|---|---|---|---|---|---|---|
| Battery runtime | 32% | 19% | 56% | 67% | -25% | -2% | 47% | |
| H.264 (h) | 9.4 | 10 6% | 13.6 45% | 6 -36% | 10.1 7% | 15 ? 60% | ||
| WiFi v1.3 (h) | 7.5 | 9 20% | 8.2 9% | 9.4 25% | 11.2 49% | 5.6 -25% | 7.6 1% | 12 ? 60% |
| Load (h) | 1.4 | 2 43% | 2 43% | 2.6 86% | 2.9 107% | 1.2 -14% | 1.2 -14% | 1.713 ? 22% |
| Witcher 3 ultra (h) | 0.8 |
Pros
Cons
结论:Surface Pro 9有更多的力量,但失去了一些功能

从外观上看,新的Surface Pro 9看起来更像是一个带有新处理器的小升级。然而,在细节上,微软做了一些改变,而且不是所有的改变都是积极的。首先,我们应该提到,由于采用了新的Alder Lake-U处理器,CPU性能明显提高。然而,这里仍然浪费了一些潜力,因为在这些TDP值下,带有两个额外性能核心的Alder Lake P芯片会产生更多性能,正如我们的 桤木湖-U分析.
微软给Surface Pro 9配备了最新的WLAN模块,支持6GHz网络。同时,英特尔型号的LTE版本已经被放弃,因为以前的Surface Pro X现在也作为Surface Pro 9出售。带Windows的ARM版本是否真的能成为一个完整的替代品,还有待观察。我们本来希望有一个可选的带有LTE或5G的英特尔型号。在这方面,我们也对微软早先决定取消可选的SIM卡插槽的microSD读卡器持批评态度。由于英特尔机型不再有SIM卡槽,因此可以再次安装读卡器。另一方面,被省略的3.5毫米插孔更不显眼,但我们也认为这一决定令人费解。
新的微软Surface Pro 9现在提供了更多的CPU能力,但是可选的WWAN模式被放弃了,音频插孔也被取消了。此外,电池寿命仍然是这款敞篷车的一个弱点。
在其他方面,性能是稳固的,但显示屏尤其需要尽快更新。120赫兹在实践中是非常令人愉快的,但竞争对手的设备通常在色彩空间覆盖和对比度方面提供更多。此外,配备酷睿i7的可折叠机相当昂贵,而配备酷睿i5、8GB内存和256GB SSD存储的基本版本很难满足2023年 "专业 "设备的要求。
我们还将很快对ARM版的Surface Pro 9 + 5G进行评测,我们很想知道现在的Windows是否在ARM SoC上运行得更好,以及它是否代表了对iPad Pro的真正替代。 Apple iPad Pro 12.9.淘宝网 戴尔XPS 13 9315提供的CPU功率较小,但通常足以满足日常使用,而且你还能从被动冷却中受益。
价格和可用性
微软Surface Pro 9似乎在所有配置中都有广泛供应,可以直接通过微软的官方在线商店或通过亚马逊等典型供应商。我们的评测配置(酷睿i7,16GB内存,512GB)在美国亚马逊上以US$1.879,99上市。,而在英国亚马逊上的价格为1,799.00英镑.例如,澳大利亚或新加坡的感兴趣的买家可以直接从微软购买,价格从AU$1,649.00开始和SG$1,608.00,分别为1,649.00澳元和1,608.00新加坡元。
上述的例子并不详尽。价格截至2023年1月25日,可能会有变化。
Microsoft Surface Pro 9, i7-1255U
- 01/24/2023 v7 (old)
Andreas Osthoff
Transparency
The selection of devices to be reviewed is made by our editorial team. The test sample was provided to the author as a loan by the manufacturer or retailer for the purpose of this review. The lender had no influence on this review, nor did the manufacturer receive a copy of this review before publication. There was no obligation to publish this review. As an independent media company, Notebookcheck is not subjected to the authority of manufacturers, retailers or publishers.
This is how Notebookcheck is testing
Every year, Notebookcheck independently reviews hundreds of laptops and smartphones using standardized procedures to ensure that all results are comparable. We have continuously developed our test methods for around 20 years and set industry standards in the process. In our test labs, high-quality measuring equipment is utilized by experienced technicians and editors. These tests involve a multi-stage validation process. Our complex rating system is based on hundreds of well-founded measurements and benchmarks, which maintains objectivity. Further information on our test methods can be found here.
Price comparison

