惠普蜻蜓G4笔记本电脑评测:惠普Dragonfly G4笔记本电脑评测:与已经非常出色的Dragonfly G3相比的小幅升级

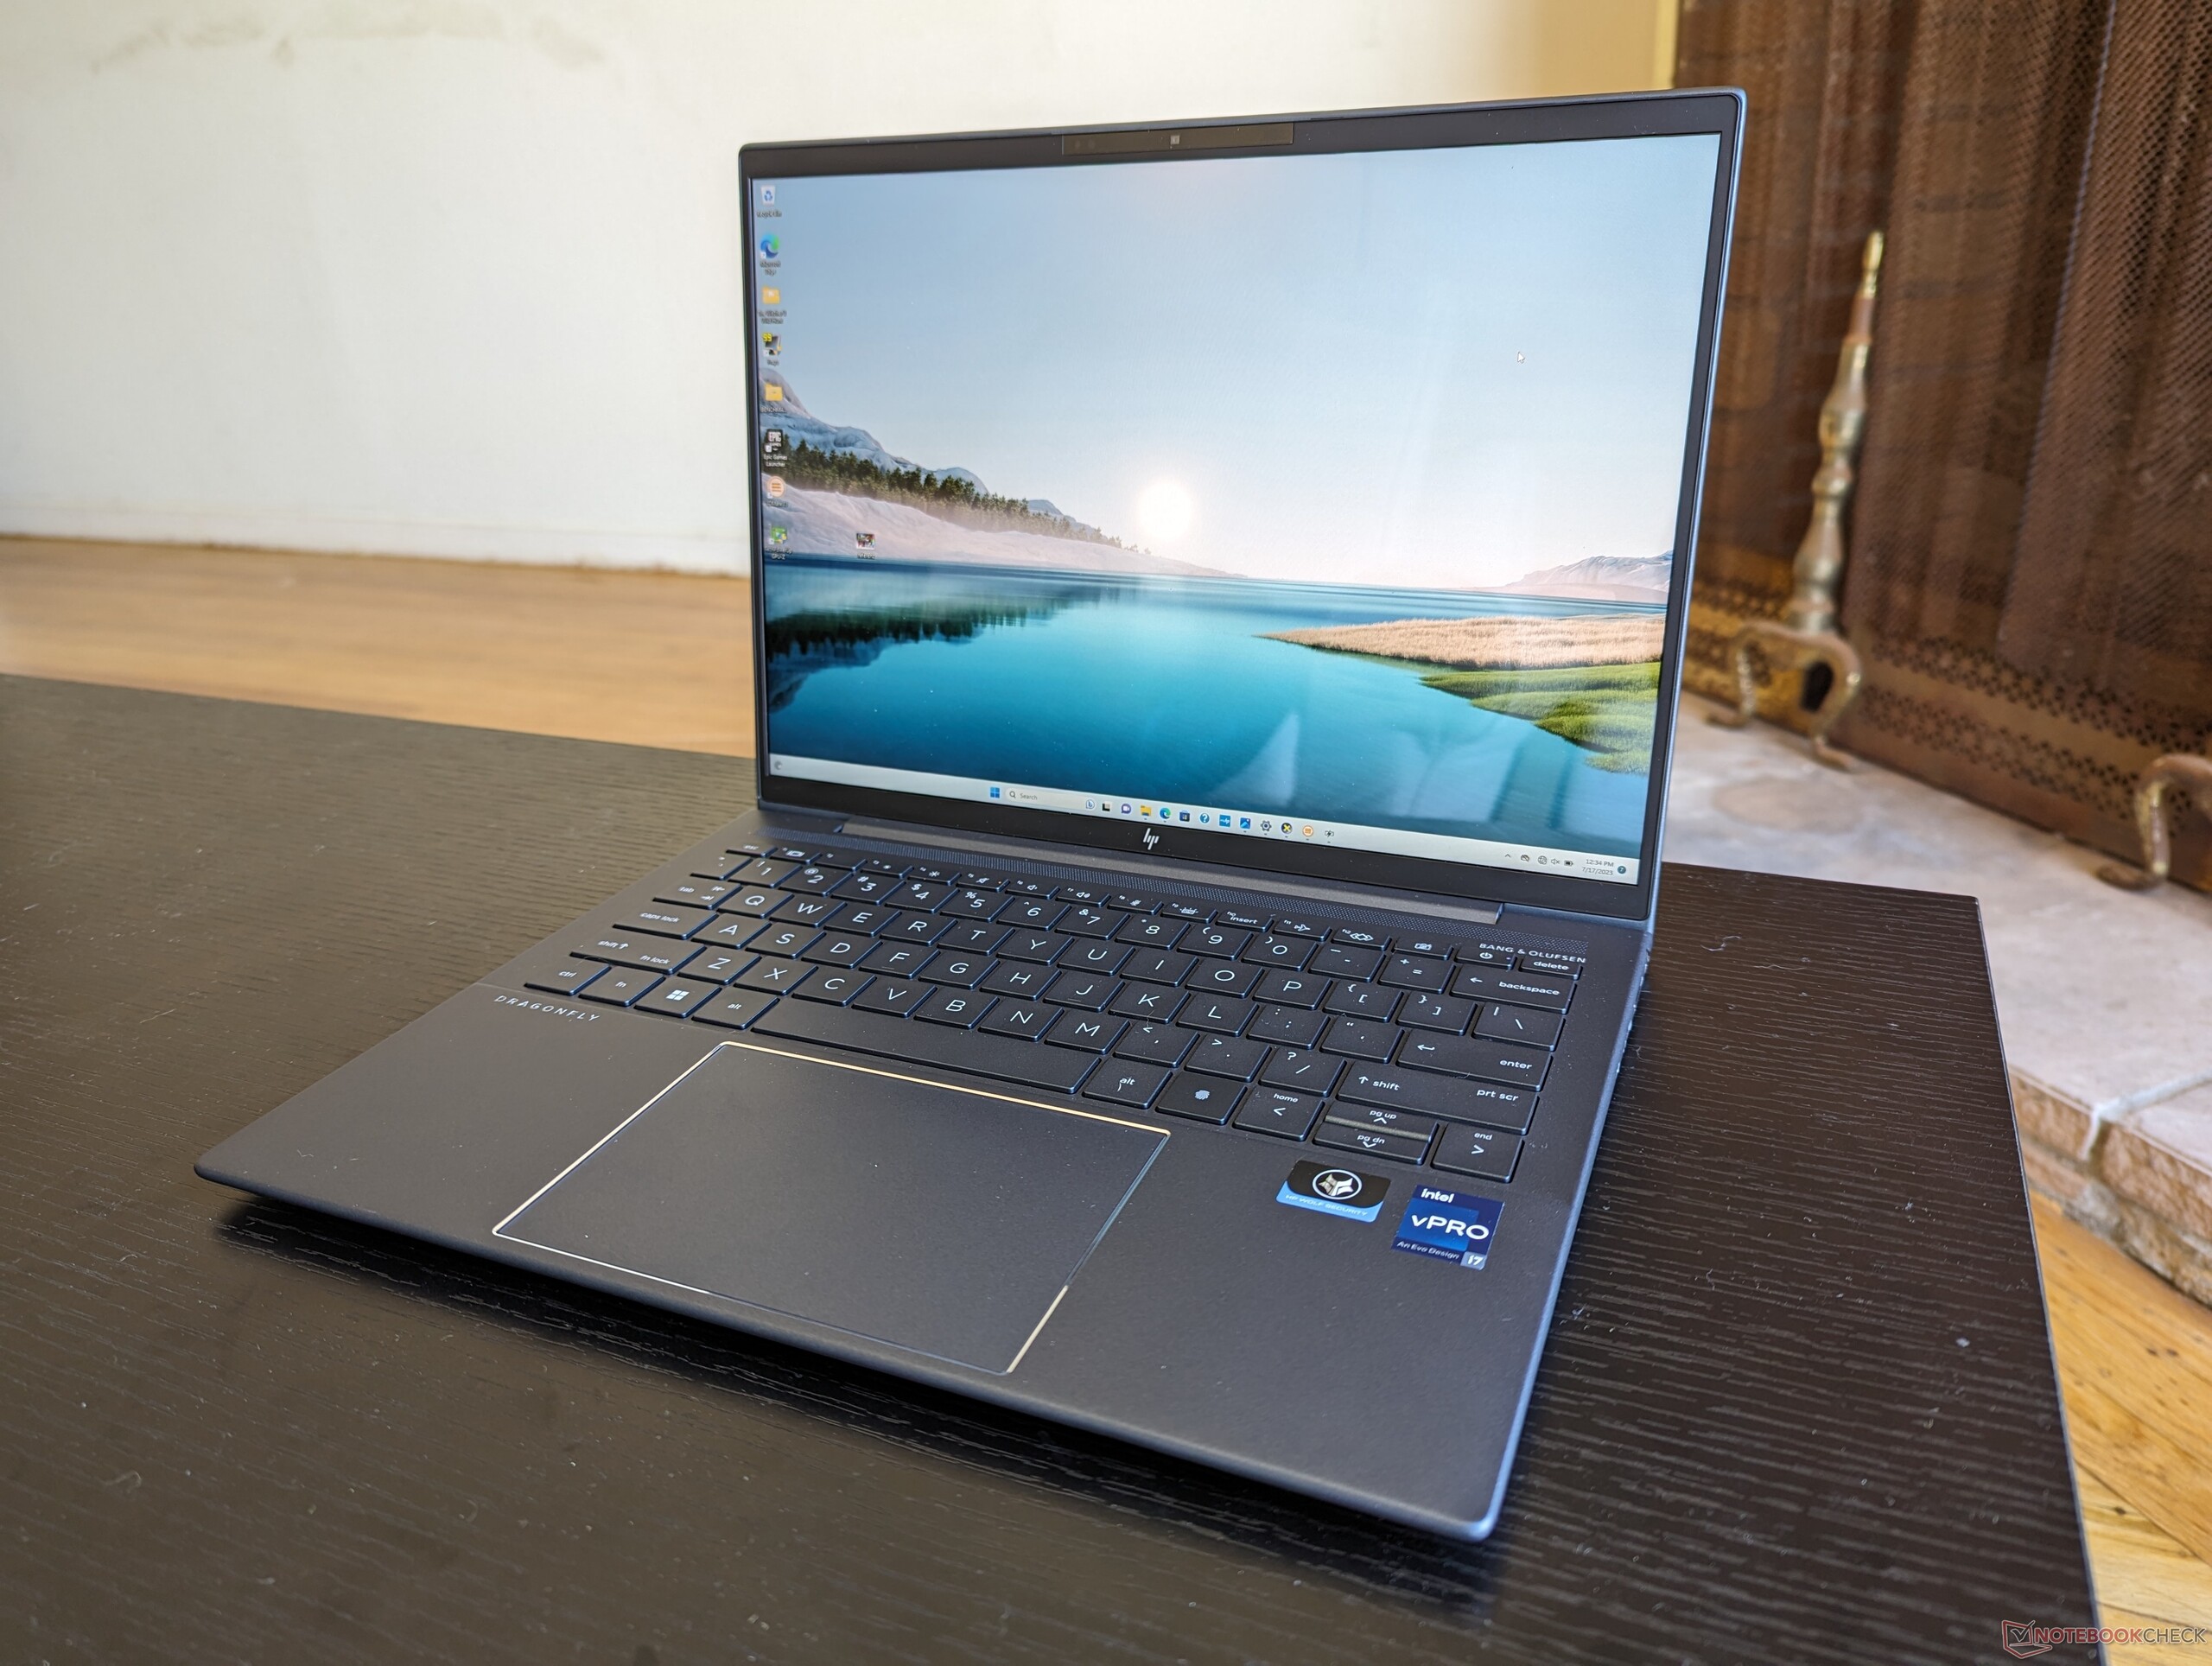
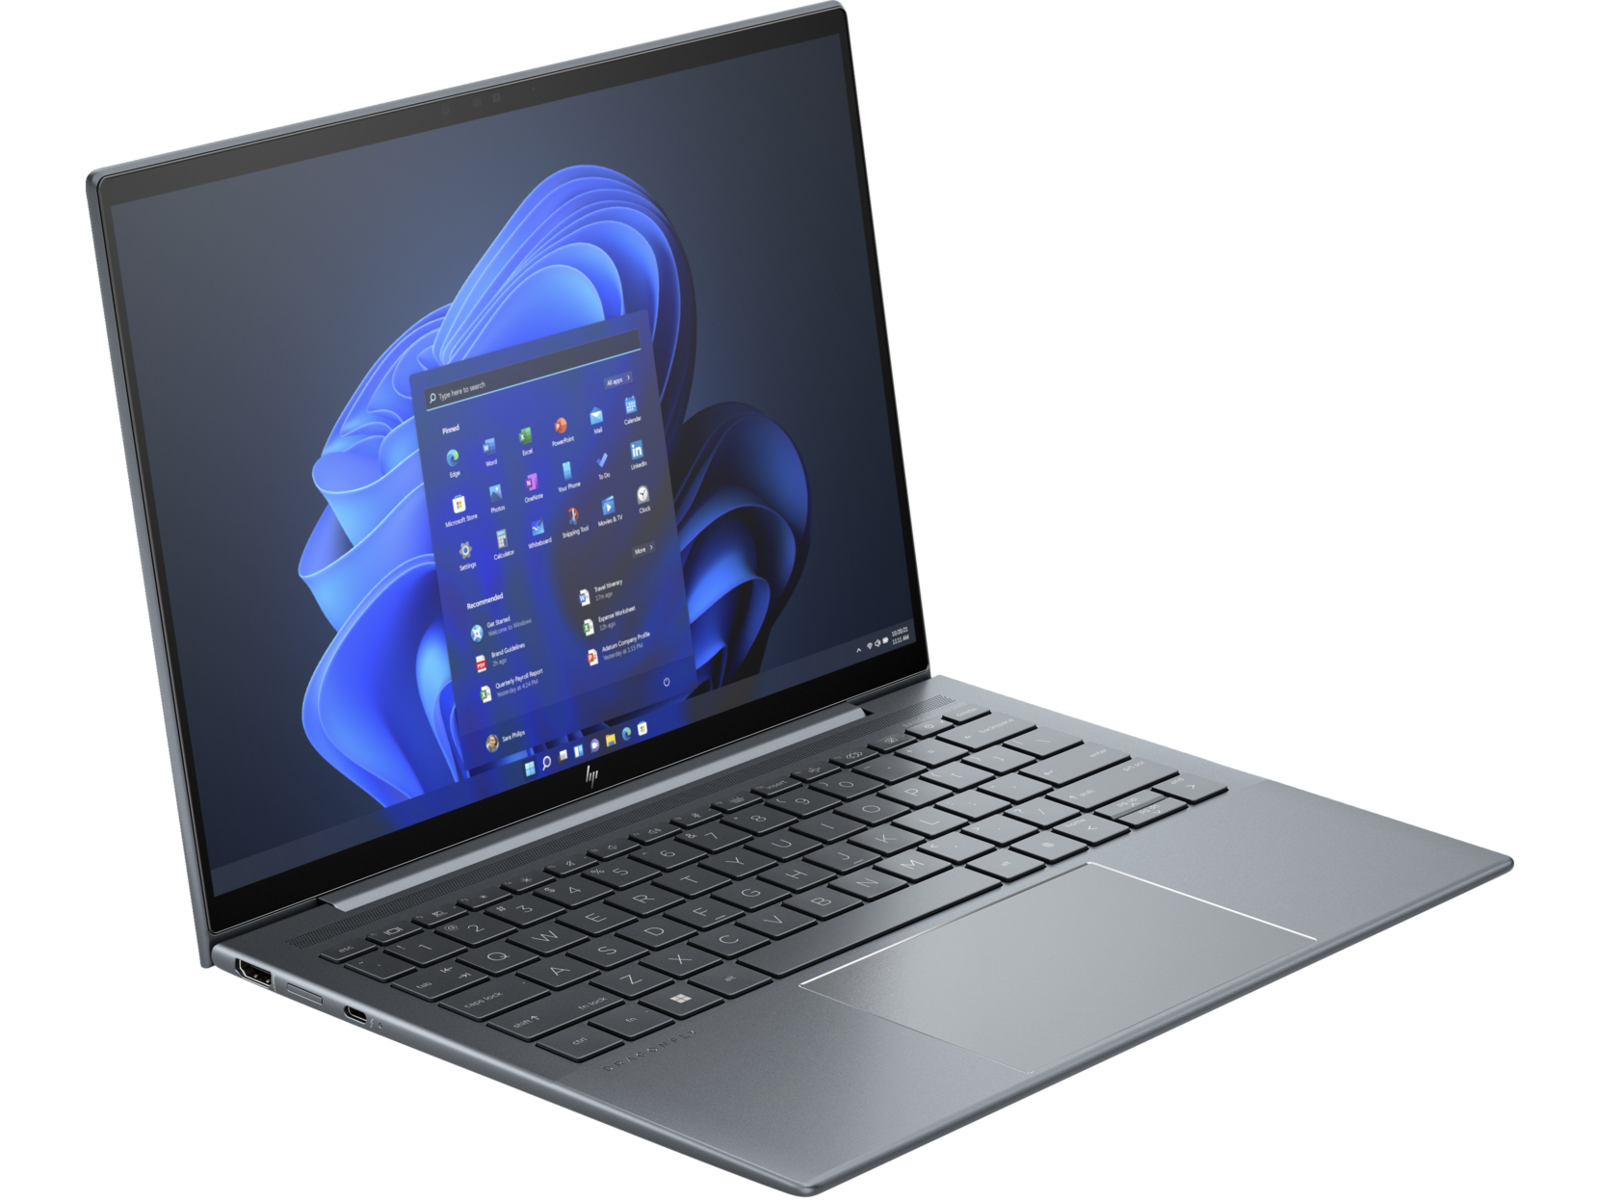
Dragonfly G4直接接替了去年的Elite Dragonfly G3,正式放弃了 "Elite "的称号,并用13代Raptor Lake-U取代了12代Alder Lake-U选件。除此以外,外部机箱与去年保持一致,因此我们建议您查看 我们对精英版蜻蜓G3的评测了解更多有关笔记本电脑的物理特性。
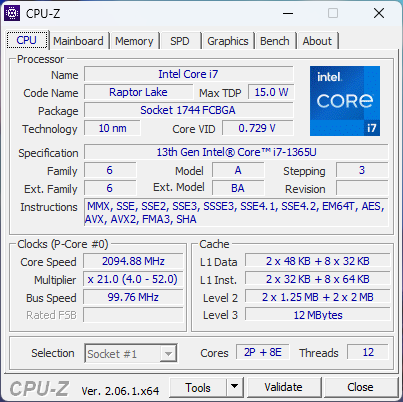
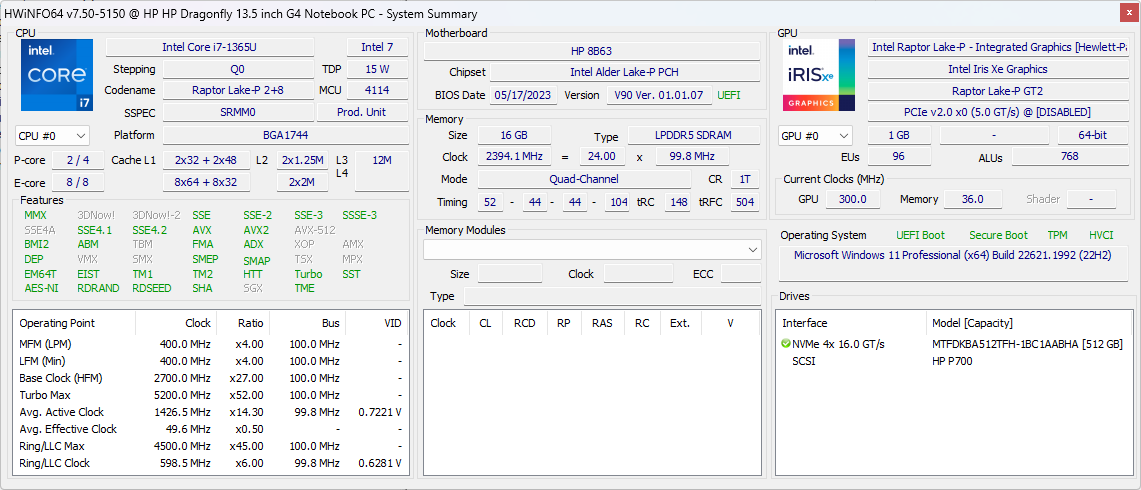
我们的评测机型为中端配置,配备酷睿i7-1365U处理器和1280p 400尼特IPS非触控显示屏,售价约为1700美元。其他SKU从酷睿i5-1335U到3000 x 2000 OLED,起价从1300美元到近2400美元不等,取决于内存和存储空间。
蜻蜓G4直接与其他高端超薄笔记本电脑竞争,例如 联想ThinkPad X13 G3, 戴尔Latitude 9330, 微软Surface系列或 华硕ZenBook S 13.
更多惠普评测:
潜在的竞争对手比较
Rating | Date | Model | Weight | Height | Size | Resolution | Price |
|---|---|---|---|---|---|---|---|
| 91.9 % v7 (old) | 07 / 2023 | HP Dragonfly G4 i7-1365U, Iris Xe G7 96EUs | 1.1 kg | 16.3 mm | 13.50" | 1920x1280 | |
| 91 % v7 (old) | 08 / 2022 | HP Elite Dragonfly G3 i7-1265U, Iris Xe G7 96EUs | 1.2 kg | 16.3 mm | 13.50" | 1920x1280 | |
| 86.2 % v7 (old) | 05 / 2023 | Framework Laptop 13.5 13th Gen Intel i7-1370P, Iris Xe G7 96EUs | 1.3 kg | 15.85 mm | 13.50" | 2256x1504 | |
| 90.6 % v7 (old) | 06 / 2023 | Lenovo ThinkPad X13 G3 21CM002UGE R5 PRO 6650U, Radeon 660M | 1.3 kg | 18.1 mm | 13.30" | 1920x1200 | |
| 89 % v7 (old) | 11 / 2022 | Dell Latitude 9330 i7-1260U, Iris Xe G7 96EUs | 1.2 kg | 14.1 mm | 13.30" | 2560x1600 | |
| 92.3 % v7 (old) | 07 / 2022 | Apple MacBook Air M2 Entry M2, M2 8-Core GPU | 1.2 kg | 11.3 mm | 13.60" | 2560x1664 |
案例 - 部分面向消费者,部分面向企业
通讯
网络摄像头
惠普Spectre、EliteBook和Dragonfly笔记本电脑继续配备500万像素或更高的网络摄像头,与其他大多数笔记本电脑的网络摄像头相比,图像清晰度明显更高,而其他笔记本电脑的网络摄像头仍然普遍采用100万像素和200万像素传感器。红外和隐私快门均为标配。
惠普摄像头软件现在支持梯形校正,可裁剪或压平视频馈送,以共享白板或纸张;支持人工智能自动摄像头,可让您的视线集中在摄像头上而不是屏幕上;支持多摄像头,可同时串流两个视频馈送。


维护
与大多数其他制造商不同,惠普上传了非常方便的视频,介绍如何维修或拆卸包括Dragonfly G4在内的许多笔记本电脑。我们建议查看以下视频了解完整的拆解过程。
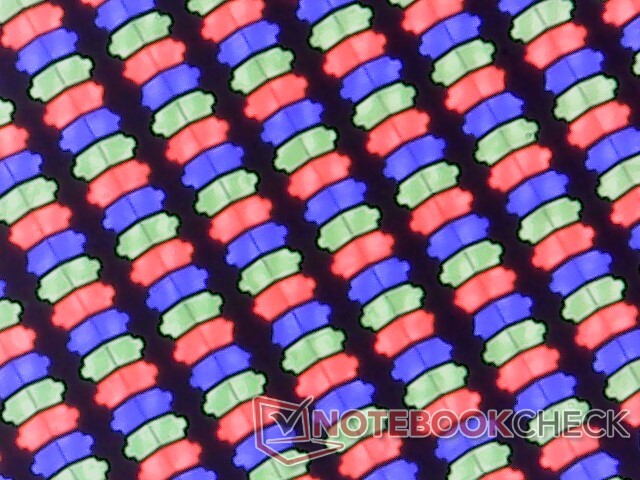
显示屏
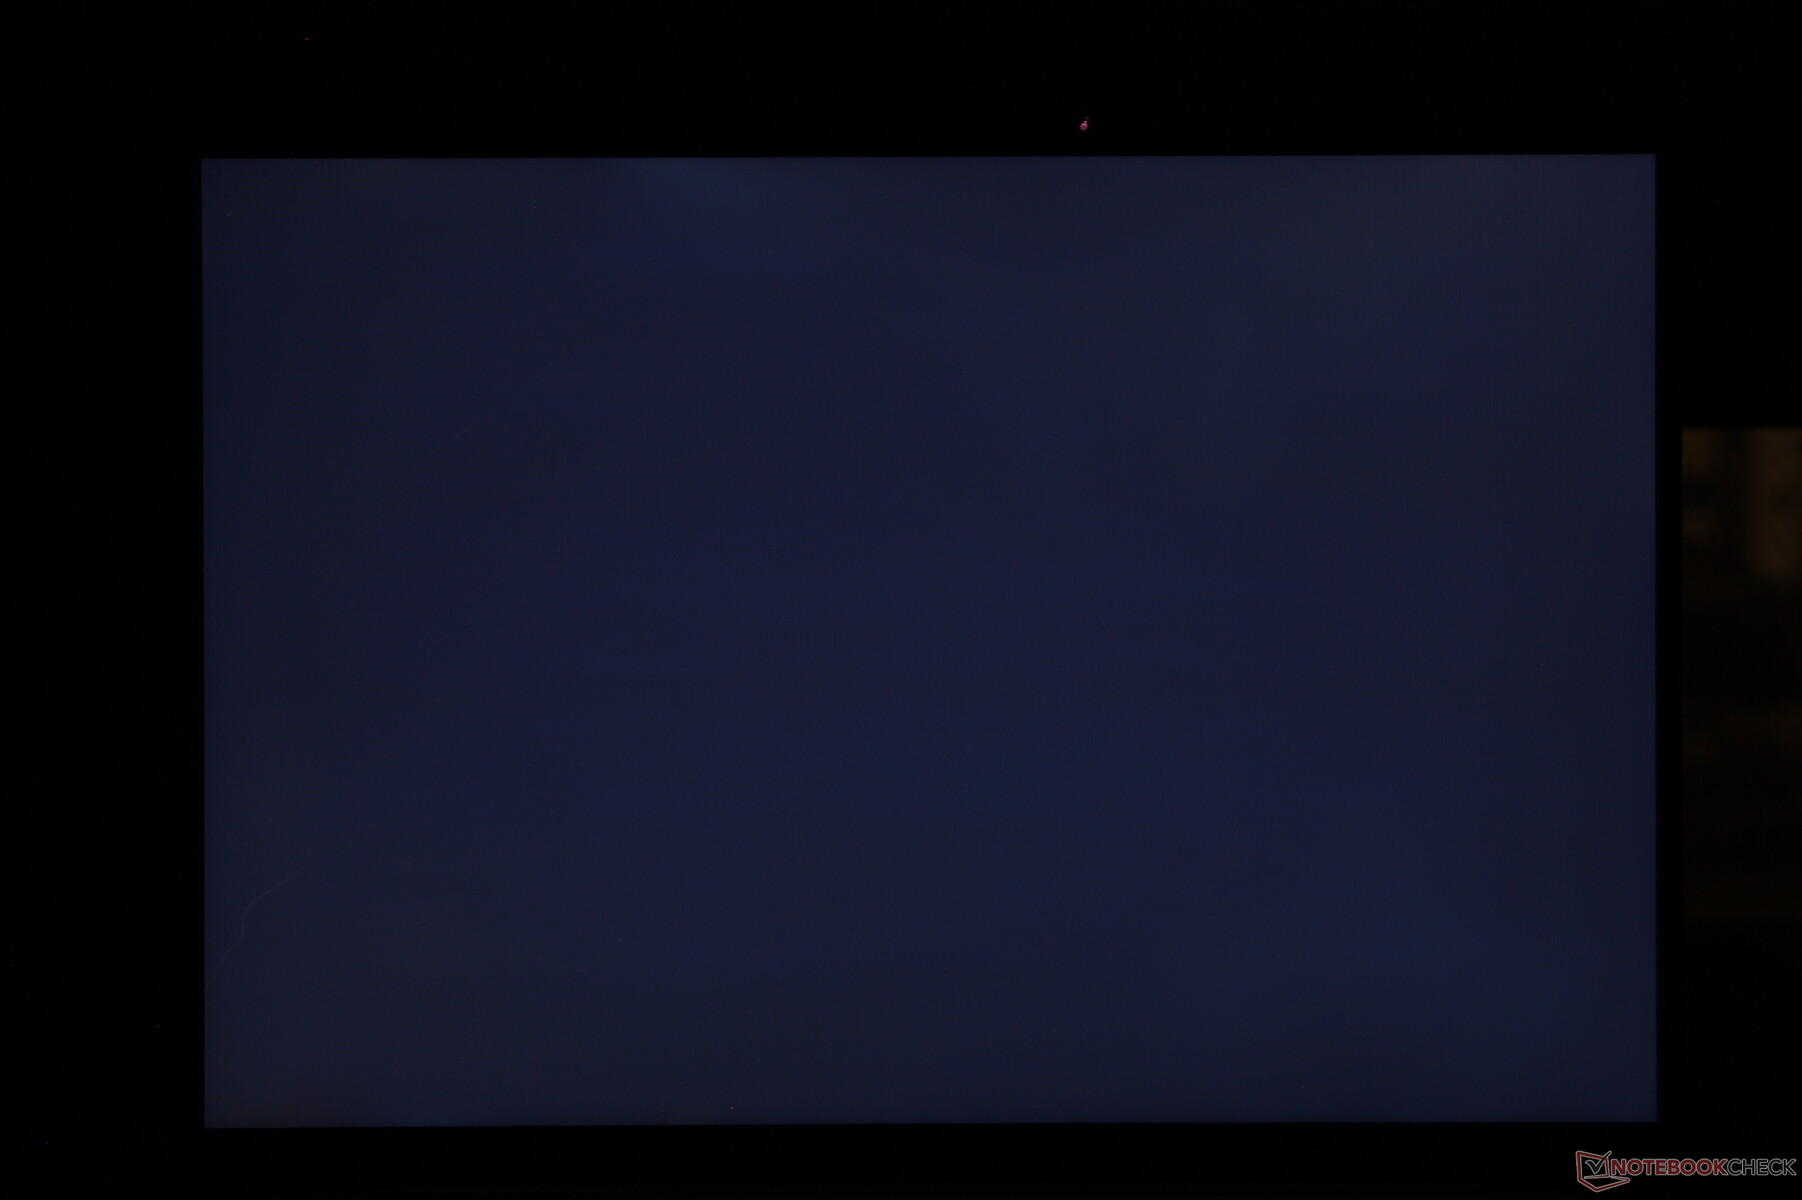
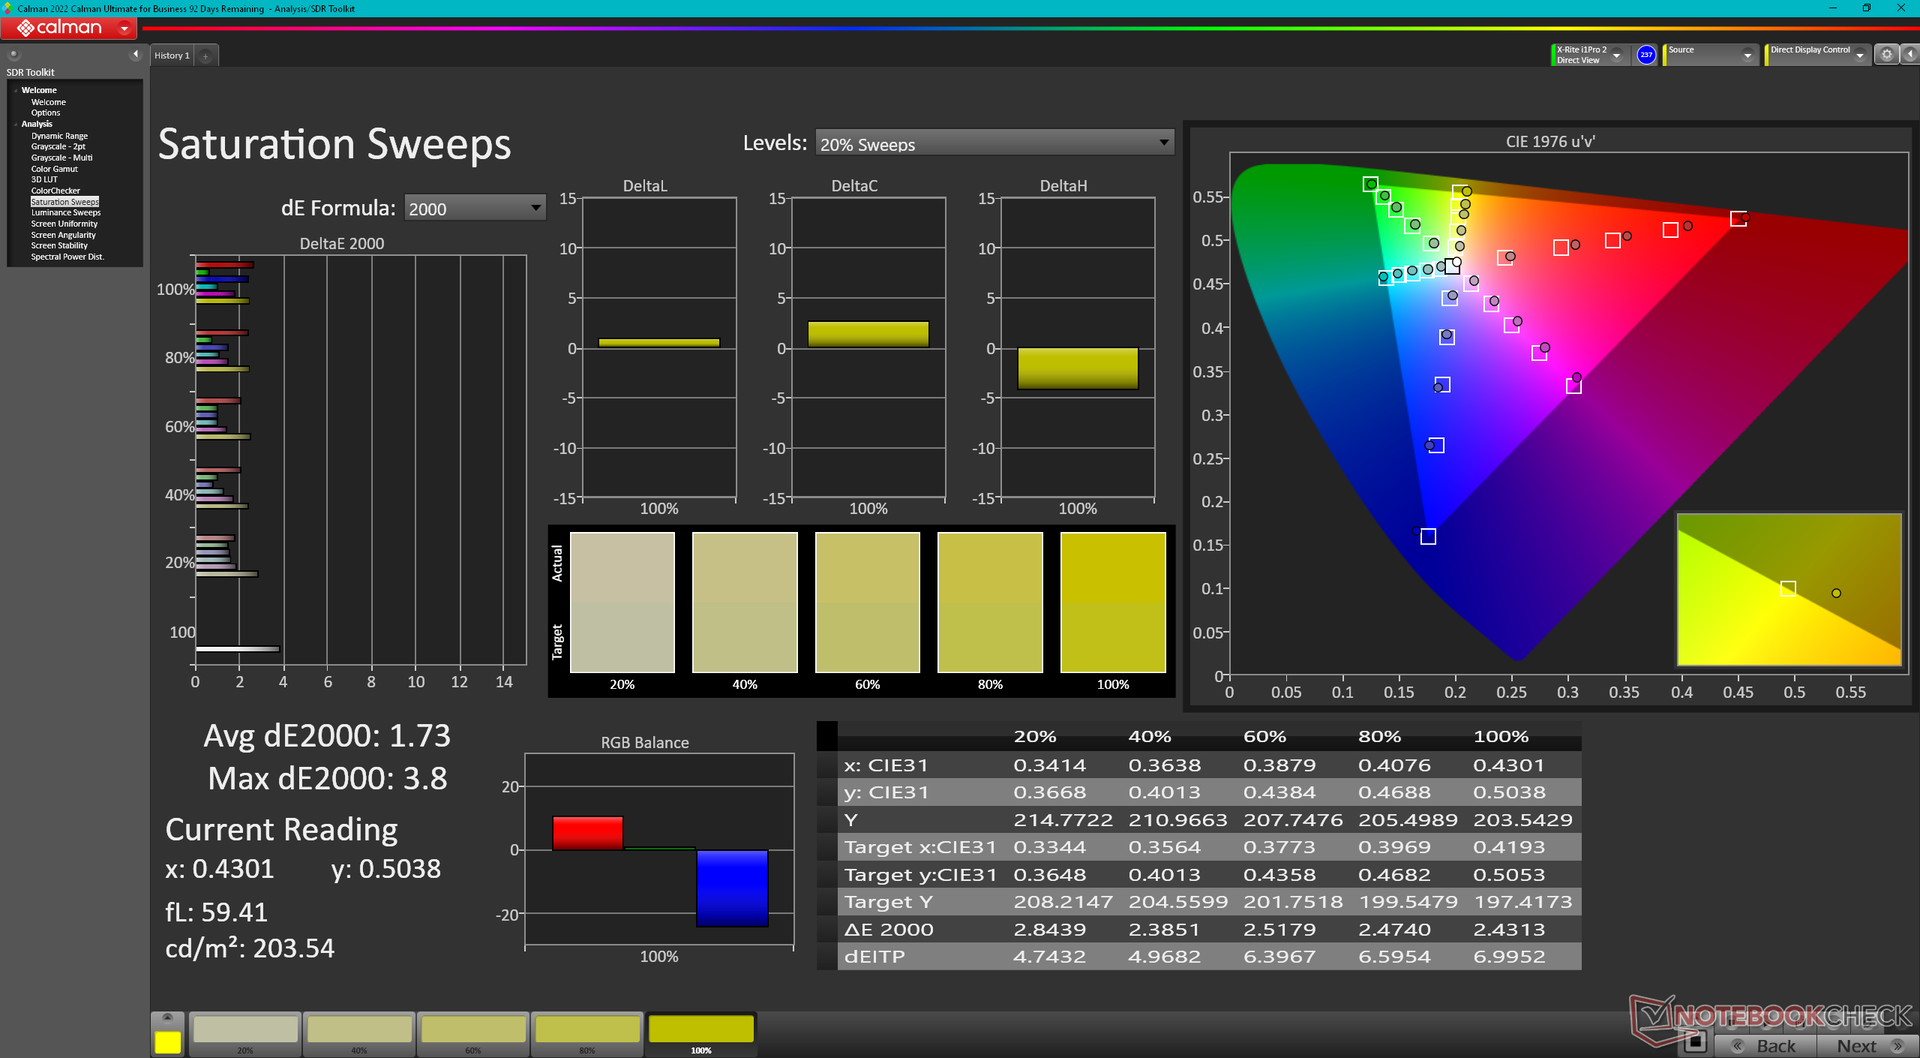
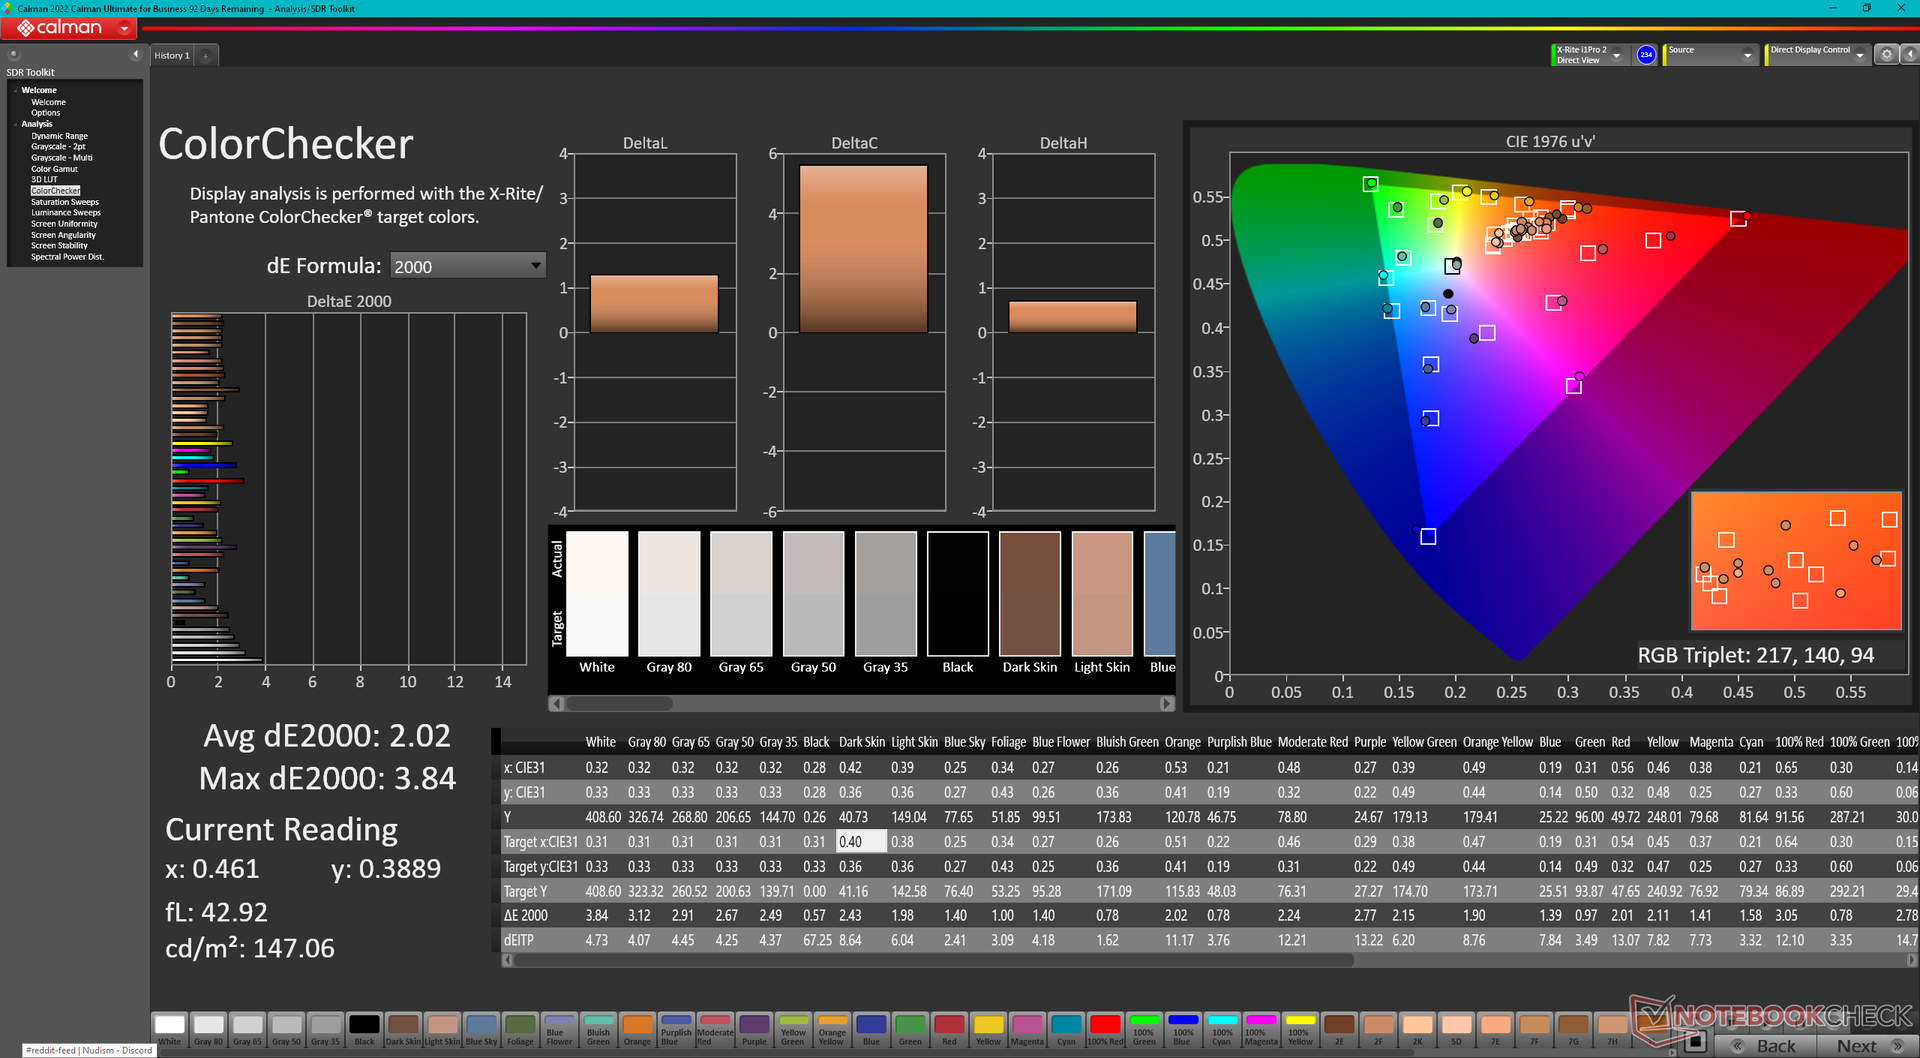
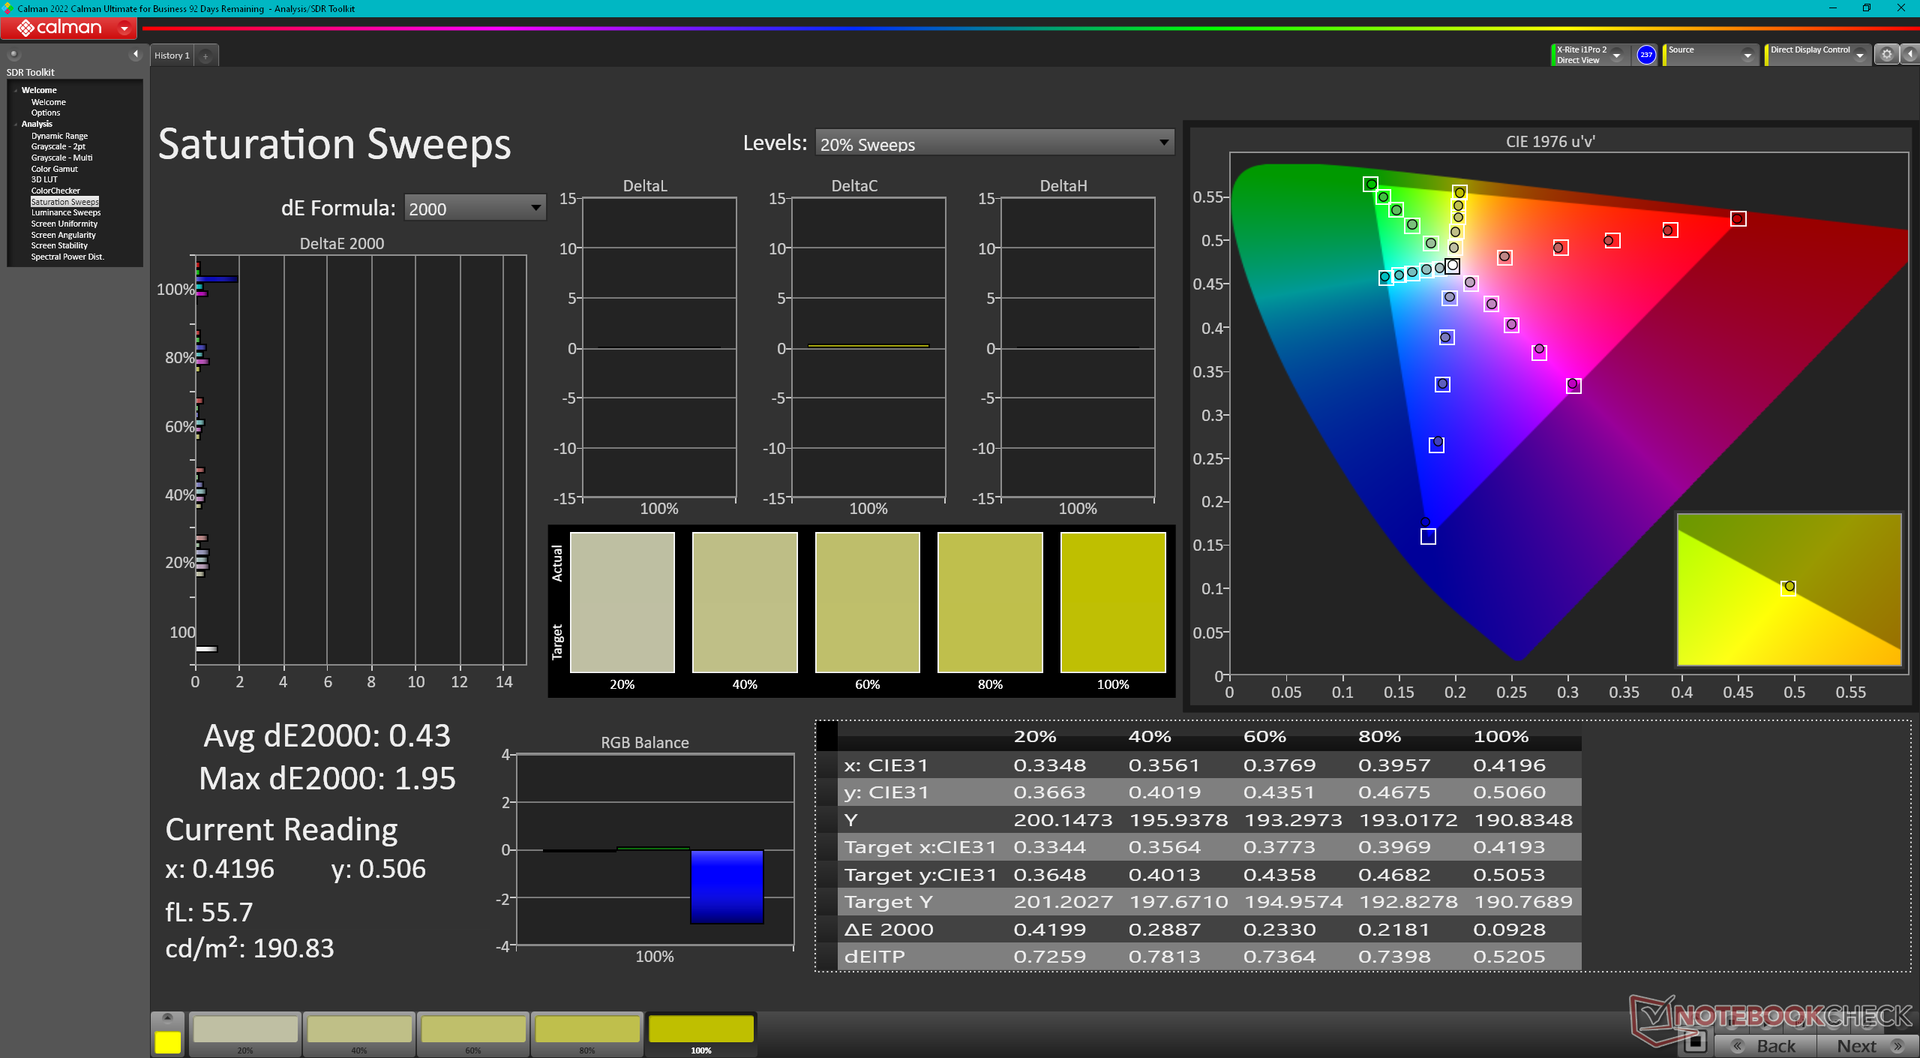
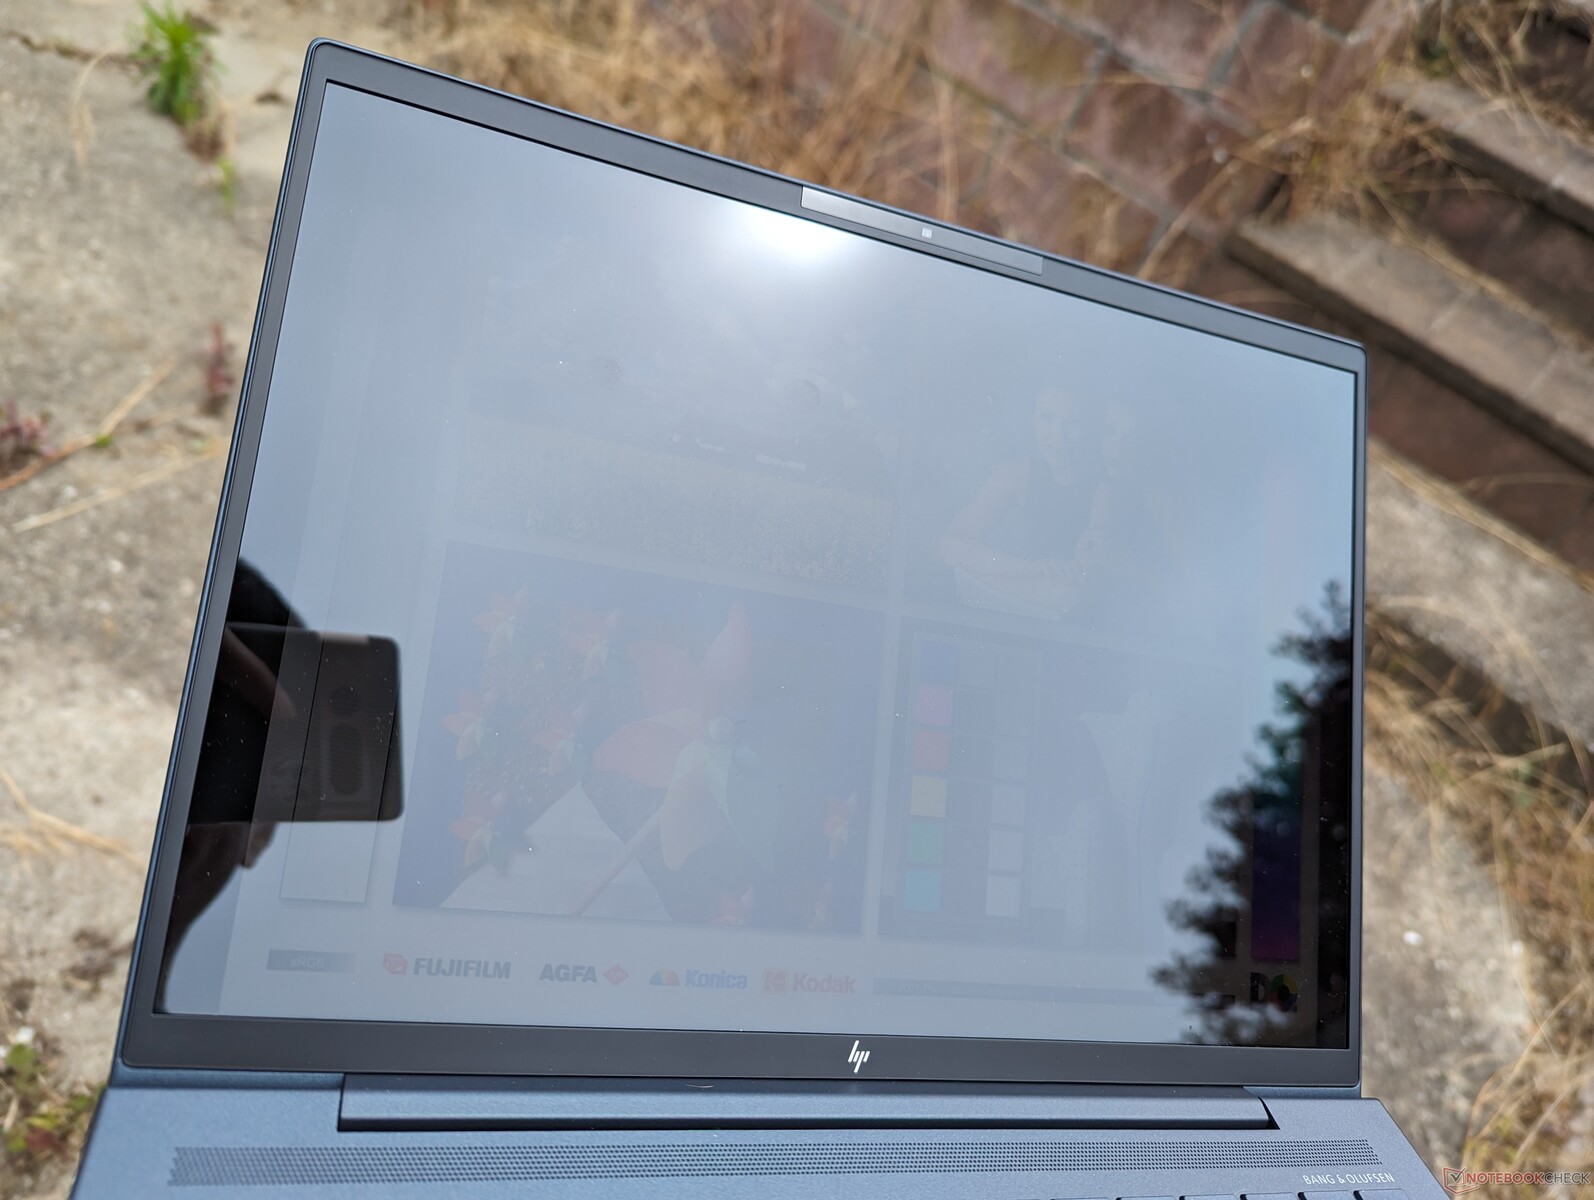
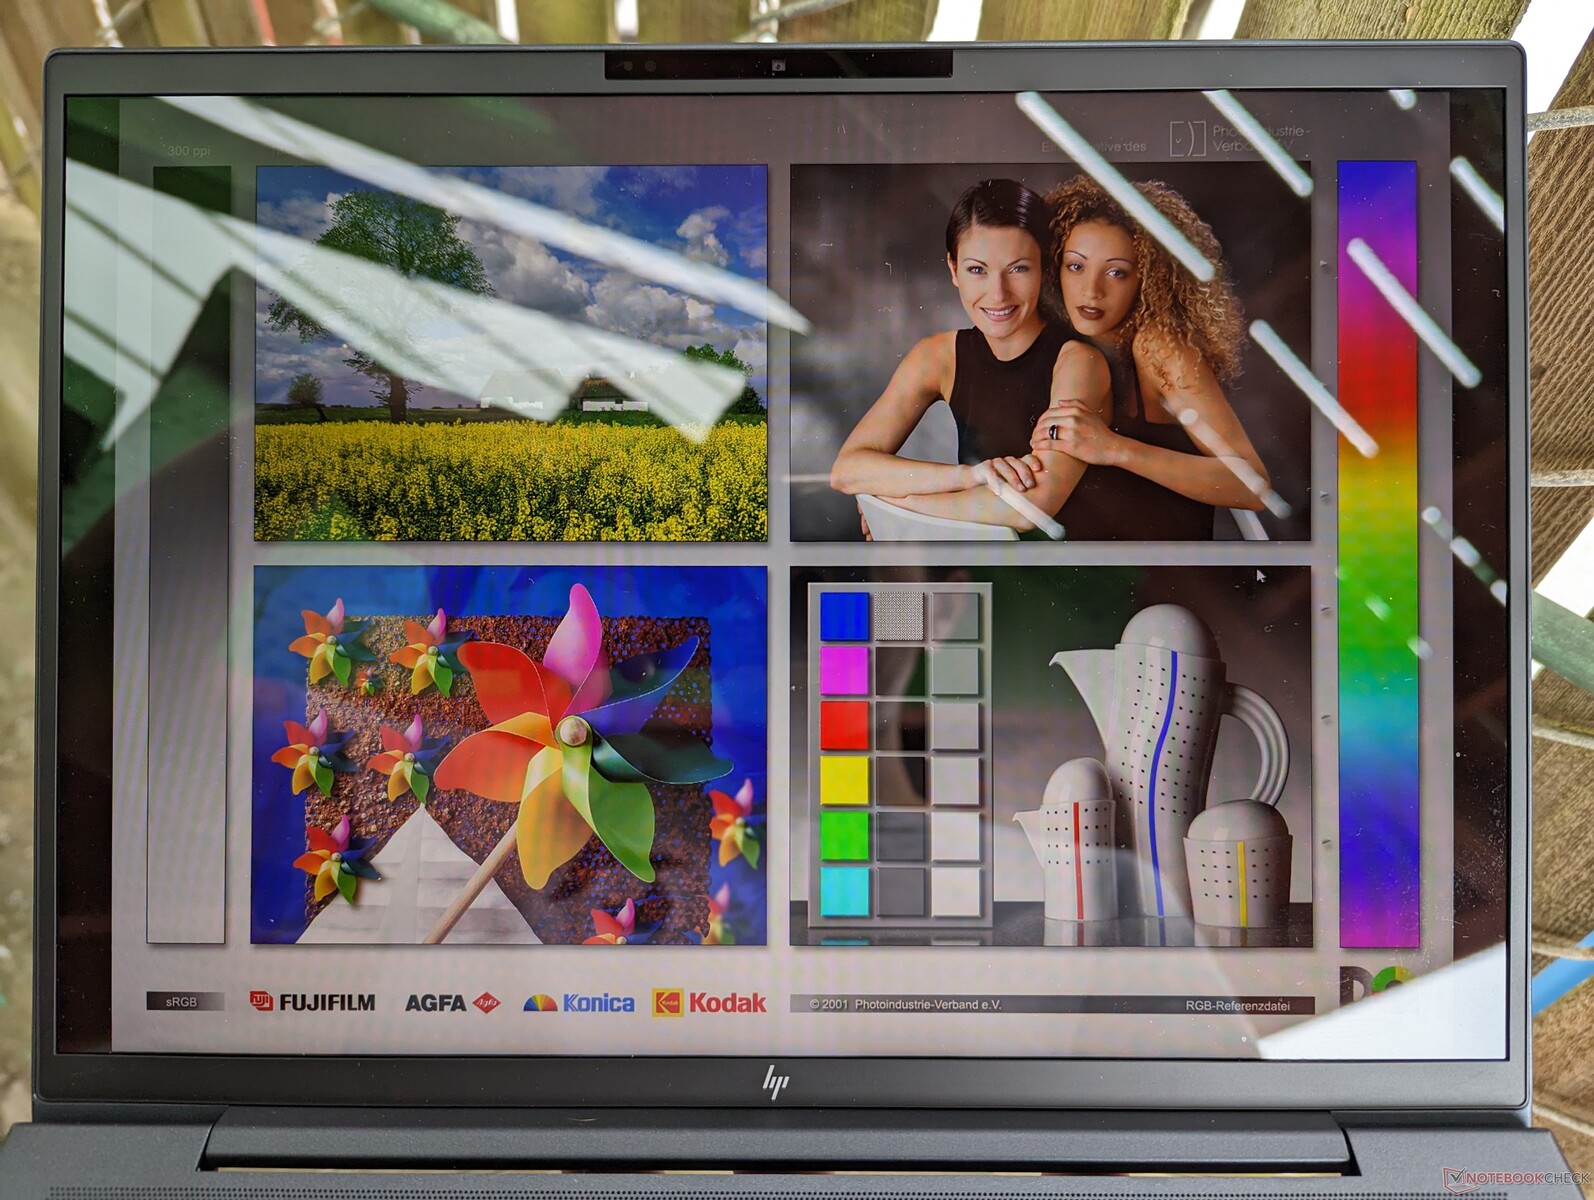
该机型提供六种显示屏选择,从1280p IPS到2000p OLED。此外还提供触摸屏、Sure View和1000尼特选项,但仅限于特定的1280p IPS配置。我们的测试机配备了基本的1280p 400-nit奇美CMN13C0面板,这与惠普去年的 Dragonfly G3.因此,同比观看体验保持一致。
| |||||||||||||||||||||||||
Brightness Distribution: 90 %
Center on Battery: 408.8 cd/m²
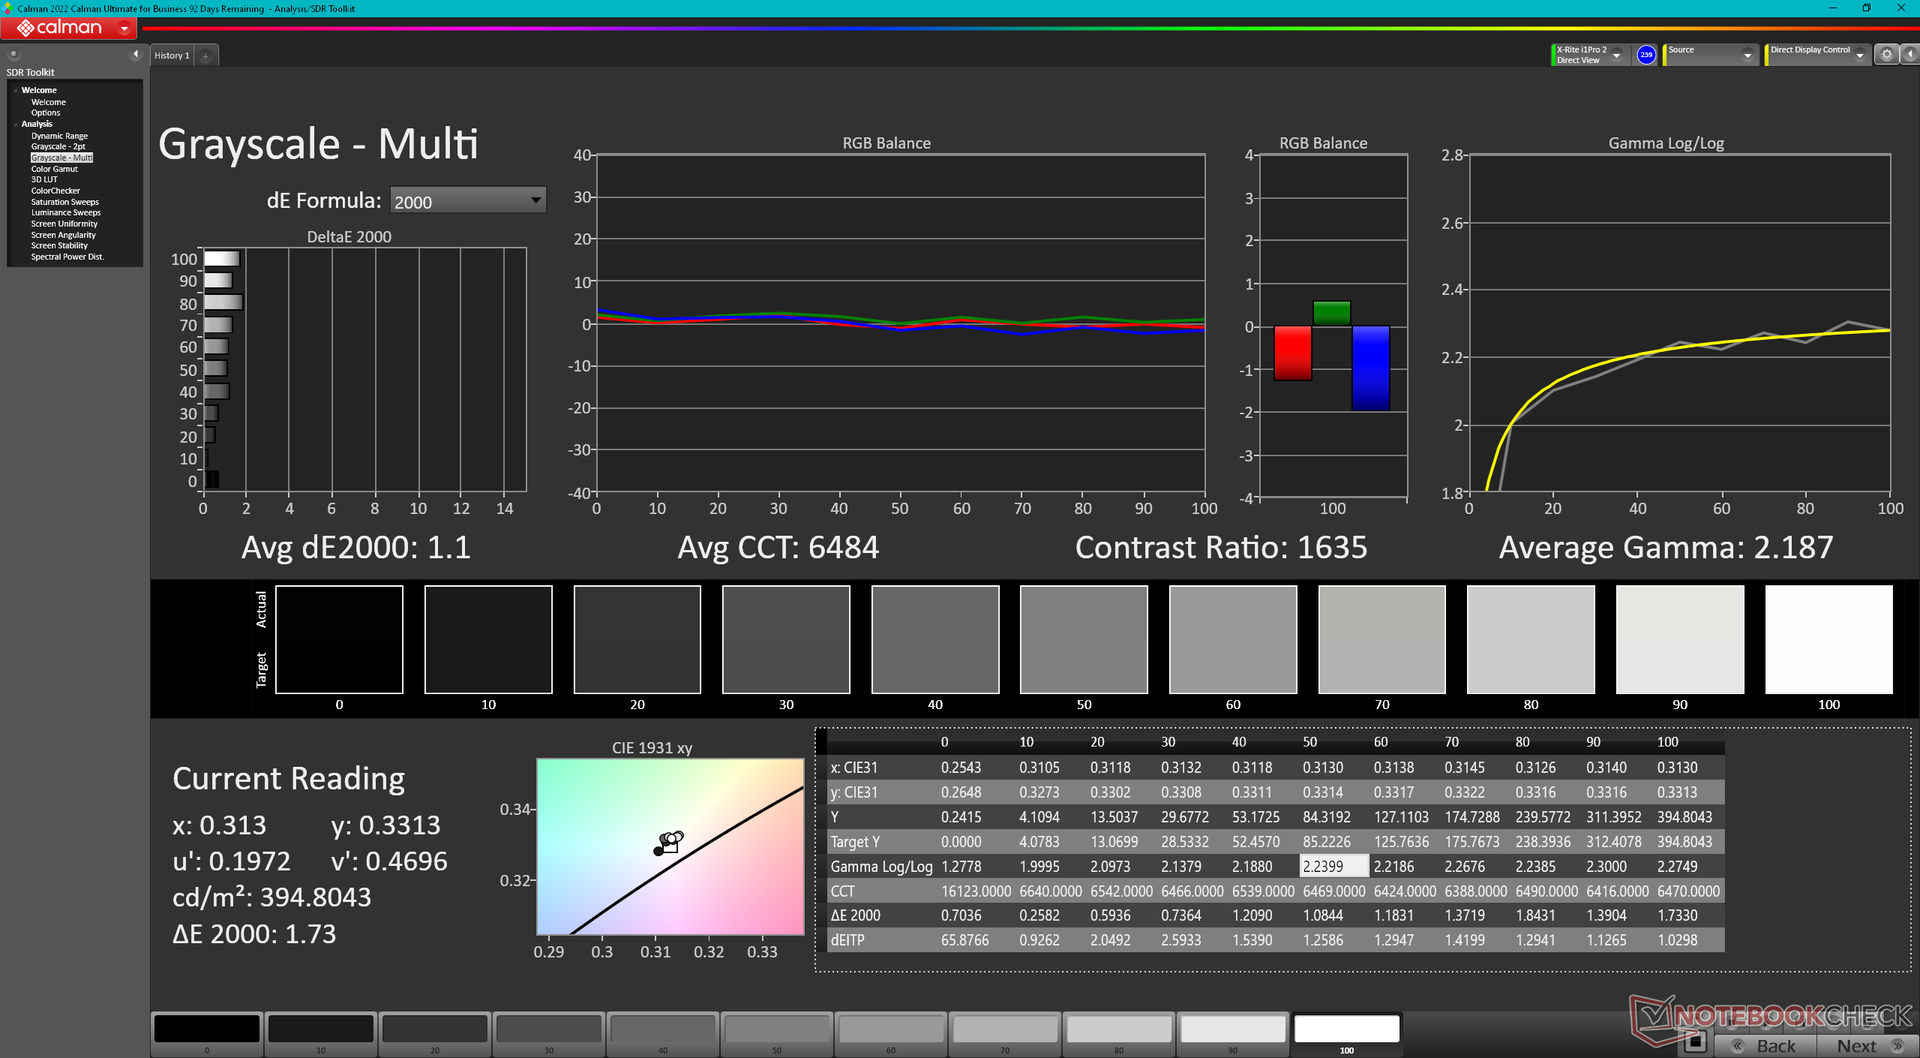
Contrast: 1278:1 (Black: 0.32 cd/m²)
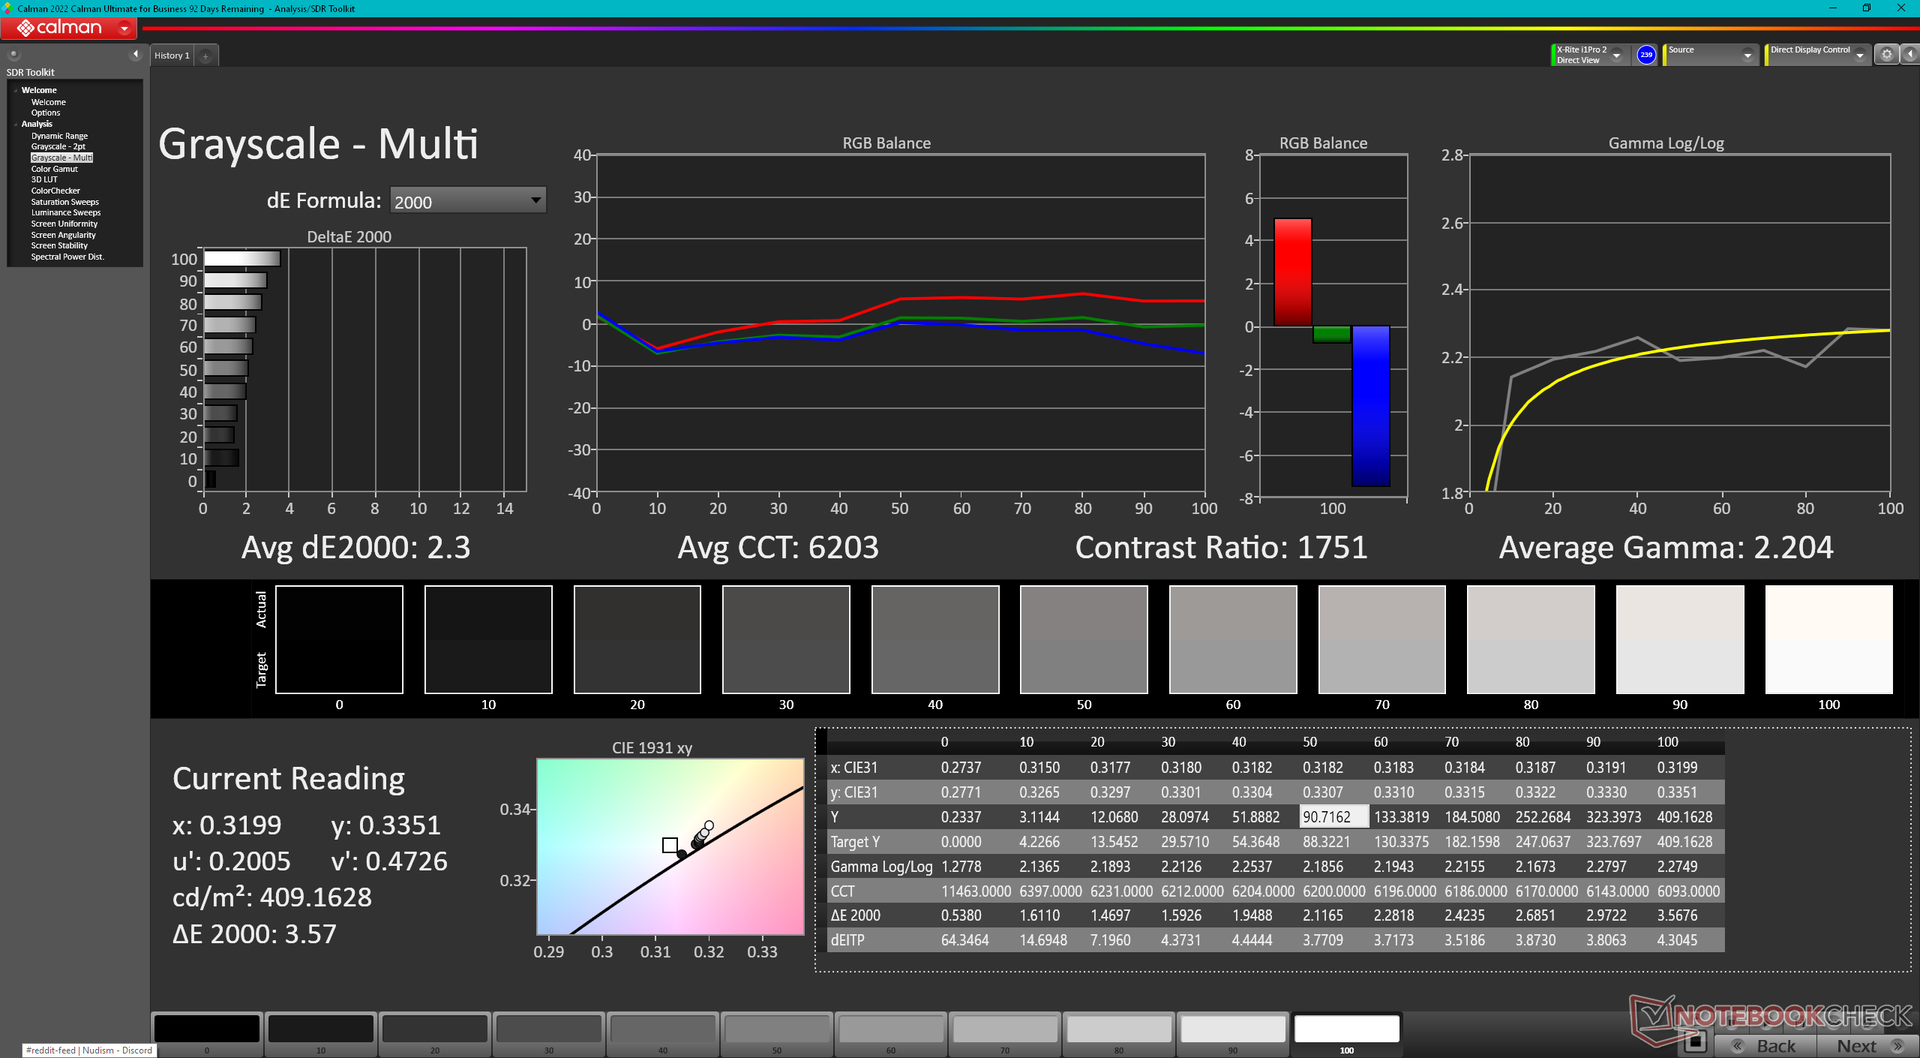
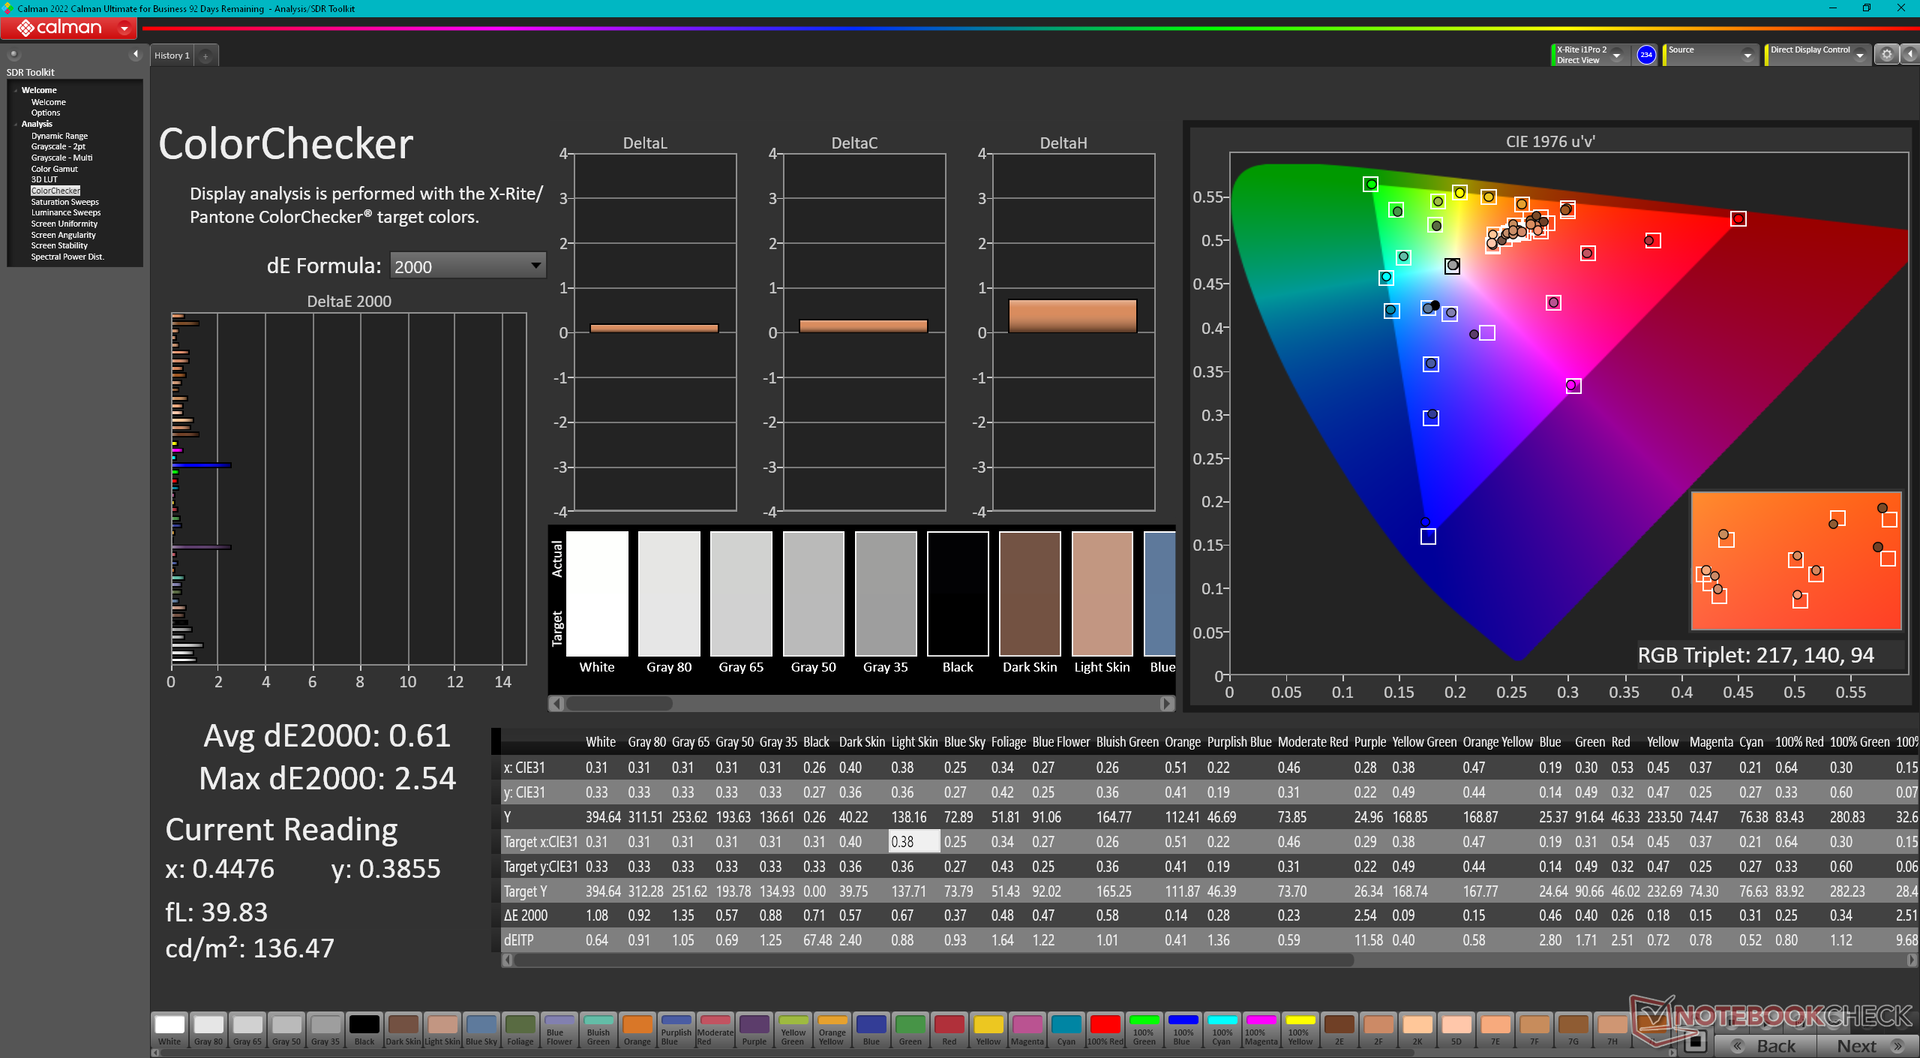
ΔE ColorChecker Calman: 2.02 | ∀{0.5-29.43 Ø4.71}
calibrated: 0.61
ΔE Greyscale Calman: 2.3 | ∀{0.09-98 Ø4.96}
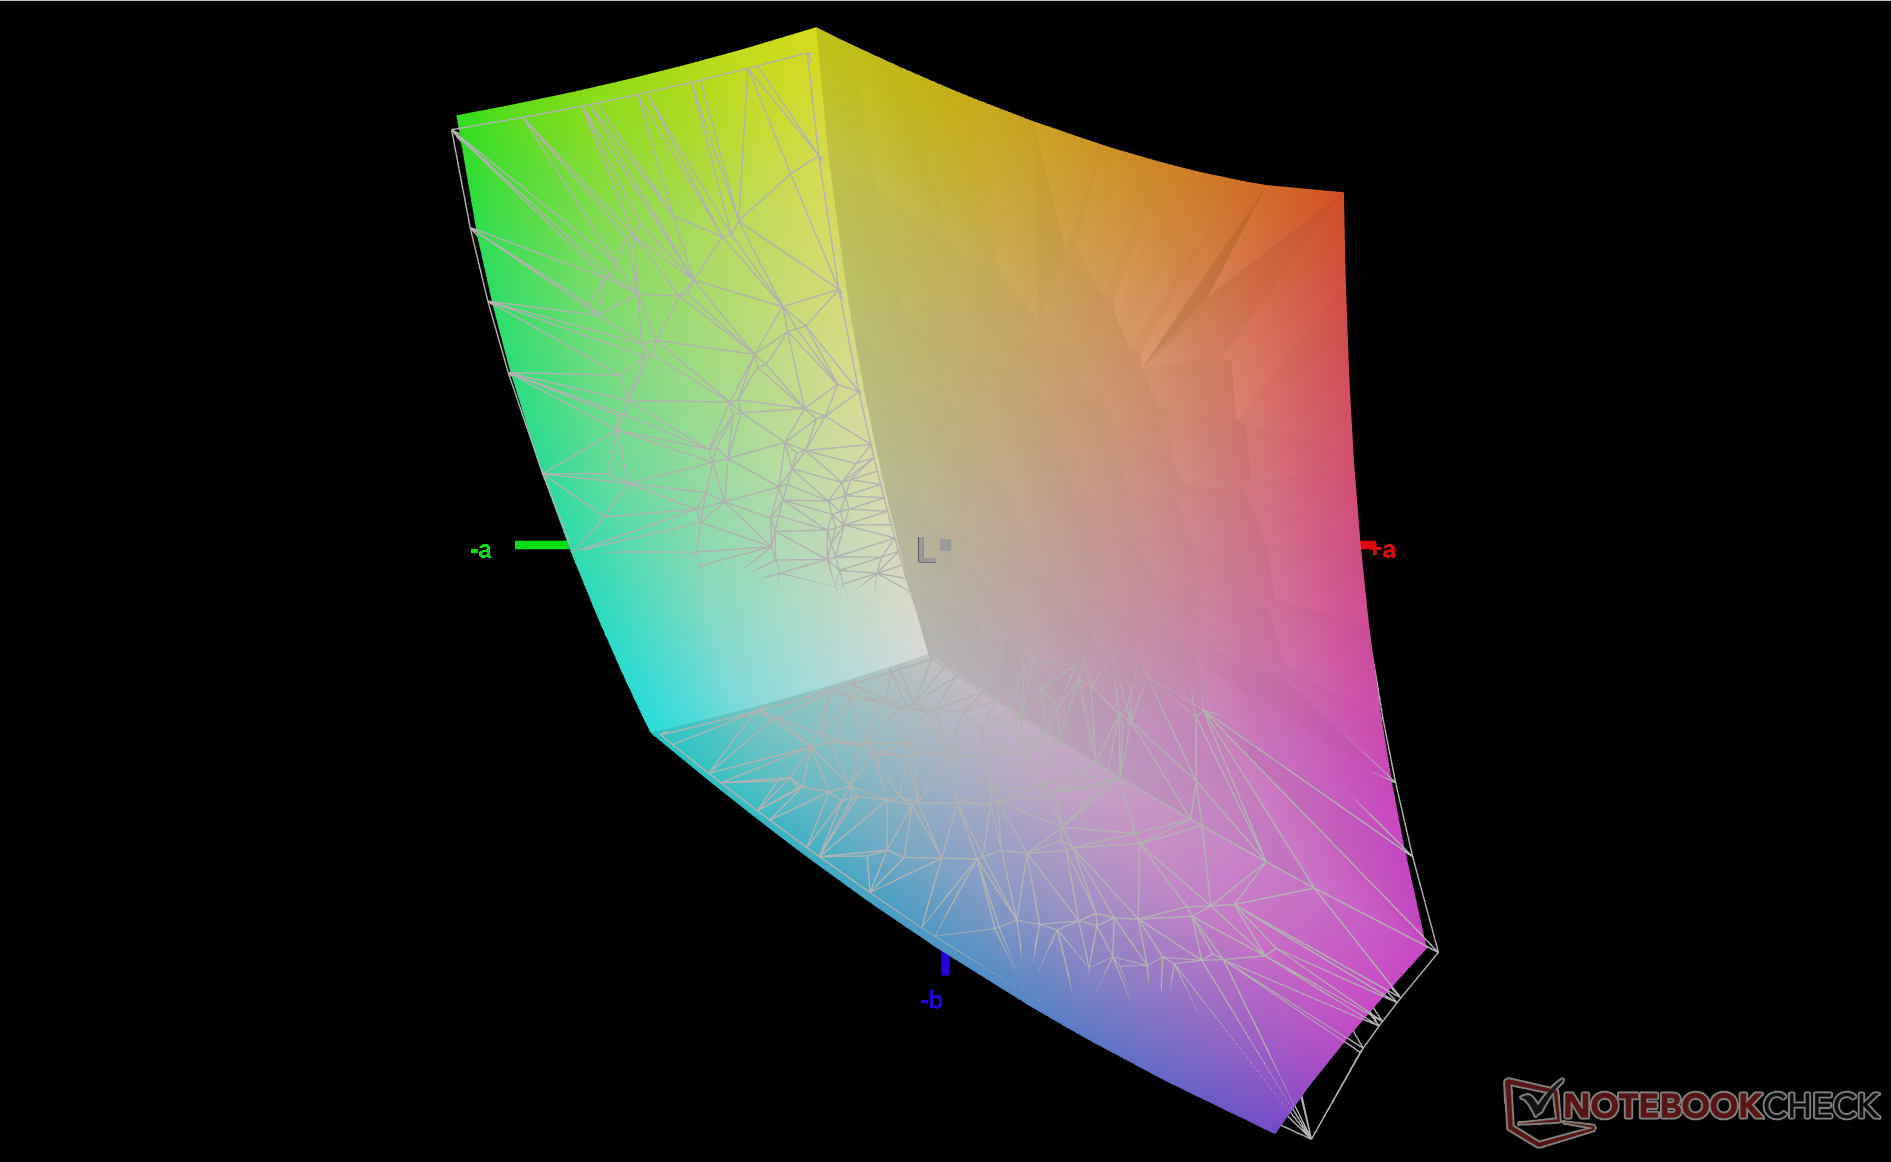
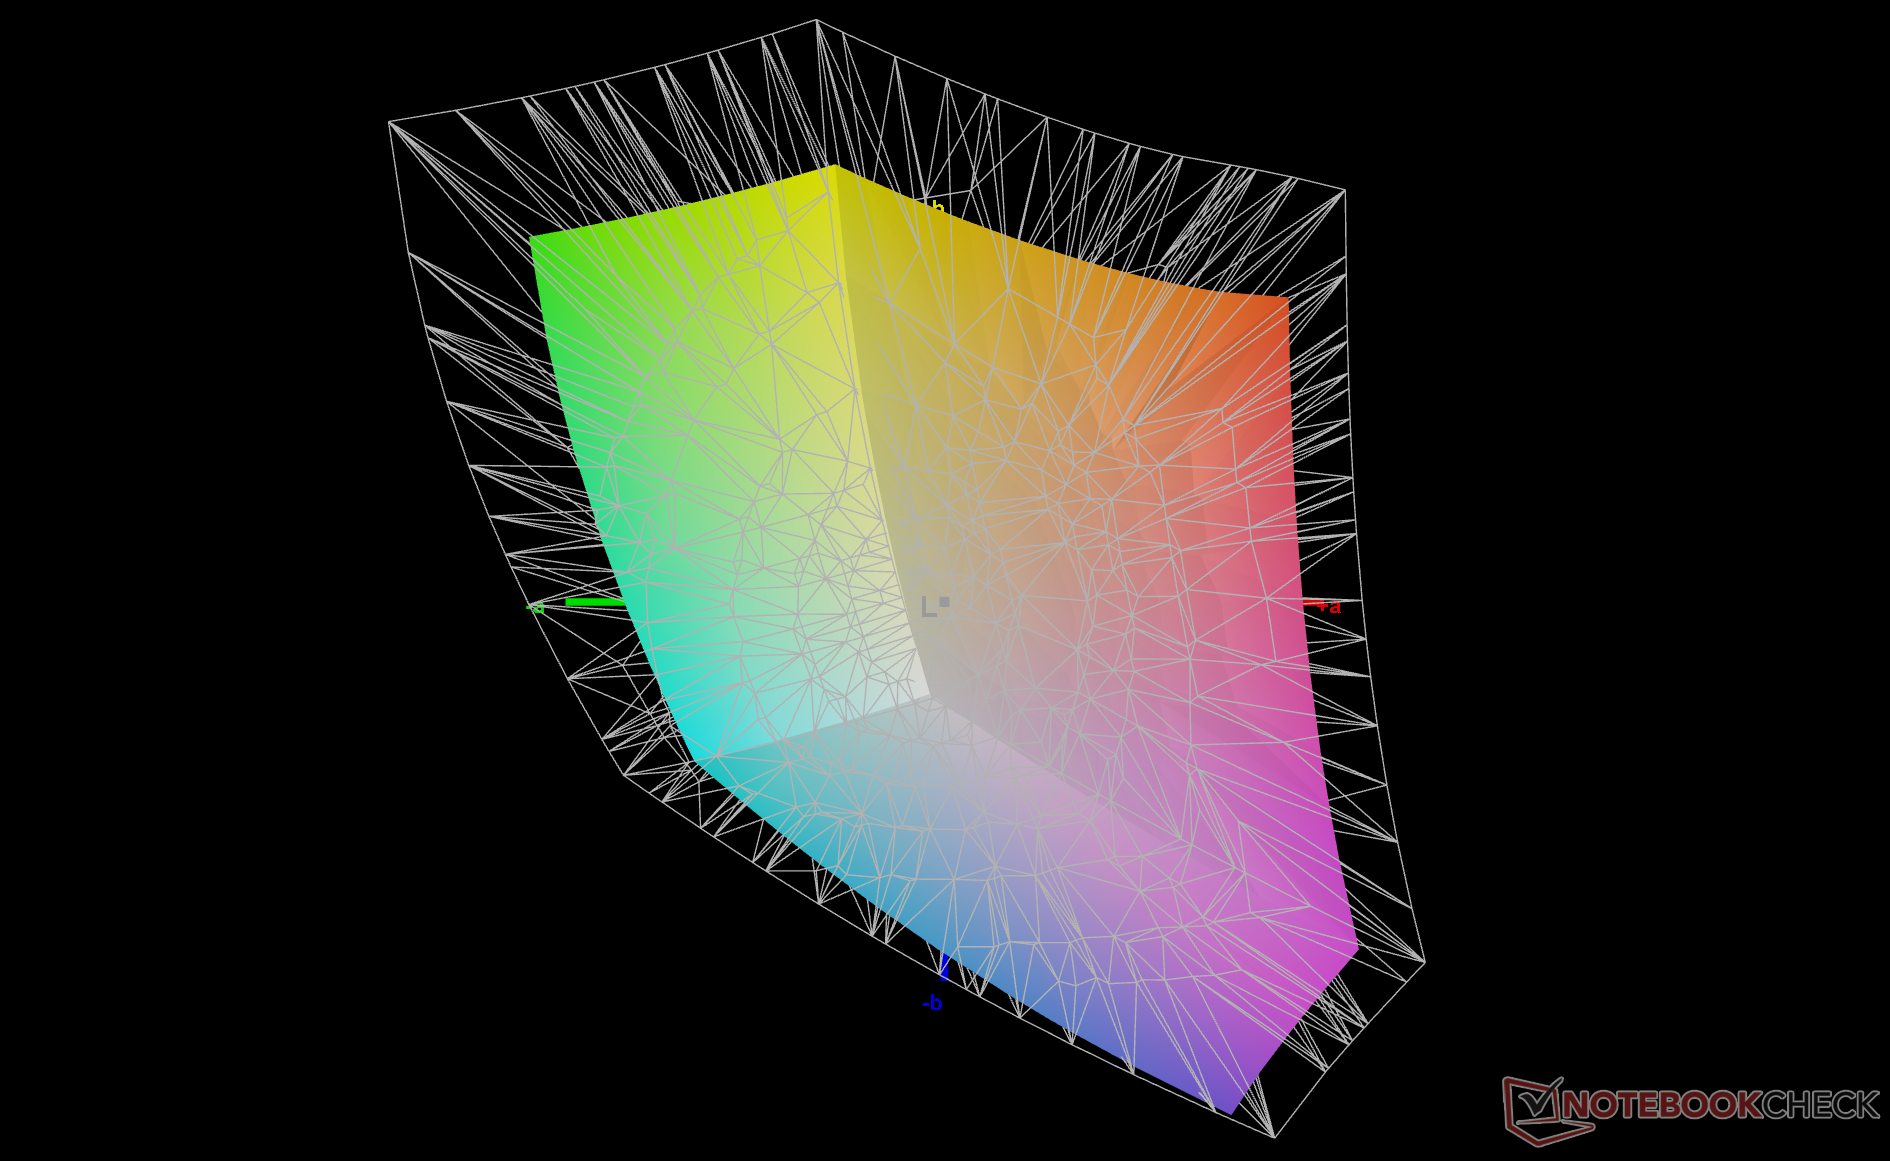
70.4% AdobeRGB 1998 (Argyll 3D)
98.3% sRGB (Argyll 3D)
68.4% Display P3 (Argyll 3D)
Gamma: 2.2
CCT: 6203 K
| HP Dragonfly G4 Chi Mei CMN13C0, IPS, 1920x1280, 13.5" | HP Elite Dragonfly G3 Chi Mei CMN13C0, IPS, 1920x1280, 13.5" | Framework Laptop 13.5 13th Gen Intel BOE CQ NE135FBM-N41, IPS, 2256x1504, 13.5" | Lenovo ThinkPad X13 G3 21CM002UGE M133NW4J R3, IPS LED, 1920x1200, 13.3" | Dell Latitude 9330 AU Optronics B133QAA, IPS, 2560x1600, 13.3" | Apple MacBook Air M2 Entry IPS, 2560x1664, 13.6" | |
|---|---|---|---|---|---|---|
| Display | -1% | 0% | 0% | 9% | 23% | |
| Display P3 Coverage (%) | 68.4 | 68 -1% | 68.9 1% | 69 1% | 77.8 14% | 98.4 44% |
| sRGB Coverage (%) | 98.3 | 98.3 0% | 97.5 -1% | 98.4 0% | 99.9 2% | 99.9 2% |
| AdobeRGB 1998 Coverage (%) | 70.4 | 69.9 -1% | 71.1 1% | 70.3 0% | 77.5 10% | 87.6 24% |
| Response Times | -8% | -10% | 10% | -50% | 27% | |
| Response Time Grey 50% / Grey 80% * (ms) | 48.8 ? | 50.8 ? -4% | 54.9 ? -13% | 44.2 ? 9% | 67.6 ? -39% | 32.9 ? 33% |
| Response Time Black / White * (ms) | 31.3 ? | 35.2 ? -12% | 33.5 ? -7% | 28.1 ? 10% | 50.4 ? -61% | 24.9 ? 20% |
| PWM Frequency (Hz) | ||||||
| Screen | -7% | -36% | 0% | -12% | 11% | |
| Brightness middle (cd/m²) | 408.8 | 387.2 -5% | 503 23% | 348 -15% | 542.3 33% | 526 29% |
| Brightness (cd/m²) | 399 | 360 -10% | 472 18% | 321 -20% | 516 29% | 486 22% |
| Brightness Distribution (%) | 90 | 80 -11% | 87 -3% | 85 -6% | 85 -6% | 87 -3% |
| Black Level * (cd/m²) | 0.32 | 0.26 19% | 0.36 -13% | 0.34 -6% | 0.38 -19% | 0.38 -19% |
| Contrast (:1) | 1278 | 1489 17% | 1397 9% | 1024 -20% | 1427 12% | 1384 8% |
| Colorchecker dE 2000 * | 2.02 | 2.36 -17% | 3.38 -67% | 1.3 36% | 3.18 -57% | 1.3 36% |
| Colorchecker dE 2000 max. * | 3.84 | 4.79 -25% | 7.08 -84% | 2.5 35% | 6.05 -58% | 2.7 30% |
| Colorchecker dE 2000 calibrated * | 0.61 | 0.63 -3% | 1.21 -98% | 1 -64% | 0.67 -10% | 0.7 -15% |
| Greyscale dE 2000 * | 2.3 | 3 -30% | 4.8 -109% | 0.9 61% | 3.1 -35% | 2 13% |
| Gamma | 2.2 100% | 2.17 101% | 2.13 103% | 2.16 102% | 2.08 106% | 2.25 98% |
| CCT | 6203 105% | 6137 106% | 6235 104% | 6431 101% | 6140 106% | 6858 95% |
| Total Average (Program / Settings) | -5% /
-6% | -15% /
-25% | 3% /
2% | -18% /
-13% | 20% /
16% |
* ... smaller is better
尽管惠普没有宣传出厂校准,但该显示器开箱即进行了良好的校准。使用X-Rite色度计校准面板可以进一步提高平均灰度和色彩deltaE值,分别从2.3和2.02降至1.1和0.61。用户可以在上面下载并应用我们校准的ICM配置文件。
Display Response Times
| ↔ Response Time Black to White | ||
|---|---|---|
| 31.3 ms ... rise ↗ and fall ↘ combined | ↗ 16.3 ms rise | 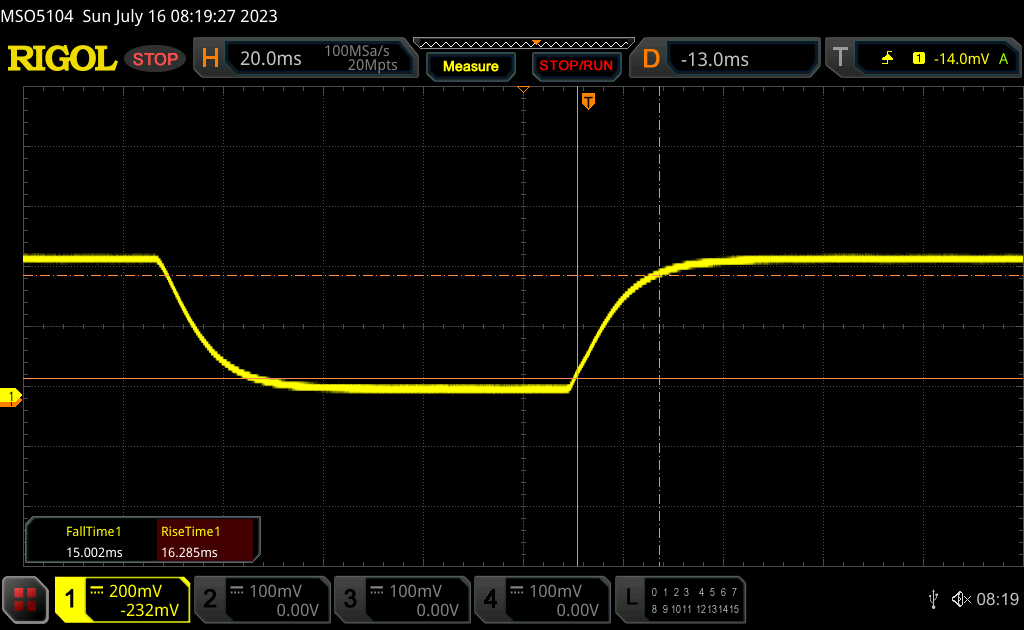 |
| ↘ 15 ms fall | ||
| The screen shows slow response rates in our tests and will be unsatisfactory for gamers. In comparison, all tested devices range from 0.1 (minimum) to 240 (maximum) ms. » 85 % of all devices are better. This means that the measured response time is worse than the average of all tested devices (19.8 ms). | ||
| ↔ Response Time 50% Grey to 80% Grey | ||
| 48.8 ms ... rise ↗ and fall ↘ combined | ↗ 22.9 ms rise | 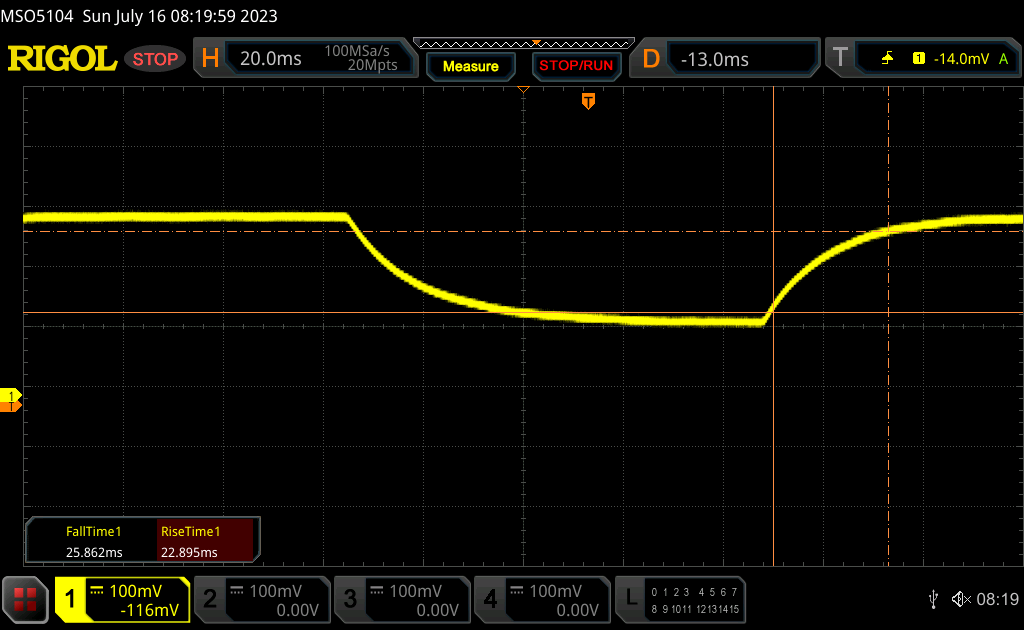 |
| ↘ 25.9 ms fall | ||
| The screen shows slow response rates in our tests and will be unsatisfactory for gamers. In comparison, all tested devices range from 0.165 (minimum) to 636 (maximum) ms. » 84 % of all devices are better. This means that the measured response time is worse than the average of all tested devices (31 ms). | ||
Screen Flickering / PWM (Pulse-Width Modulation)
| Screen flickering / PWM not detected | 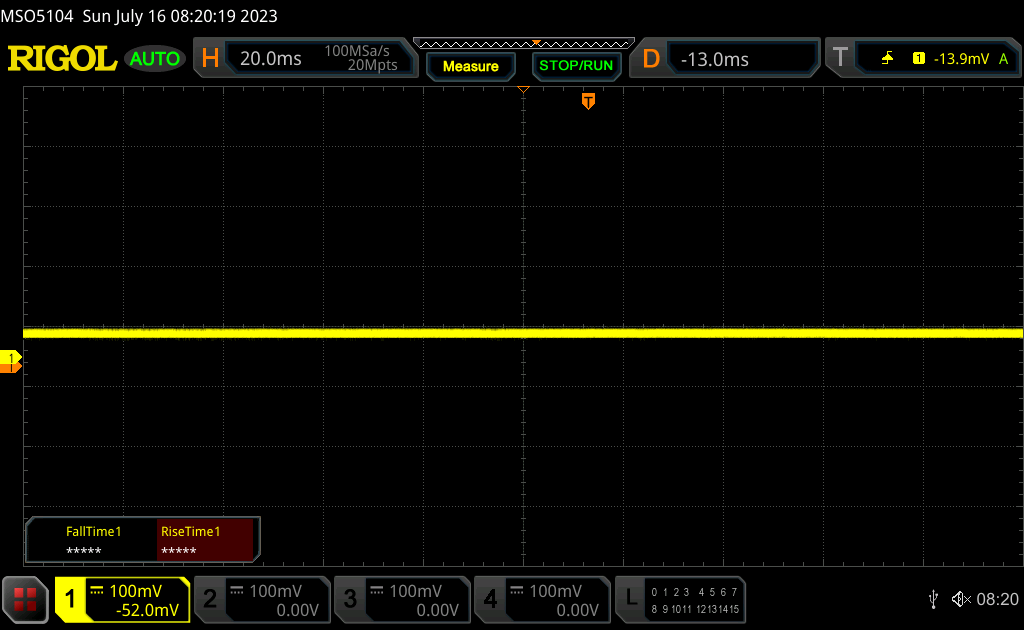 | ||
In comparison: 52 % of all tested devices do not use PWM to dim the display. If PWM was detected, an average of 7754 (minimum: 5 - maximum: 343500) Hz was measured. | |||
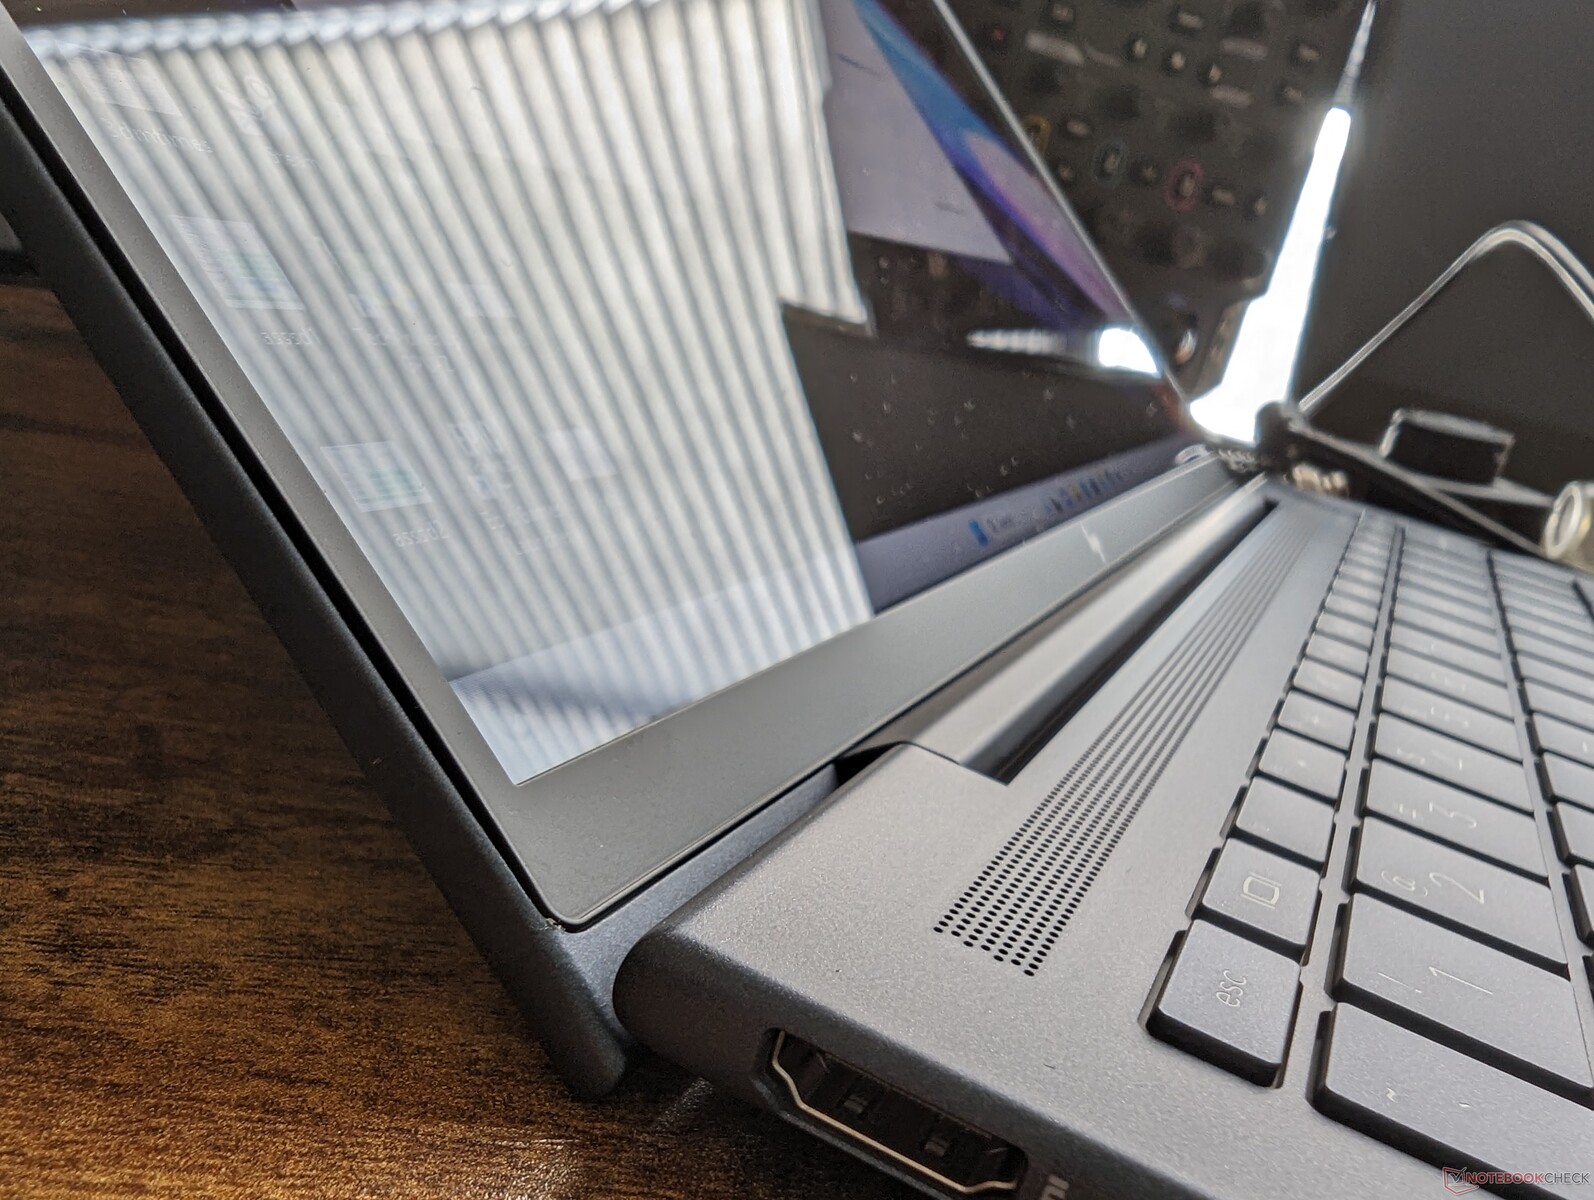
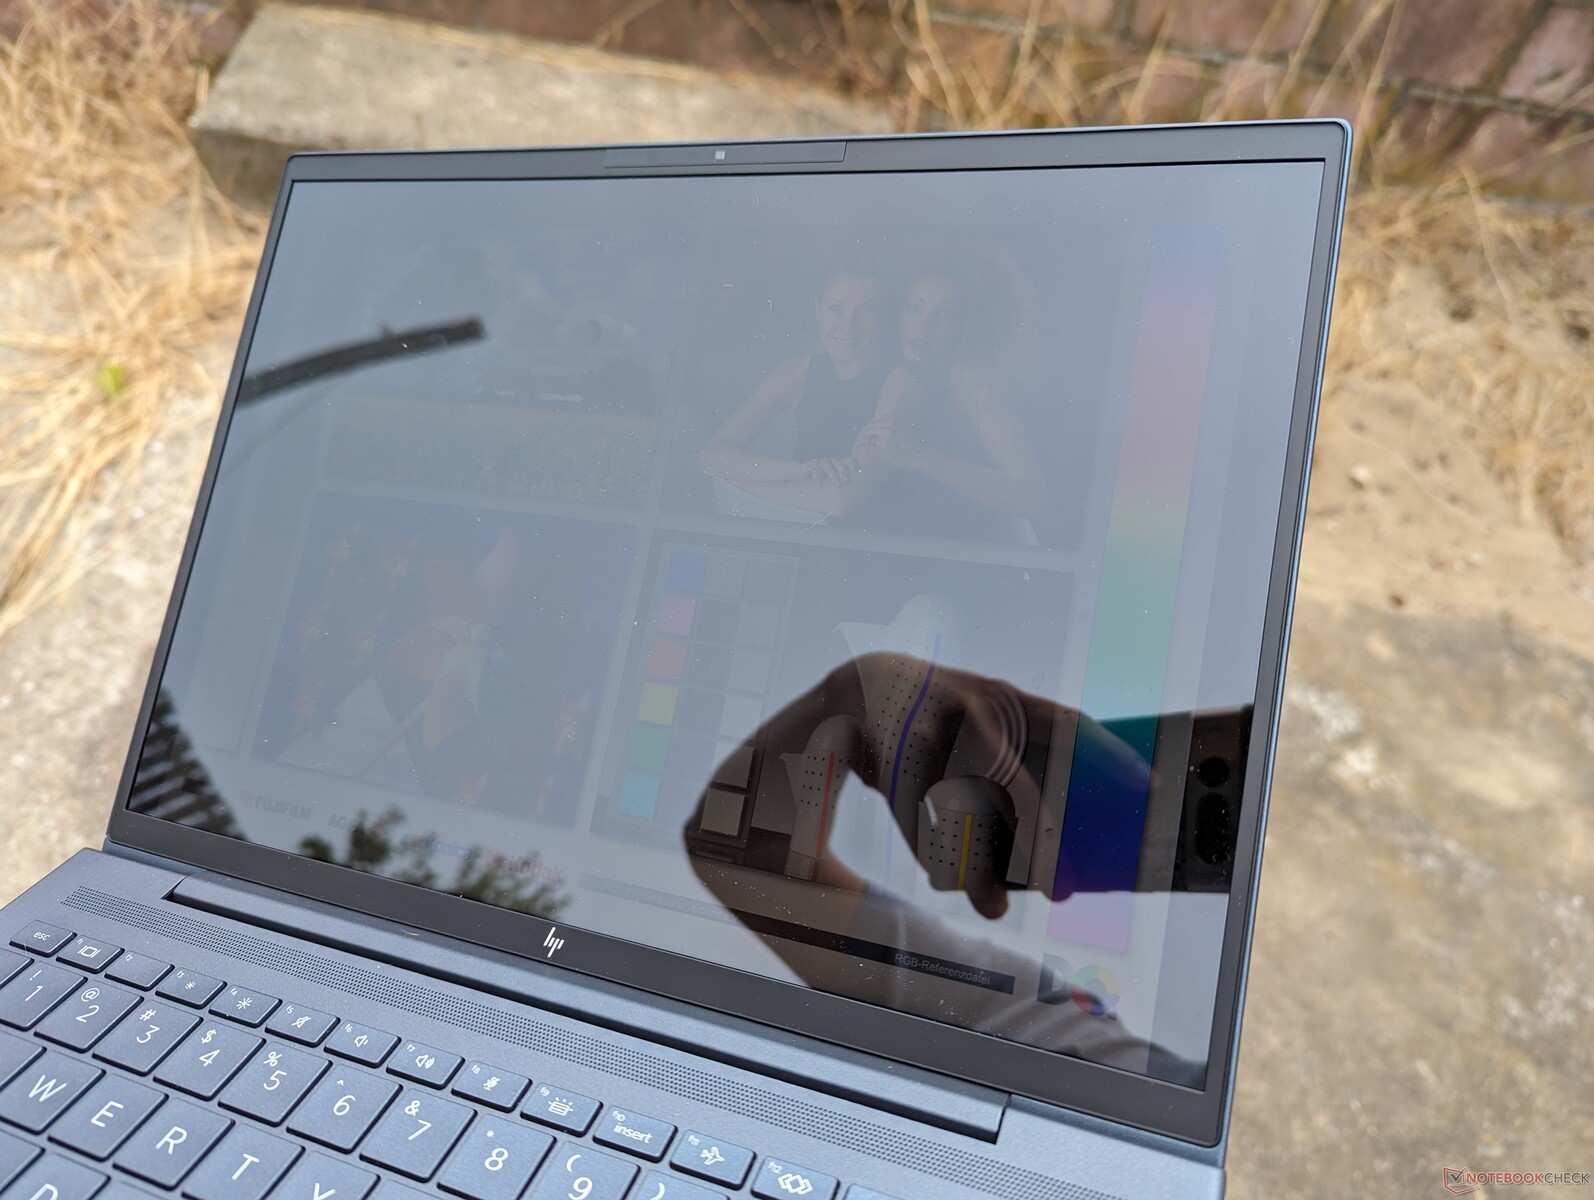
超高亮度的覆盖层和随之而来的眩光阻碍了室外能见度。值得庆幸的是,惠普仍然是唯一提供1000尼特面板选项的主要制造商之一,其亮度是大多数其他商用笔记本电脑的2倍。
性能
测试条件
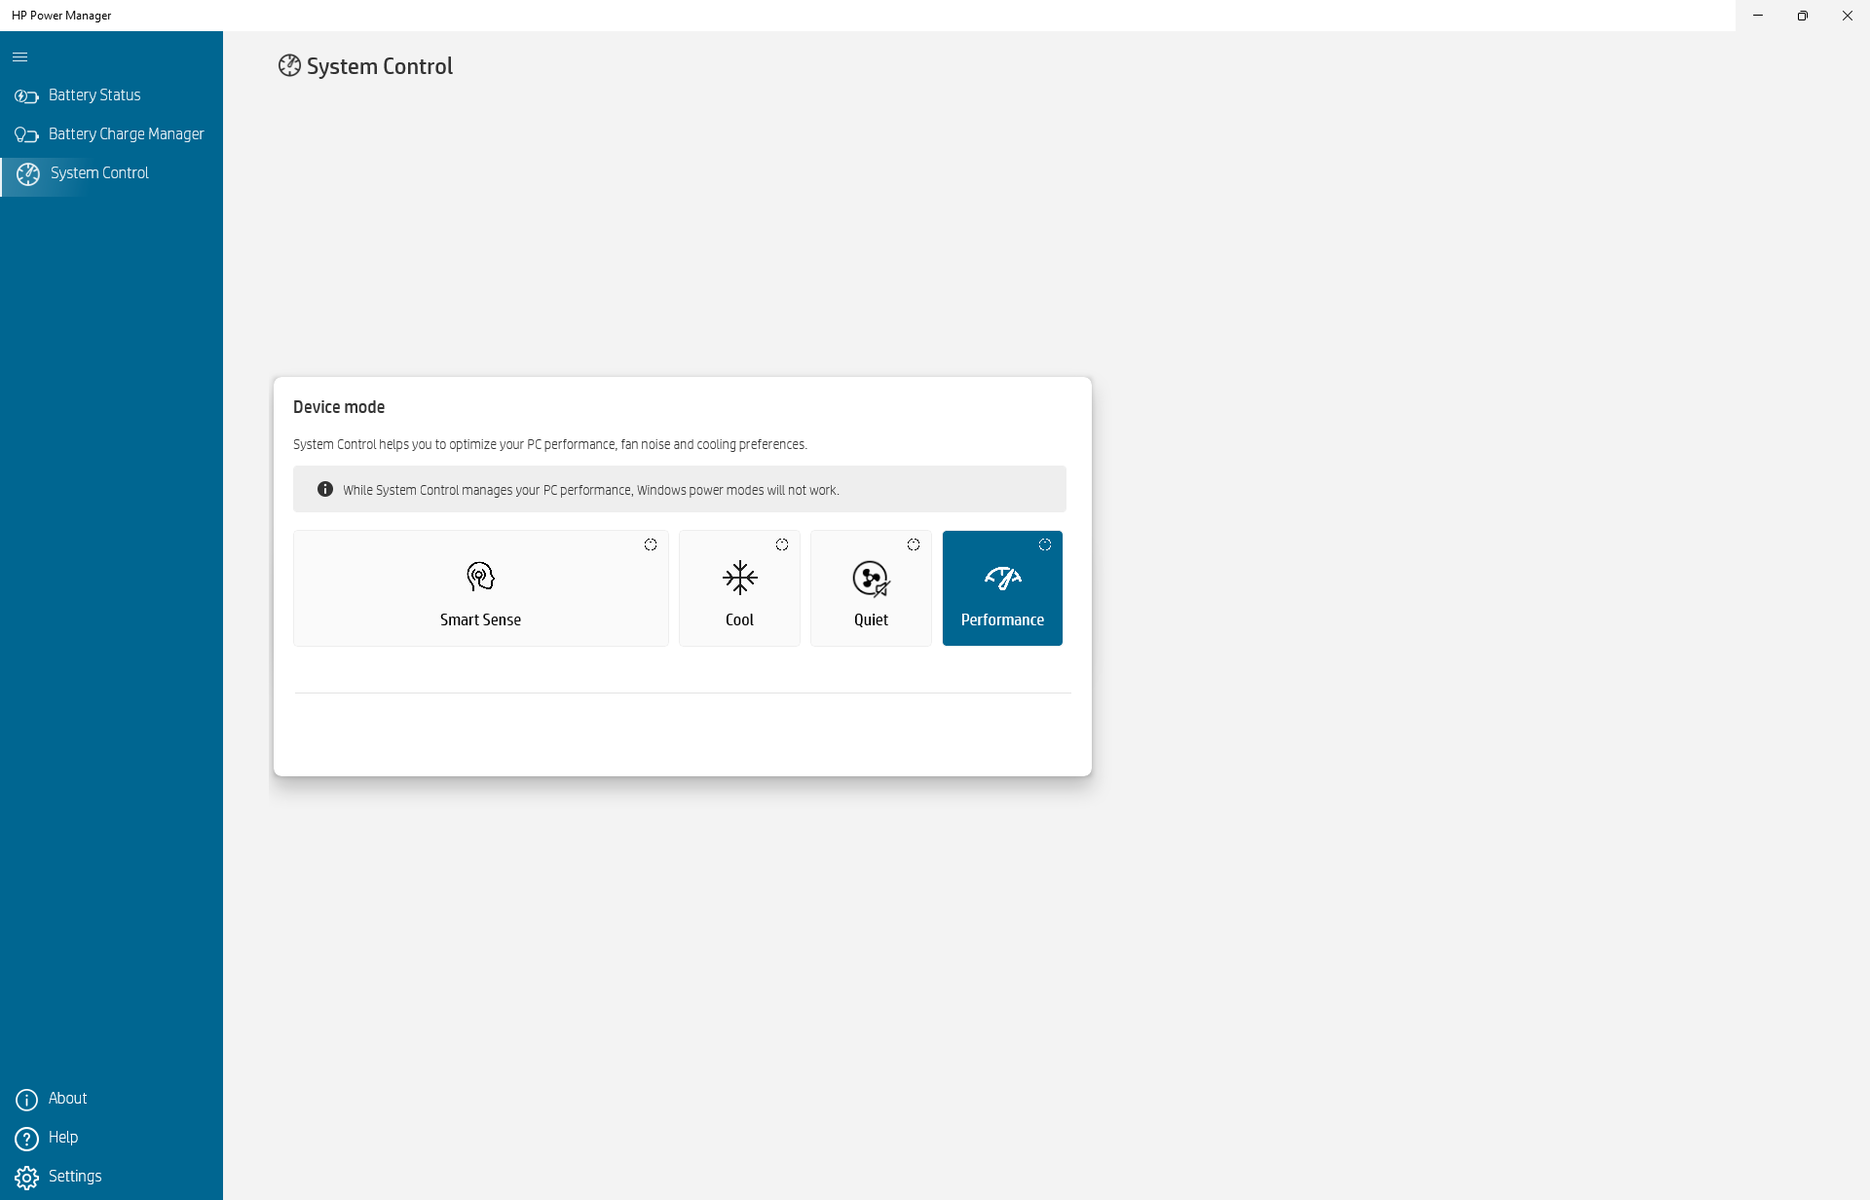
在运行以下基准测试之前,我们通过惠普电源管理器将设备设置为性能模式。电源管理器软件是今年该系列的新功能,如下图所示,它的电源配置文件设置可以覆盖默认的Windows电源配置文件。

处理器
原始多线程性能比第 12 代酷睿 i7-1265U 快达 20 酷睿i7-1265U快 20%。然而,一旦 Turbo Boost 稳定下来,i7-1365U 和 Dragonfly G3 之间的性能优势就会消失。 i7-1365U和i7-1265U之间的性能优势仅为10%,如下文CineBench R15 xT循环测试结果所示。新CPU通常被认为是去年Alder Lake-U产品的小更新或品牌重塑。
总体性能比配备相同酷睿i7-1365U处理器的大多数其他笔记本电脑低15%左右。事实上三星Galaxy Book3 15,配备更便宜的 酷睿i5-1335U处理器在多线程工作负载中的性能始终优于我们的酷睿i7蜻蜓G4处理器。惠普Dragonfly系列的CPU运行速度一直比竞争对手稍慢。
可惜的是,该系列没有提供任何Core-P选项,如 酷睿i7-1370P的多线程性能将大幅提升75%。 框架 13.5.
Cinebench R15 Multi Loop
Cinebench R23: Multi Core | Single Core
Cinebench R20: CPU (Multi Core) | CPU (Single Core)
Cinebench R15: CPU Multi 64Bit | CPU Single 64Bit
Blender: v2.79 BMW27 CPU
7-Zip 18.03: 7z b 4 | 7z b 4 -mmt1
Geekbench 5.5: Multi-Core | Single-Core
HWBOT x265 Benchmark v2.2: 4k Preset
LibreOffice : 20 Documents To PDF
R Benchmark 2.5: Overall mean
* ... smaller is better
AIDA64: FP32 Ray-Trace | FPU Julia | CPU SHA3 | CPU Queen | FPU SinJulia | FPU Mandel | CPU AES | CPU ZLib | FP64 Ray-Trace | CPU PhotoWorxx
| Performance rating | |
| Framework Laptop 13.5 13th Gen Intel | |
| Lenovo ThinkPad X13 G3 21CM002UGE | |
| Average Intel Core i7-1365U | |
| HP Dragonfly G4 | |
| Dell Latitude 9330 | |
| HP Elite Dragonfly G3 | |
| AIDA64 / FP32 Ray-Trace | |
| Framework Laptop 13.5 13th Gen Intel | |
| Lenovo ThinkPad X13 G3 21CM002UGE | |
| Average Intel Core i7-1365U (6720 - 8270, n=4) | |
| HP Dragonfly G4 | |
| Dell Latitude 9330 | |
| HP Elite Dragonfly G3 | |
| AIDA64 / FPU Julia | |
| Framework Laptop 13.5 13th Gen Intel | |
| Lenovo ThinkPad X13 G3 21CM002UGE | |
| Average Intel Core i7-1365U (33777 - 41487, n=4) | |
| Dell Latitude 9330 | |
| HP Dragonfly G4 | |
| HP Elite Dragonfly G3 | |
| AIDA64 / CPU SHA3 | |
| Framework Laptop 13.5 13th Gen Intel | |
| Average Intel Core i7-1365U (1754 - 2216, n=4) | |
| Lenovo ThinkPad X13 G3 21CM002UGE | |
| Dell Latitude 9330 | |
| HP Dragonfly G4 | |
| HP Elite Dragonfly G3 | |
| AIDA64 / CPU Queen | |
| Framework Laptop 13.5 13th Gen Intel | |
| HP Dragonfly G4 | |
| Lenovo ThinkPad X13 G3 21CM002UGE | |
| Average Intel Core i7-1365U (67557 - 69991, n=4) | |
| HP Elite Dragonfly G3 | |
| Dell Latitude 9330 | |
| AIDA64 / FPU SinJulia | |
| Framework Laptop 13.5 13th Gen Intel | |
| Lenovo ThinkPad X13 G3 21CM002UGE | |
| Average Intel Core i7-1365U (4589 - 5145, n=4) | |
| HP Dragonfly G4 | |
| HP Elite Dragonfly G3 | |
| Dell Latitude 9330 | |
| AIDA64 / FPU Mandel | |
| Lenovo ThinkPad X13 G3 21CM002UGE | |
| Framework Laptop 13.5 13th Gen Intel | |
| Average Intel Core i7-1365U (16808 - 20668, n=4) | |
| Dell Latitude 9330 | |
| HP Dragonfly G4 | |
| HP Elite Dragonfly G3 | |
| AIDA64 / CPU AES | |
| Framework Laptop 13.5 13th Gen Intel | |
| Average Intel Core i7-1365U (34968 - 41413, n=4) | |
| Lenovo ThinkPad X13 G3 21CM002UGE | |
| HP Dragonfly G4 | |
| Dell Latitude 9330 | |
| HP Elite Dragonfly G3 | |
| AIDA64 / CPU ZLib | |
| Framework Laptop 13.5 13th Gen Intel | |
| Average Intel Core i7-1365U (519 - 650, n=4) | |
| HP Dragonfly G4 | |
| Dell Latitude 9330 | |
| Lenovo ThinkPad X13 G3 21CM002UGE | |
| HP Elite Dragonfly G3 | |
| AIDA64 / FP64 Ray-Trace | |
| Framework Laptop 13.5 13th Gen Intel | |
| Lenovo ThinkPad X13 G3 21CM002UGE | |
| Average Intel Core i7-1365U (3513 - 4367, n=4) | |
| Dell Latitude 9330 | |
| HP Dragonfly G4 | |
| HP Elite Dragonfly G3 | |
| AIDA64 / CPU PhotoWorxx | |
| Average Intel Core i7-1365U (37846 - 43780, n=4) | |
| HP Elite Dragonfly G3 | |
| HP Dragonfly G4 | |
| Dell Latitude 9330 | |
| Framework Laptop 13.5 13th Gen Intel | |
| Lenovo ThinkPad X13 G3 21CM002UGE | |
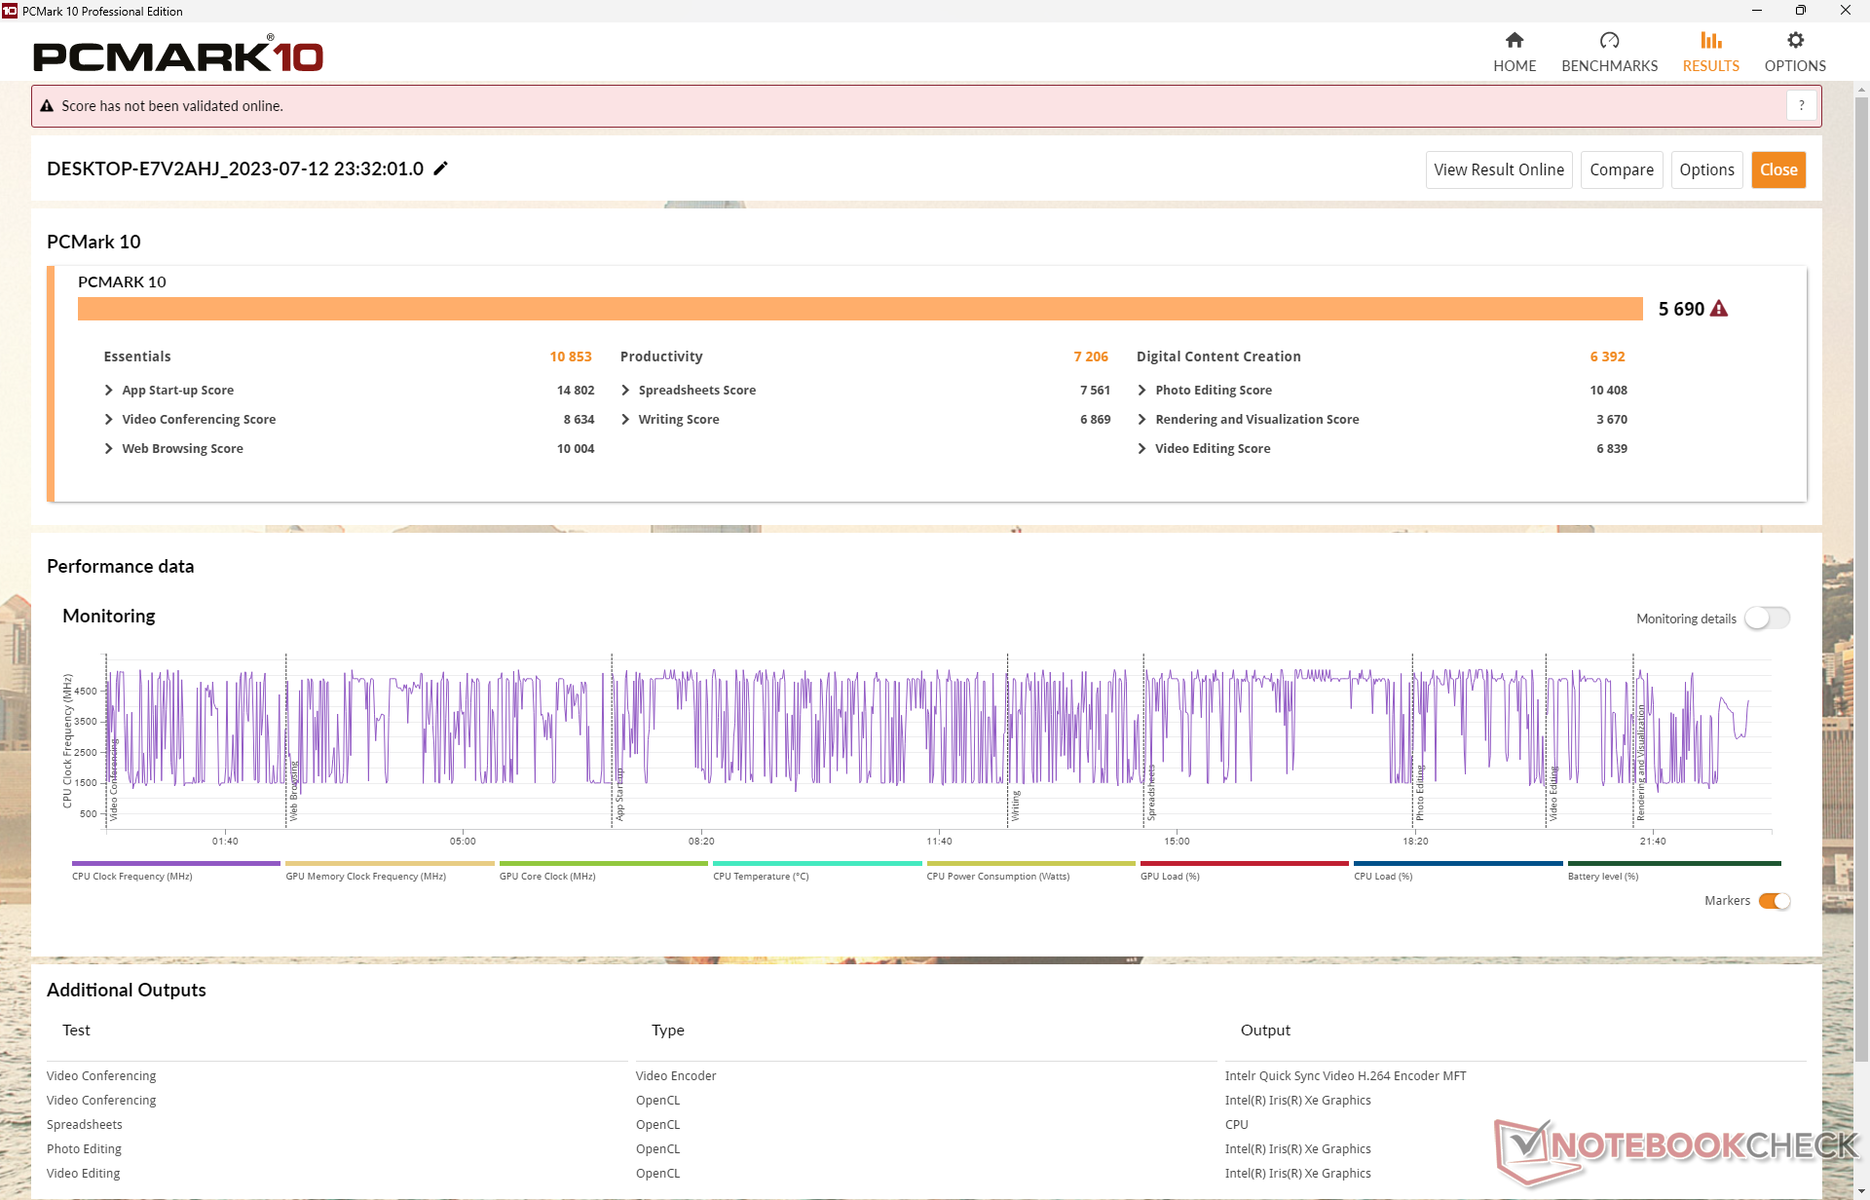
系统性能
PCMark 分数始终高于去年的机型,但略低于 Framework 13.5 及其更快的 Core-P CPU。结果与戴尔Latitude 9440 二合一 戴尔9440二合一笔记本电脑相当,后者配备了相同的酷睿i7-1365U处理器。
CrossMark: Overall | Productivity | Creativity | Responsiveness
| PCMark 10 / Score | |
| Framework Laptop 13.5 13th Gen Intel | |
| Average Intel Core i7-1365U, Intel Iris Xe Graphics G7 96EUs (5690 - 5980, n=4) | |
| HP Dragonfly G4 | |
| Lenovo ThinkPad X13 G3 21CM002UGE | |
| Dell Latitude 9330 | |
| HP Elite Dragonfly G3 | |
| PCMark 10 / Essentials | |
| Framework Laptop 13.5 13th Gen Intel | |
| Average Intel Core i7-1365U, Intel Iris Xe Graphics G7 96EUs (10635 - 11827, n=4) | |
| HP Dragonfly G4 | |
| Dell Latitude 9330 | |
| Lenovo ThinkPad X13 G3 21CM002UGE | |
| HP Elite Dragonfly G3 | |
| PCMark 10 / Productivity | |
| Lenovo ThinkPad X13 G3 21CM002UGE | |
| Framework Laptop 13.5 13th Gen Intel | |
| Average Intel Core i7-1365U, Intel Iris Xe Graphics G7 96EUs (7206 - 7708, n=4) | |
| HP Dragonfly G4 | |
| Dell Latitude 9330 | |
| HP Elite Dragonfly G3 | |
| PCMark 10 / Digital Content Creation | |
| Framework Laptop 13.5 13th Gen Intel | |
| Average Intel Core i7-1365U, Intel Iris Xe Graphics G7 96EUs (6392 - 6735, n=4) | |
| HP Dragonfly G4 | |
| Lenovo ThinkPad X13 G3 21CM002UGE | |
| HP Elite Dragonfly G3 | |
| Dell Latitude 9330 | |
| CrossMark / Overall | |
| Framework Laptop 13.5 13th Gen Intel | |
| Average Intel Core i7-1365U, Intel Iris Xe Graphics G7 96EUs (1605 - 1675, n=4) | |
| HP Dragonfly G4 | |
| Apple MacBook Air M2 Entry | |
| HP Elite Dragonfly G3 | |
| Lenovo ThinkPad X13 G3 21CM002UGE | |
| CrossMark / Productivity | |
| Framework Laptop 13.5 13th Gen Intel | |
| HP Dragonfly G4 | |
| Average Intel Core i7-1365U, Intel Iris Xe Graphics G7 96EUs (1582 - 1650, n=4) | |
| HP Elite Dragonfly G3 | |
| Apple MacBook Air M2 Entry | |
| Lenovo ThinkPad X13 G3 21CM002UGE | |
| CrossMark / Creativity | |
| Framework Laptop 13.5 13th Gen Intel | |
| Apple MacBook Air M2 Entry | |
| Average Intel Core i7-1365U, Intel Iris Xe Graphics G7 96EUs (1713 - 1797, n=4) | |
| HP Dragonfly G4 | |
| HP Elite Dragonfly G3 | |
| Lenovo ThinkPad X13 G3 21CM002UGE | |
| CrossMark / Responsiveness | |
| Framework Laptop 13.5 13th Gen Intel | |
| Average Intel Core i7-1365U, Intel Iris Xe Graphics G7 96EUs (1373 - 1427, n=4) | |
| HP Dragonfly G4 | |
| HP Elite Dragonfly G3 | |
| Lenovo ThinkPad X13 G3 21CM002UGE | |
| Apple MacBook Air M2 Entry | |
| PCMark 10 Score | 5690 points | |
Help | ||
| AIDA64 / Memory Copy | |
| Dell Latitude 9330 | |
| HP Elite Dragonfly G3 | |
| Average Intel Core i7-1365U (57654 - 69736, n=4) | |
| HP Dragonfly G4 | |
| Lenovo ThinkPad X13 G3 21CM002UGE | |
| Framework Laptop 13.5 13th Gen Intel | |
| AIDA64 / Memory Read | |
| HP Elite Dragonfly G3 | |
| Dell Latitude 9330 | |
| Average Intel Core i7-1365U (49203 - 54068, n=4) | |
| Framework Laptop 13.5 13th Gen Intel | |
| HP Dragonfly G4 | |
| Lenovo ThinkPad X13 G3 21CM002UGE | |
| AIDA64 / Memory Write | |
| Average Intel Core i7-1365U (70434 - 85570, n=4) | |
| HP Dragonfly G4 | |
| Dell Latitude 9330 | |
| HP Elite Dragonfly G3 | |
| Lenovo ThinkPad X13 G3 21CM002UGE | |
| Framework Laptop 13.5 13th Gen Intel | |
| AIDA64 / Memory Latency | |
| Lenovo ThinkPad X13 G3 21CM002UGE | |
| Dell Latitude 9330 | |
| HP Elite Dragonfly G3 | |
| Average Intel Core i7-1365U (90.2 - 102.2, n=4) | |
| HP Dragonfly G4 | |
| Framework Laptop 13.5 13th Gen Intel | |
* ... smaller is better
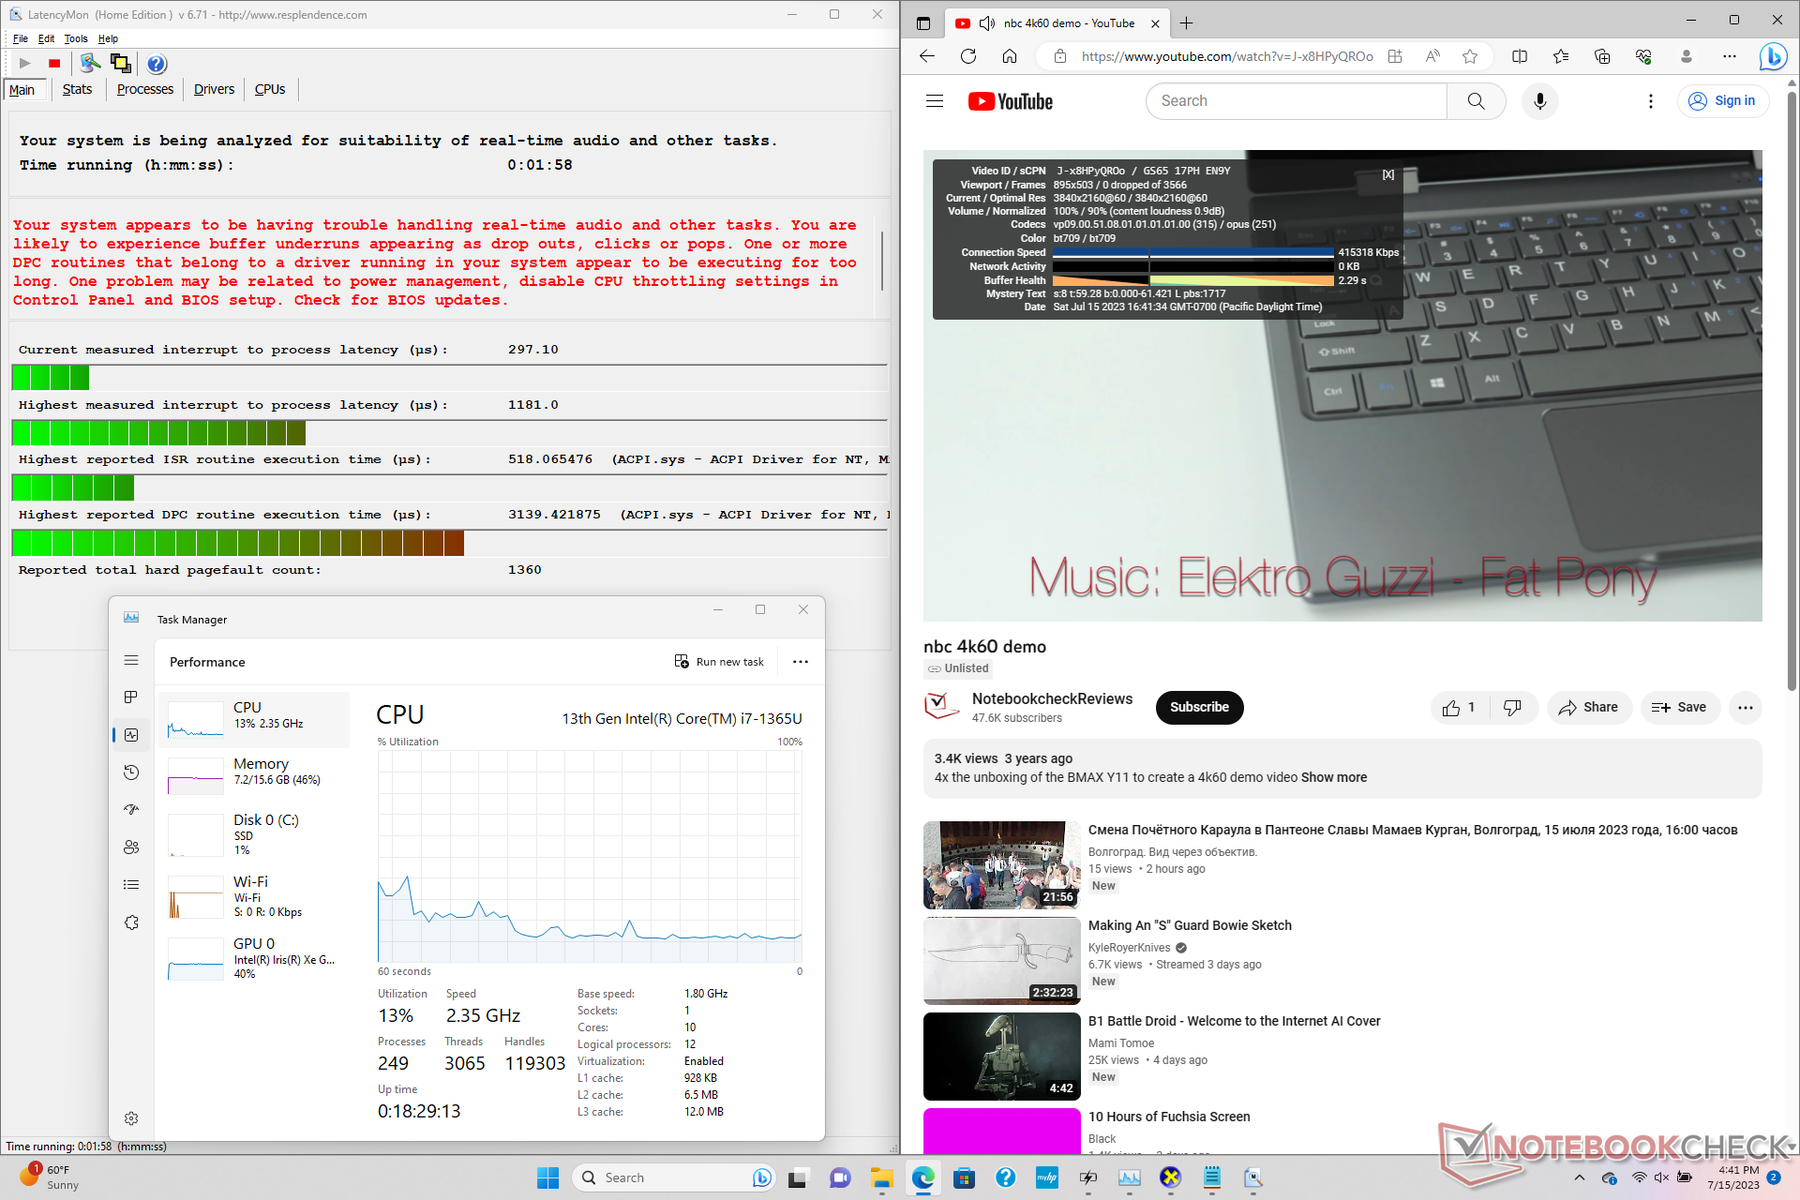
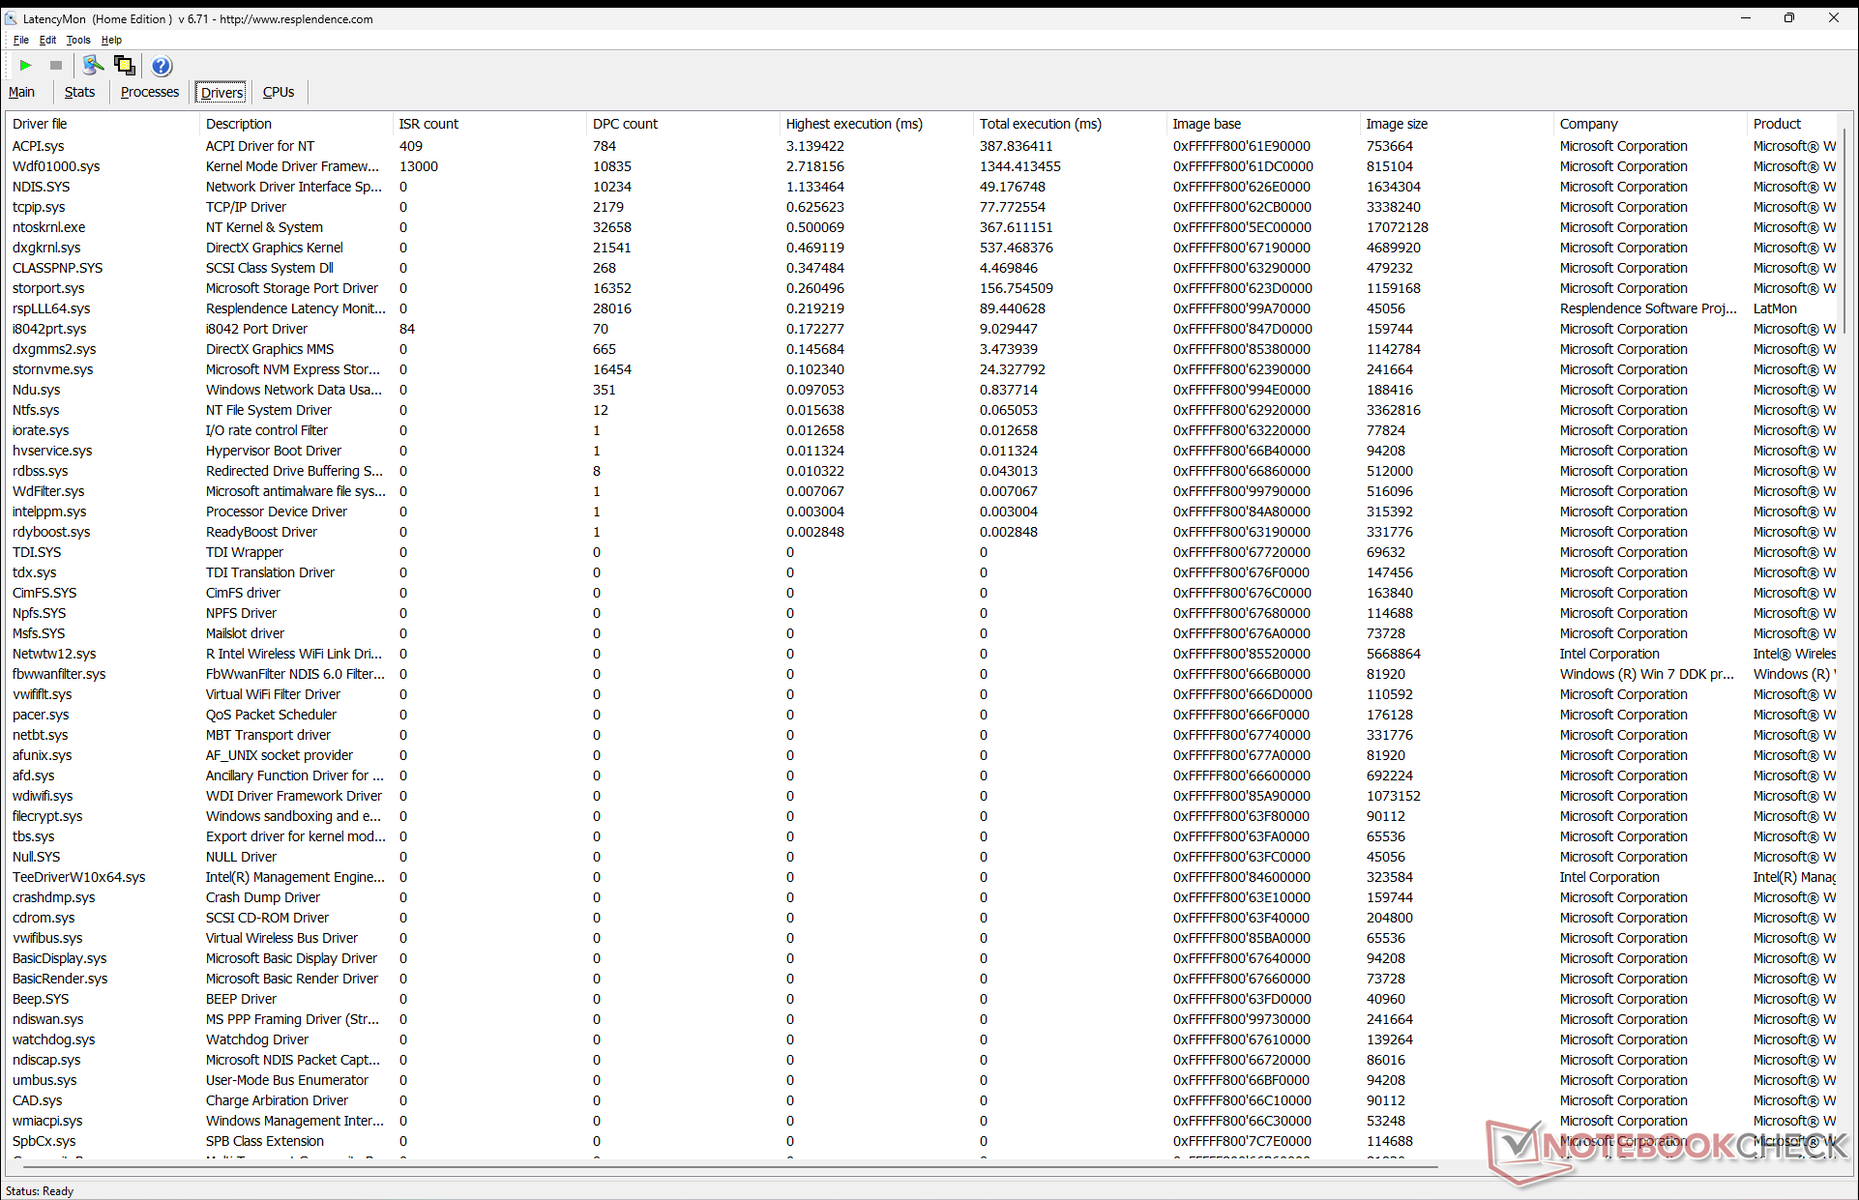
DPC延迟
LatencyMon显示,在打开我们主页的多个浏览器标签页时,只有轻微的DPC问题。在其他方面,以60 FPS播放4K视频也非常完美,没有出现掉帧现象。
| DPC Latencies / LatencyMon - interrupt to process latency (max), Web, Youtube, Prime95 | |
| Dell Latitude 9330 | |
| HP Dragonfly G4 | |
| HP Elite Dragonfly G3 | |
| Lenovo ThinkPad X13 G3 21CM002UGE | |
| Framework Laptop 13.5 13th Gen Intel | |
* ... smaller is better
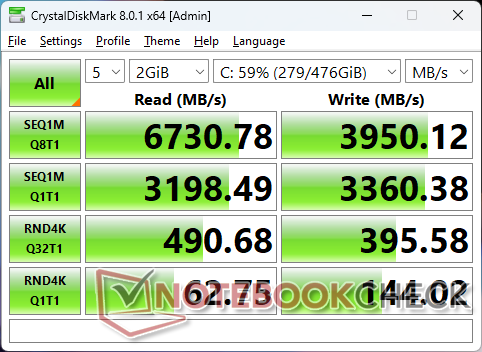
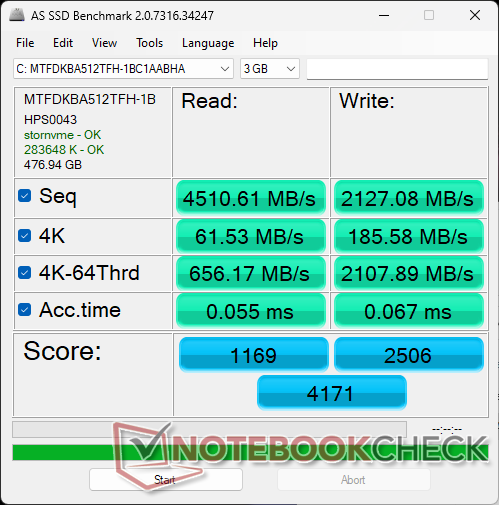
存储设备
惠普坚持使用 美光3400 NVMe固态硬盘惠普连续第二年采用美光3400 NVMe固态硬盘,而戴尔XPS 13系列则采用三星、美光或西部数据的固态硬盘。

| Drive Performance rating - Percent | |
| Framework Laptop 13.5 13th Gen Intel | |
| HP Dragonfly G4 | |
| Lenovo ThinkPad X13 G3 21CM002UGE | |
| HP Elite Dragonfly G3 | |
| Dell Latitude 9330 | |
* ... smaller is better
Disk Throttling: DiskSpd Read Loop, Queue Depth 8
GPU性能
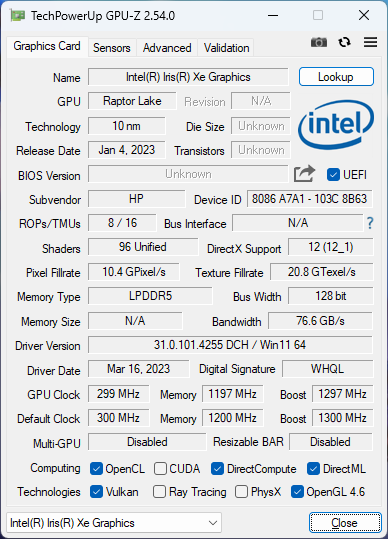
图形性能比去年的Dragonfly G3稍快,主要是因为CPU的速度稍快。要想获得更明显的提升,买家必须在其他地方购买AMD Radeon 680M或 780M 如华硕Zenbook S 13或 联想 Yoga Pro 7 14.
如下图3DMark 11对比表所示,在平衡模式而非性能模式下运行系统会阻碍CPU和GPU性能的提升,分别高达12%和6%。
| 电源配置文件 | 图形分数 | 物理得分 | 综合得分 |
| 平衡模式 | 6061 (-6%) | 10145 (-12%) | 4879 (-16%) |
| 绩效模式 | 6440 | 11465 | 5780 |
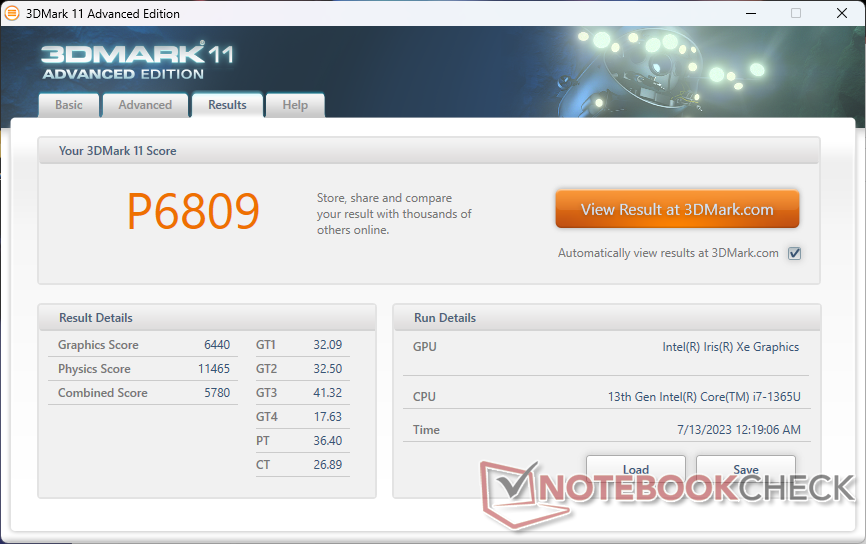
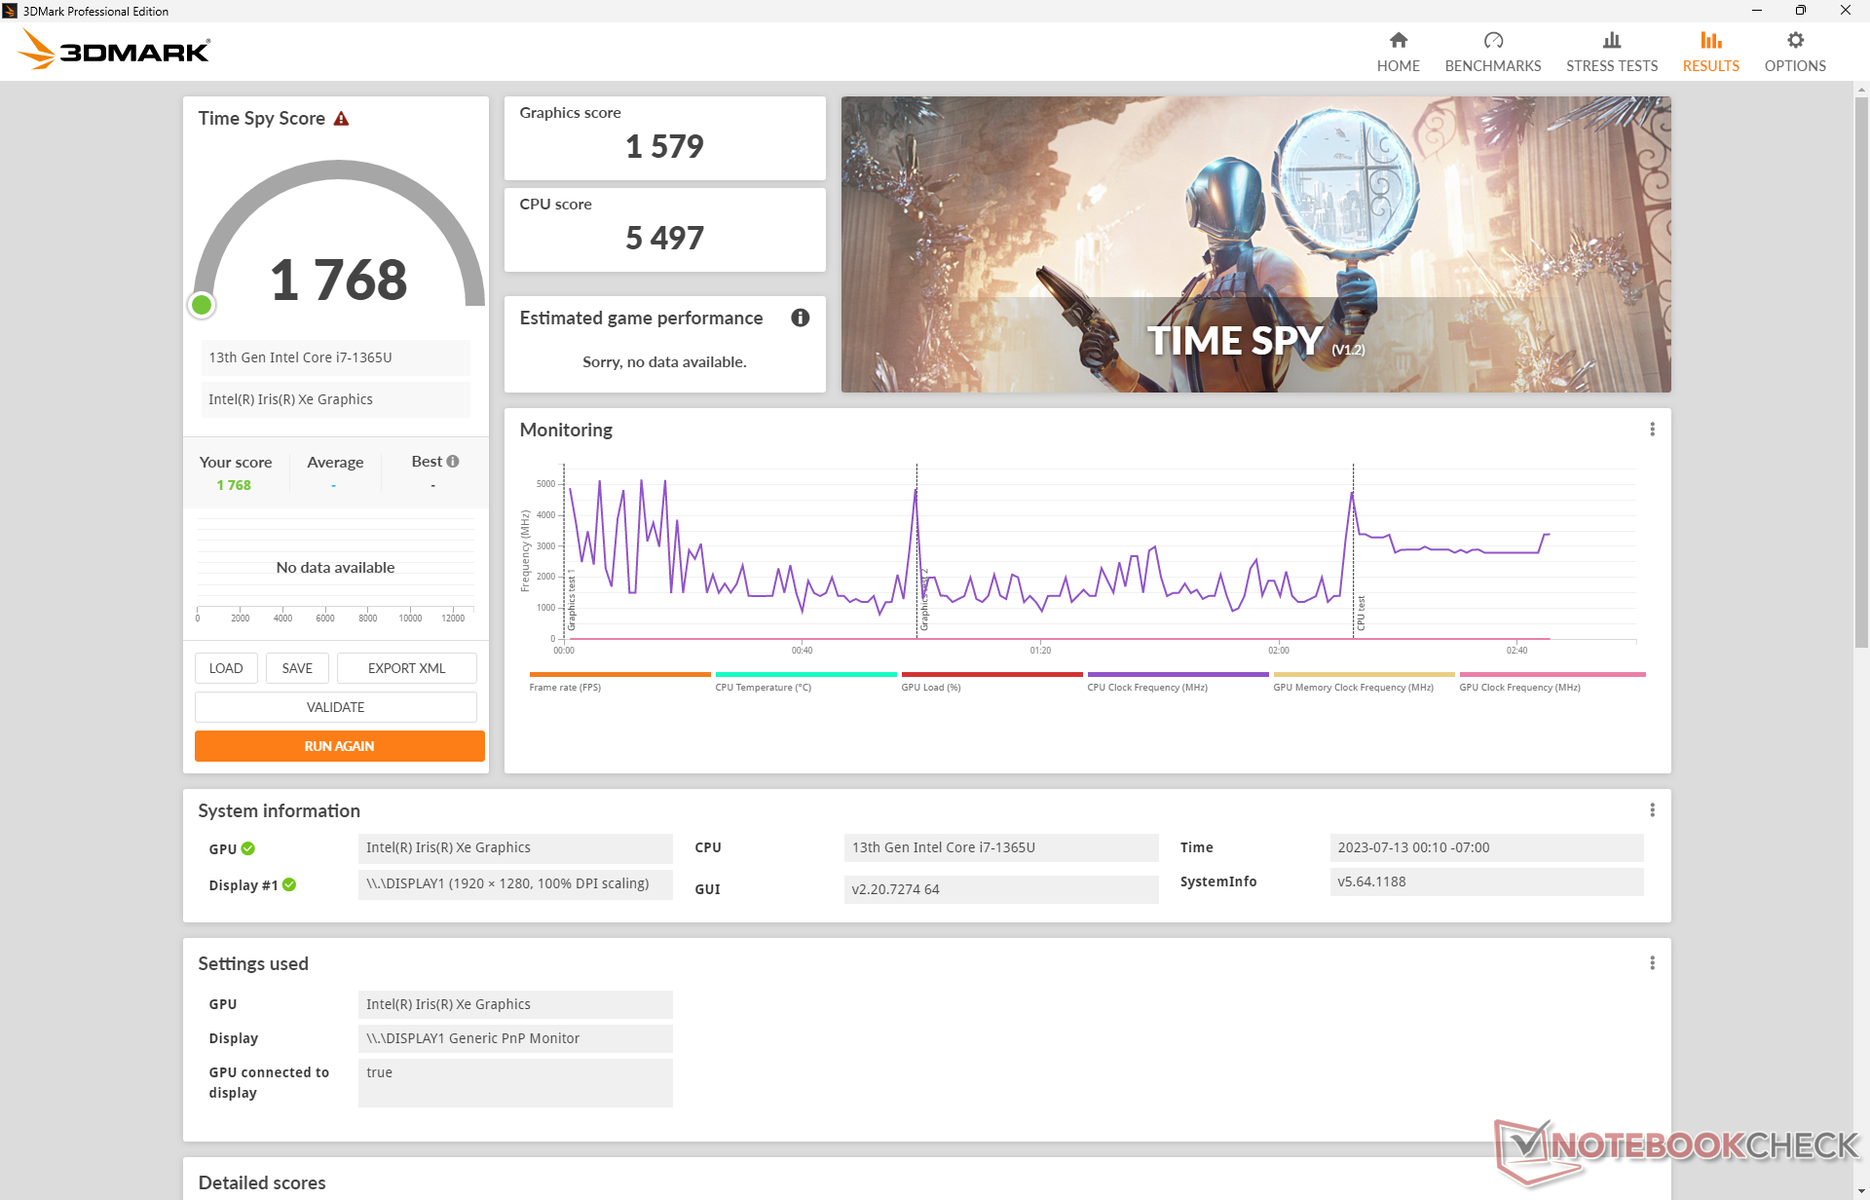
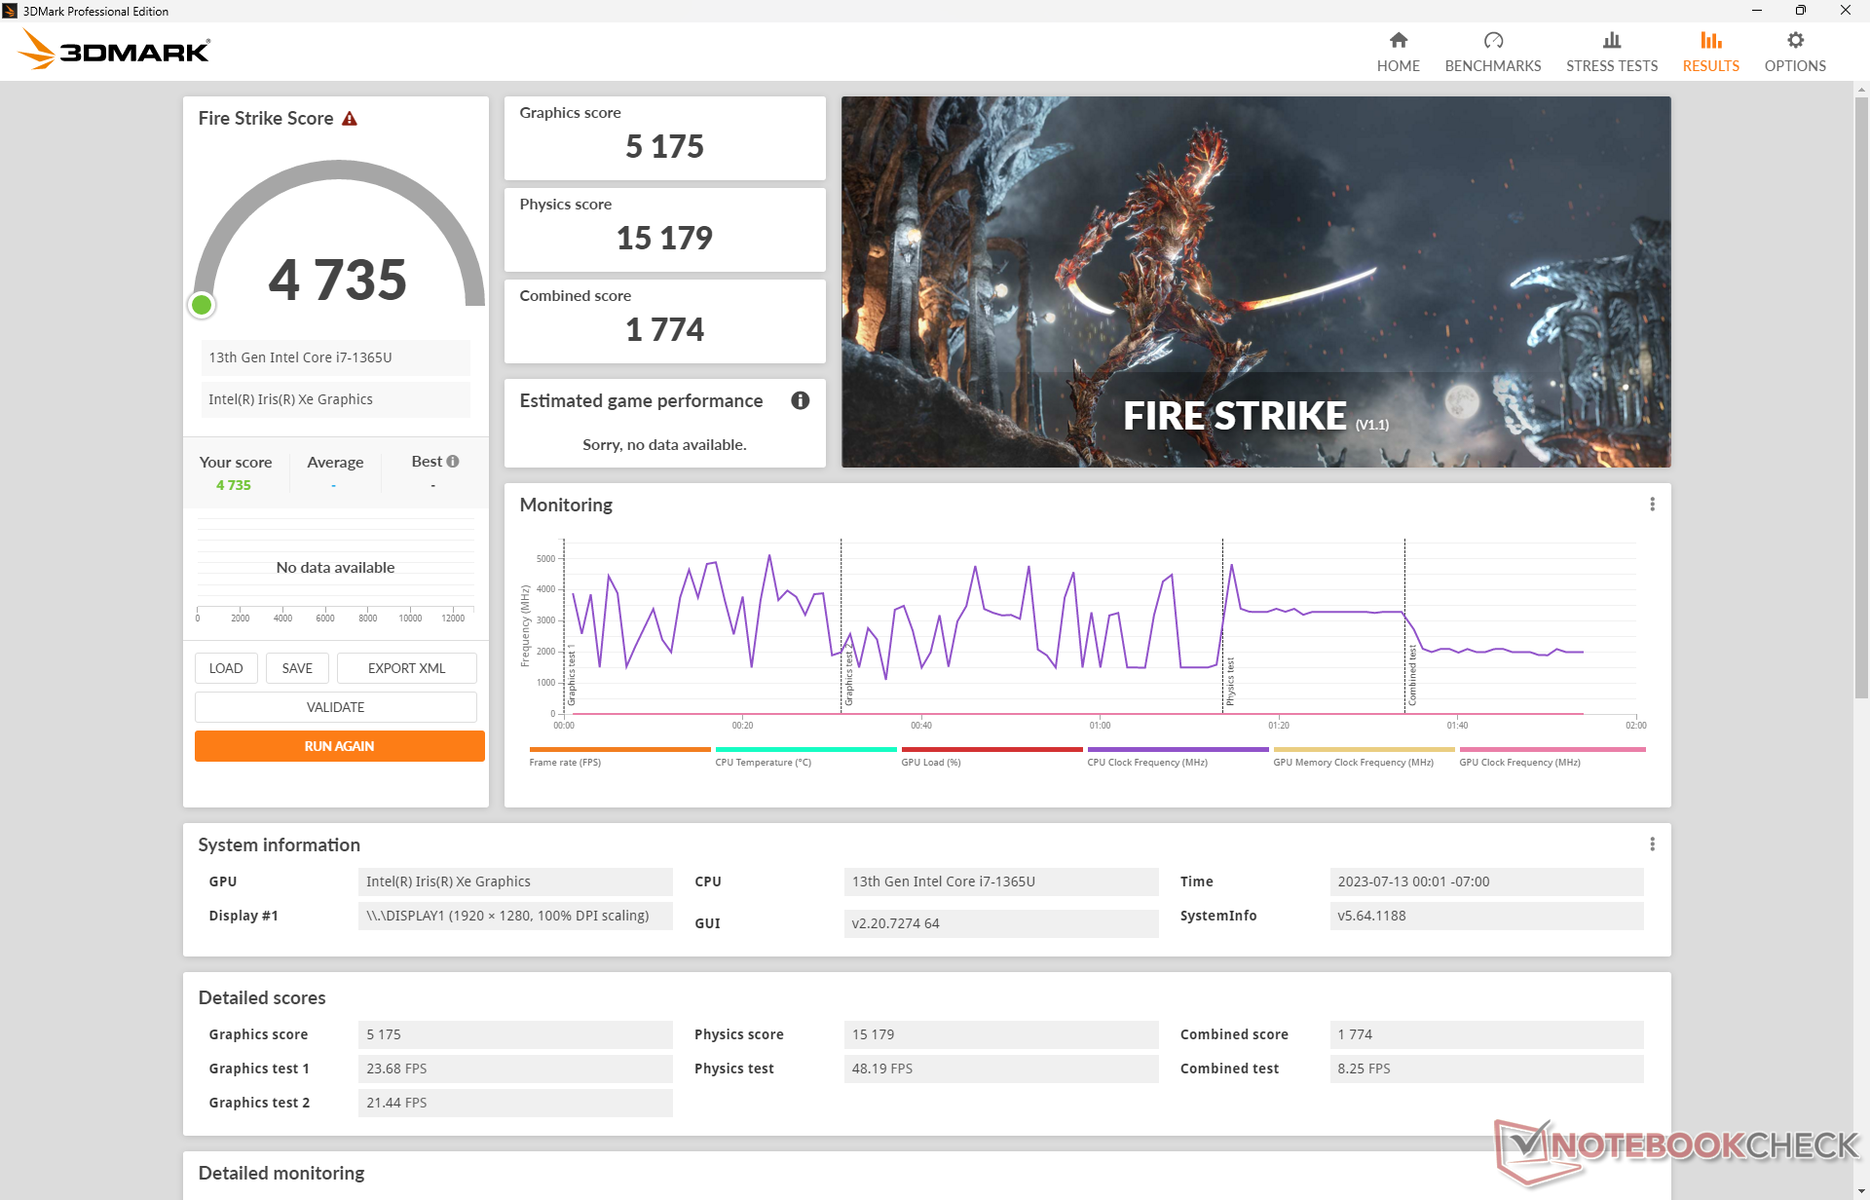
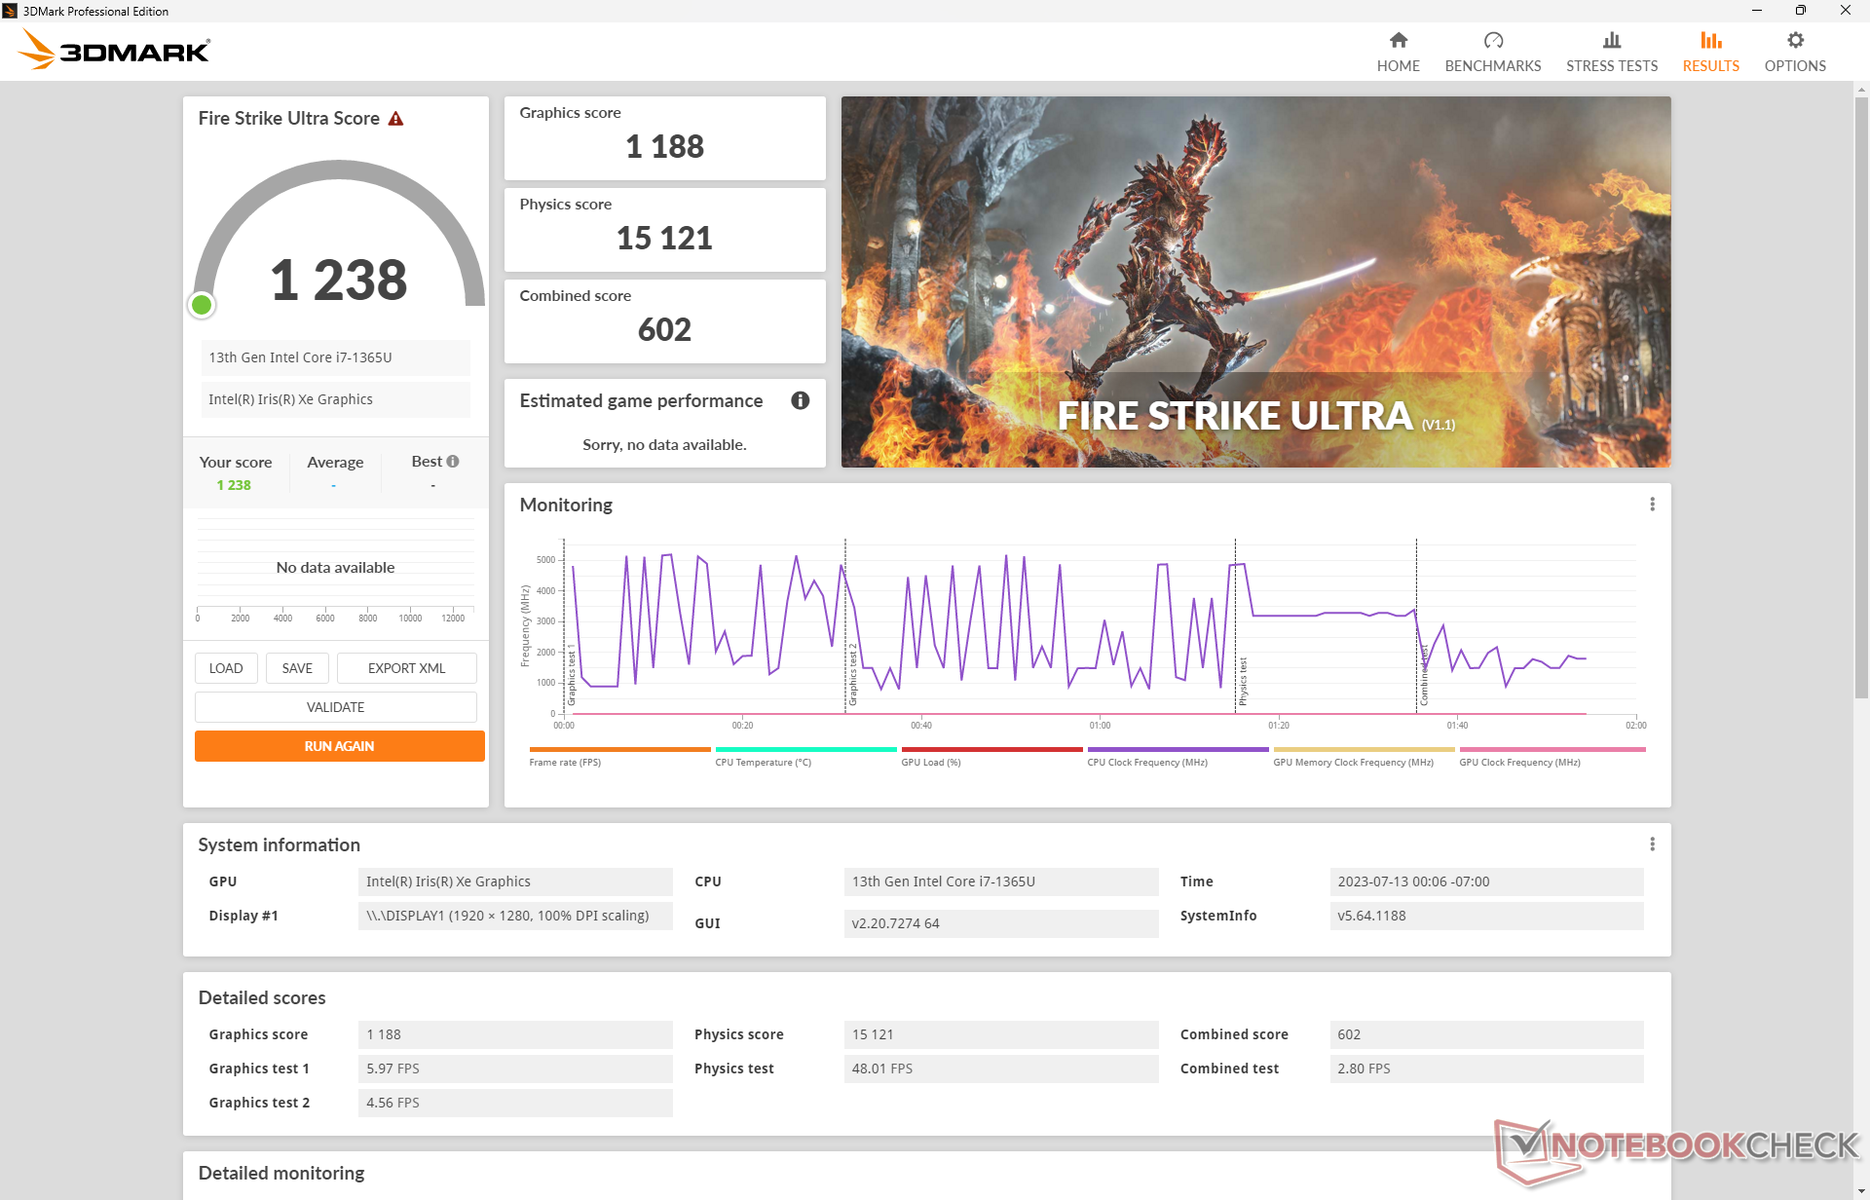
| 3DMark 11 Performance | 6809 points | |
| 3DMark Fire Strike Score | 4735 points | |
| 3DMark Time Spy Score | 1768 points | |
Help | ||
* ... smaller is better
| Tiny Tina's Wonderlands | |
| 1280x720 Lowest Preset (DX12) | |
| HP Dragonfly G4 | |
| Average Intel Iris Xe Graphics G7 96EUs (25.9 - 67.3, n=32) | |
| 1920x1080 Low Preset (DX12) | |
| Framework Laptop 13.5 13th Gen Intel | |
| Average Intel Iris Xe Graphics G7 96EUs (22.3 - 53, n=32) | |
| HP Dragonfly G4 | |
| 1920x1080 Medium Preset (DX12) | |
| Framework Laptop 13.5 13th Gen Intel | |
| Average Intel Iris Xe Graphics G7 96EUs (17 - 40.1, n=30) | |
| HP Dragonfly G4 | |
| 1920x1080 High Preset (DX12) | |
| Framework Laptop 13.5 13th Gen Intel | |
| Average Intel Iris Xe Graphics G7 96EUs (10.6 - 24.1, n=29) | |
| HP Dragonfly G4 | |
| 1920x1080 Badass Preset (DX12) | |
| Framework Laptop 13.5 13th Gen Intel | |
| Average Intel Iris Xe Graphics G7 96EUs (8.4 - 18.4, n=26) | |
| HP Dragonfly G4 | |
| F1 22 | |
| 1280x720 Ultra Low Preset AA:T AF:16x | |
| Framework Laptop 13.5 13th Gen Intel | |
| Average Intel Iris Xe Graphics G7 96EUs (57.4 - 94.9, n=53) | |
| HP Dragonfly G4 | |
| Lenovo ThinkPad X13 G3 21CM002UGE | |
| 1920x1080 Low Preset AA:T AF:16x | |
| Framework Laptop 13.5 13th Gen Intel | |
| Average Intel Iris Xe Graphics G7 96EUs (33.3 - 57.2, n=58) | |
| HP Dragonfly G4 | |
| Lenovo ThinkPad X13 G3 21CM002UGE | |
| 1920x1080 Medium Preset AA:T AF:16x | |
| Framework Laptop 13.5 13th Gen Intel | |
| Average Intel Iris Xe Graphics G7 96EUs (28 - 52.3, n=58) | |
| HP Dragonfly G4 | |
| Lenovo ThinkPad X13 G3 21CM002UGE | |
| 1920x1080 High Preset AA:T AF:16x | |
| Framework Laptop 13.5 13th Gen Intel | |
| Average Intel Iris Xe Graphics G7 96EUs (21.7 - 37.1, n=58) | |
| HP Dragonfly G4 | |
| Lenovo ThinkPad X13 G3 21CM002UGE | |
| 1920x1080 Ultra High Preset AA:T AF:16x | |
| Framework Laptop 13.5 13th Gen Intel | |
| Average Intel Iris Xe Graphics G7 96EUs (16.1 - 28.2, n=49) | |
| HP Dragonfly G4 | |
| Lenovo ThinkPad X13 G3 21CM002UGE | |
Witcher 3 FPS Chart
| low | med. | high | ultra | |
|---|---|---|---|---|
| GTA V (2015) | 99.8 | 84.1 | 23.4 | 10.1 |
| The Witcher 3 (2015) | 78.9 | 54.2 | 31 | 14.7 |
| Dota 2 Reborn (2015) | 101.4 | 76.3 | 60.2 | 53.3 |
| Final Fantasy XV Benchmark (2018) | 40.9 | 23.2 | 16.4 | |
| X-Plane 11.11 (2018) | 37.6 | 31.8 | 29.1 | |
| Strange Brigade (2018) | 88.8 | 38.4 | 30.4 | 24.7 |
| Cyberpunk 2077 1.6 (2022) | 19.7 | 16.3 | 12.7 | 9.3 |
| Tiny Tina's Wonderlands (2022) | 25.9 | 21.2 | 14.1 | 11.1 |
| F1 22 (2022) | 43.6 | 39.4 | 27.4 | 22.2 |
排放量
系统噪声
惠普蜻蜓(Dragonfly)笔记本电脑的噪音普遍低于大多数同类产品,但CPU时钟频率却低于平均水平。我们测得的最大噪音仅为35 dB(A),而9330的噪音超过40 dB(A)。Latitude 9330.即使如此,35 dB(A)的最大值也只是在运行高负载时短暂下降并稳定在33 dB(A)左右。
Noise level
| Idle |
| 23.5 / 23.5 / 26.8 dB(A) |
| Load |
| 27.2 / 35 dB(A) |
 | ||
30 dB silent 40 dB(A) audible 50 dB(A) loud |
||
min: | ||
| HP Dragonfly G4 Iris Xe G7 96EUs, i7-1365U, Micron 3400 MTFDKBA512TFH 512GB | HP Elite Dragonfly G3 Iris Xe G7 96EUs, i7-1265U, Micron 3400 MTFDKBA512TFH 512GB | Framework Laptop 13.5 13th Gen Intel Iris Xe G7 96EUs, i7-1370P, WD PC SN740 SDDPNQD-1T00 | Lenovo ThinkPad X13 G3 21CM002UGE Radeon 660M, R5 PRO 6650U, Samsung PM9A1 MZVL2512HCJQ | Dell Latitude 9330 Iris Xe G7 96EUs, i7-1260U | |
|---|---|---|---|---|---|
| Noise | 4% | -20% | 0% | -8% | |
| off / environment * (dB) | 23.3 | 22.8 2% | 23.2 -0% | 23.1 1% | 23 1% |
| Idle Minimum * (dB) | 23.5 | 23.2 1% | 23.2 1% | 23.1 2% | 23 2% |
| Idle Average * (dB) | 23.5 | 23.2 1% | 23.2 1% | 23.1 2% | 23.1 2% |
| Idle Maximum * (dB) | 26.8 | 23.2 13% | 23.2 13% | 23.1 14% | 23.1 14% |
| Load Average * (dB) | 27.2 | 25.1 8% | 45.3 -67% | 27 1% | 37.1 -36% |
| Witcher 3 ultra * (dB) | 32.7 | 32 2% | 47.9 -46% | 38.7 -18% | 40.6 -24% |
| Load Maximum * (dB) | 35 | 35.2 -1% | 49.2 -41% | 35.5 -1% | 40.5 -16% |
* ... smaller is better
温度
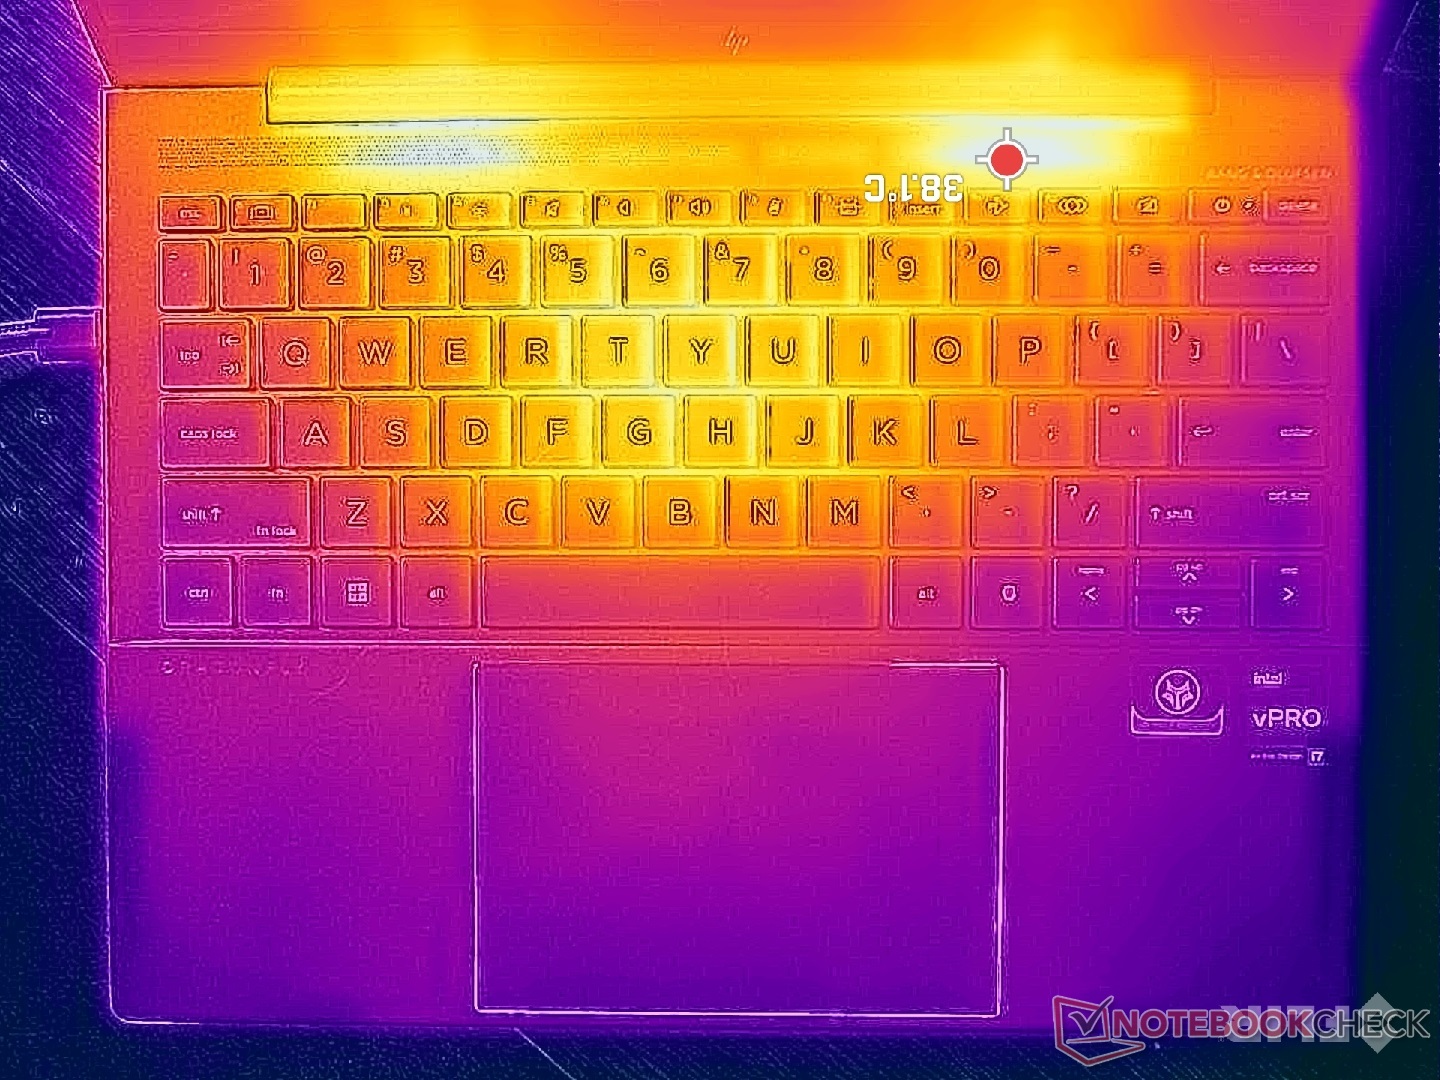
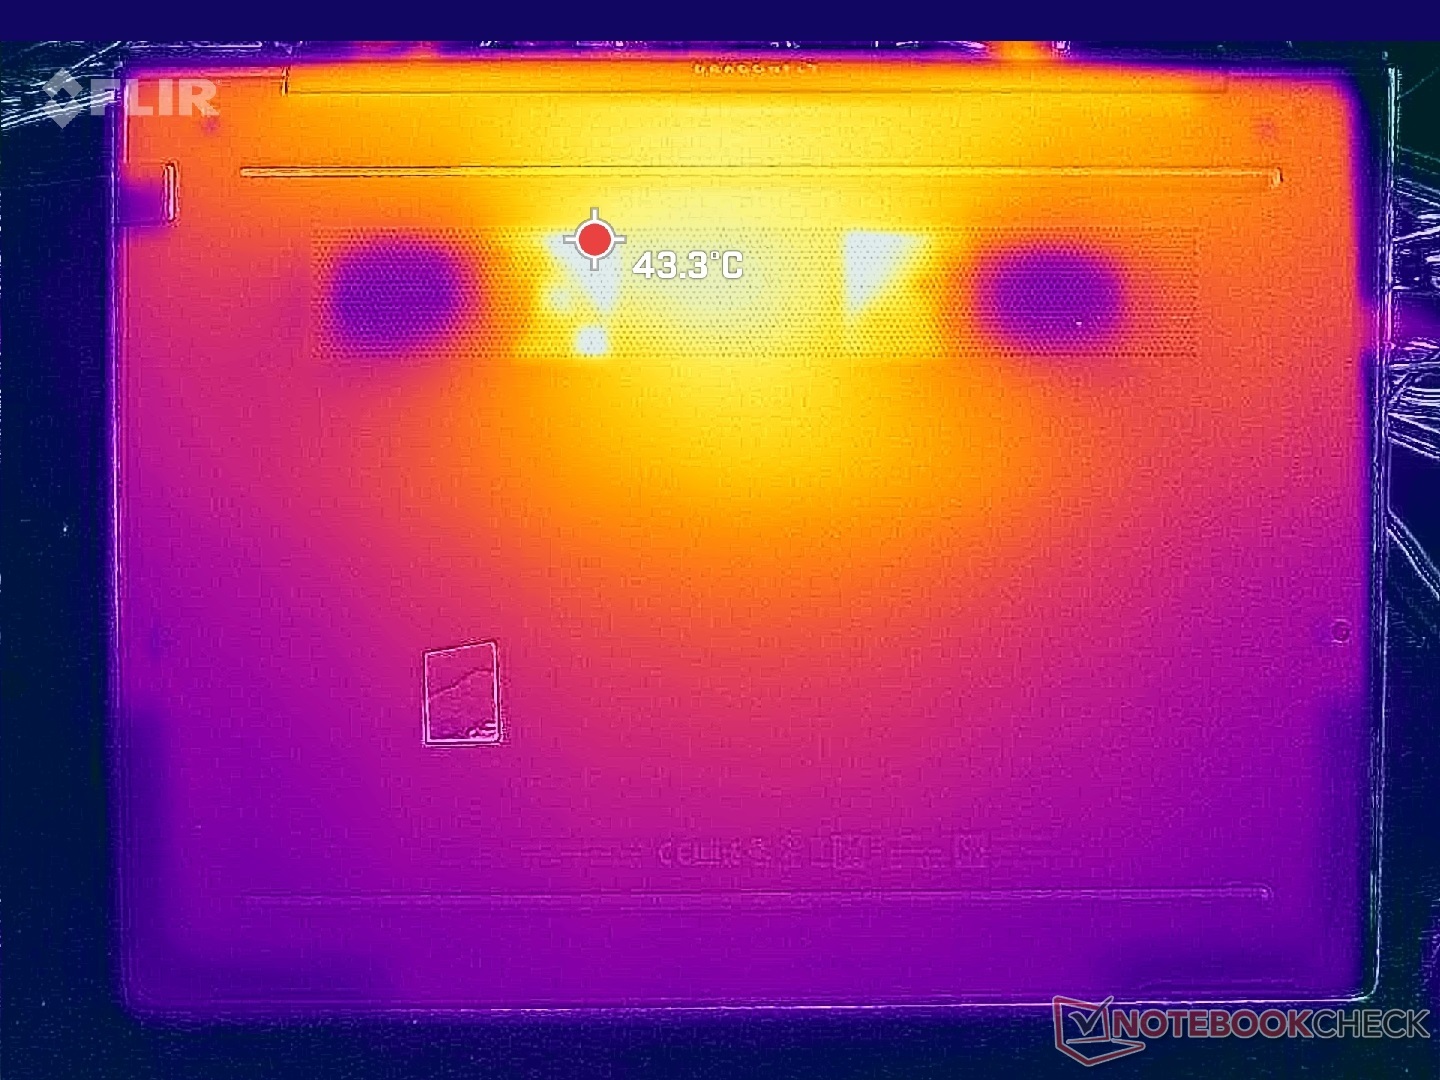
在重负载情况下,表面温度略高于40摄氏度,而速度更快的XPS 13 Plus表面温度为45摄氏度。XPS 13 Plus或Latitude 13 9330 的 50 C。发热点位于远离掌托和点击板的机箱后侧。
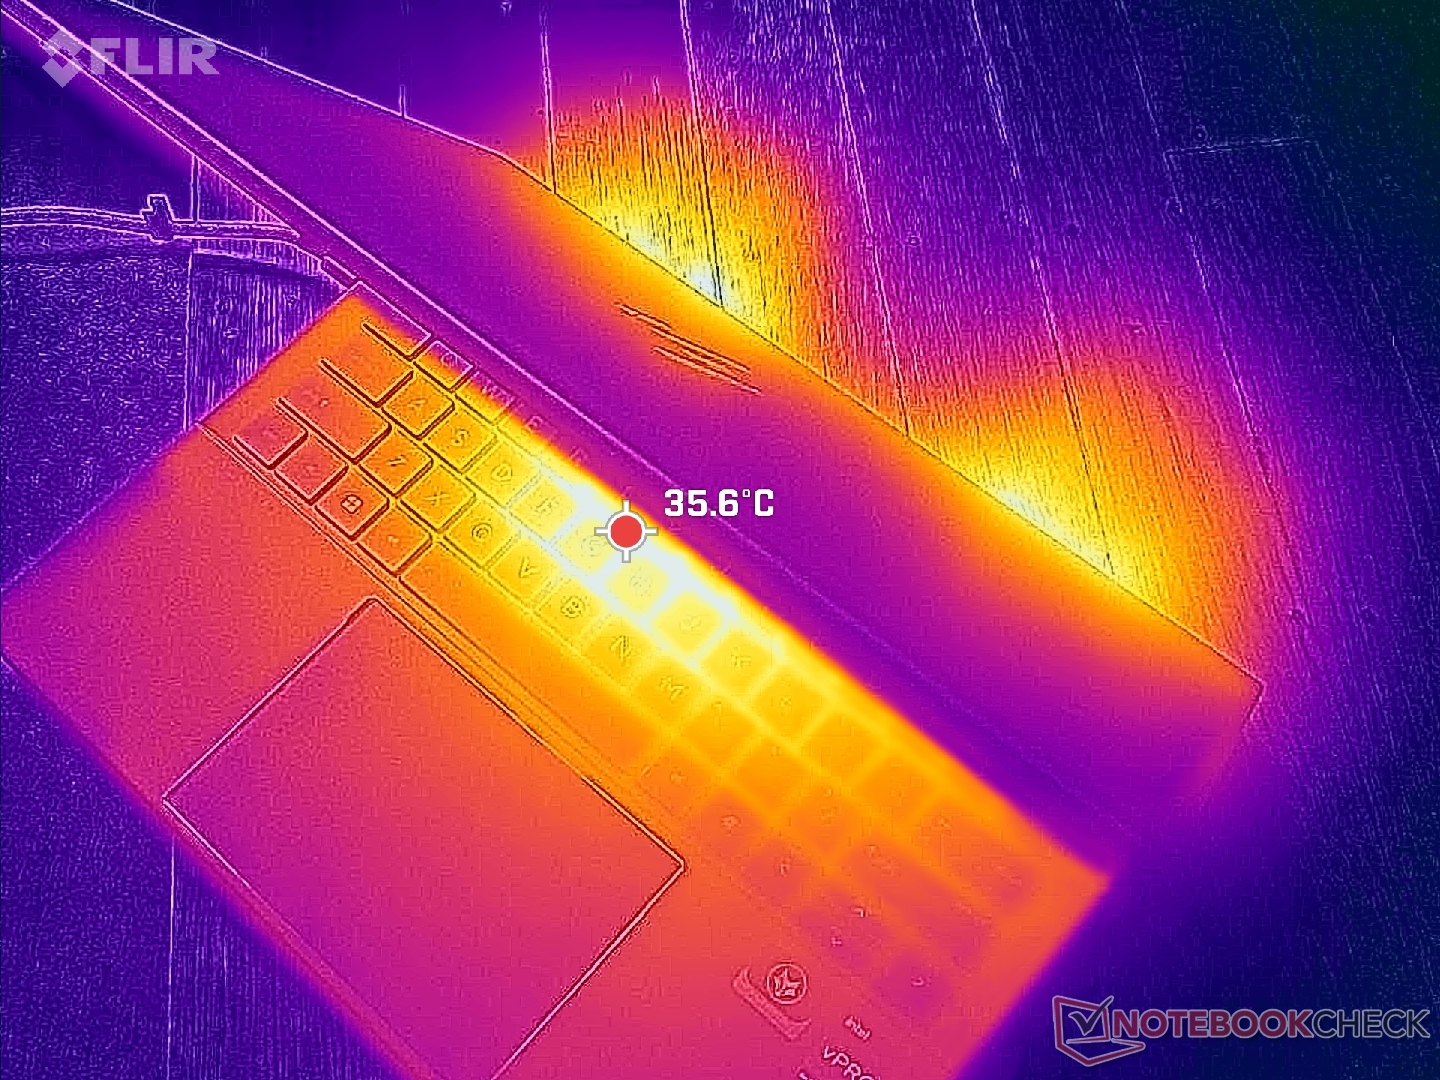
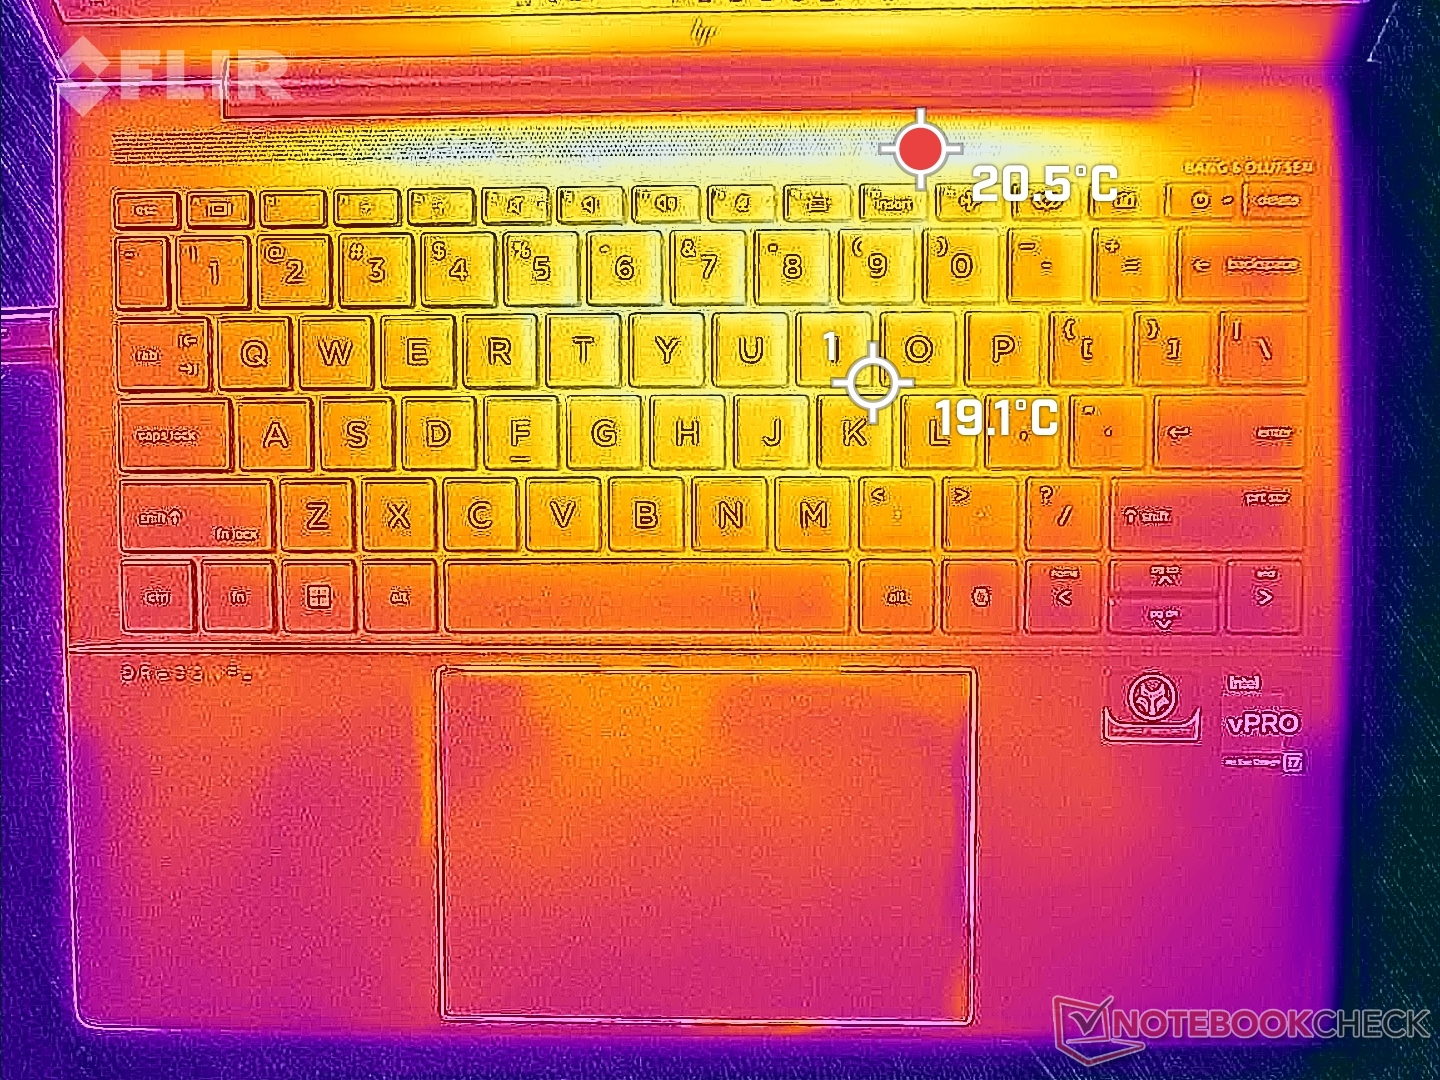
(+) The maximum temperature on the upper side is 38.6 °C / 101 F, compared to the average of 35.9 °C / 97 F, ranging from 21.4 to 59 °C for the class Subnotebook.
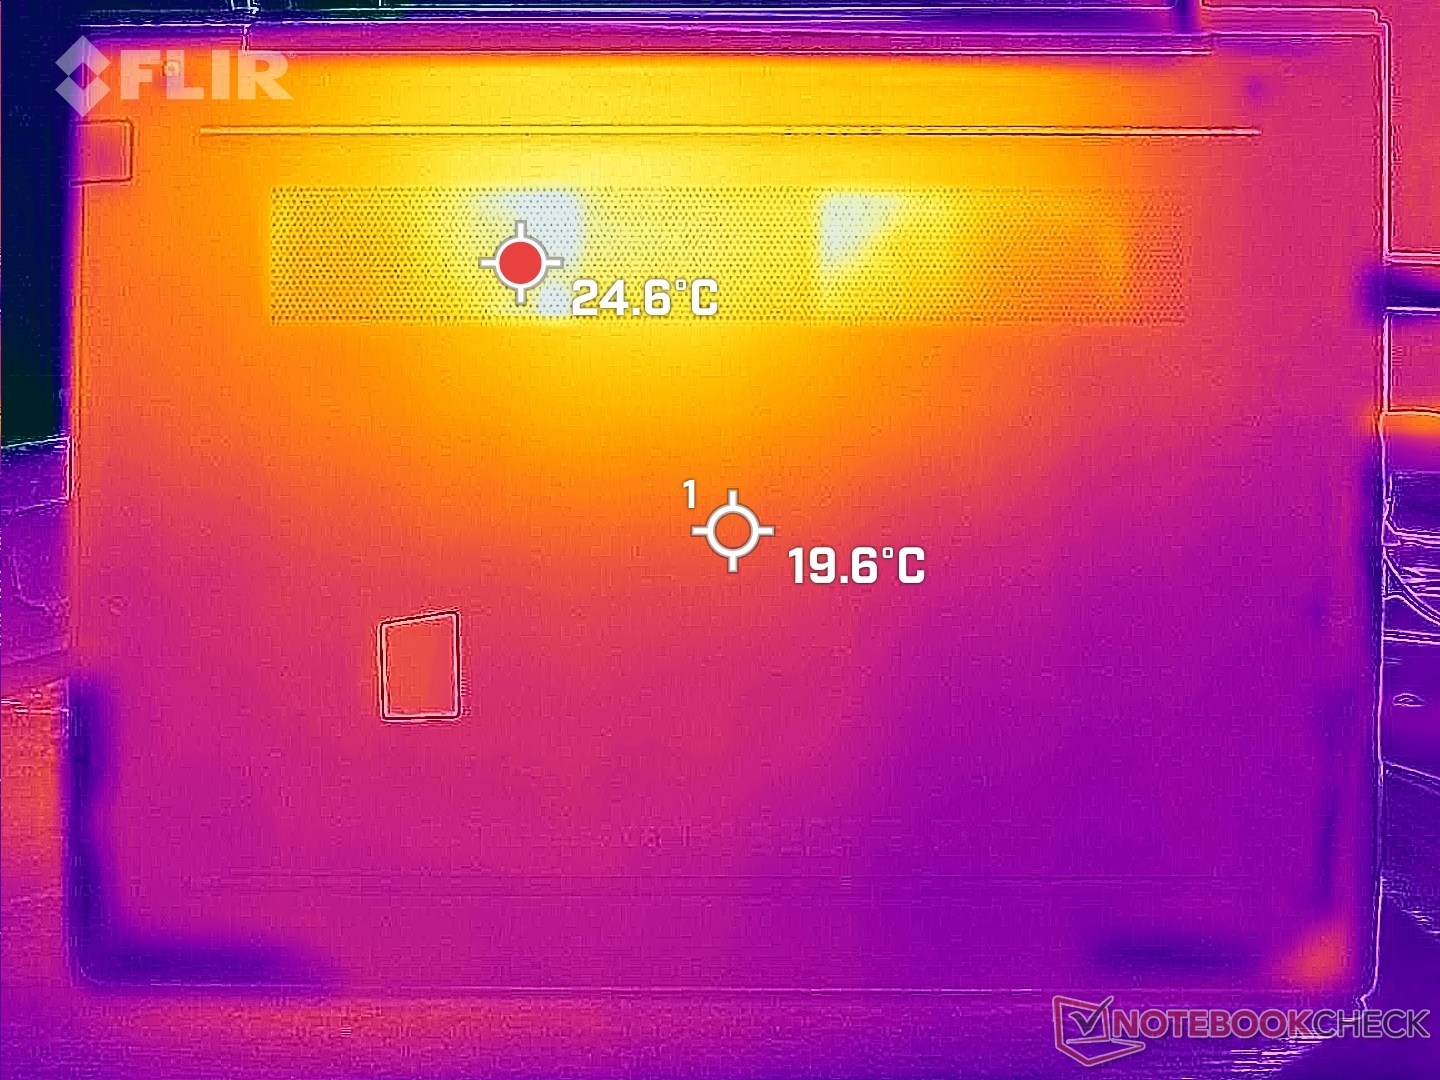
(±) The bottom heats up to a maximum of 40.4 °C / 105 F, compared to the average of 39.2 °C / 103 F
(+) In idle usage, the average temperature for the upper side is 26.5 °C / 80 F, compared to the device average of 30.8 °C / 87 F.
(+) The palmrests and touchpad are cooler than skin temperature with a maximum of 27 °C / 80.6 F and are therefore cool to the touch.
(±) The average temperature of the palmrest area of similar devices was 28.2 °C / 82.8 F (+1.2 °C / 2.2 F).
| HP Dragonfly G4 Intel Core i7-1365U, Intel Iris Xe Graphics G7 96EUs | HP Elite Dragonfly G3 Intel Core i7-1265U, Intel Iris Xe Graphics G7 96EUs | Framework Laptop 13.5 13th Gen Intel Intel Core i7-1370P, Intel Iris Xe Graphics G7 96EUs | Lenovo ThinkPad X13 G3 21CM002UGE AMD Ryzen 5 PRO 6650U, AMD Radeon 660M | Dell Latitude 9330 Intel Core i7-1260U, Intel Iris Xe Graphics G7 96EUs | Apple MacBook Air M2 Entry Apple M2, Apple M2 8-Core GPU | |
|---|---|---|---|---|---|---|
| Heat | 1% | 3% | -8% | -3% | 2% | |
| Maximum Upper Side * (°C) | 38.6 | 39 -1% | 38.2 1% | 38.1 1% | 40.6 -5% | 44.5 -15% |
| Maximum Bottom * (°C) | 40.4 | 42.2 -4% | 41.4 -2% | 40.1 1% | 50.2 -24% | 44.4 -10% |
| Idle Upper Side * (°C) | 28.2 | 26.8 5% | 25.8 9% | 33.6 -19% | 25 11% | 23.9 15% |
| Idle Bottom * (°C) | 29 | 28.2 3% | 27.6 5% | 33.4 -15% | 27.6 5% | 23.6 19% |
* ... smaller is better
压力测试
当运行Prime95对CPU施加压力时,时钟频率和板载功耗将分别飙升至3.7 GHz和51 W,同时核心温度也将达到100 C。这样的温度对于处理器的使用寿命来说并不理想,因此时钟频率和板载功耗将迅速降至2.3 GHz和20 W,以维持76 C的核心温度。
GPU时钟频率和温度 Witcher 3时,GPU时钟频率和温度将分别稳定在1200 MHz和69 C,这与我们最近在戴尔 戴尔Latitude 7440.
使用电池供电会略微降低CPU性能。使用电池进行3DMark 11测试时,物理和图形分数分别为10619分和5959分,而使用电源时分别为11465分和5780分。
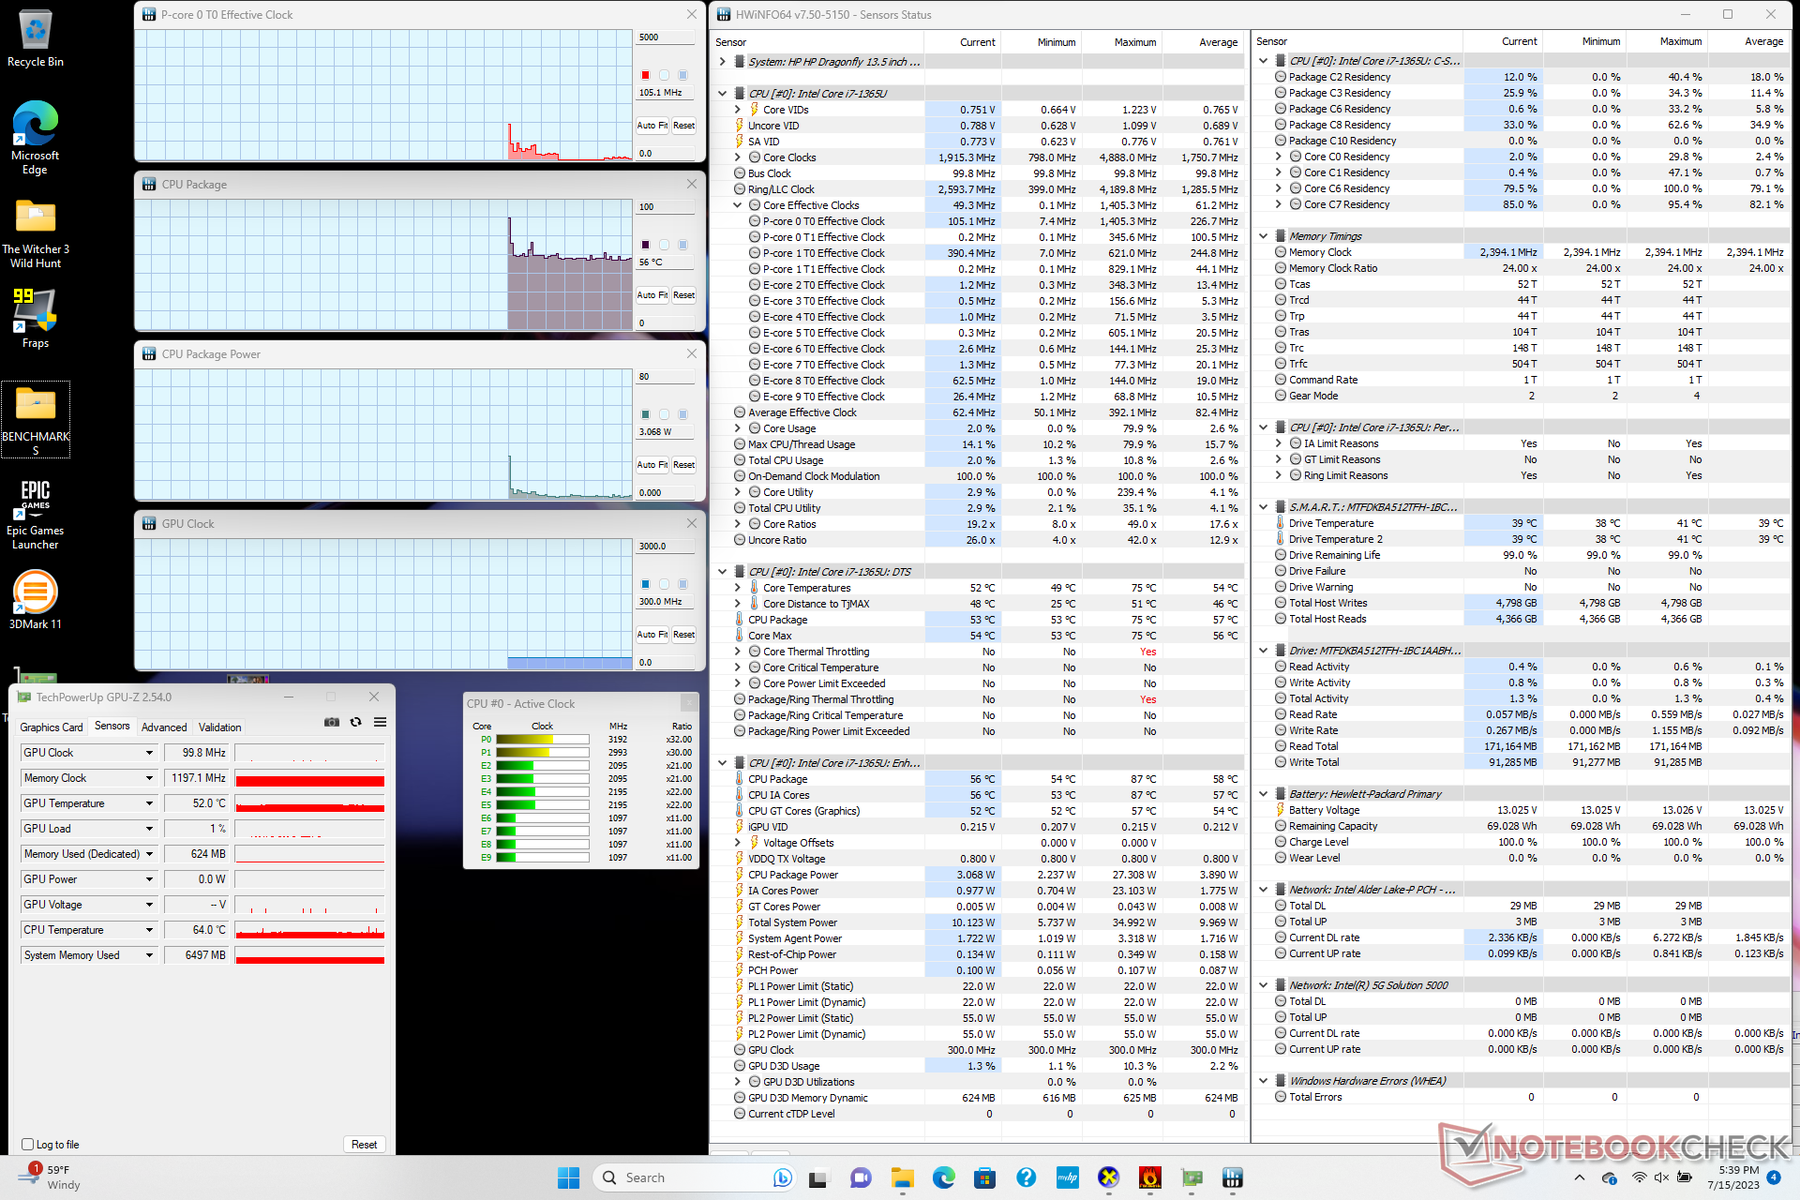
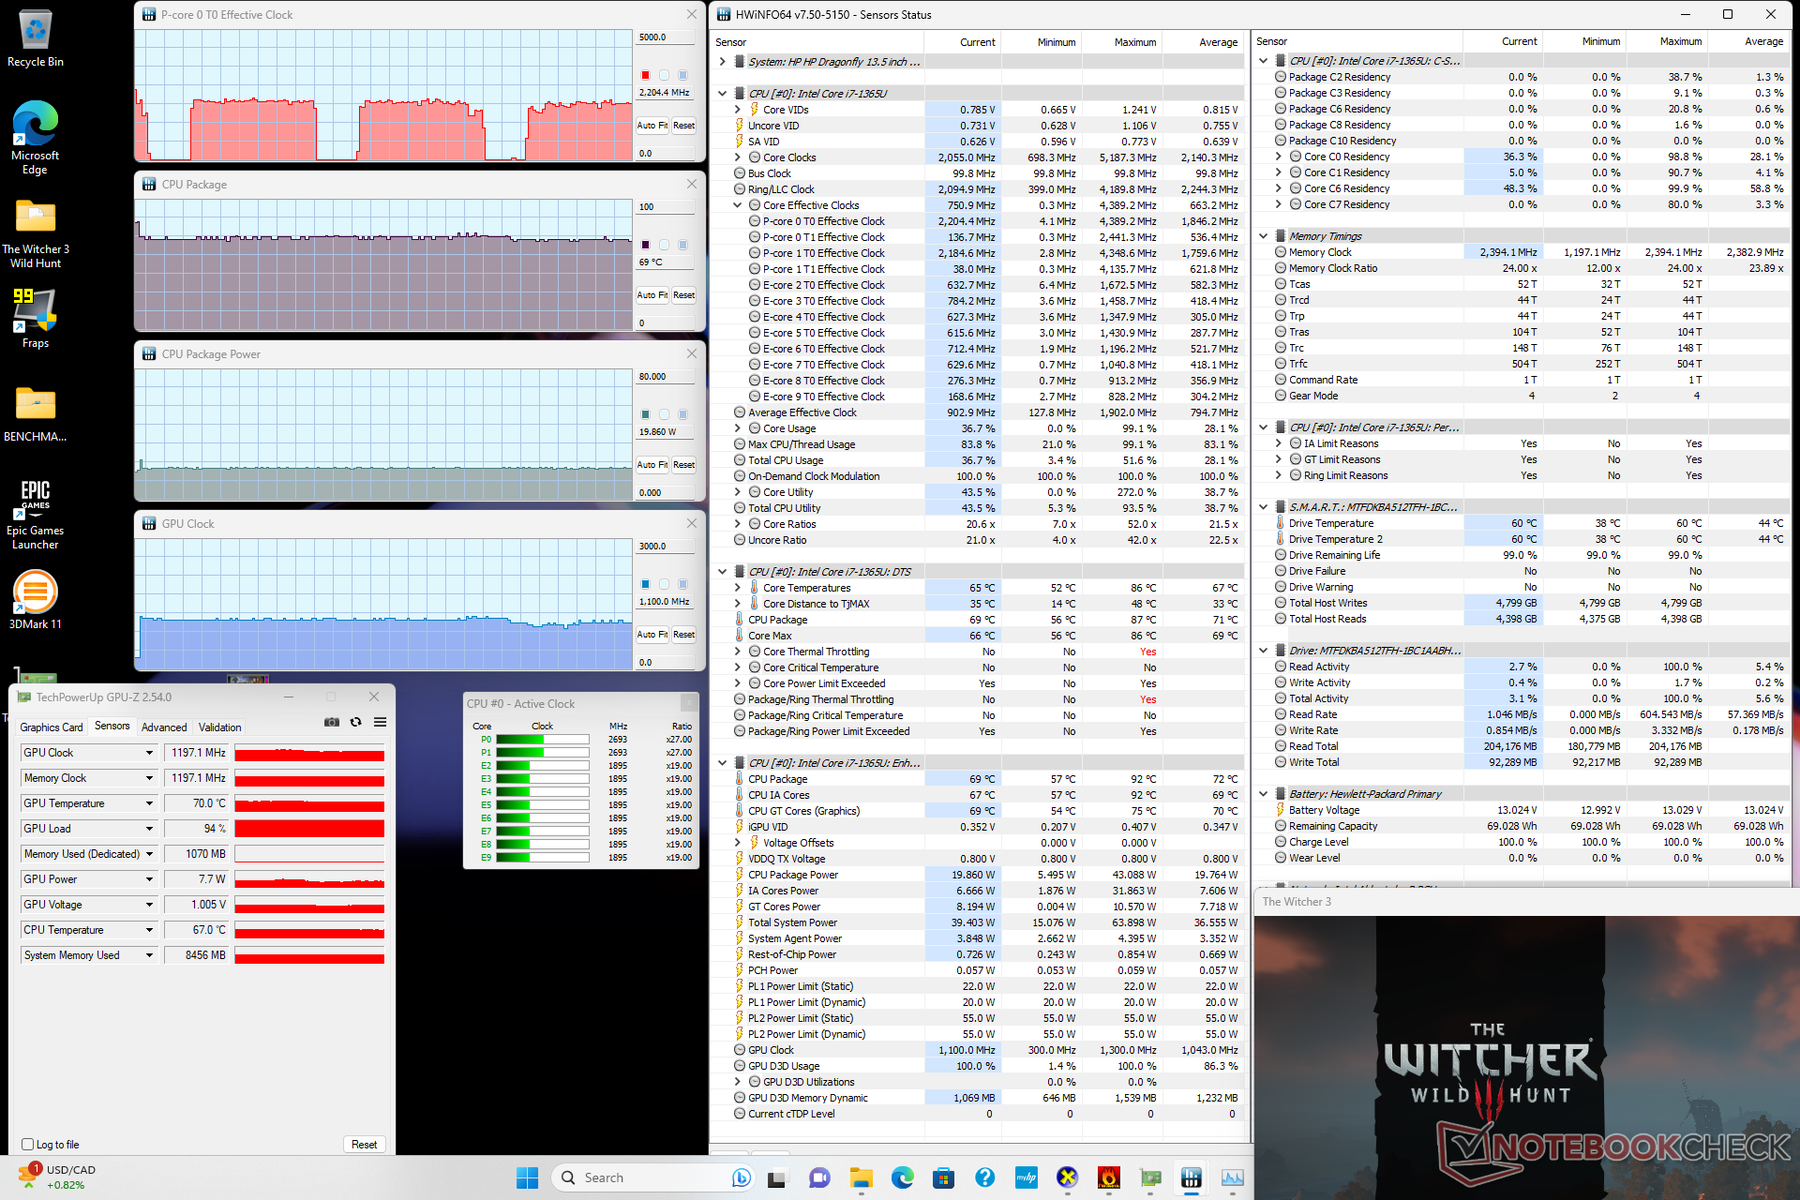
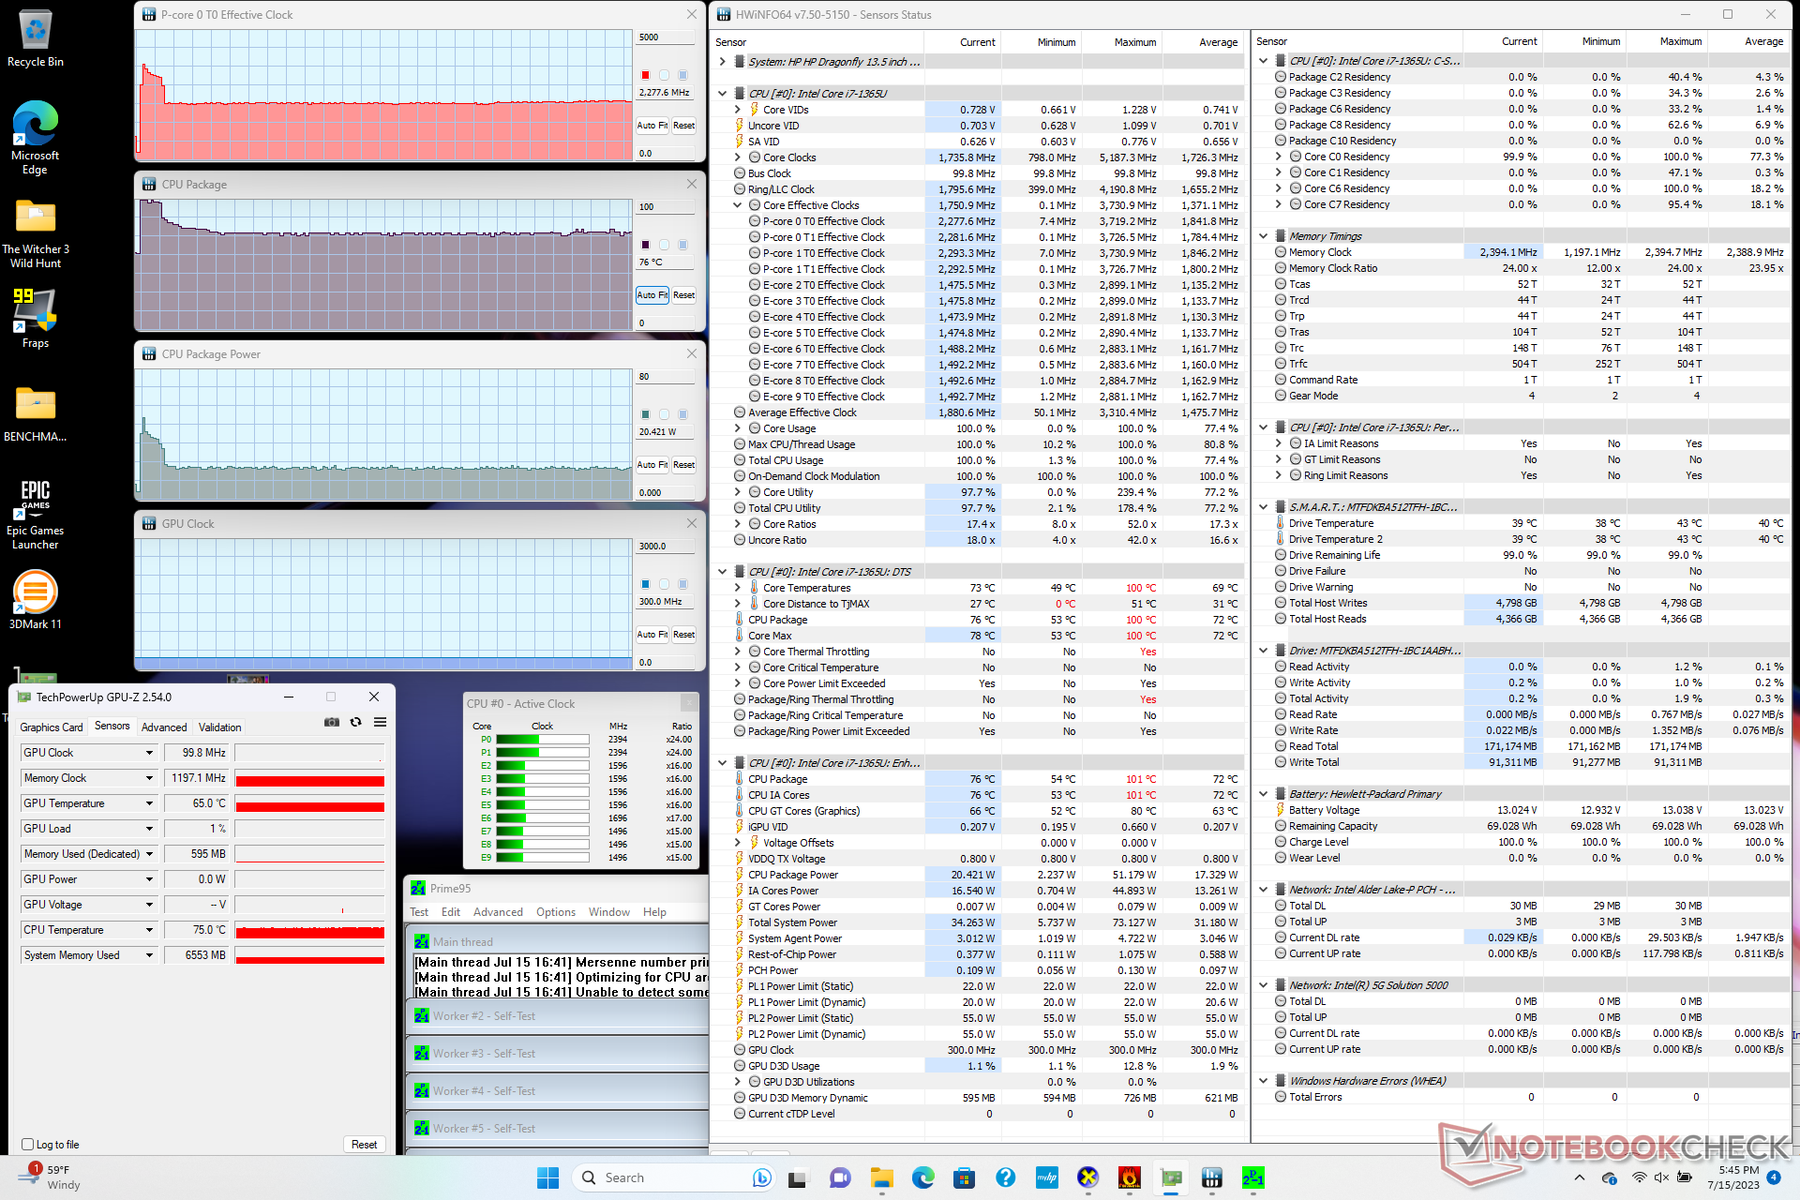
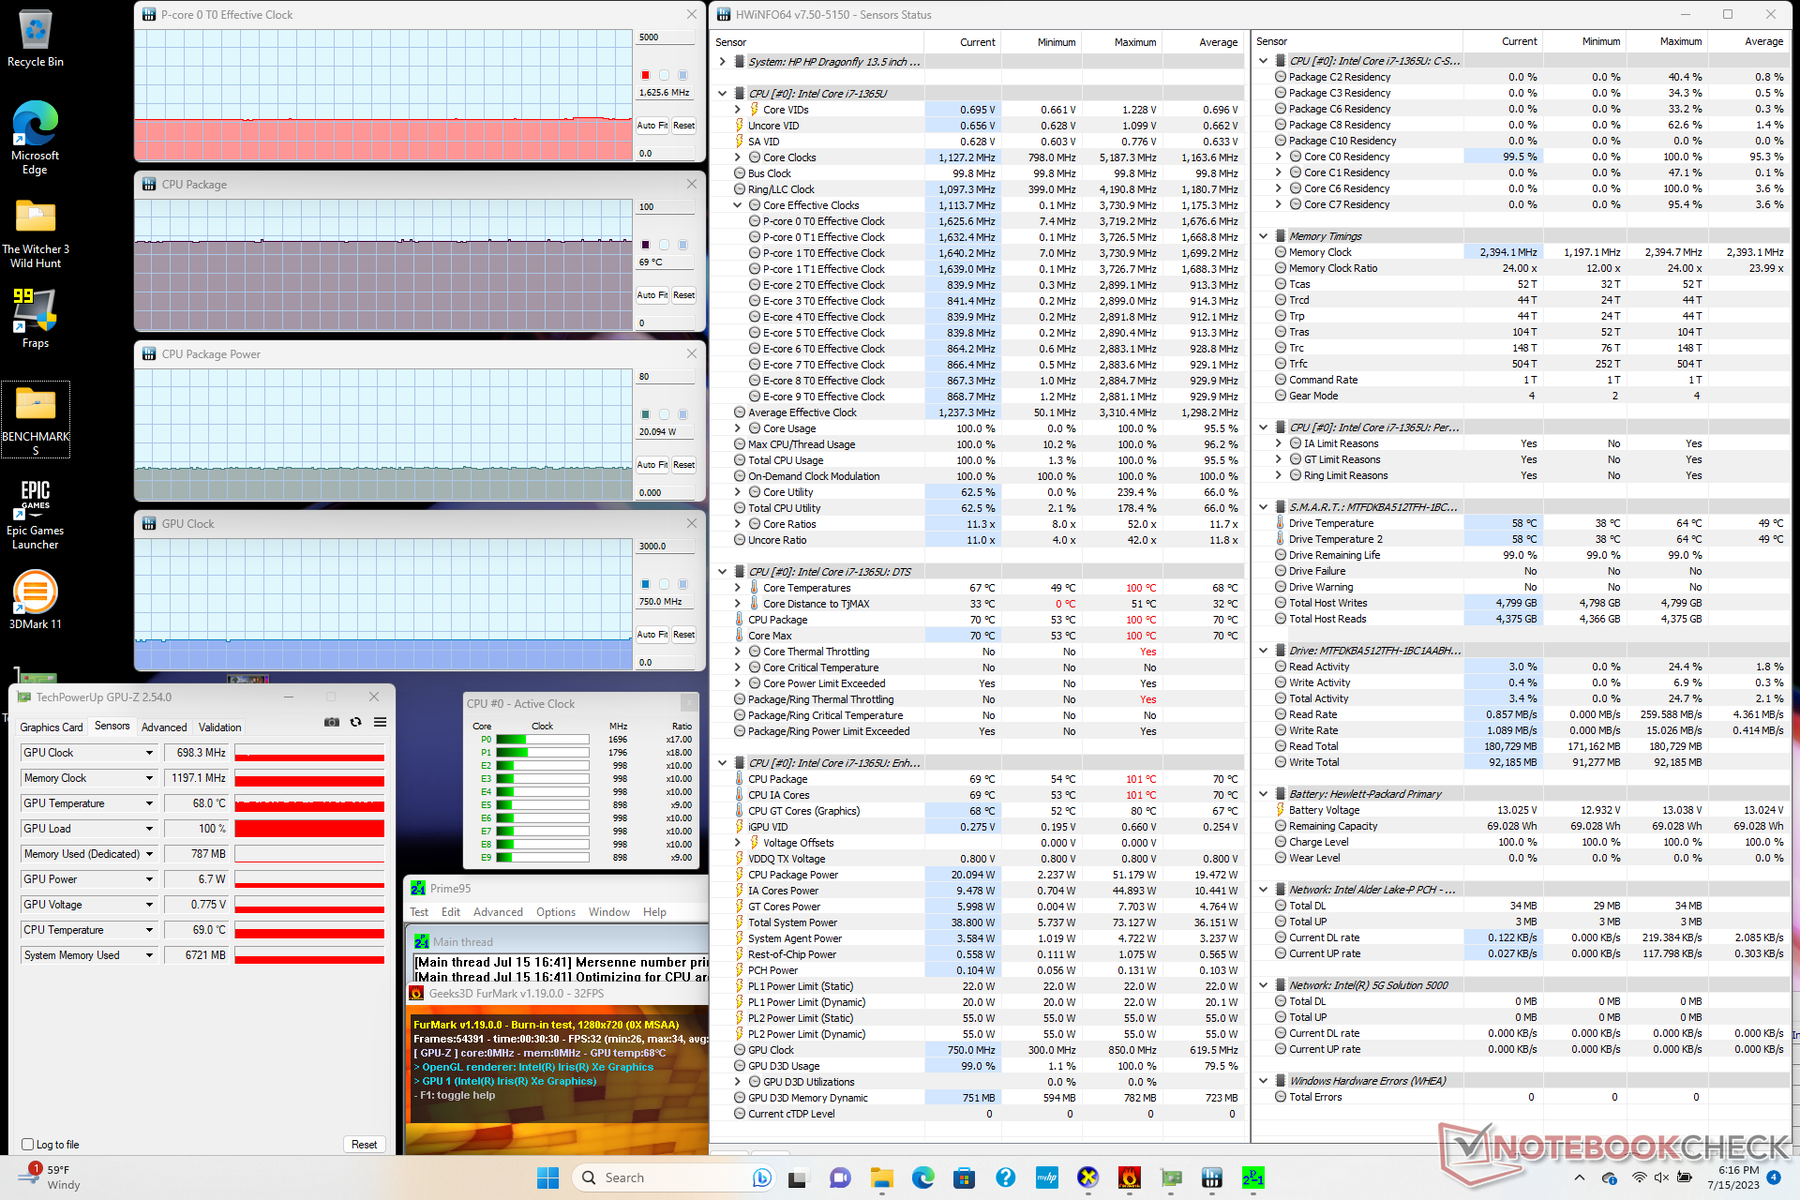
| CPU 时钟 (GHz) | GPU 时钟 (MHz) | CPU 平均温度 (°C) | |
| 系统闲置 | -- | -- | 56 |
| Prime95 Stress | 2.3 | -- | 76 |
| Prime95 + FurMark Stress | 1.6 | 698 | 69 |
| Witcher 3 压力 | ~2.2 | 1197 | 69 |
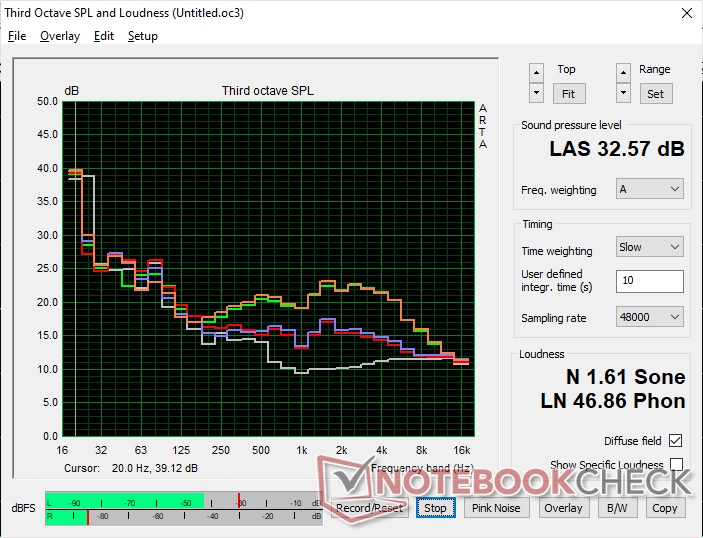
扬声器
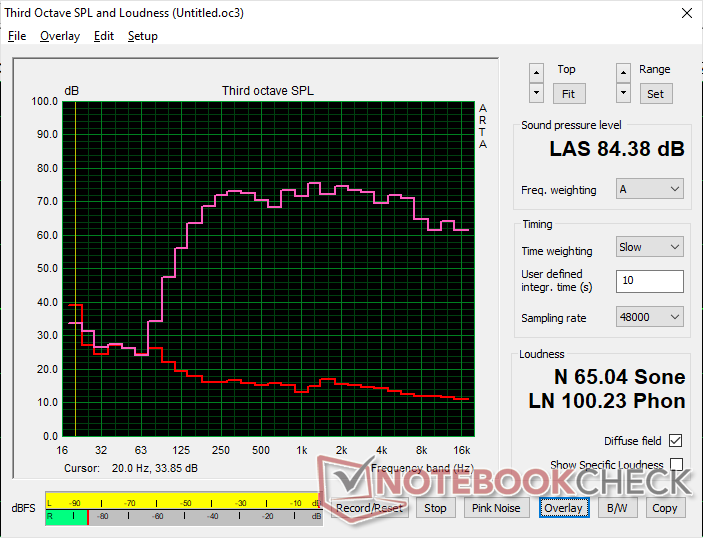
HP Dragonfly G4 audio analysis
(+) | speakers can play relatively loud (84.4 dB)
Bass 100 - 315 Hz
(±) | reduced bass - on average 8.4% lower than median
(±) | linearity of bass is average (11.6% delta to prev. frequency)
Mids 400 - 2000 Hz
(+) | balanced mids - only 2.3% away from median
(+) | mids are linear (4.8% delta to prev. frequency)
Highs 2 - 16 kHz
(+) | balanced highs - only 3.2% away from median
(+) | highs are linear (4.6% delta to prev. frequency)
Overall 100 - 16.000 Hz
(+) | overall sound is linear (9.1% difference to median)
Compared to same class
» 4% of all tested devices in this class were better, 1% similar, 95% worse
» The best had a delta of 5%, average was 18%, worst was 53%
Compared to all devices tested
» 3% of all tested devices were better, 1% similar, 96% worse
» The best had a delta of 4%, average was 23%, worst was 134%
Apple MacBook Pro 16 2021 M1 Pro audio analysis
(+) | speakers can play relatively loud (84.7 dB)
Bass 100 - 315 Hz
(+) | good bass - only 3.8% away from median
(+) | bass is linear (5.2% delta to prev. frequency)
Mids 400 - 2000 Hz
(+) | balanced mids - only 1.3% away from median
(+) | mids are linear (2.1% delta to prev. frequency)
Highs 2 - 16 kHz
(+) | balanced highs - only 1.9% away from median
(+) | highs are linear (2.7% delta to prev. frequency)
Overall 100 - 16.000 Hz
(+) | overall sound is linear (4.6% difference to median)
Compared to same class
» 0% of all tested devices in this class were better, 0% similar, 100% worse
» The best had a delta of 5%, average was 17%, worst was 45%
Compared to all devices tested
» 0% of all tested devices were better, 0% similar, 100% worse
» The best had a delta of 4%, average was 23%, worst was 134%
能源管理
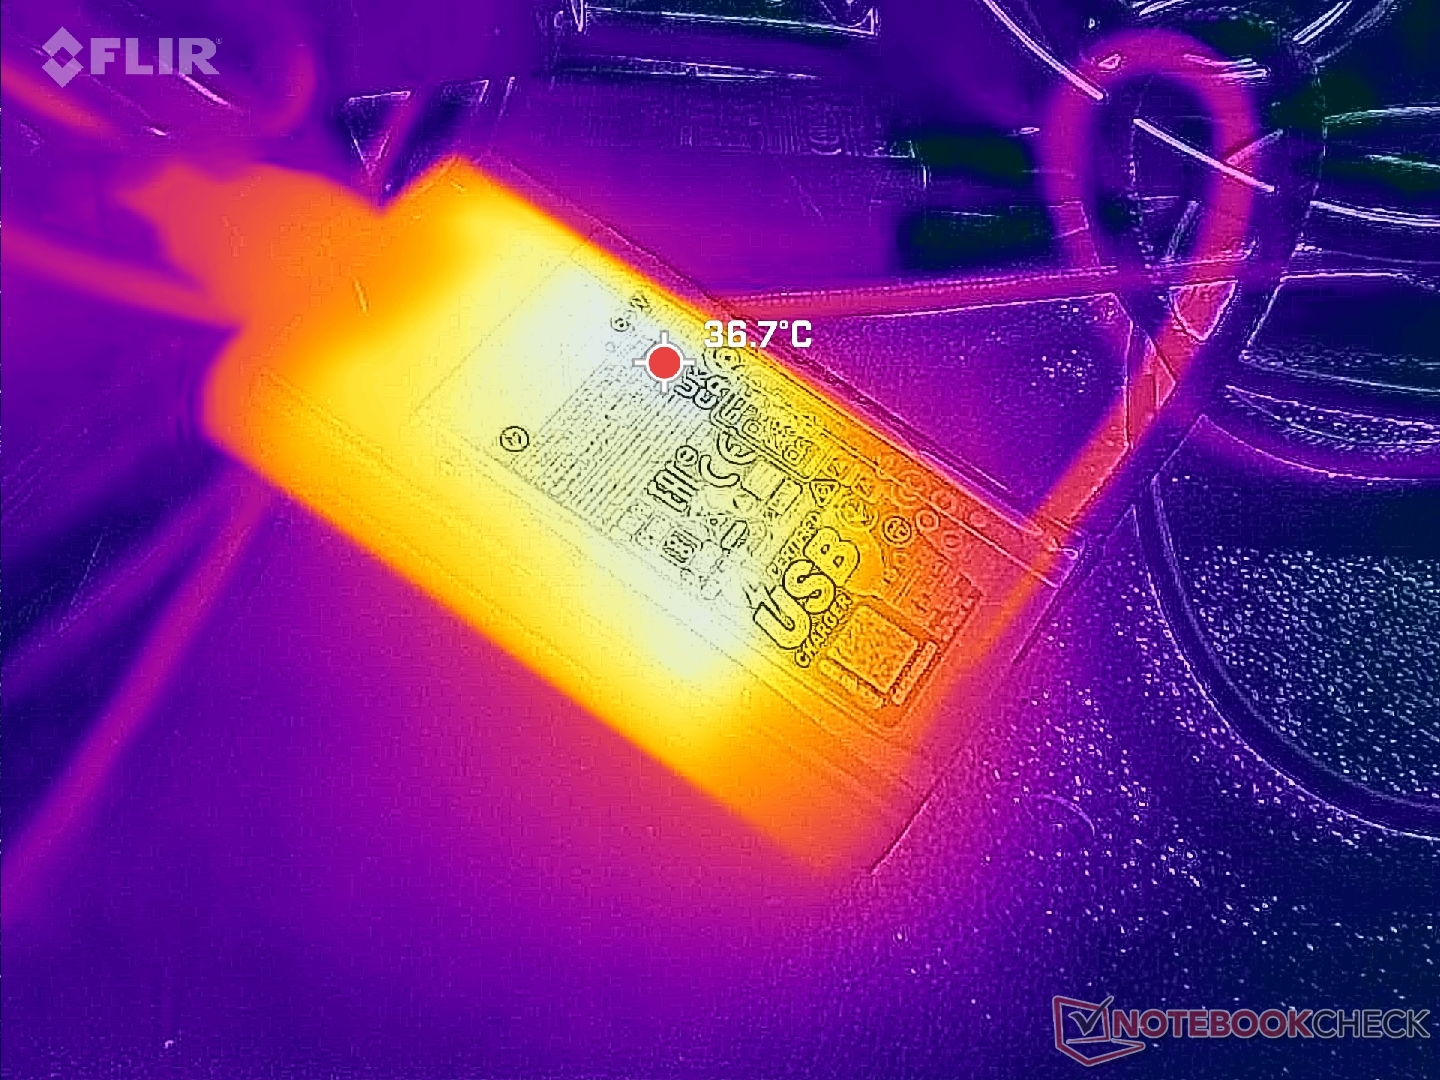
耗电量
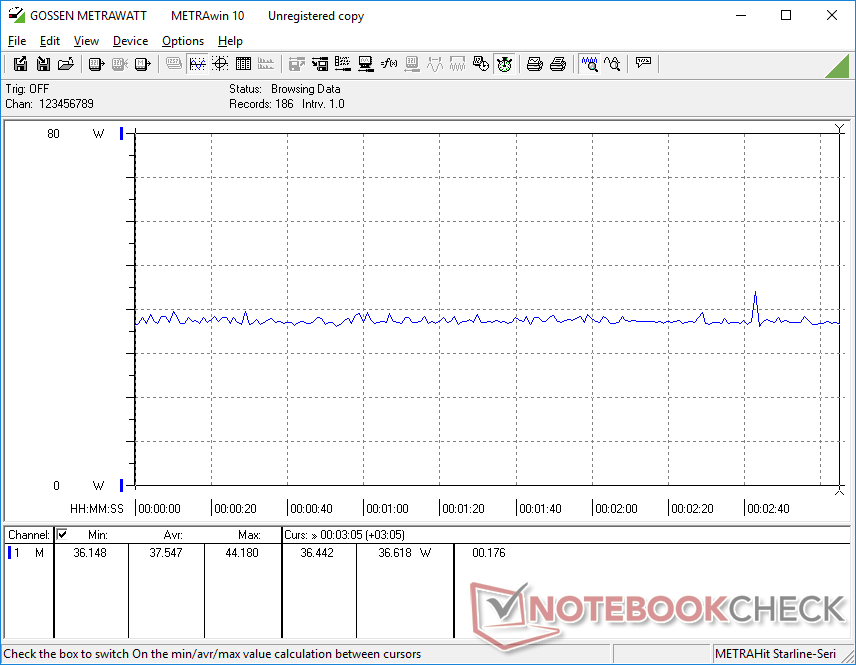
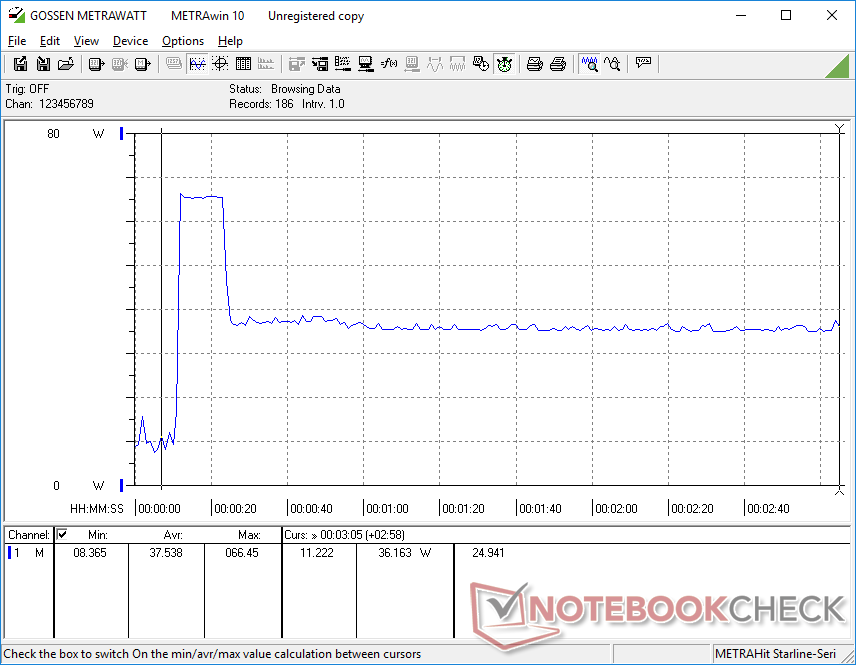
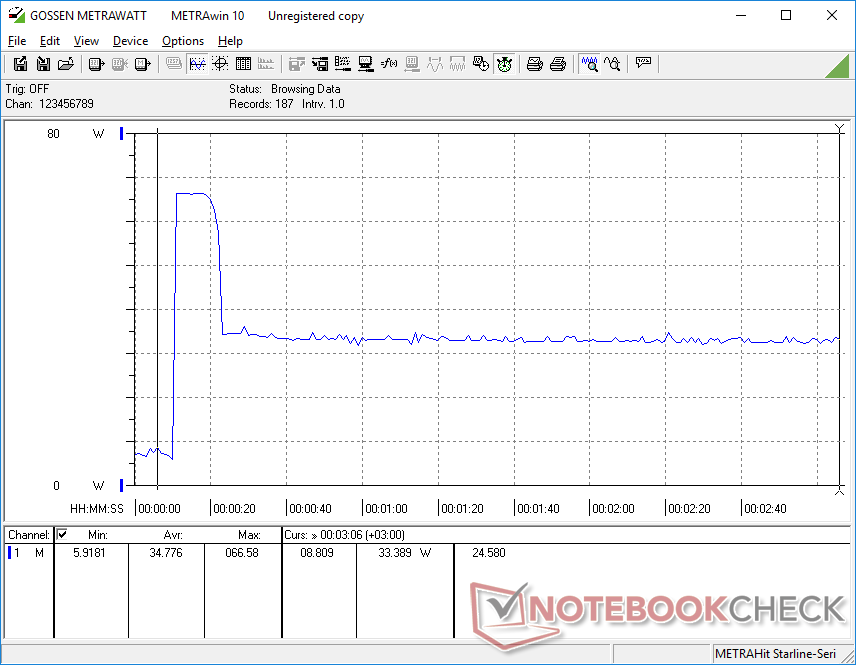
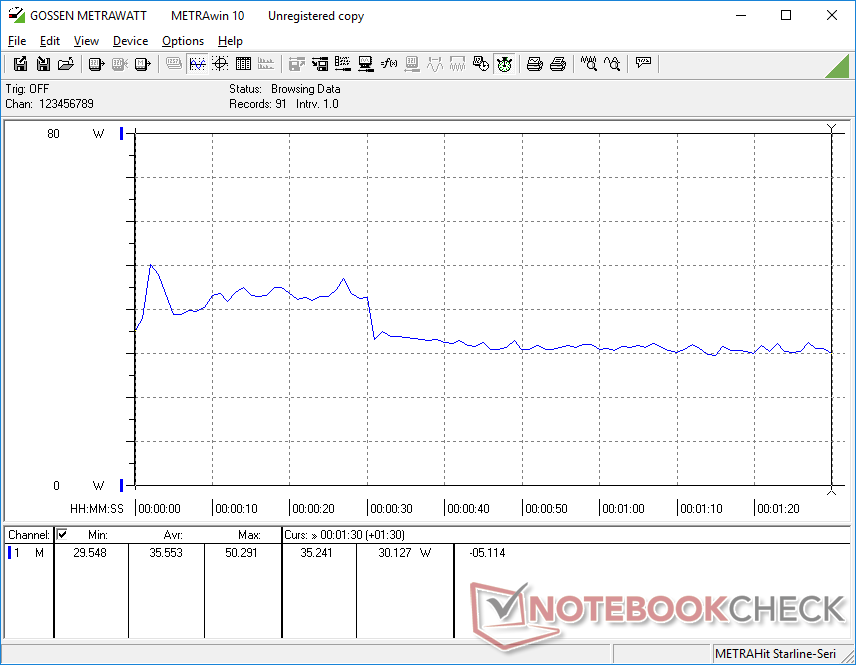
总体功耗与 Dragonfly G3 几乎相当,这在意料之中,因为两款机型共享相同的显示屏、固态硬盘、机箱,甚至根据上述压力测试结果共享 PL2 和 PL1 目标。因此,从酷睿i7-1265U到酷睿i7-1365U,每瓦性能基本相同,甚至略有提高。搭载竞争对手Radeon 680M的笔记本电脑,例如 宏碁Swift Edge SFE16在负载情况下会消耗更多电能,但能够提供更快的GPU性能作为补偿。
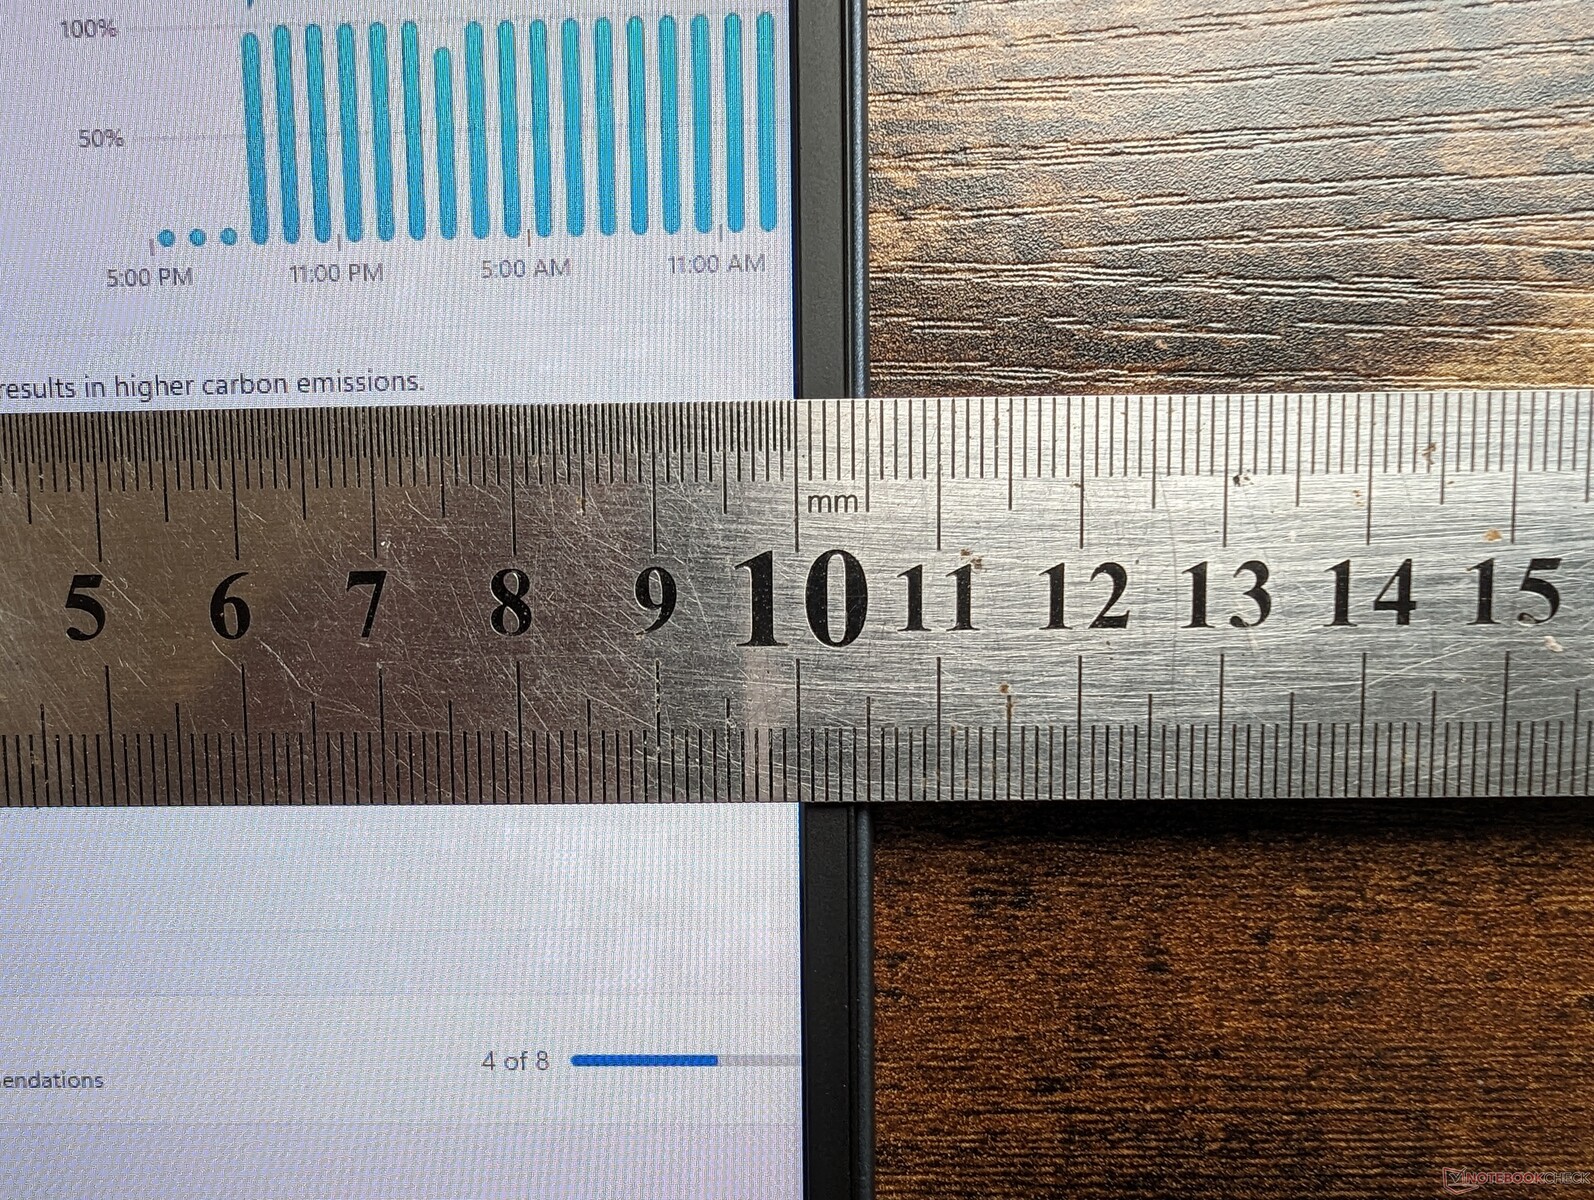
我们能够测量到小尺寸(约9.8 x 5.3 x 2厘米)65 W USB-C交流适配器的临时最大功耗为67 W。
| Off / Standby | |
| Idle | |
| Load |
|
Key:
min: | |
| HP Dragonfly G4 i7-1365U, Iris Xe G7 96EUs, Micron 3400 MTFDKBA512TFH 512GB, IPS, 1920x1280, 13.5" | HP Elite Dragonfly G3 i7-1265U, Iris Xe G7 96EUs, Micron 3400 MTFDKBA512TFH 512GB, IPS, 1920x1280, 13.5" | Framework Laptop 13.5 13th Gen Intel i7-1370P, Iris Xe G7 96EUs, WD PC SN740 SDDPNQD-1T00, IPS, 2256x1504, 13.5" | Lenovo ThinkPad X13 G3 21CM002UGE R5 PRO 6650U, Radeon 660M, Samsung PM9A1 MZVL2512HCJQ, IPS LED, 1920x1200, 13.3" | Dell Latitude 9330 i7-1260U, Iris Xe G7 96EUs, , IPS, 2560x1600, 13.3" | Apple MacBook Air M2 Entry M2, M2 8-Core GPU, Apple SSD AP0256Z, IPS, 2560x1664, 13.6" | |
|---|---|---|---|---|---|---|
| Power Consumption | 5% | -13% | 18% | 2% | 20% | |
| Idle Minimum * (Watt) | 4.1 | 3.4 17% | 2.9 29% | 3.2 22% | 4.7 -15% | 1.87 54% |
| Idle Average * (Watt) | 7.5 | 5.6 25% | 6.3 16% | 5.2 31% | 8.2 -9% | 9.2 -23% |
| Idle Maximum * (Watt) | 8.2 | 8.4 -2% | 9.9 -21% | 6.1 26% | 8.4 -2% | 9.3 -13% |
| Load Average * (Watt) | 35.5 | 40.8 -15% | 56.2 -58% | 33.6 5% | 36.8 -4% | 28.5 20% |
| Witcher 3 ultra * (Watt) | 37.5 | 35.5 5% | 56.6 -51% | 39.3 -5% | 30.4 19% | 27.4 27% |
| Load Maximum * (Watt) | 66.5 | 68.4 -3% | 60.8 9% | 49.1 26% | 49.9 25% | 31 53% |
* ... smaller is better
Power Consumption Witcher 3 / Stresstest
Power Consumption external Monitor
电池寿命
电池容量与蜻蜓G3相同,仍为68Wh。不过,新款机型的无线局域网运行时间更长,在自动关机前总共可运行近16个小时。这比大多数其他Windows笔记本电脑的运行时间长几个小时,与MacBook Air M2和MacBook G3的运行时间相当。 MacBook Air M2.
从空电充至满电大约需要90分钟。
| HP Dragonfly G4 i7-1365U, Iris Xe G7 96EUs, 68 Wh | HP Elite Dragonfly G3 i7-1265U, Iris Xe G7 96EUs, 68 Wh | Framework Laptop 13.5 13th Gen Intel i7-1370P, Iris Xe G7 96EUs, 61 Wh | Lenovo ThinkPad X13 G3 21CM002UGE R5 PRO 6650U, Radeon 660M, 54.7 Wh | Dell Latitude 9330 i7-1260U, Iris Xe G7 96EUs, 50 Wh | Apple MacBook Air M2 Entry M2, M2 8-Core GPU, 52.6 Wh | |
|---|---|---|---|---|---|---|
| Battery runtime | -9% | -45% | -37% | -44% | -15% | |
| Reader / Idle (h) | 42.5 | 37.8 -11% | 15.4 -64% | |||
| WiFi v1.3 (h) | 15.9 | 11.8 -26% | 8.8 -45% | 12.5 -21% | 9.4 -41% | 15.2 -4% |
| Load (h) | 3.2 | 3.5 9% | 1.5 -53% | 2.3 -28% | 2.4 -25% | |
| H.264 (h) | 16.5 |
Pros
Cons
结论--第13代英特尔仅有微弱提升
与我们对 2023 戴尔 XPS 13 Plus2023款Dragonfly G4相比去年的 精英版蜻蜓G3.事实上,大多数用户不太可能注意到Dragonfly G3的第12代CPU与Dragonfly G4的第13代CPU之间的性能提升。该机型的其他方面,如显示屏选项没有变化,而新的电源管理软件也没有改变游戏规则。
Dragonfly G4是已经非常出色的Dragonfly G3的一个小更新。如果新的CPU没有吸引力,那么蜻蜓G3也能提供基本相同的体验。
今年的小更新并不出乎意料,因为蜻蜓G3已经完全重新设计,而且才推出不到一年。我们对蜻蜓G3的功能、特性和外观大加赞赏,而蜻蜓G4只是加强了这些优势。因此,有兴趣的买家可能会考虑价格较低的2022款蜻蜓G3,因为2023款蜻蜓G4并没有带来更多的惊喜。如果想在性能上有更大的提升,用户可以考虑框架13.5或华硕Zenbook S 13这两款产品均提供酷睿-U系列之外的CPU选择。
价格和供货情况
惠普Dragonfly G4的基本配置为酷睿i5和1280p,起价为1300美元,全配置起价为2400美元。
HP Dragonfly G4
- 07/18/2023 v7 (old)
Allen Ngo
Transparency
The selection of devices to be reviewed is made by our editorial team. The test sample was provided to the author as a loan by the manufacturer or retailer for the purpose of this review. The lender had no influence on this review, nor did the manufacturer receive a copy of this review before publication. There was no obligation to publish this review. As an independent media company, Notebookcheck is not subjected to the authority of manufacturers, retailers or publishers.
This is how Notebookcheck is testing
Every year, Notebookcheck independently reviews hundreds of laptops and smartphones using standardized procedures to ensure that all results are comparable. We have continuously developed our test methods for around 20 years and set industry standards in the process. In our test labs, high-quality measuring equipment is utilized by experienced technicians and editors. These tests involve a multi-stage validation process. Our complex rating system is based on hundreds of well-founded measurements and benchmarks, which maintains objectivity. Further information on our test methods can be found here.
Price comparison

