


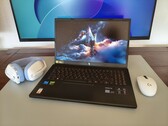
经济实惠的游戏入门机型:宏碁 Nitro V 15 并未给人留下深刻印象
游戏笔记本电脑的价格很快就会达到数千欧元。那些希望控制支出的人可能会发现宏碁的 Nitro V 15 很有吸引力,因为它以相对适中的价格提供了 RTX 5050 GPU。我们将这款 15 英寸游戏笔记本与其前代产品和竞争机型进行了比较。
Intel Core i5-13420H, NVIDIA GeForce RTX 5050 Laptop, 15.6", 2.1 kgNvidiaGeForce RTX 5050 Laptop是 Blackwell 系列笔记本专用显卡,由 Team Green 于 2025 年 6 月推出。它使用的是 GB207 芯片。
与 RTX 4050 Laptop GPU 一样,该 GPU 提供 2,560 个统一着色器(CUDA 内核)和 128 位内存总线,可支持 8 GB GDDR7 显存。
GPU 的其他特性包括原生第五代光线追踪内核、PCIe 5 支持、DisplayPort 2.1a 和 440 TOPS AI 性能(得益于内置的张量内核)。
无 DLSS 帧生成的性能应与旧版 RTX 4060 笔记本电脑 GPU笔记本电脑 GPU。在 3DMark 测试中,RTX 5060 在 115 W(包括动态提升)的情况下速度快 21 - 22%(通过Videocardz)。).与往常一样,性能在很大程度上取决于功耗(TGP)和散热。因此,笔记本电脑中也会有明显较慢的型号。
该芯片由台积电公司(TSMC)采用 4 纳米工艺(4N)生产。功耗(TGP)规定为 35-100 瓦(115 瓦,包括动态提升 2.0)。
GeForce RTX 5000 Laptop GPU Series
| |||||||||||||||||||
| Codename | GN22-X2 | ||||||||||||||||||
| Architecture | Blackwell | ||||||||||||||||||
| Pipelines | 2560 - unified | ||||||||||||||||||
| TMUs | 80 | ||||||||||||||||||
| ROPs | 32 | ||||||||||||||||||
| Raytracing Cores | 20 | ||||||||||||||||||
| Tensor / AI Cores | 80 | ||||||||||||||||||
| Core Speed | 1020 - 2662 (Boost) MHz | ||||||||||||||||||
| AI GPU | 440 TOPS INT8 | ||||||||||||||||||
| Cache | L1: 2.5 MB, L2: 32 MB | ||||||||||||||||||
| Memory Speed | 14000 effective = 1750 MHz | ||||||||||||||||||
| Memory Bus Width | 128 Bit | ||||||||||||||||||
| Memory Type | GDDR6 | ||||||||||||||||||
| Max. Amount of Memory | 8 GB | ||||||||||||||||||
| Shared Memory | no | ||||||||||||||||||
| Memory Bandwidth | 224 GB/s | ||||||||||||||||||
| API | DirectX 12_2 | ||||||||||||||||||
| Power Consumption | 100 Watt (35 - 100 Watt TGP) | ||||||||||||||||||
| Man. Technology | 5 nm | ||||||||||||||||||
| PCIe | 5 | ||||||||||||||||||
| Displays | 4 Displays (max.), DisplayPort 2.1a | ||||||||||||||||||
| Notebook Size | medium sized | ||||||||||||||||||
| Date of Announcement | 02.01.2025 | ||||||||||||||||||
| Link to Manufacturer Page | www.nvidia.com | ||||||||||||||||||
| Predecessor | GeForce RTX 4050 Laptop GPU | ||||||||||||||||||
The following benchmarks stem from our benchmarks of review laptops. The performance depends on the used graphics memory, clock rate, processor, system settings, drivers, and operating systems. So the results don't have to be representative for all laptops with this GPU. For detailed information on the benchmark results, click on the fps number.


| low | med. | high | ultra | QHD | 4K | |
|---|---|---|---|---|---|---|
| Call of Duty Black Ops 7 | 94 | 73 | 26 | |||
| Anno 117: Pax Romana | 61 | 44 | 22 | |||
| ARC Raiders | 84 | 73 | 50 | |||
| The Outer Worlds 2 | 83.5 | 69 | 54 | 29 | 21.5 | |
| Battlefield 6 | 91 | 78 | 56 | |||
| Borderlands 4 | 37 | 29 | 17 | |||
| F1 25 | 150.8 | 127 | 112 | 16 | 5 | |
| Doom: The Dark Ages | 53 | 48 | 47 | 31.9 | ||
| The Elder Scrolls IV Oblivion Remastered | 48 | 44 | 23 | 13.4 | ||
| Assassin's Creed Shadows | 45 | 39 | 28 | 25 | ||
| Civilization 7 | 104.4 | |||||
| Monster Hunter Wilds | 47 | 43 | 32 | |||
| Kingdom Come Deliverance 2 | 82 | 66 | 47 | 36.8 | ||
| Indiana Jones and the Great Circle | 59.5 | 54 | 23 | 9.58 | ||
| Marvel Rivals | 88 | 73 | 63 | 43 | 32 | |
| Stalker 2 | 48 | 42 | 34 | 29 | ||
| Until Dawn | 71 | 53 | 40 | 30.4 | ||
| Space Marine 2 | 67 | 65 | 62 | 49.5 | ||
| Star Wars Outlaws | 46 | 41 | 33 | 23.2 | ||
| F1 24 | 182.2 | 156 | 132.1 | 49.9 | 33.4 | |
| Senua's Saga Hellblade 2 | 49 | 35 | 24.2 | |||
| Ghost of Tsushima | 75 | 68 | 54 | 39.7 | ||
| Horizon Forbidden West | 79 | 59 | 58 | 45.7 | ||
| Cyberpunk 2077 | 111 | 88 | 77 | 68 | 43 | |
| Baldur's Gate 3 | 97.3 | 97 | 82 | 78 | 63 | |
| Shadow of the Tomb Raider | 139 | 126 | ||||
| Strange Brigade | 407 | 238 | 195 | 172 | 129 | |
| X-Plane 11.11 | 106 | 89 | 76 | |||
| Final Fantasy XV Benchmark | 169 | 121 | 96 | 70 | ||
| Dota 2 Reborn | 166 | 132 | 126 | 119 | ||
| GTA V | 182 | 172 | 164 | 109 | 95 | |
| low | med. | high | ultra | QHD | 4K | < 30 fps < 60 fps < 120 fps ≥ 120 fps | 5 6 | 9 14 6 | 1 12 13 5 | 8 12 5 2 | 8 9 3 1 | |
For more games that might be playable and a list of all games and graphics cards visit our Gaming List

HP Victus 15-fa2160ng: Intel Core i5-13420H, 15.60", 2.4 kg
Review » 1200 美元的预算玩家:惠普 Victus 15 RTX 5050 笔记本电脑评测
Medion Erazer Scout 17 E1 MD62758: Intel Core 5 210H, 17.30", 2.7 kg
Review » Medion Erazer Scout 17 E1 评测:评估 RTX 5050 笔记本电脑作为中低端 GPU 的价值
Lenovo Yoga Pro 7 15IPH11, RTX 5050: Intel Core Ultra 7 356H, 15.30", 1.6 kg
External Review » Lenovo Yoga Pro 7 15IPH11, RTX 5050 - 评测与配置
Lenovo Yoga Pro 9 16IAH10 RTX 5050: Intel Core Ultra 9 285H, 16.00", 2 kg
External Review » 联想 Yoga Pro 9 16IAH10 RTX 5050
Asus ROG Strix G16 G615JHR: Intel Core i5-13450HX, 16.00", 2.7 kg
External Review » Asus ROG Strix G16 G615JHR
HP Victus 15-fb3357ng: AMD Ryzen 5 240, 15.60", 2.3 kg
External Review » HP Victus 15-fb3357ng
Lenovo LOQ 17IRX10, RTX 5050: Intel Core i5-13450HX, 17.30", 2.9 kg
External Review » Lenovo LOQ 17IRX10, RTX 5050
Lenovo LOQ 15AHP10, RTX 5050: AMD Ryzen 5 220, 15.60", 2.4 kg
External Review » Lenovo LOQ 15AHP10, RTX 5050
Acer Nitro V 16 AI ANV16-42-R860: AMD Ryzen 5 240, 16.00", 2.4 kg
External Review » 宏碁 Nitro V 16 AI ANV16-42-R860
MSI Cyborg 15 B2RWEKG: Intel Core 7 240H, 15.60", 2.2 kg
External Review » MSI Cyborg 15 B2RWEKG
Acer Nitro V 16S AI ANV16S-41 : AMD Ryzen 5 240, 16.00", 2.1 kg
External Review » Acer Nitro V 16S AI ANV16S-41
Asus TUF Gaming A16 FA608UH: AMD Ryzen 7 260, 16.00", 2.2 kg
External Review » 华硕 TUF Gaming A16 FA608UH
Alienware 16 Aurora, RTX 5050: Intel Core 7 240H, 16.00", 2.7 kg
External Review » Alienware 16 Aurora、RTX 5050
Lenovo Legion 5 15AHP10, Ryzen 7 260 RTX 5050: AMD Ryzen 7 260, 15.10", 1.9 kg
External Review » Lenovo Legion 5 15AHP10, Ryzen 7 260 RTX 5050
MSI Katana 15 HX B14WEK: Intel Core i7-14650HX, 15.60", 2.4 kg
External Review » MSI Katana 15 HX B14WEK
Gigabyte Gaming A16 GA63H: AMD Ryzen 7 260, 16.00", 2.2 kg
External Review » Gigabyte Gaming A16 GA63H
Acer Nitro V15 ANV15-52: Intel Core i7-13620H, 15.60", 2.1 kg
External Review » Acer Nitro V15 ANV15-52
LG gram Pro AI 17 17Z90TR: Intel Core Ultra 9 285H, 17.00", 1.5 kg
External Review » LG gram Pro AI 17 17Z90TR
Asus TUF Gaming A18 FA808UH: AMD Ryzen 7 260, 18.00", 2.6 kg
External Review » Asus TUF Gaming A18 FA808UH
Asus TUF Gaming F16 FX608JHR: Intel Core i7-14650HX, 16.00", 2.2 kg
External Review » Asus TUF Gaming F16 FX608JHR
Asus TUF Gaming F16 FX608JHV: Intel Core i5-13450HX, 16.00", 2.2 kg
External Review » Asus TUF Gaming F16 FX608JH
Asus V16 V3607VH: Intel Core 7 240H, 16.00", 2 kg
External Review » Asus V16 V3607VH
Lenovo Yoga Pro 9 16IAH10 RTX 5050: Intel Core Ultra 9 285H, 16.00", 2 kg
» Core Ultra 9 285H 与 Core Ultra 7 255H 相比几乎没有任何优势
» Comparison of GPUs
Detailed list of all laptop GPUs sorted by class and performance.
» Benchmark List
Sort and restrict laptop GPUs based on performance in synthetic benchmarks.
» Notebook Gaming List
Playable games for each graphics card and their average FPS results.
* Approximate position of the graphics adapter
» Notebookcheck多媒体笔记本电脑Top 10排名
» Notebookcheck游戏笔记本电脑Top 10排名
» Notebookcheck低价办公/商务笔记本电脑Top 10排名
» Notebookcheck高端办公/商务笔记本电脑Top 10排名
» Notebookcheck工作站笔记本电脑Top 10排名
» Notebookcheck亚笔记本电脑Top 10排名
» Notebookcheck超级本产品Top 10排名
» Notebookcheck变形本产品Top 10排名
» Notebookcheck平板电脑Top 10排名
» Notebookcheck智能手机Top 10排名
» Notebookcheck评测过最出色的笔记本电脑屏幕
» Notebookcheck售价500欧元以下笔记本电脑Top 10排名
» Notebookcheck售价300欧元以下笔记本电脑Top 10排名