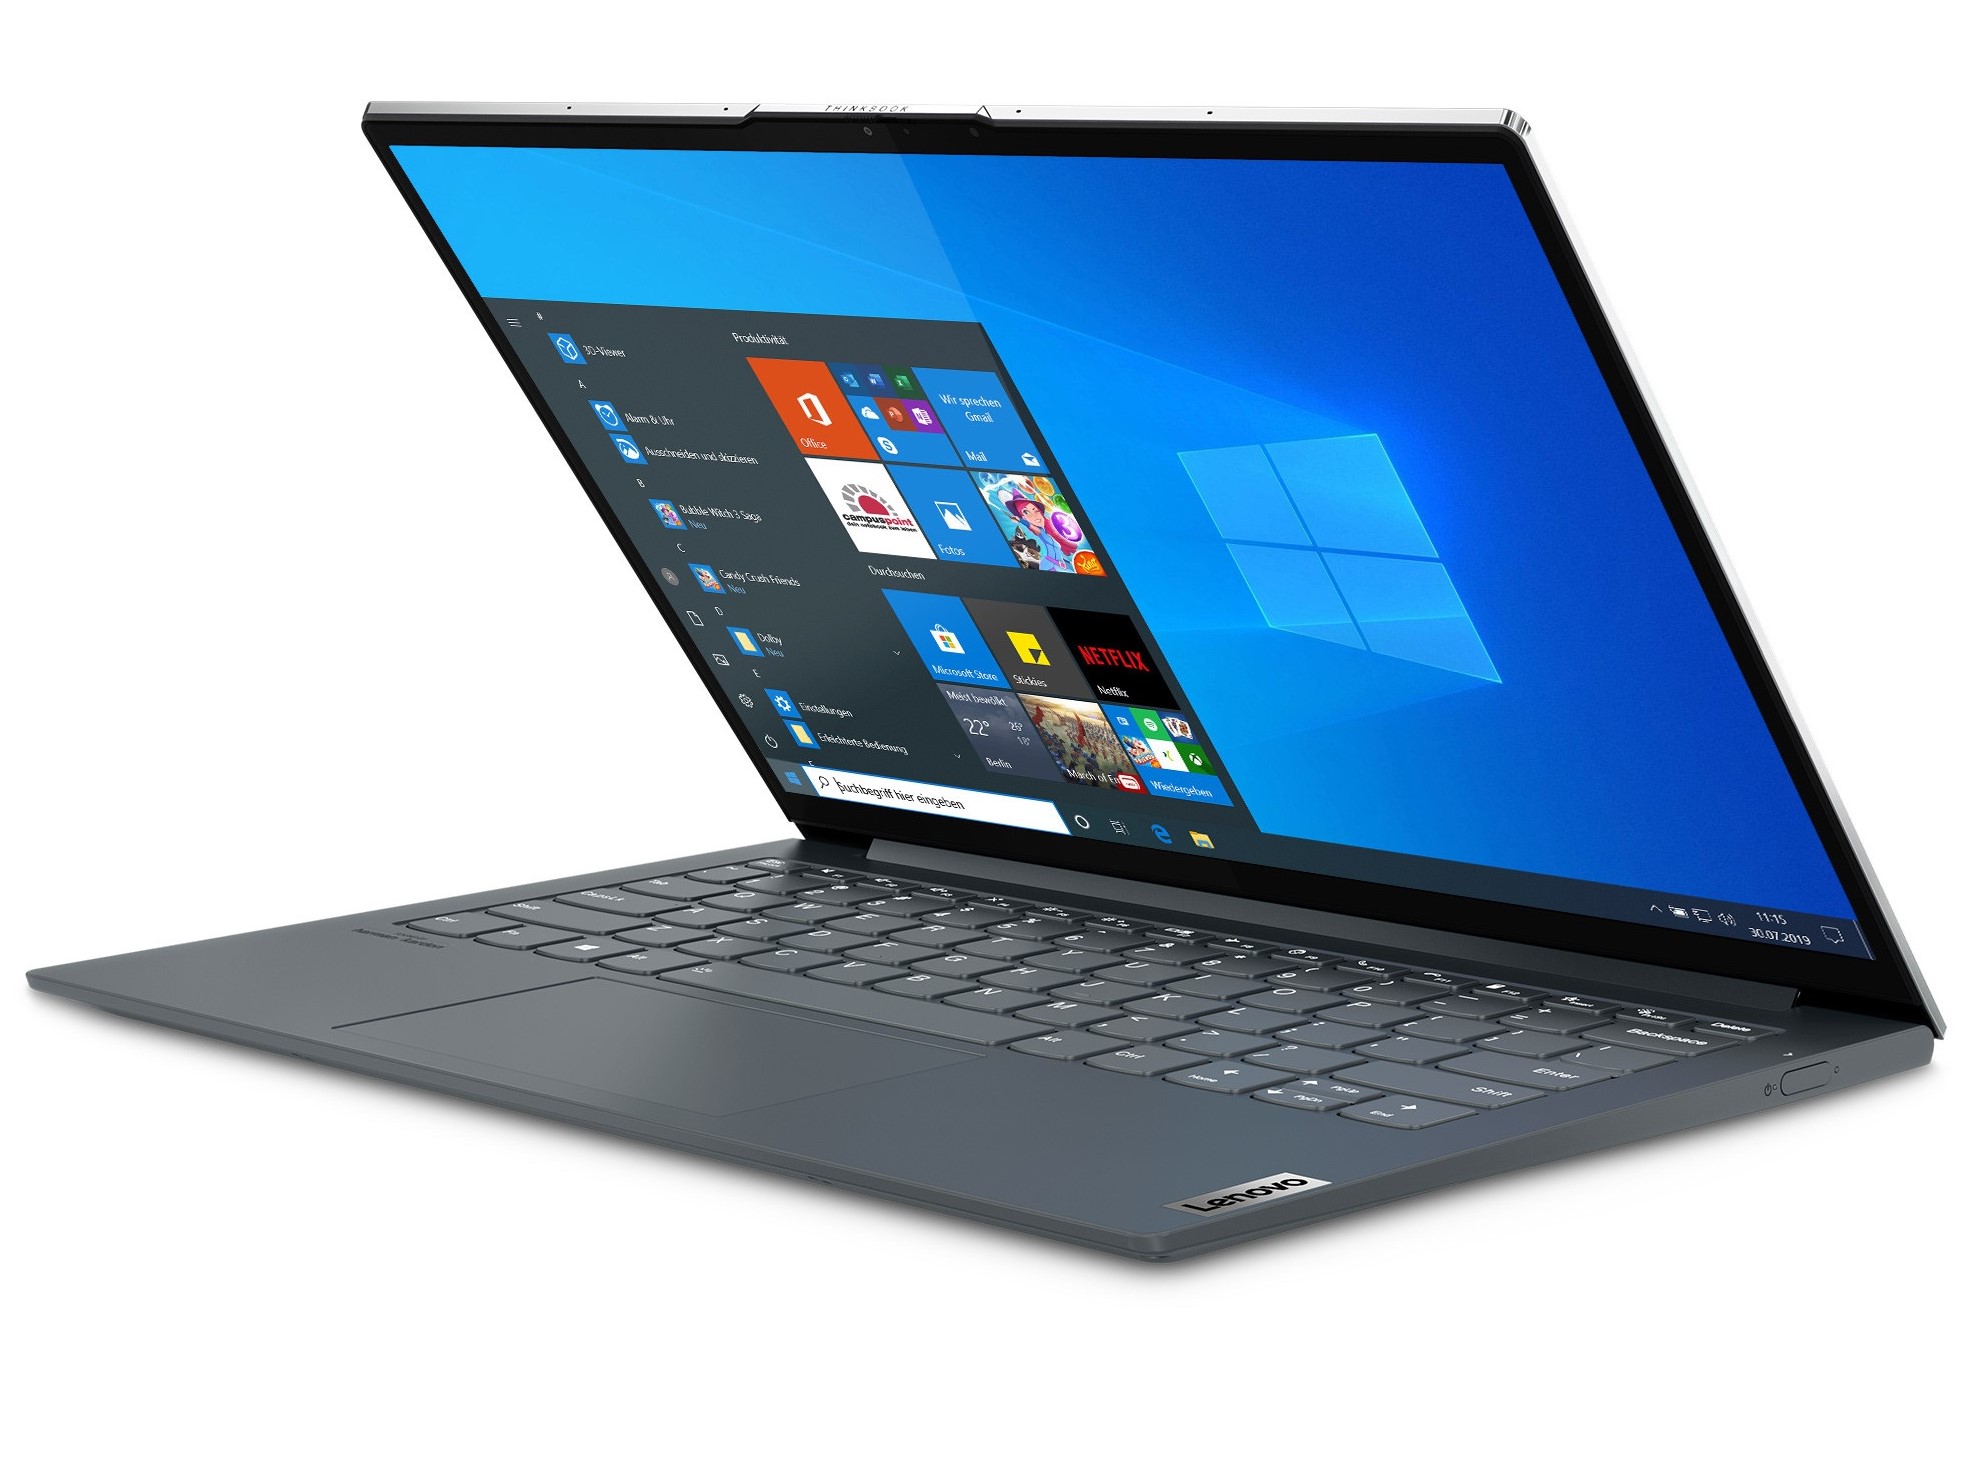
联想ThinkBook 13x G1的回顾。具有良好电池寿命的超薄笔记本

联想的ThinkBook 13x G1是一款小而薄的笔记本,应该很适合移动工作。与之相比 ThinkPad X13 G2,一些商务功能被省略了,但约1460欧元(约1688美元)的价格也稍低。为此,有一个节能的英特尔酷睿i7-1160G7,16GB内存和512GB固态硬盘。
Possible competitors in comparison
Rating | Date | Model | Weight | Height | Size | Resolution | Price |
|---|---|---|---|---|---|---|---|
| 87.3 % v7 (old) | 11 / 2021 | Lenovo ThinkBook 13x G1-20WJ001KGE i7-1160G7, Iris Xe G7 96EUs | 1.1 kg | 12.9 mm | 13.30" | 2560x1600 | |
| 84.4 % v7 (old) | 08 / 2021 | HP Pavilion Aero 13 be0097nr R7 5800U, Vega 8 | 953 g | 17 mm | 13.30" | 1920x1200 | |
| 85.6 % v7 (old) | 09 / 2021 | Fujitsu LifeBook U9311X i7 LTE i7-1185G7, Iris Xe G7 96EUs | 1 kg | 17 mm | 13.30" | 1920x1080 | |
| 88.3 % v7 (old) | 06 / 2021 | Dell XPS 13 9310 OLED i7-1185G7, Iris Xe G7 96EUs | 1.2 kg | 14.8 mm | 13.40" | 3456x2160 |
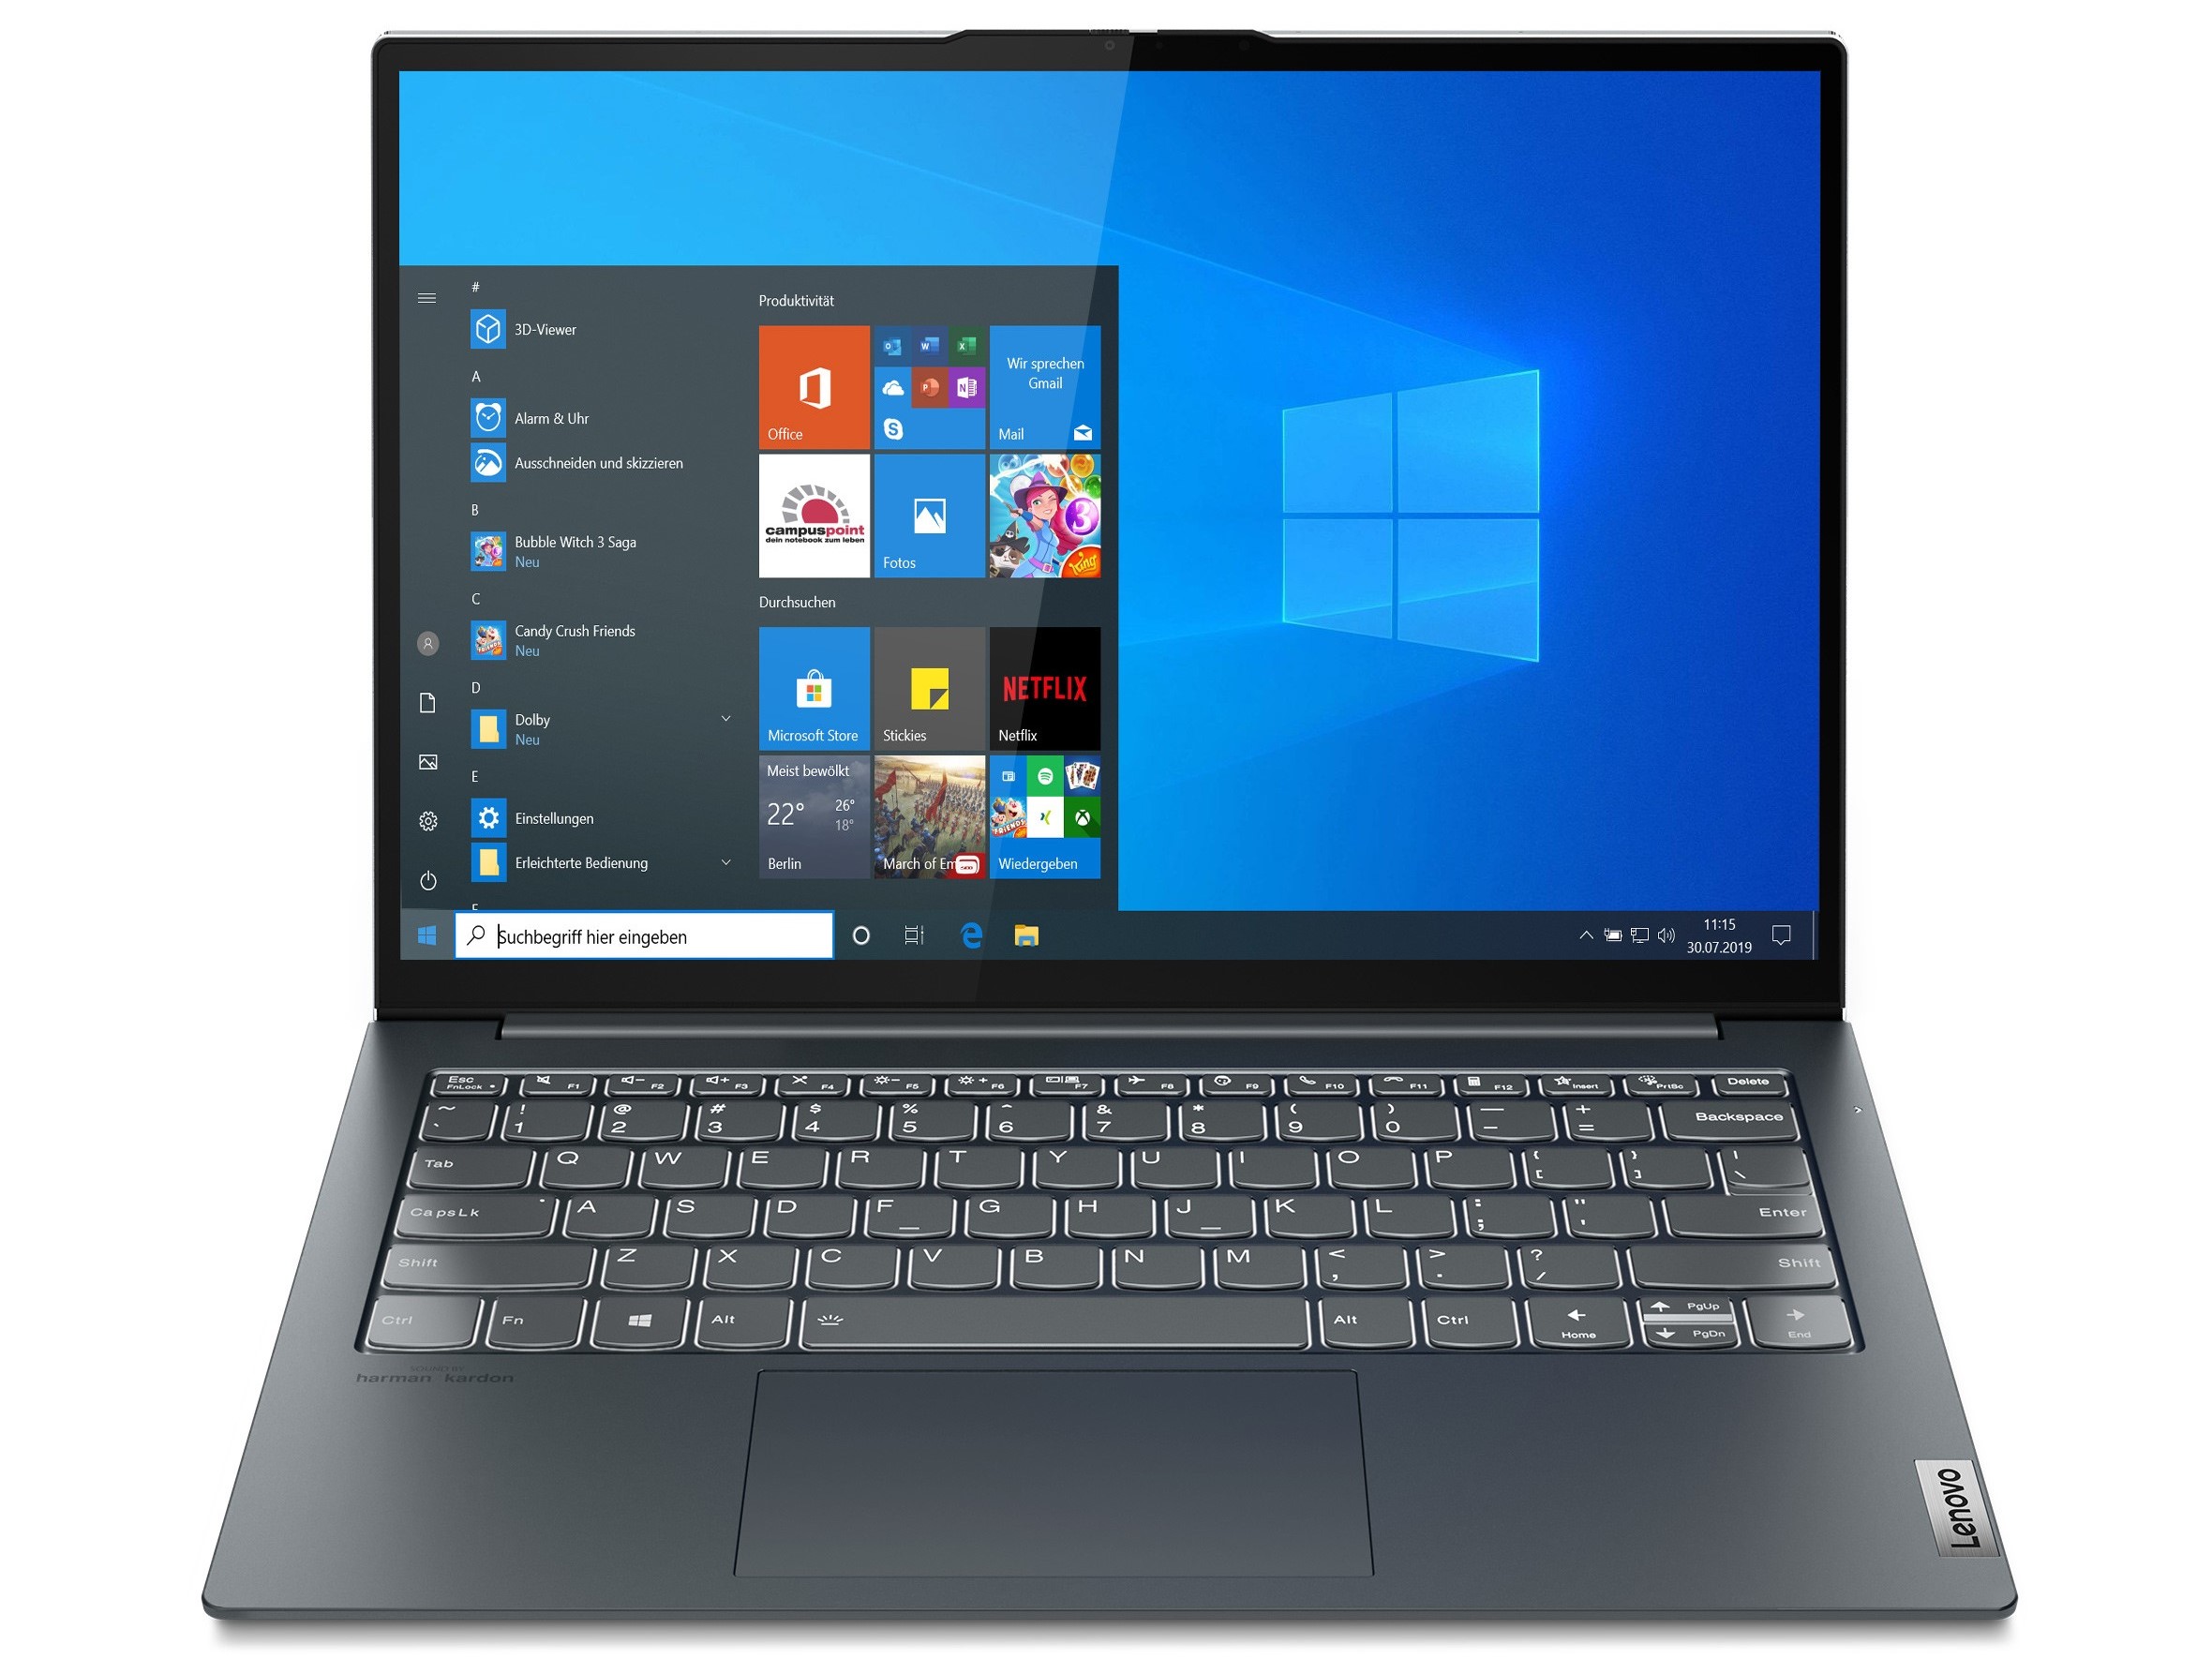
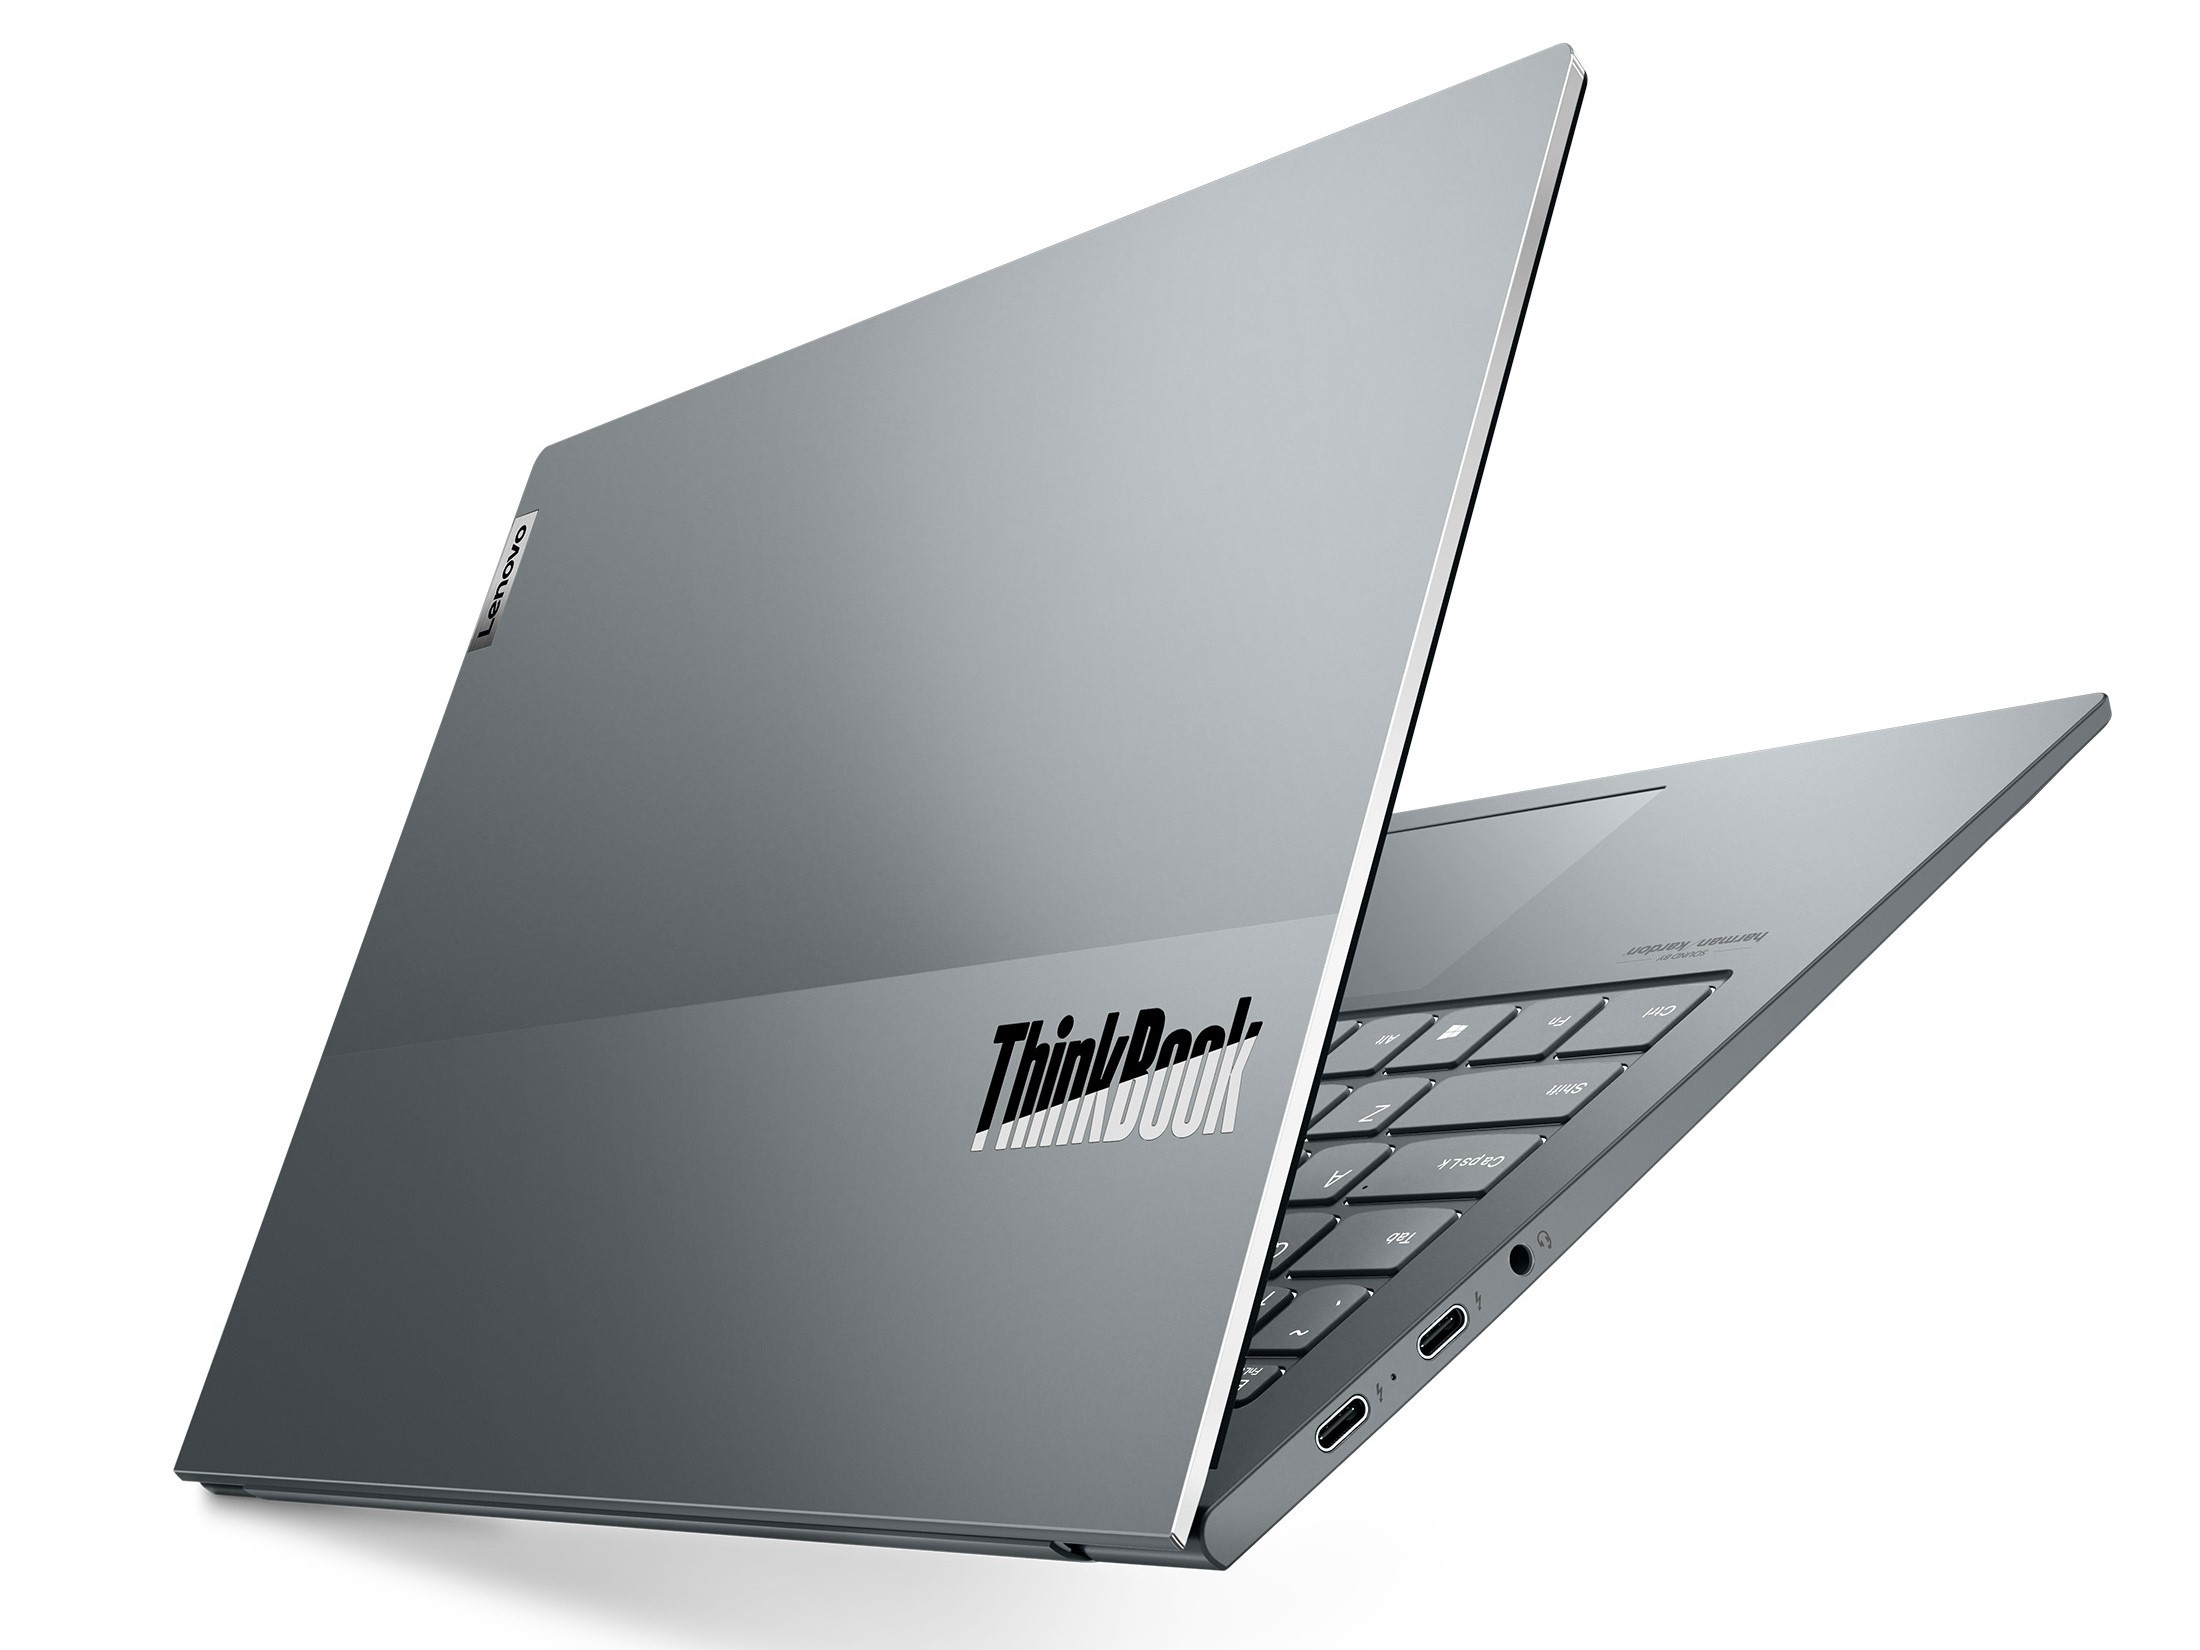
案例 - 稳定而纤细的联想笔记本
联想用铝制造ThinkBook 13x的外壳,盖子和底座都是用铝制造的。因此,这款笔记本电脑非常稳定,而且相当轻,重量约为1.1公斤(约2.4磅)。显示屏可以向后折叠180°,并在每个设定的位置被铰链牢牢固定。制造质量非常好,没有不均匀的凸起边缘或类似的情况。
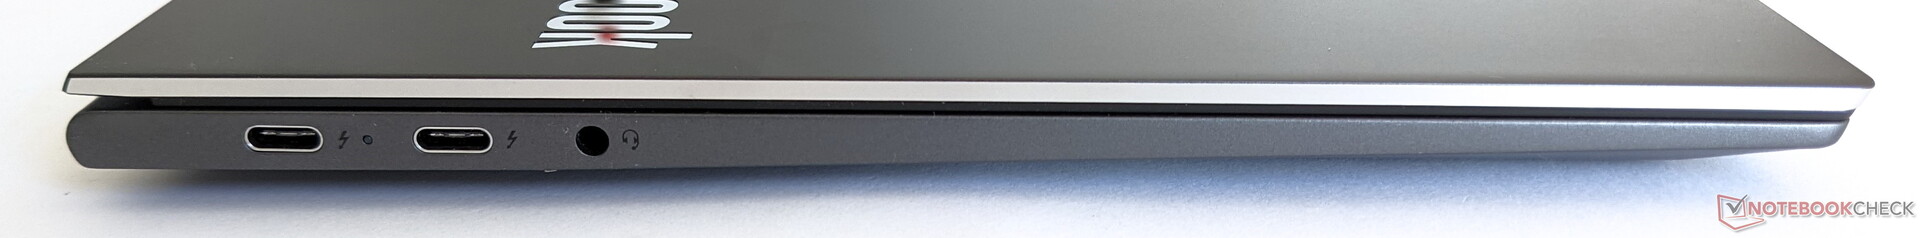
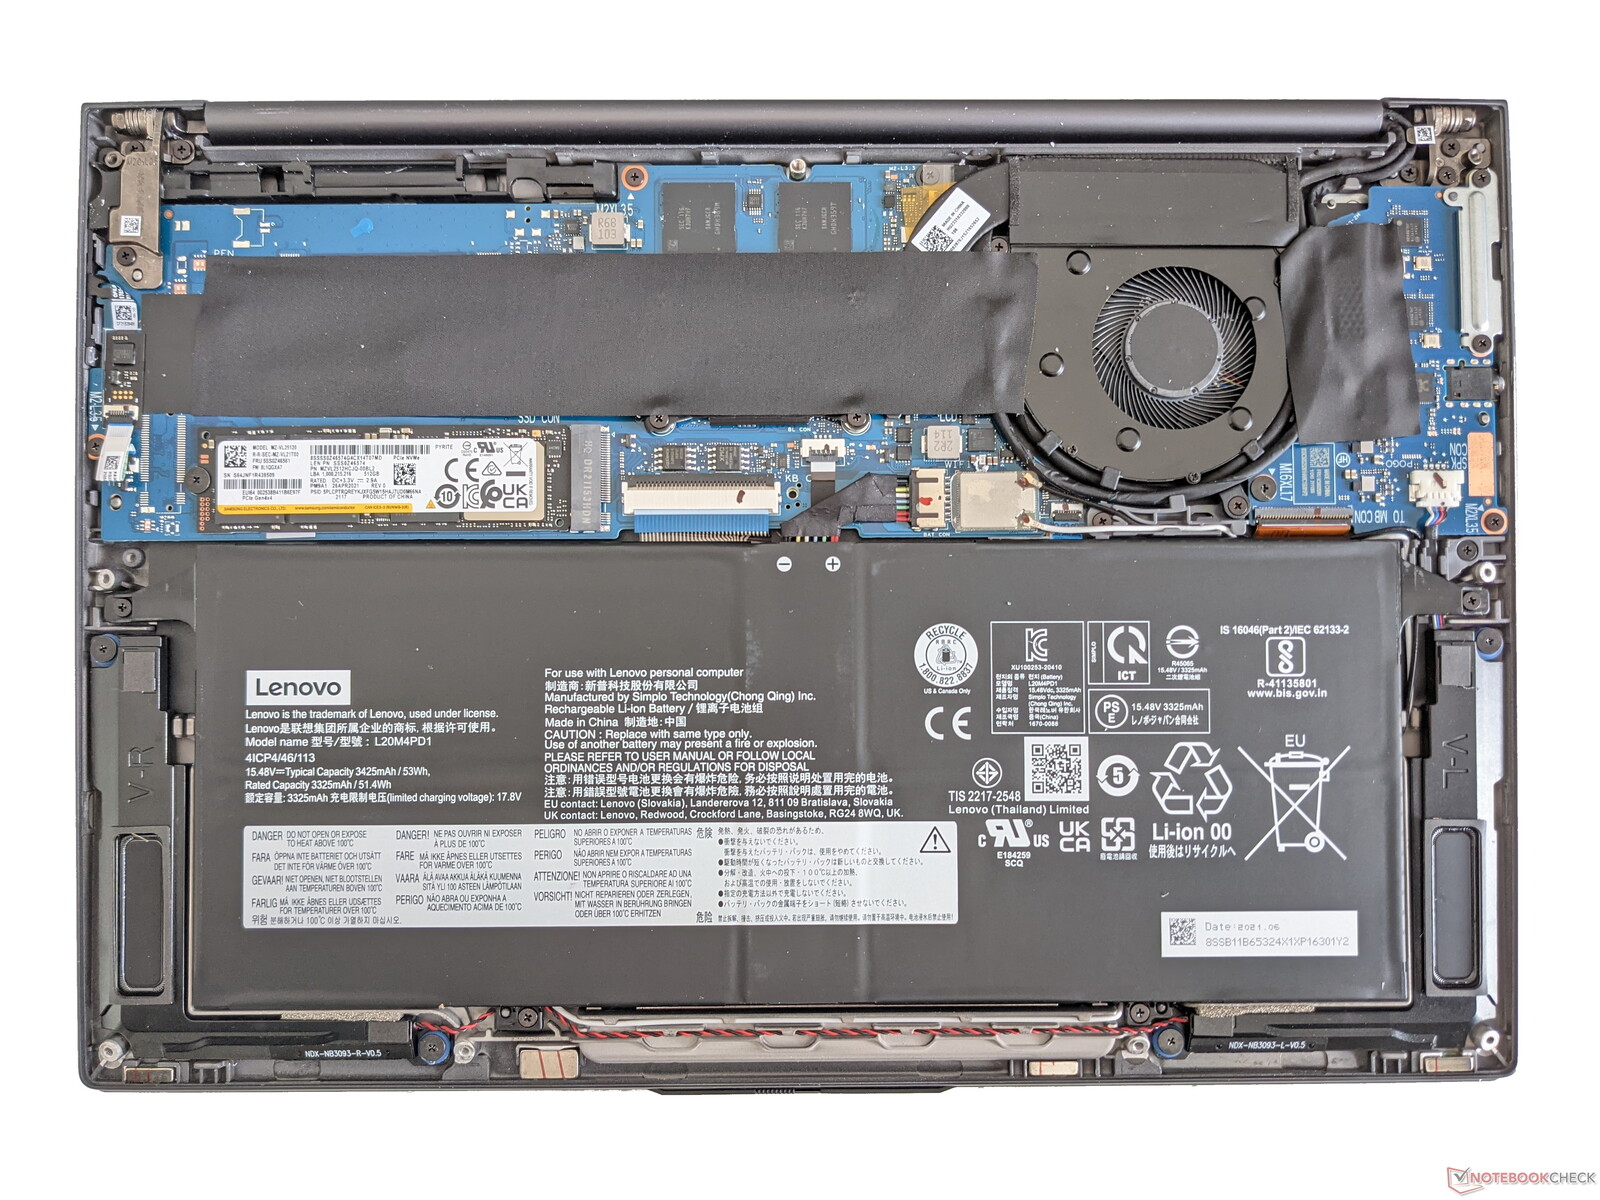
设备 - 两个雷电4和可交换的固态硬盘
ThinkBook 13x提供了两个Thunderbolt 4端口,包括DisplayPort功能,可以用相应的适配器来创建许多其他端口。一个组合插孔端口可用于连接耳机。
沟通
对于无线通信,联想的笔记本可以依靠蓝牙5.2和WiFi 6。后者在与我们的参考路由器Netgear Nighthawk AX12结合使用时,能够实现非常好的速度,平均传输速度为1,428 MBit/s,接收数据时为1,646 MBit/s。
网络摄像头
联想在ThinkBook 13x上只安装了一个低分辨率的90万像素网络摄像头。这使得即使在环境光线良好的情况下,主体看起来也很模糊,颜色对比度也很低。


安全问题
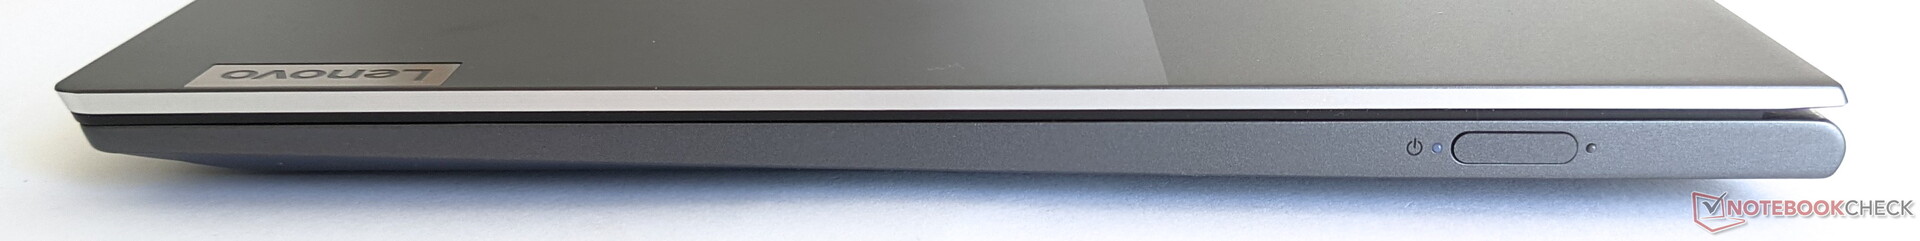
联想笔记本电脑的网络摄像头可以用机械快门关闭,集成在电源按钮上的指纹传感器可用于解锁笔记本。在我们的测试中,这总是可靠地工作。
辅料
除了笔记本本身,供货范围还包括一个带USB-C接口的65瓦电源,一个蓝牙鼠标和一个VGA/HDMI转USB-C适配器。其他配件,如合适的手提箱,也可以从联想购买。
维护
在卸下所有可见的螺丝后,ThinkBook 13x的底板可以小心翼翼地取出来。固态硬盘可以在里面更换,但内存和其他组件是焊接的。
担保
联想为ThinkBook 13x提供的保修期为12个月。
输入设备--推荐给经常写作的人
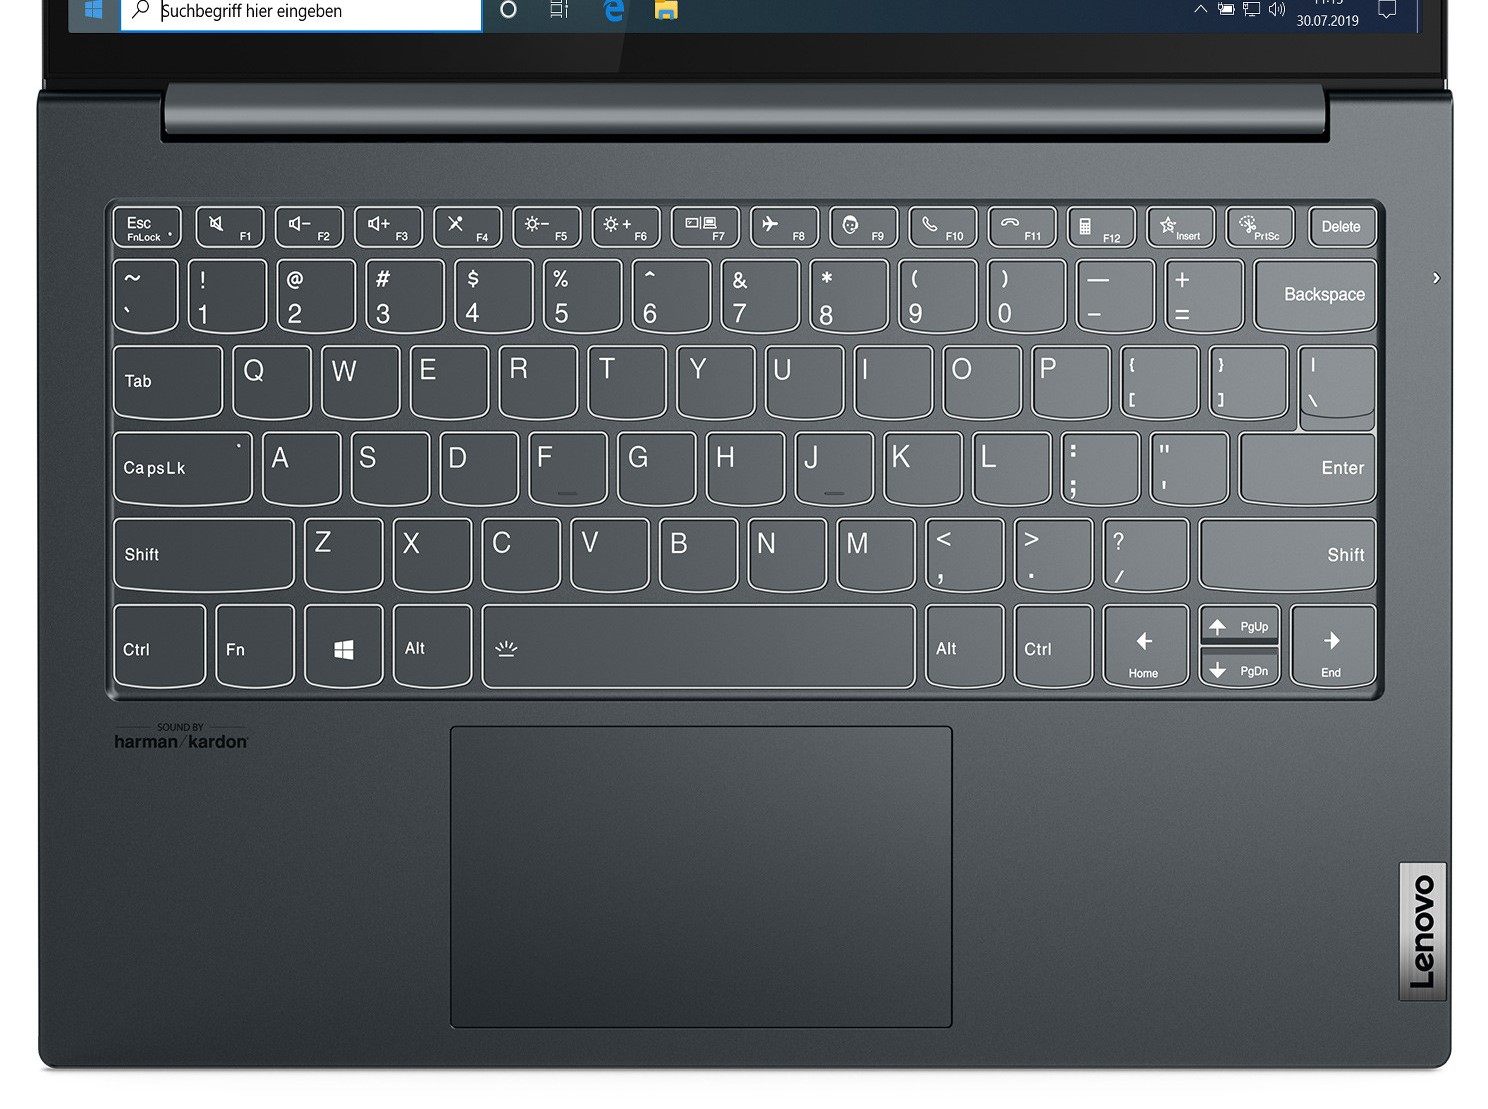
键盘
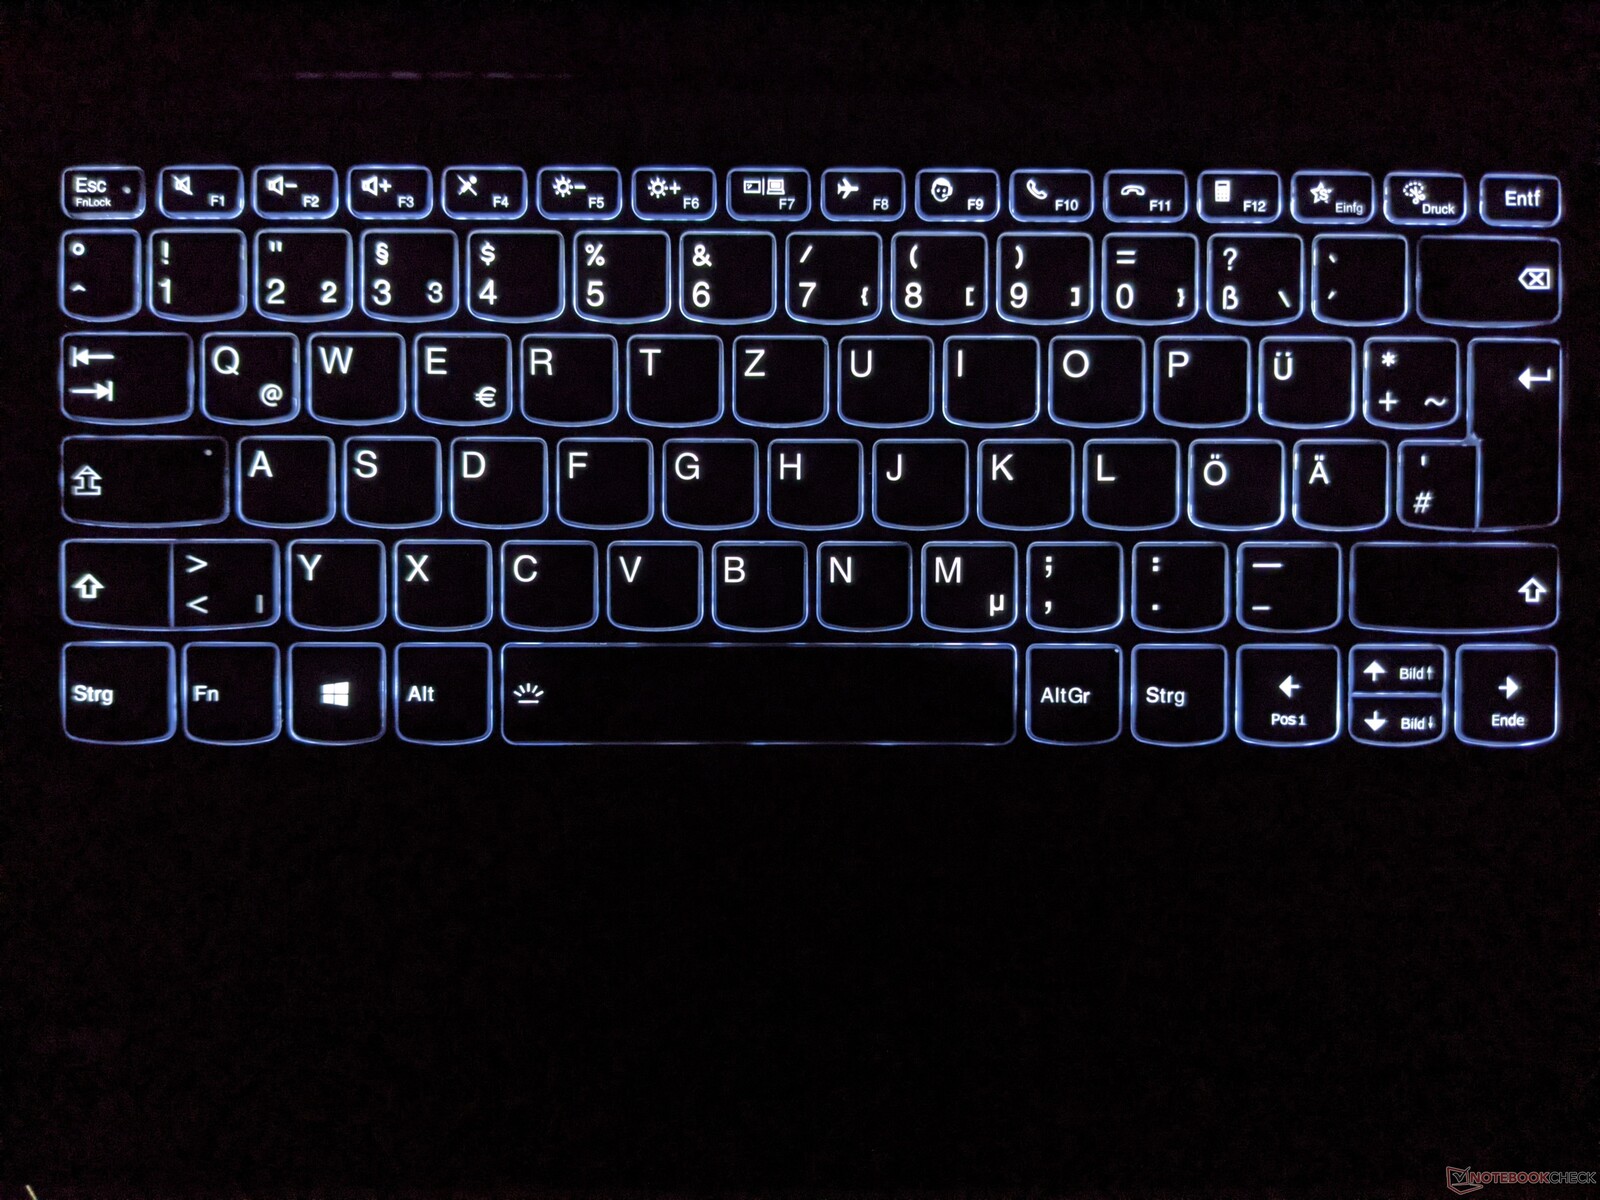
ThinkBook 13x的键盘提供了一个明显的压力点,很适合书写较长的文字。分开的回车键和小的方向键需要一些时间来适应。尽管采用了狭窄的布局和辅助布局,但特殊按键也很容易触及。
触摸板
联想使用点击板作为鼠标的替代品,这很适合导航鼠标指针。通过触摸以及机械压力触发的鼠标点击被可靠地登记。
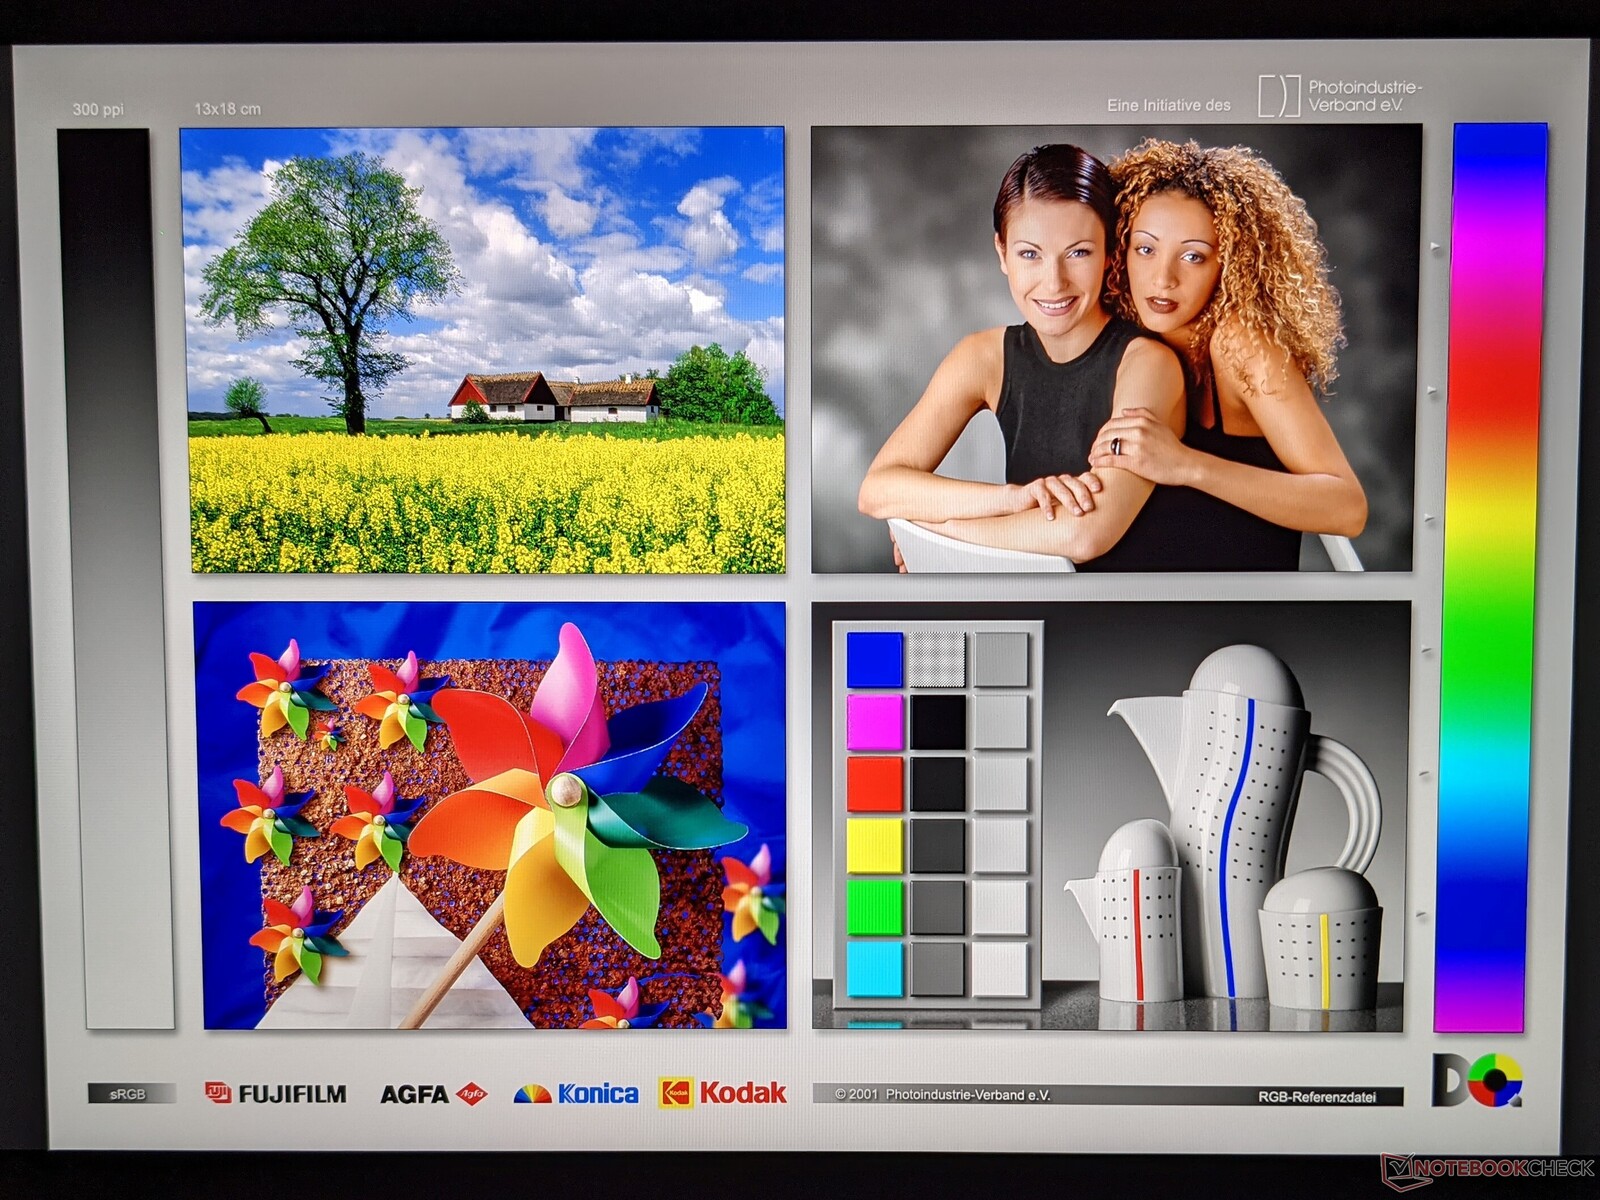
显示屏 - 明亮且色彩丰富,但有反光
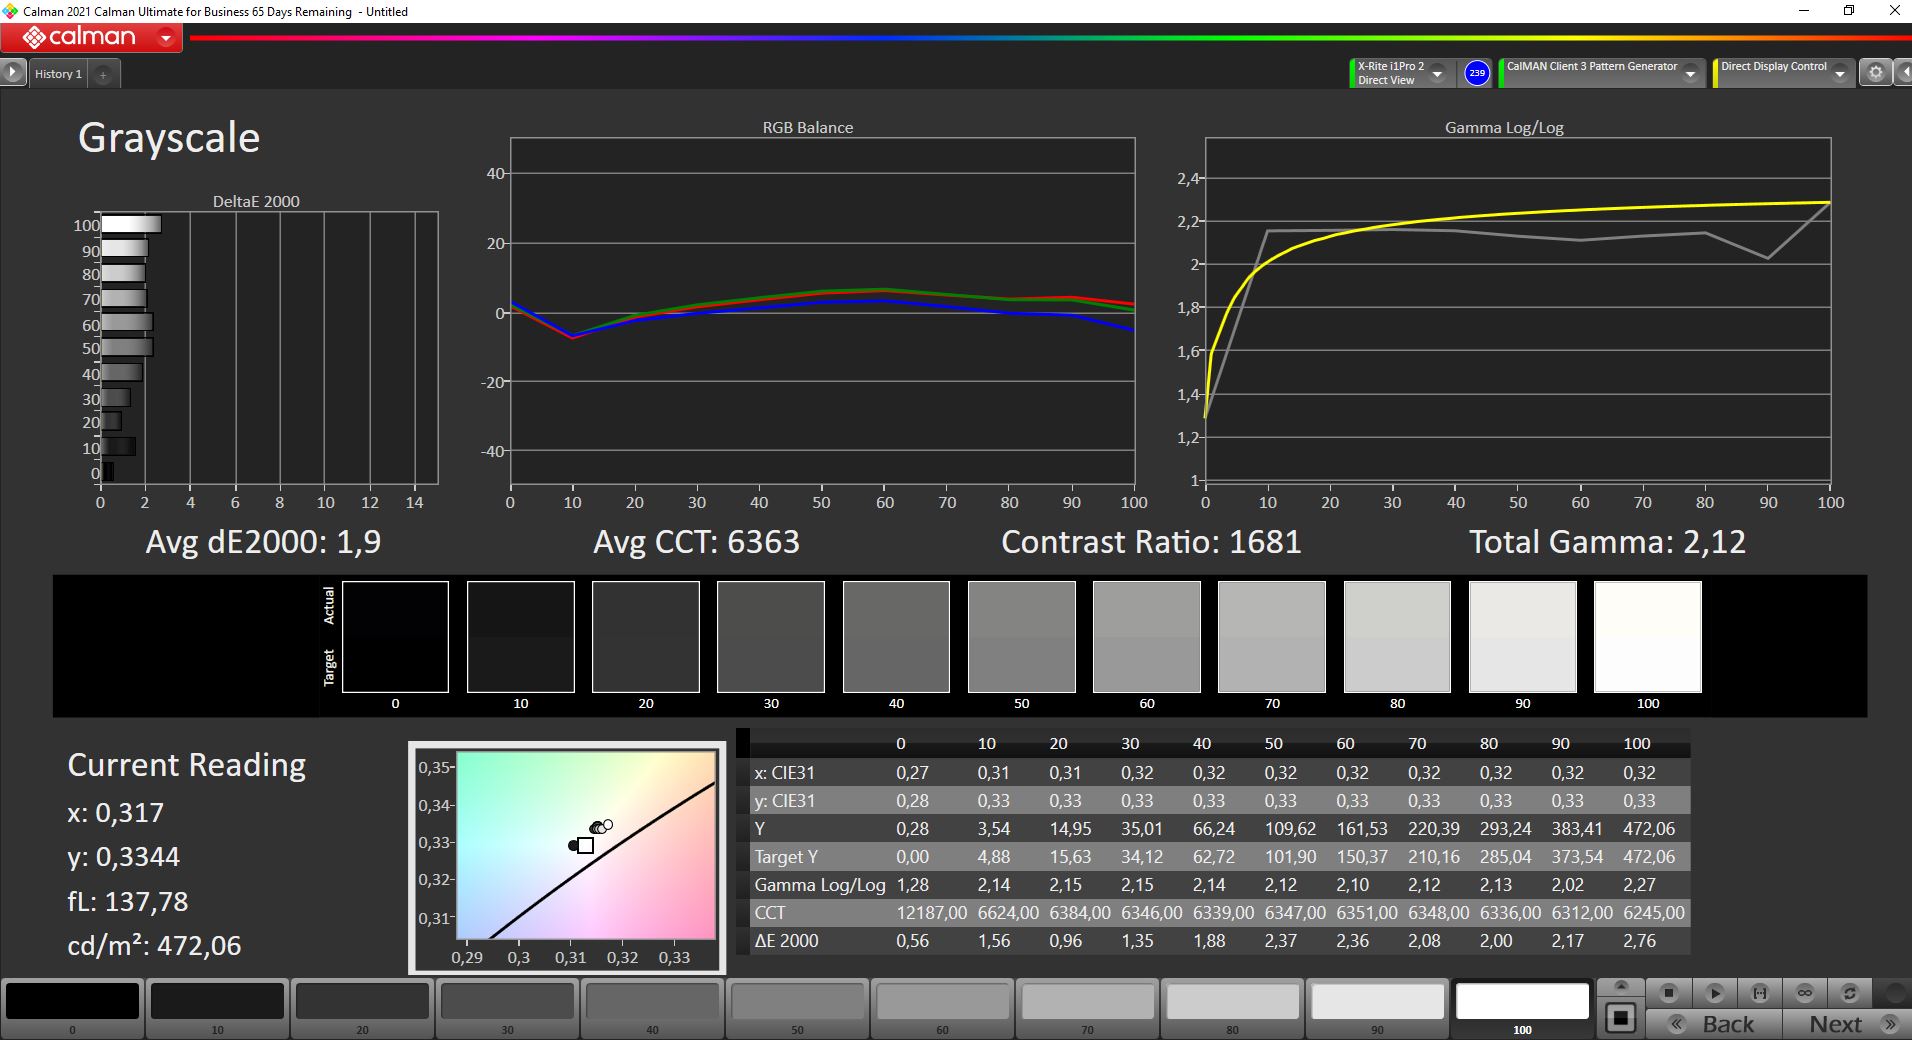
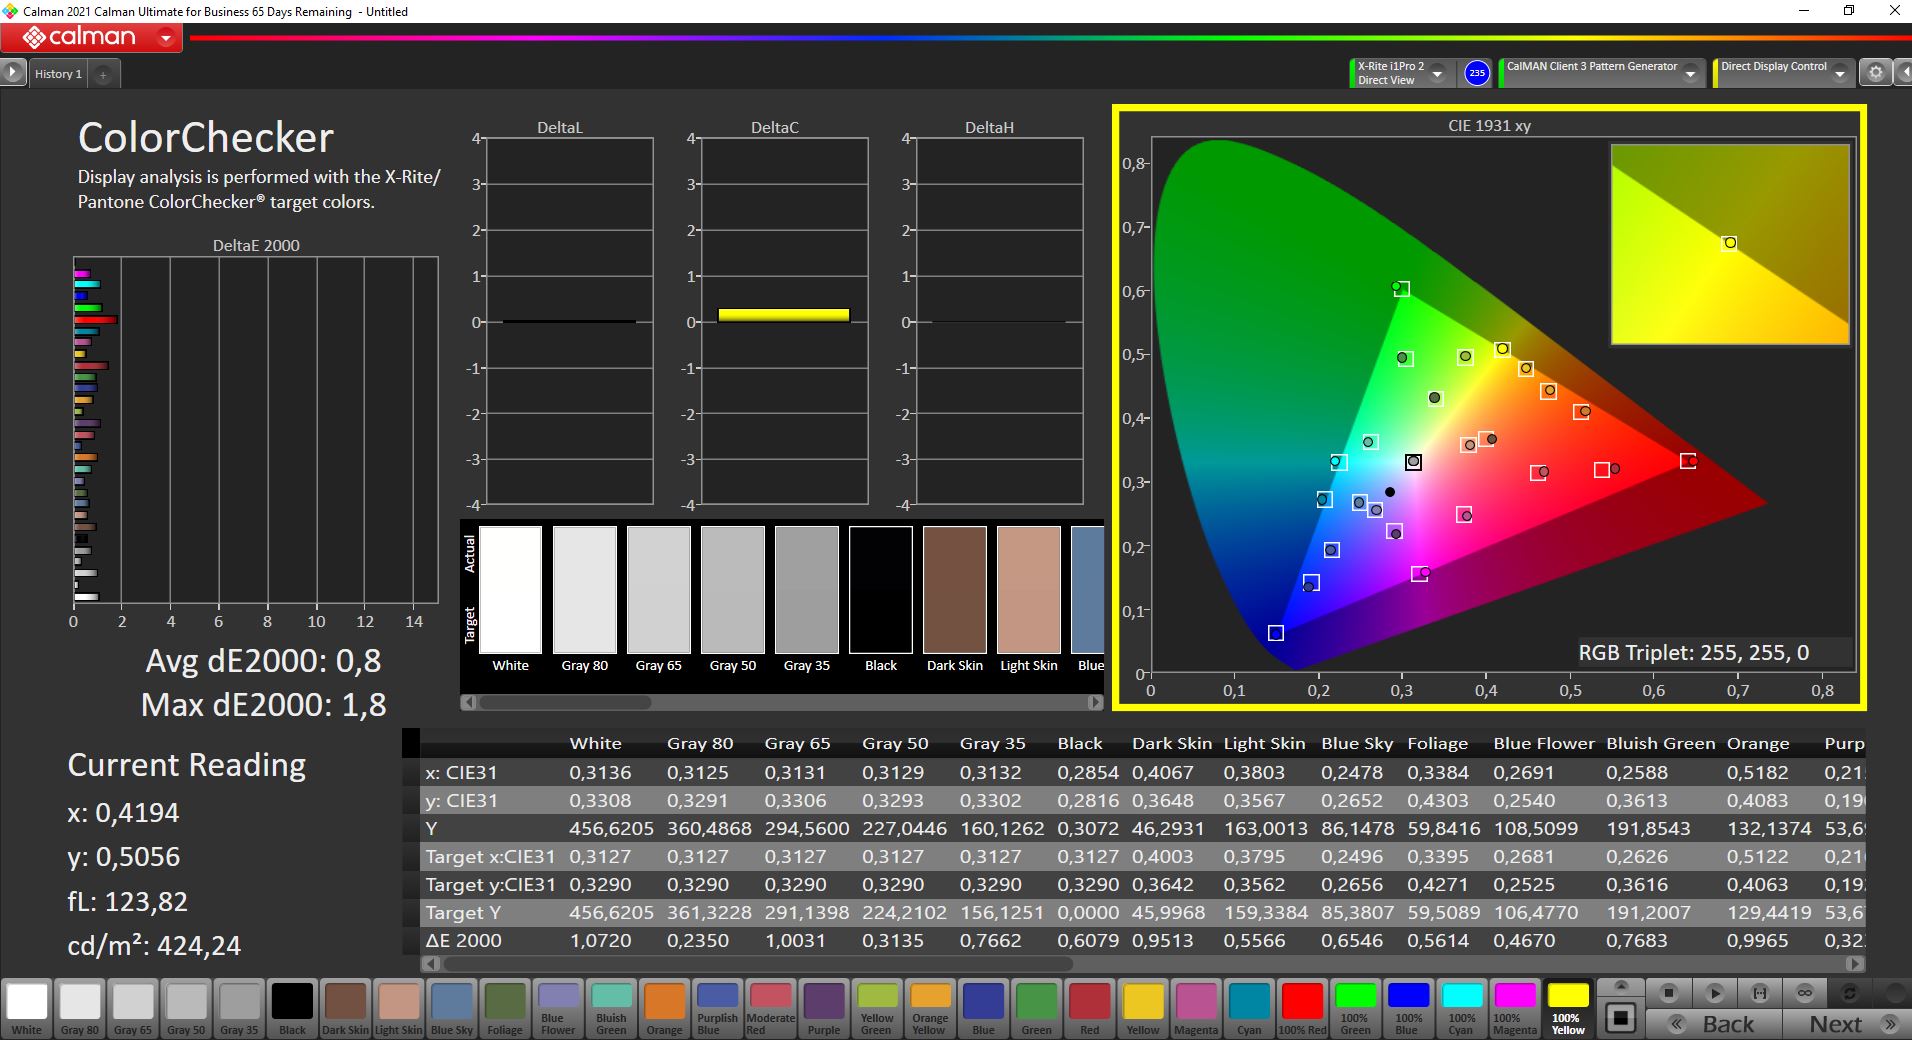
ThinkBook 13x G1的屏幕由13.3英寸的IPS面板组成,分辨率为2,560 x 1,600像素。最大亮度处于较高水平,平均为441 cd/m²,90%的照度也可以被评为良好。然而,竞争对手的后一个数值要好一些。
PWM没有用于亮度控制,这对眼睛敏感的人来说是有利的。
| |||||||||||||||||||||||||
Brightness Distribution: 90 %
Center on Battery: 473 cd/m²
Contrast: 1686:1 (Black: 0.28 cd/m²)
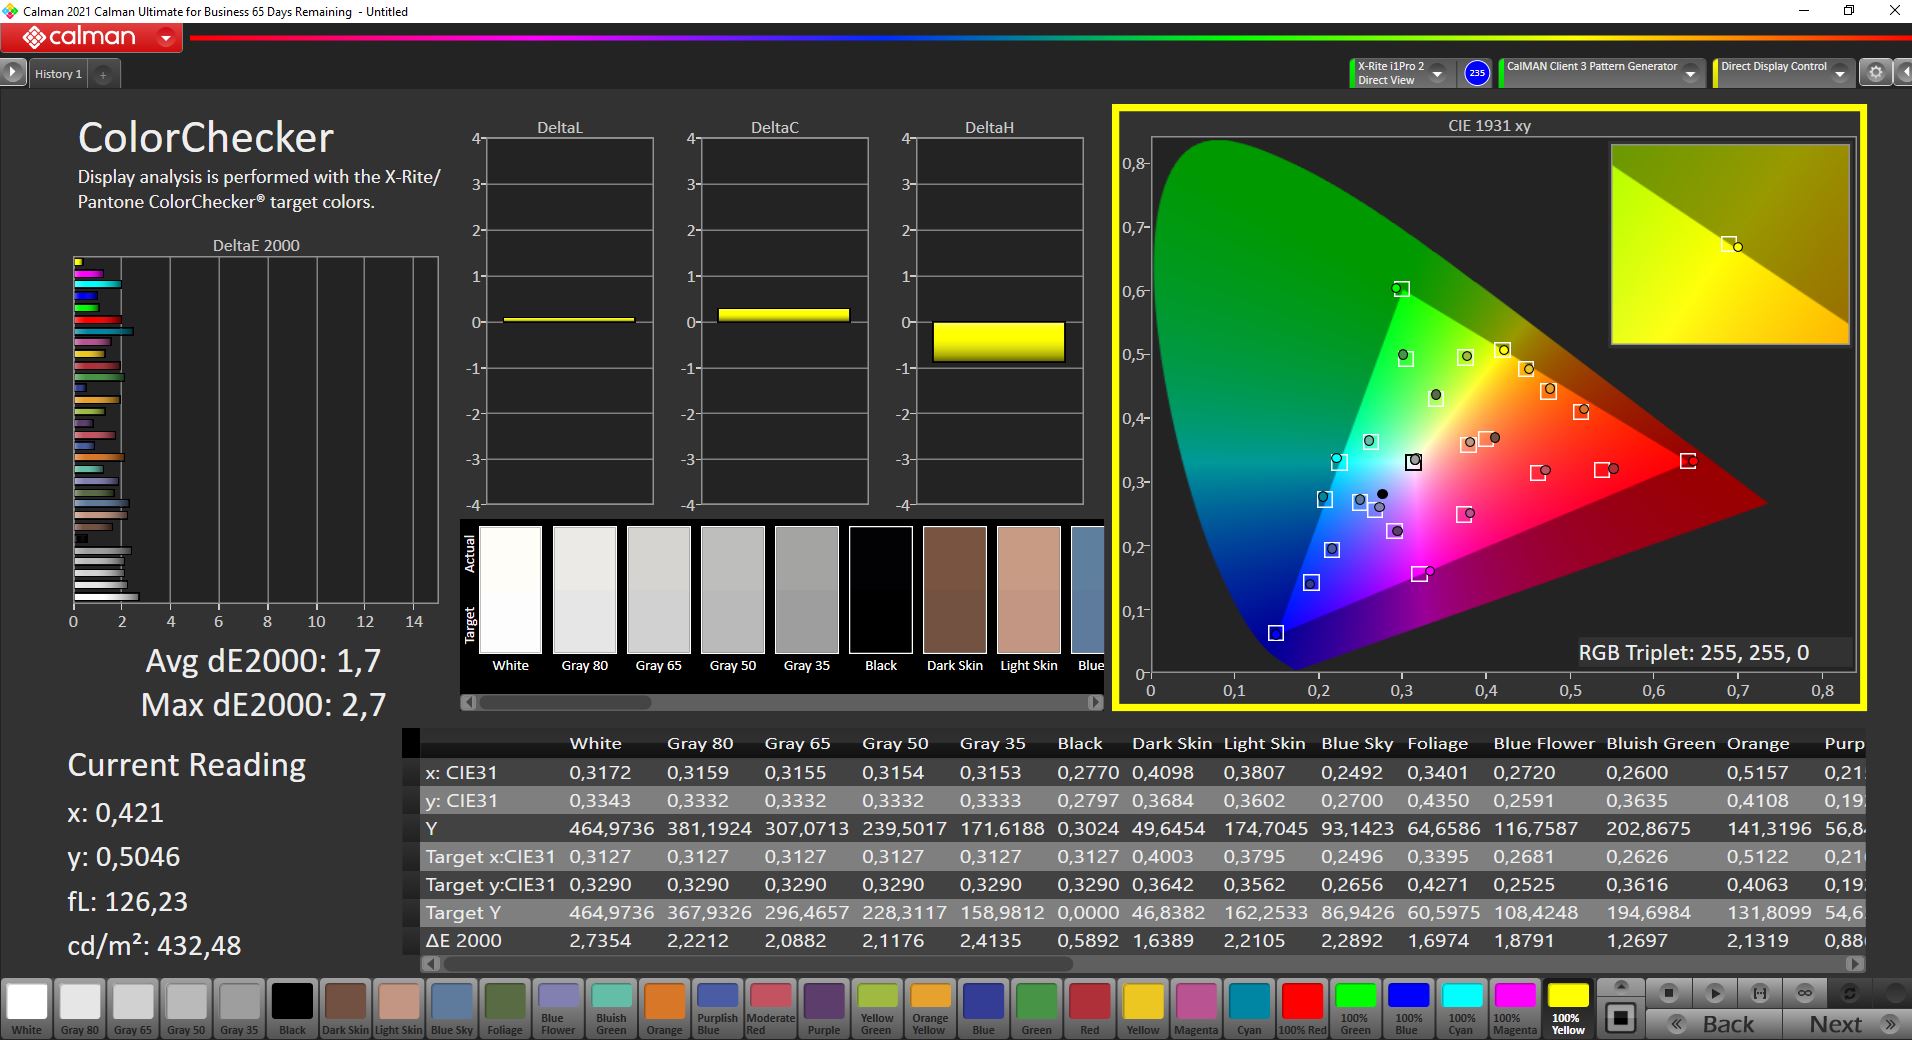
ΔE ColorChecker Calman: 1.7 | ∀{0.5-29.43 Ø4.72}
calibrated: 0.8
ΔE Greyscale Calman: 1.9 | ∀{0.09-98 Ø4.97}
70.8% AdobeRGB 1998 (Argyll 3D)
99.7% sRGB (Argyll 3D)
69% Display P3 (Argyll 3D)
Gamma: 2.12
CCT: 6363 K
| Lenovo ThinkBook 13x G1-20WJ001KGE LP133WQ1-SPH1, IPS, 2560x1600, 13.3" | HP Pavilion Aero 13 be0097nr AU Optronics AUO6496, IPS, 1920x1200, 13.3" | Fujitsu LifeBook U9311X i7 LTE LQ133M1JW48, IPS, 1920x1080, 13.3" | Dell XPS 13 9310 OLED Samsung 134XK01, OLED, 3456x2160, 13.4" | |
|---|---|---|---|---|
| Display | 4% | -2% | 27% | |
| Display P3 Coverage (%) | 69 | 73.4 6% | 67.3 -2% | 99.7 44% |
| sRGB Coverage (%) | 99.7 | 99.8 0% | 98.4 -1% | 100 0% |
| AdobeRGB 1998 Coverage (%) | 70.8 | 74.8 6% | 68.8 -3% | 97.7 38% |
| Response Times | 1% | -29% | 94% | |
| Response Time Grey 50% / Grey 80% * (ms) | 48.4 ? | 42.4 ? 12% | 61.2 ? -26% | 2.2 ? 95% |
| Response Time Black / White * (ms) | 28.8 ? | 31.6 ? -10% | 37.6 ? -31% | 2.2 ? 92% |
| PWM Frequency (Hz) | 211.9 ? | 240.4 ? | ||
| Screen | -37% | -51% | -115% | |
| Brightness middle (cd/m²) | 472 | 473.9 0% | 348 -26% | 384 -19% |
| Brightness (cd/m²) | 441 | 458 4% | 350 -21% | 387 -12% |
| Brightness Distribution (%) | 90 | 91 1% | 92 2% | 97 8% |
| Black Level * (cd/m²) | 0.28 | 0.36 -29% | 0.31 -11% | |
| Contrast (:1) | 1686 | 1316 -22% | 1123 -33% | |
| Colorchecker dE 2000 * | 1.7 | 2.99 -76% | 2.8 -65% | 4.56 -168% |
| Colorchecker dE 2000 max. * | 2.7 | 4.35 -61% | 6.8 -152% | 7.27 -169% |
| Colorchecker dE 2000 calibrated * | 0.8 | 1.1 -38% | 0.8 -0% | 4.52 -465% |
| Greyscale dE 2000 * | 1.9 | 4 -111% | 4.8 -153% | 1.5 21% |
| Gamma | 2.12 104% | 2.35 94% | 2.2 100% | 2.26 97% |
| CCT | 6363 102% | 6269 104% | 6978 93% | 6219 105% |
| Color Space (Percent of AdobeRGB 1998) (%) | 87.1 | |||
| Color Space (Percent of sRGB) (%) | 100 | |||
| Total Average (Program / Settings) | -11% /
-23% | -27% /
-37% | 2% /
-45% |
* ... smaller is better
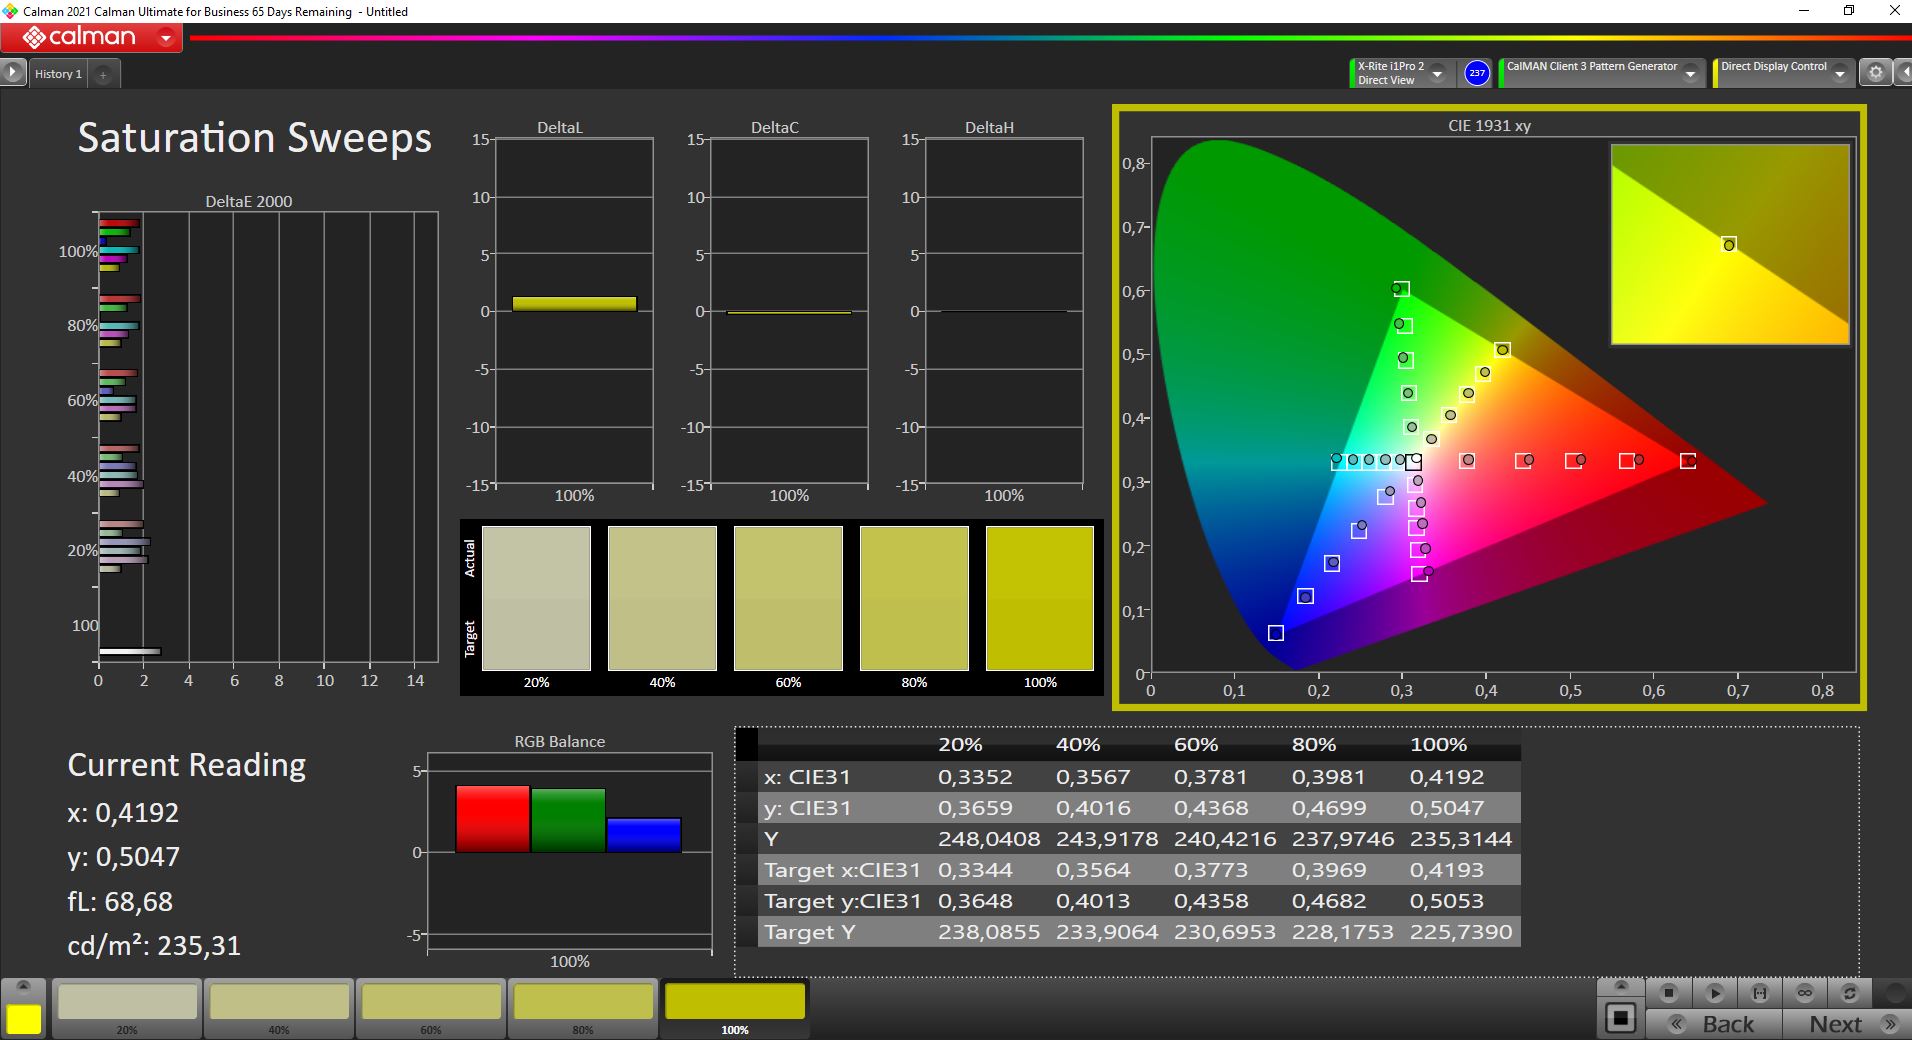
ThinkBook 13x的屏幕对比度为1,686:1,黑值为0.28 cd/m²,显示出清晰的色彩和深邃的黑色。色彩空间覆盖率非常好,有99.7%(sRGB)、70.8%(AdobeRGB)和69%(P3)。
CalMAN分析还显示,颜色的显示已经具有非常低的DeltaE2000偏差,出厂时为1.9。通过校准,这一数值仍可提高到0.8。相应的ICC文件可以在屏幕照度图形旁边的右上方窗口中下载。


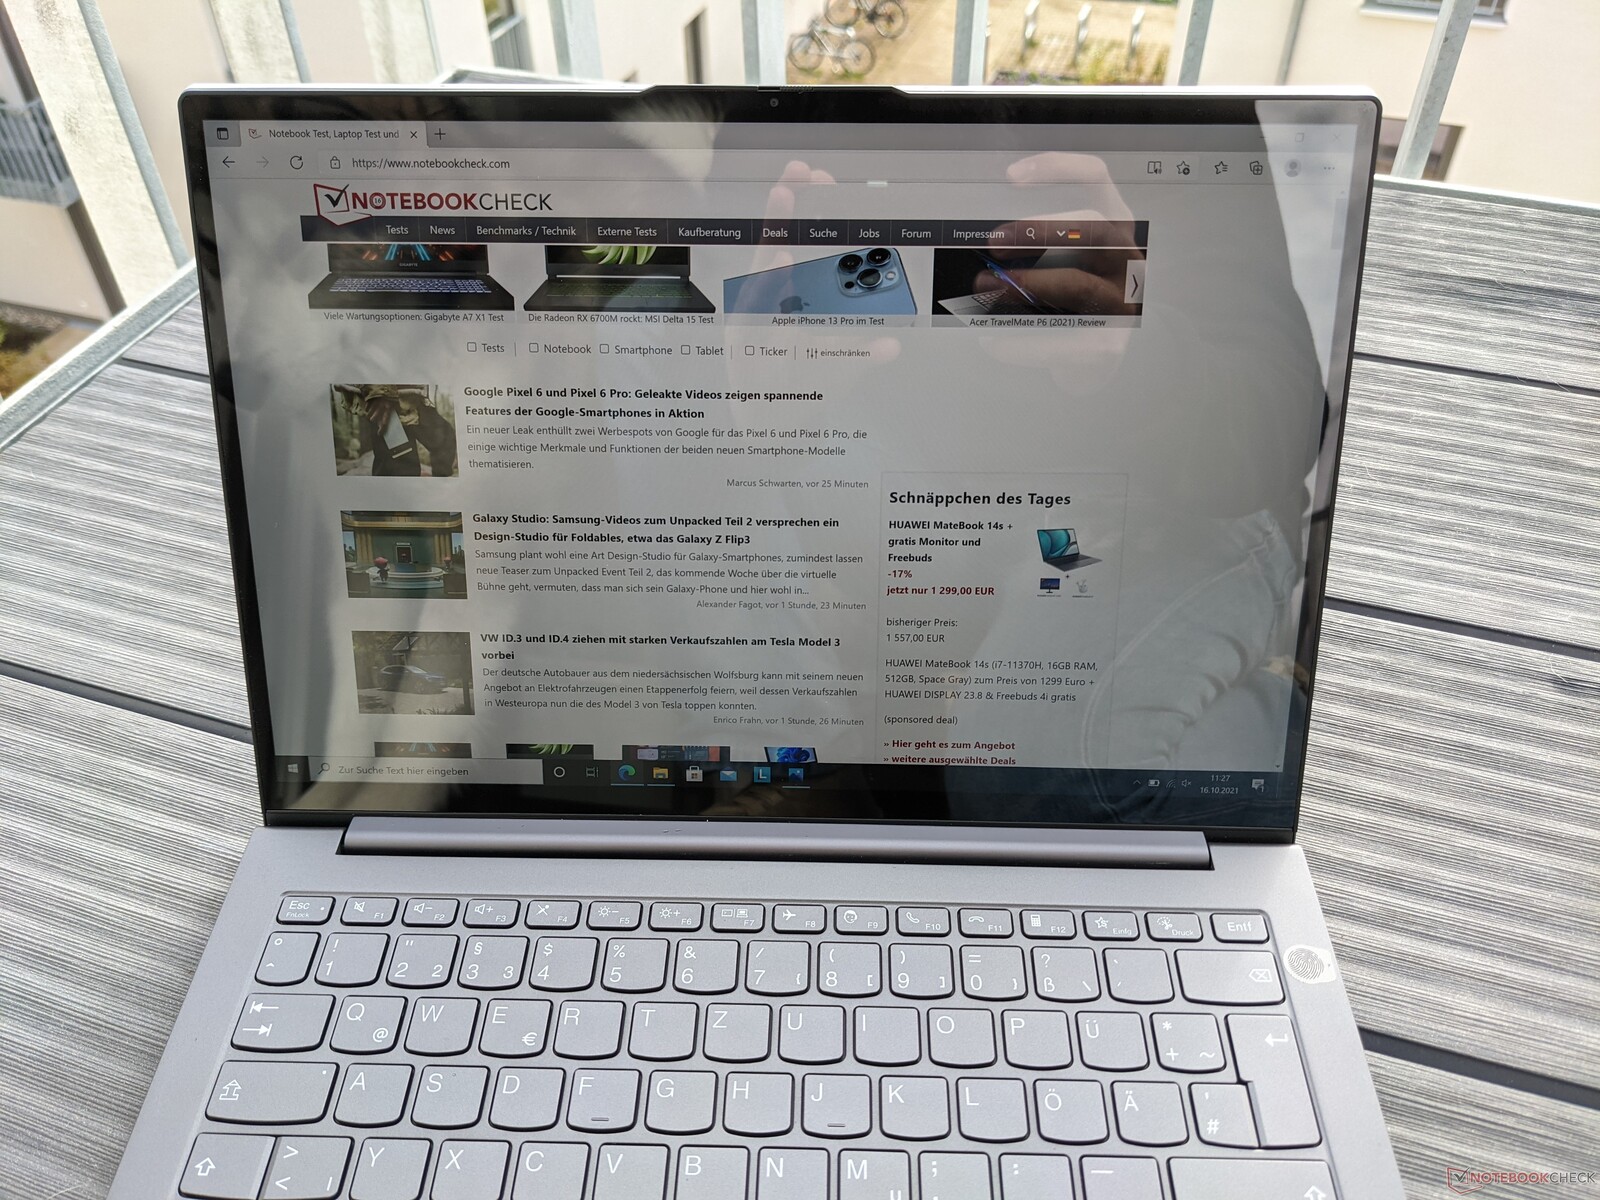
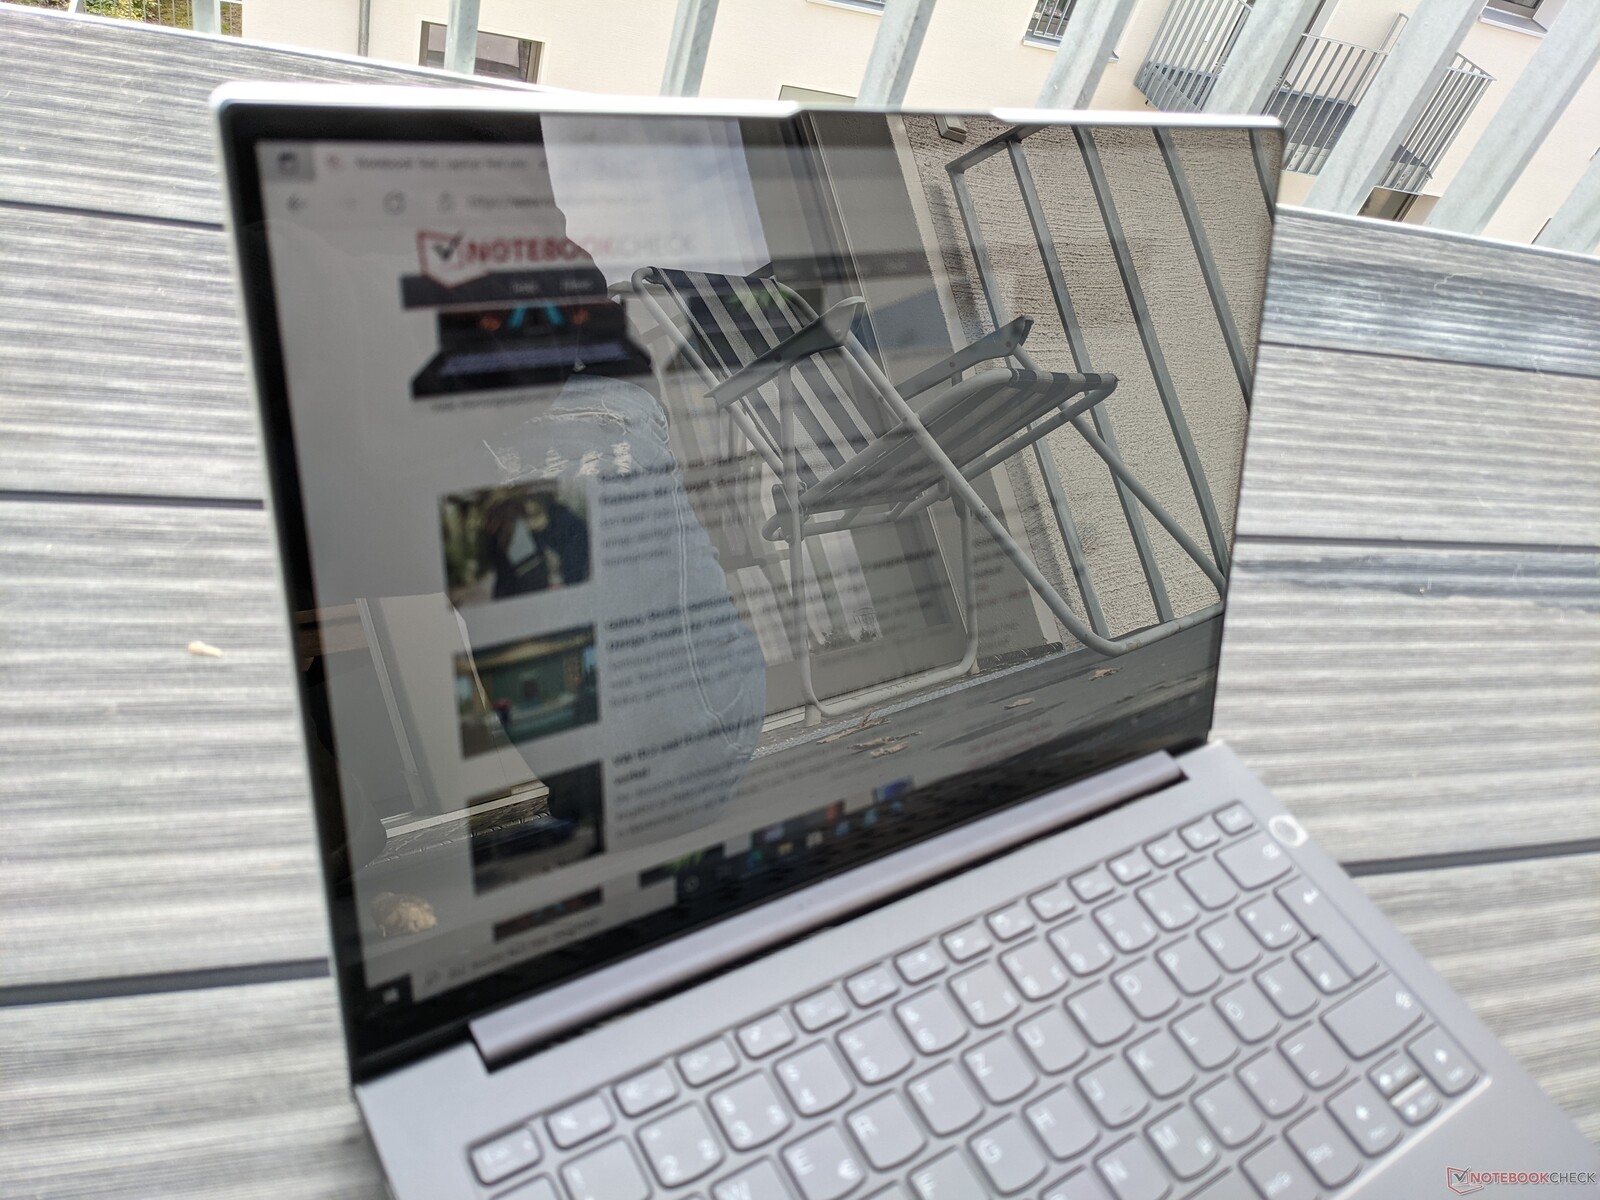
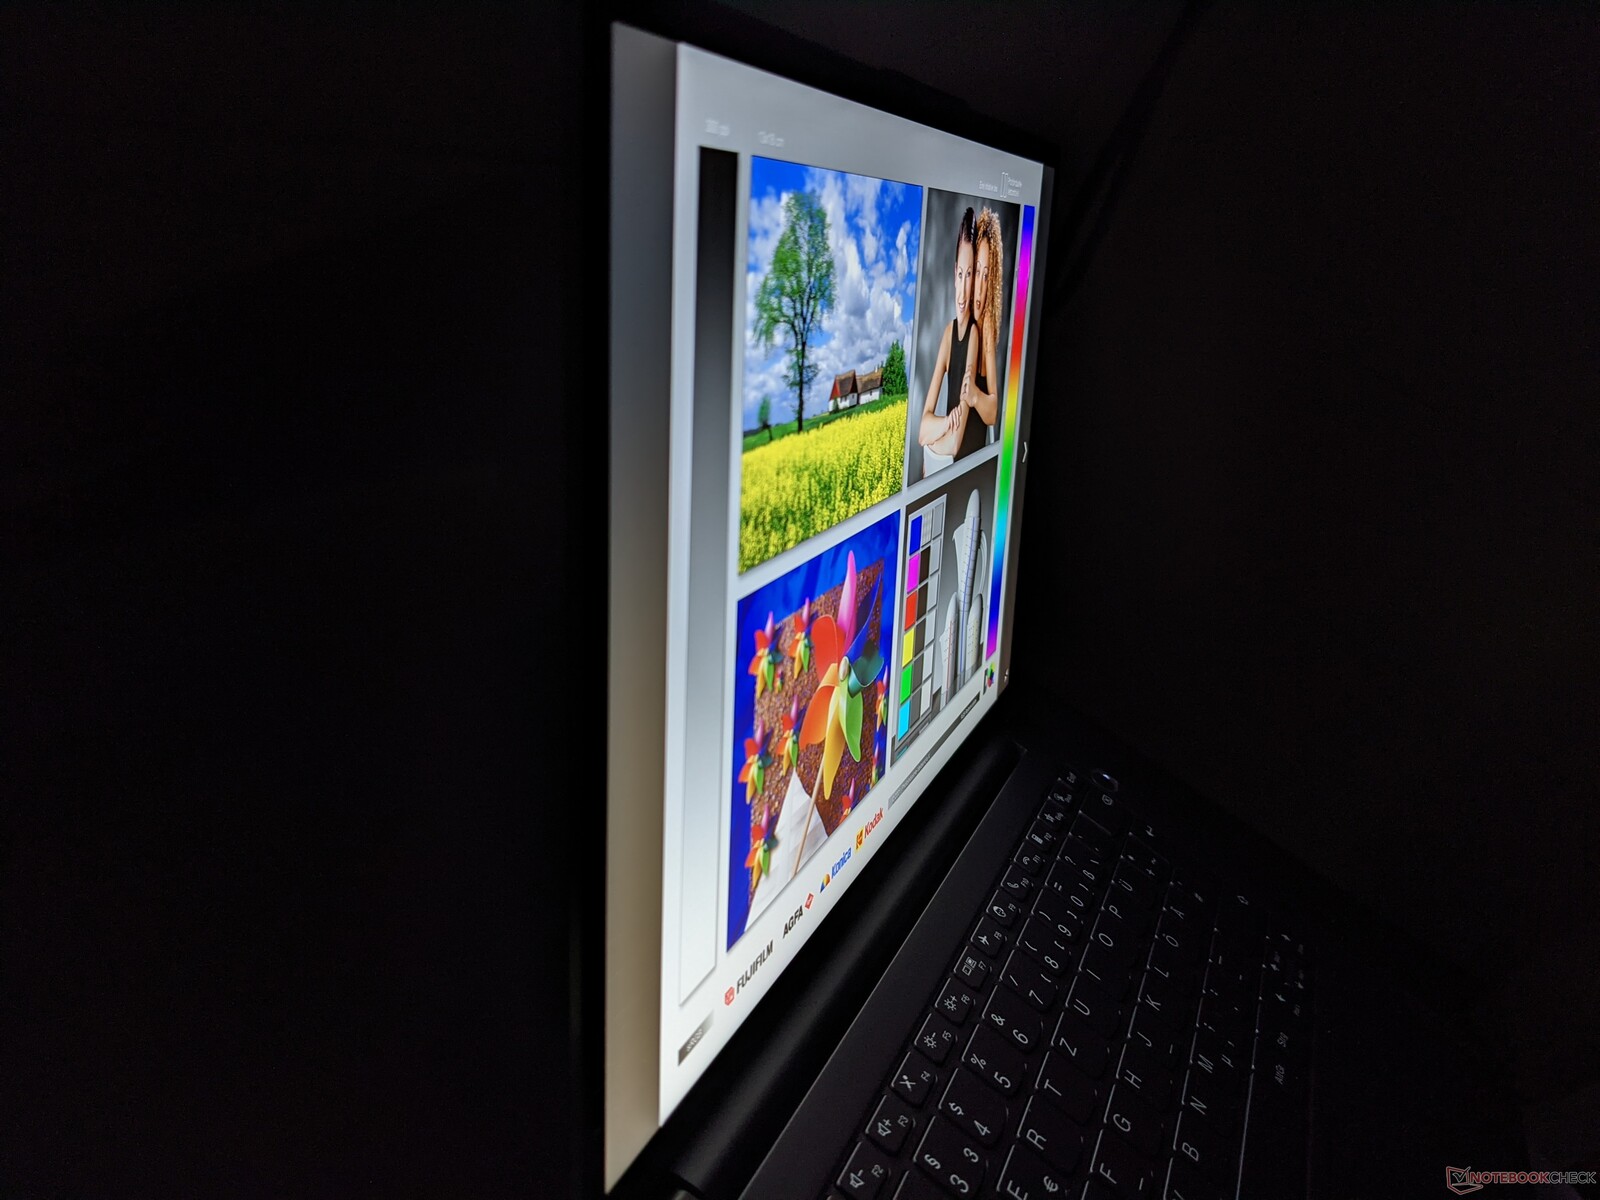
ThinkBook 13x只能在户外有限地使用。光滑的显示屏表面会因反射而导致失真,这在室内也会发生,例如由于不利的人工照明。
Display Response Times
| ↔ Response Time Black to White | ||
|---|---|---|
| 28.8 ms ... rise ↗ and fall ↘ combined | ↗ 14 ms rise | 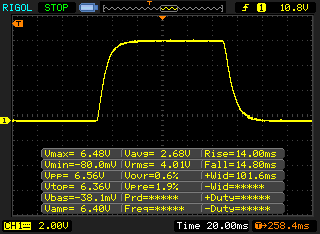 |
| ↘ 14.8 ms fall | ||
| The screen shows relatively slow response rates in our tests and may be too slow for gamers. In comparison, all tested devices range from 0.1 (minimum) to 240 (maximum) ms. » 76 % of all devices are better. This means that the measured response time is worse than the average of all tested devices (19.8 ms). | ||
| ↔ Response Time 50% Grey to 80% Grey | ||
| 48.4 ms ... rise ↗ and fall ↘ combined | ↗ 21.6 ms rise | 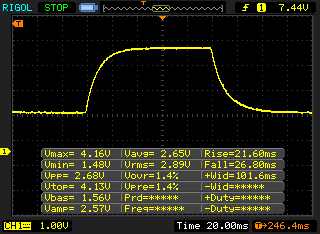 |
| ↘ 26.8 ms fall | ||
| The screen shows slow response rates in our tests and will be unsatisfactory for gamers. In comparison, all tested devices range from 0.165 (minimum) to 636 (maximum) ms. » 84 % of all devices are better. This means that the measured response time is worse than the average of all tested devices (31 ms). | ||
Screen Flickering / PWM (Pulse-Width Modulation)
| Screen flickering / PWM not detected | 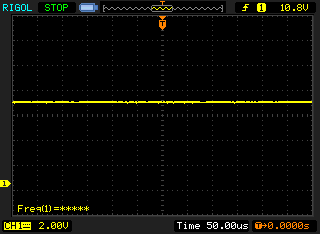 | ||
In comparison: 52 % of all tested devices do not use PWM to dim the display. If PWM was detected, an average of 7763 (minimum: 5 - maximum: 343500) Hz was measured. | |||
ThinkBook 13x的IPS面板的视角非常稳定。几乎可以从任何角度观看图像内容,而不会变形或显示出扭曲的色彩。
性能 - 在繁忙的日常生活中表现良好
联想为ThinkBook 13x G1设计了办公应用的移动工作。根据所选的CPU,这些也可以有更高的要求。大容量存储配置也是可变的。除了 英特尔酷睿i7-1160G7,目前还有一款英特尔酷睿i5-1130G7,而不是像我们的测试配置那样的512GB,联想笔记本电脑还可以使用1TB的固态硬盘。
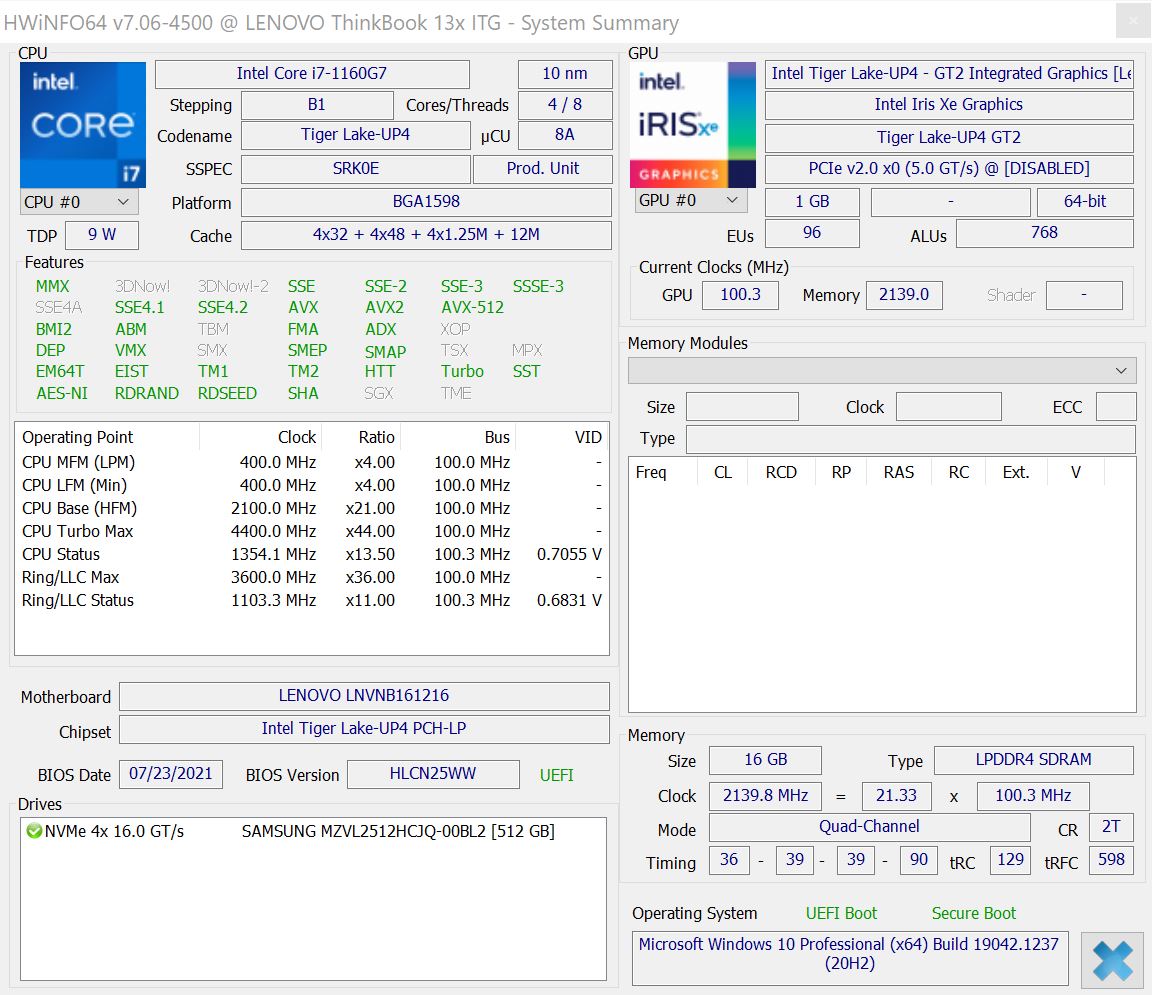
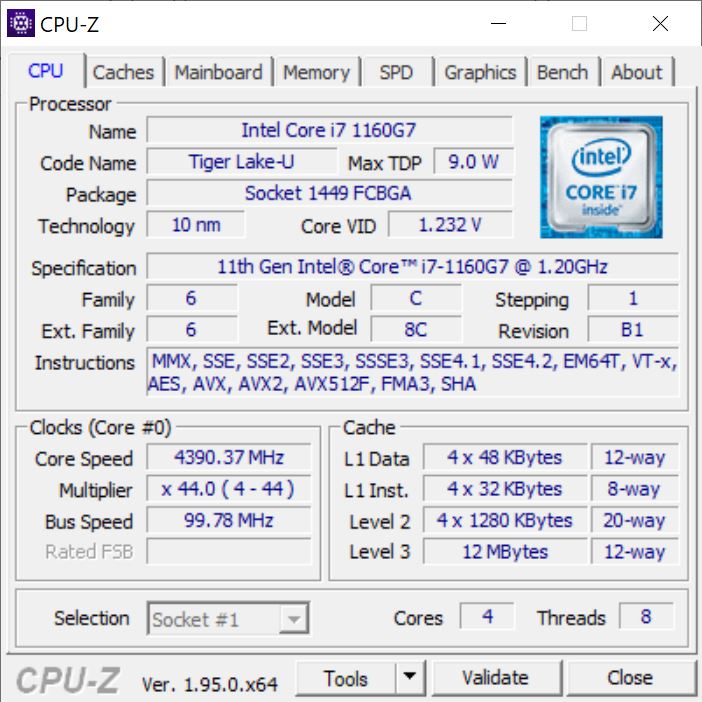
处理器
ǞǞǞ 英特尔酷睿i7-1160G7安装在测试单元中的处理器有四个核心,可以同时处理八个任务。时钟频率在2.1和4.4GHz之间,据此,冷却和设定的TDP也是可用性能的原因。虽然它实际上是一个更高效的Tiger-Lake UP4芯片,但TDP值设置得很慷慨,长期值为20瓦,短期值为40瓦。
在我们的Cinebench R15耐力测试中,i7-1160G7的性能表现为 i7-1160G7的性能达到了 英特尔酷睿i7-1185G7然后下降到一个低15%的值。这一行为也同样适用于 i7-1185G7也是如此。在电池模式下,Cinebench R15多分数从770分下降到378分。
单一基准测试的结果也将ThinkBook 13x置于与英特尔直接竞争的水平上 酷睿i7-1185G7.
Cinebench R15 Multi Endurance test
Cinebench R20: CPU (Multi Core) | CPU (Single Core)
Cinebench R15: CPU Multi 64Bit | CPU Single 64Bit
Blender: v2.79 BMW27 CPU
7-Zip 18.03: 7z b 4 | 7z b 4 -mmt1
Geekbench 5.5: Multi-Core | Single-Core
HWBOT x265 Benchmark v2.2: 4k Preset
LibreOffice : 20 Documents To PDF
R Benchmark 2.5: Overall mean
| Cinebench R23 / Multi Core | |
| Average of class Subnotebook (1555 - 21812, n=60, last 2 years) | |
| HP Pavilion Aero 13 be0097nr | |
| Dell XPS 13 9310 OLED | |
| Lenovo ThinkBook 13x G1-20WJ001KGE | |
| Average Intel Core i7-1160G7 (3008 - 5648, n=4) | |
| Fujitsu LifeBook U9311X i7 LTE | |
| Cinebench R23 / Single Core | |
| Average of class Subnotebook (358 - 2213, n=61, last 2 years) | |
| Dell XPS 13 9310 OLED | |
| HP Pavilion Aero 13 be0097nr | |
| Lenovo ThinkBook 13x G1-20WJ001KGE | |
| Fujitsu LifeBook U9311X i7 LTE | |
| Average Intel Core i7-1160G7 (1079 - 1351, n=3) | |
| Cinebench R20 / CPU (Multi Core) | |
| Average of class Subnotebook (579 - 8541, n=57, last 2 years) | |
| HP Pavilion Aero 13 be0097nr | |
| Dell XPS 13 9310 OLED | |
| Average Intel Core i7-1160G7 (1224 - 2068, n=4) | |
| Lenovo ThinkBook 13x G1-20WJ001KGE | |
| Fujitsu LifeBook U9311X i7 LTE | |
| Cinebench R20 / CPU (Single Core) | |
| Average of class Subnotebook (128 - 832, n=57, last 2 years) | |
| Dell XPS 13 9310 OLED | |
| HP Pavilion Aero 13 be0097nr | |
| Lenovo ThinkBook 13x G1-20WJ001KGE | |
| Average Intel Core i7-1160G7 (484 - 544, n=4) | |
| Fujitsu LifeBook U9311X i7 LTE | |
| Cinebench R15 / CPU Multi 64Bit | |
| Average of class Subnotebook (327 - 3345, n=57, last 2 years) | |
| HP Pavilion Aero 13 be0097nr | |
| Fujitsu LifeBook U9311X i7 LTE | |
| Average Intel Core i7-1160G7 (753 - 864, n=4) | |
| Lenovo ThinkBook 13x G1-20WJ001KGE | |
| Dell XPS 13 9310 OLED | |
| Cinebench R15 / CPU Single 64Bit | |
| Average of class Subnotebook (72.4 - 322, n=57, last 2 years) | |
| HP Pavilion Aero 13 be0097nr | |
| Dell XPS 13 9310 OLED | |
| Fujitsu LifeBook U9311X i7 LTE | |
| Lenovo ThinkBook 13x G1-20WJ001KGE | |
| Average Intel Core i7-1160G7 (170 - 208, n=4) | |
| Blender / v2.79 BMW27 CPU | |
| Lenovo ThinkBook 13x G1-20WJ001KGE | |
| Average Intel Core i7-1160G7 (625 - 1115, n=4) | |
| Fujitsu LifeBook U9311X i7 LTE | |
| Dell XPS 13 9310 OLED | |
| Average of class Subnotebook (159 - 2271, n=58, last 2 years) | |
| HP Pavilion Aero 13 be0097nr | |
| 7-Zip 18.03 / 7z b 4 | |
| Average of class Subnotebook (11668 - 77867, n=57, last 2 years) | |
| HP Pavilion Aero 13 be0097nr | |
| Fujitsu LifeBook U9311X i7 LTE | |
| Dell XPS 13 9310 OLED | |
| Average Intel Core i7-1160G7 (15740 - 22305, n=4) | |
| Lenovo ThinkBook 13x G1-20WJ001KGE | |
| 7-Zip 18.03 / 7z b 4 -mmt1 | |
| Average of class Subnotebook (2643 - 6699, n=59, last 2 years) | |
| HP Pavilion Aero 13 be0097nr | |
| Fujitsu LifeBook U9311X i7 LTE | |
| Average Intel Core i7-1160G7 (4448 - 4621, n=3) | |
| Lenovo ThinkBook 13x G1-20WJ001KGE | |
| Dell XPS 13 9310 OLED | |
| Geekbench 5.5 / Multi-Core | |
| Average of class Subnotebook (2557 - 17218, n=48, last 2 years) | |
| Dell XPS 13 9310 OLED | |
| Lenovo ThinkBook 13x G1-20WJ001KGE | |
| Fujitsu LifeBook U9311X i7 LTE | |
| Average Intel Core i7-1160G7 (4660 - 5258, n=4) | |
| Geekbench 5.5 / Single-Core | |
| Average of class Subnotebook (726 - 2224, n=48, last 2 years) | |
| Dell XPS 13 9310 OLED | |
| Lenovo ThinkBook 13x G1-20WJ001KGE | |
| Fujitsu LifeBook U9311X i7 LTE | |
| Average Intel Core i7-1160G7 (1406 - 1484, n=4) | |
| HWBOT x265 Benchmark v2.2 / 4k Preset | |
| Average of class Subnotebook (0.97 - 25.1, n=57, last 2 years) | |
| HP Pavilion Aero 13 be0097nr | |
| Dell XPS 13 9310 OLED | |
| Fujitsu LifeBook U9311X i7 LTE | |
| Average Intel Core i7-1160G7 (3.75 - 6.06, n=4) | |
| Lenovo ThinkBook 13x G1-20WJ001KGE | |
| LibreOffice / 20 Documents To PDF | |
| Average of class Subnotebook (39.9 - 220, n=56, last 2 years) | |
| Lenovo ThinkBook 13x G1-20WJ001KGE | |
| Average Intel Core i7-1160G7 (49.8 - 61.3, n=4) | |
| HP Pavilion Aero 13 be0097nr | |
| Fujitsu LifeBook U9311X i7 LTE | |
| Dell XPS 13 9310 OLED | |
| R Benchmark 2.5 / Overall mean | |
| Average Intel Core i7-1160G7 (0.64 - 0.76, n=4) | |
| Lenovo ThinkBook 13x G1-20WJ001KGE | |
| Fujitsu LifeBook U9311X i7 LTE | |
| Dell XPS 13 9310 OLED | |
| HP Pavilion Aero 13 be0097nr | |
| Average of class Subnotebook (0.4024 - 1.456, n=58, last 2 years) | |
* ... smaller is better
系统性能
在评估系统性能的PCMark 10测试中,联想ThinkBook 13x G1相对于英特尔酷睿i1160G7取得了不错的成绩。 英特尔酷睿i7-1160G7一个略高于平均水平的结果,但在我们的测试领域只能确保最后的位置。
在日常使用中,该系统始终运行顺畅,没有表现出任何微颤动或类似情况。访问文件和启动程序也可以在任何时候没有延迟。
| PCMark 10 / Score | |
| Average of class Subnotebook (4920 - 9939, n=44, last 2 years) | |
| HP Pavilion Aero 13 be0097nr | |
| Dell XPS 13 9310 OLED | |
| Fujitsu LifeBook U9311X i7 LTE | |
| Lenovo ThinkBook 13x G1-20WJ001KGE | |
| Average Intel Core i7-1160G7, Intel Iris Xe Graphics G7 96EUs (4554 - 4813, n=4) | |
| PCMark 10 / Essentials | |
| Dell XPS 13 9310 OLED | |
| Average of class Subnotebook (8552 - 11646, n=44, last 2 years) | |
| HP Pavilion Aero 13 be0097nr | |
| Fujitsu LifeBook U9311X i7 LTE | |
| Lenovo ThinkBook 13x G1-20WJ001KGE | |
| Average Intel Core i7-1160G7, Intel Iris Xe Graphics G7 96EUs (9482 - 10372, n=4) | |
| PCMark 10 / Productivity | |
| Average of class Subnotebook (5435 - 16606, n=44, last 2 years) | |
| HP Pavilion Aero 13 be0097nr | |
| Dell XPS 13 9310 OLED | |
| Fujitsu LifeBook U9311X i7 LTE | |
| Lenovo ThinkBook 13x G1-20WJ001KGE | |
| Average Intel Core i7-1160G7, Intel Iris Xe Graphics G7 96EUs (6155 - 6602, n=4) | |
| PCMark 10 / Digital Content Creation | |
| Average of class Subnotebook (5722 - 13779, n=44, last 2 years) | |
| HP Pavilion Aero 13 be0097nr | |
| Dell XPS 13 9310 OLED | |
| Fujitsu LifeBook U9311X i7 LTE | |
| Lenovo ThinkBook 13x G1-20WJ001KGE | |
| Average Intel Core i7-1160G7, Intel Iris Xe Graphics G7 96EUs (3744 - 4748, n=4) | |
| PCMark 10 Score | 4813 points | |
Help | ||
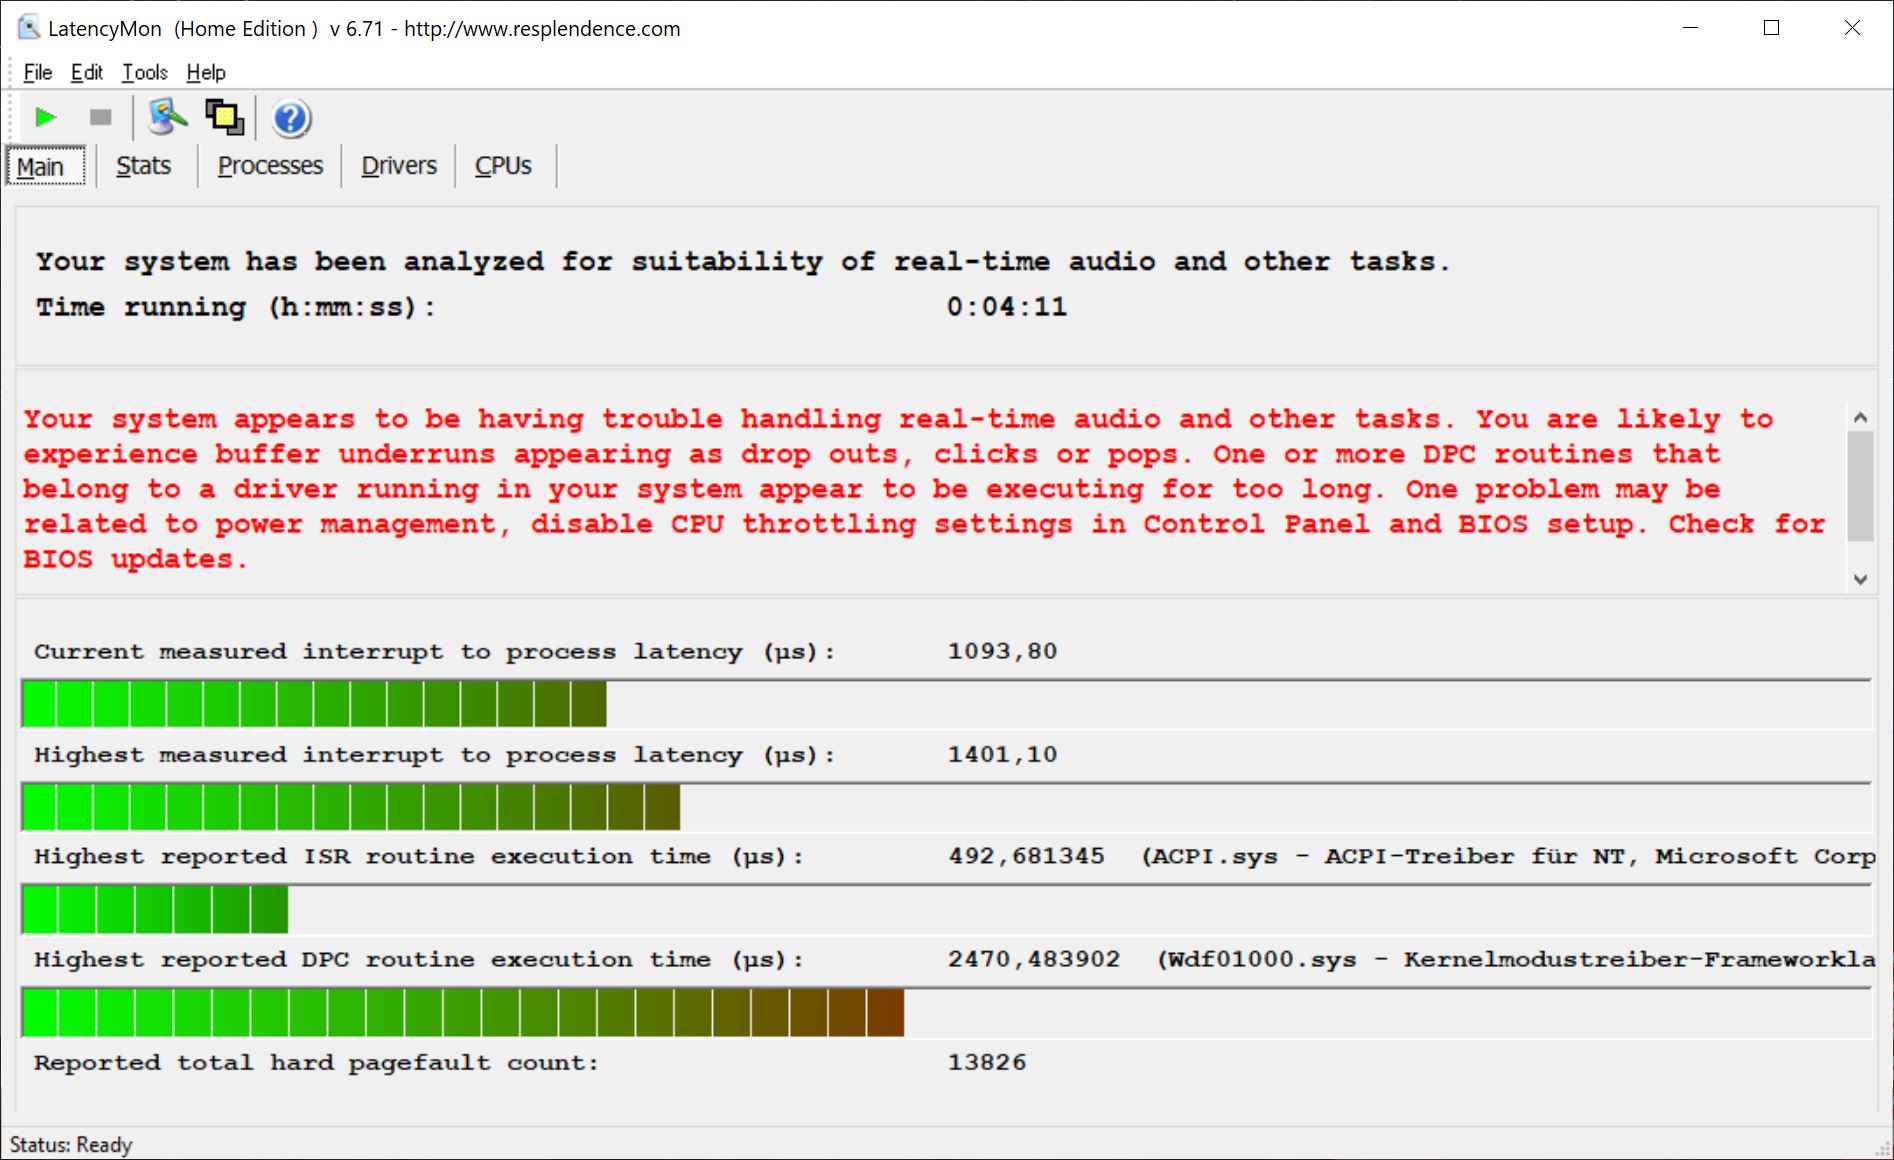
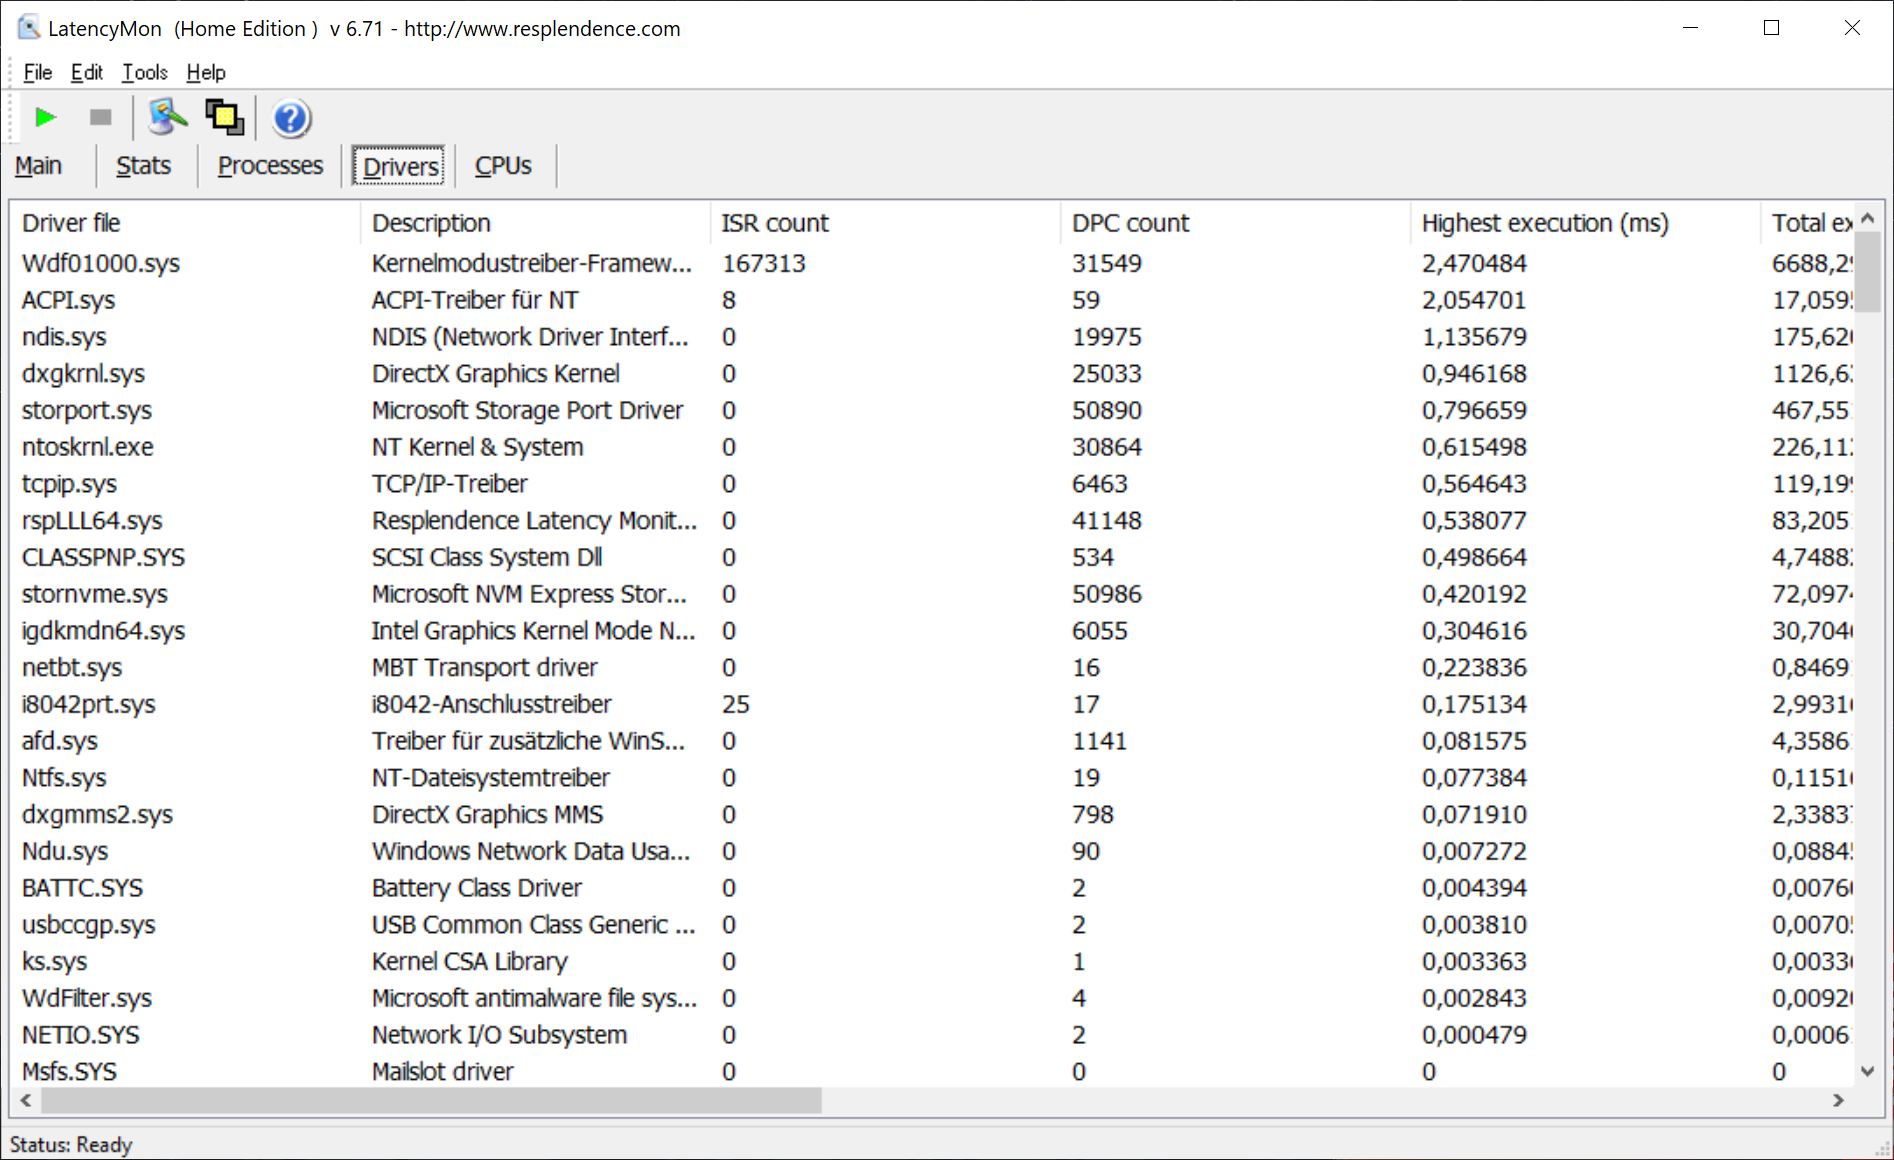
DPC延迟
在使用LatencyMon的测试中,ThinkBook 13x G1显示中断时间增加。因此,在我们的测试配置中,它不适合于实时应用。
| DPC Latencies / LatencyMon - interrupt to process latency (max), Web, Youtube, Prime95 | |
| Lenovo ThinkBook 13x G1-20WJ001KGE | |
| Dell XPS 13 9310 OLED | |
| HP Pavilion Aero 13 be0097nr | |
| Fujitsu LifeBook U9311X i7 LTE | |
* ... smaller is better
大容量存储
联想在ThinkBook 13x的测试机型中安装了一块三星的512GB固态硬盘,它已经支持快速的PCIe 4.0标准。它实现了良好的读写速率,但比其他采用这种大容量存储的笔记本要慢一些。与我们的测试领域相比,该速率处于中等水平。
与其他大容量存储设备的比较结果如何,可以在我们的 硬盘/SSD基准列表.
| Lenovo ThinkBook 13x G1-20WJ001KGE Samsung PM9A1 MZVL2512HCJQ | HP Pavilion Aero 13 be0097nr Intel SSD 660p SSDPEKNW512G8 | Fujitsu LifeBook U9311X i7 LTE Toshiba XG6 KXG6AZNV1T02 | Dell XPS 13 9310 OLED Toshiba XG6 KXG60ZNV512G | Average Samsung PM9A1 MZVL2512HCJQ | |
|---|---|---|---|---|---|
| CrystalDiskMark 5.2 / 6 | -14% | 5% | 0% | 68% | |
| Write 4K (MB/s) | 149.9 | 128.3 -14% | 114.8 -23% | 156.8 5% | 179.1 ? 19% |
| Read 4K (MB/s) | 78.7 | 50.9 -35% | 49.53 -37% | 39.66 -50% | 75.6 ? -4% |
| Write Seq (MB/s) | 2661 | 971 -64% | 1833 -31% | 854 -68% | 3016 ? 13% |
| Read Seq (MB/s) | 1249 | 1540 23% | 2260 81% | 2167 73% | 3350 ? 168% |
| Write 4K Q32T1 (MB/s) | 320.7 | 538 68% | 323.5 1% | 441.1 38% | 459 ? 43% |
| Read 4K Q32T1 (MB/s) | 408.6 | 344.4 -16% | 340.5 -17% | 395.5 -3% | 554 ? 36% |
| Write Seq Q32T1 (MB/s) | 3955 | 980 -75% | 3048 -23% | 858 -78% | 4346 ? 10% |
| Read Seq Q32T1 (MB/s) | 1770 | 1829 3% | 3282 85% | 3258 84% | 6346 ? 259% |
| AS SSD | -103% | -37% | -36% | 16% | |
| Seq Read (MB/s) | 4332 | 1616 -63% | 2622 -39% | 2694 -38% | 4656 ? 7% |
| Seq Write (MB/s) | 1558 | 761 -51% | 1322 -15% | 1407 -10% | 2742 ? 76% |
| 4K Read (MB/s) | 73.5 | 46.87 -36% | 48.36 -34% | 54.4 -26% | 67 ? -9% |
| 4K Write (MB/s) | 193.3 | 126.6 -35% | 121.1 -37% | 195.8 1% | 173.8 ? -10% |
| 4K-64 Read (MB/s) | 959 | 324.6 -66% | 765 -20% | 1092 14% | 1514 ? 58% |
| 4K-64 Write (MB/s) | 1604 | 815 -49% | 1343 -16% | 1269 -21% | 2355 ? 47% |
| Access Time Read * (ms) | 0.034 | 0.074 -118% | 0.074 -118% | 0.064 -88% | 0.04867 ? -43% |
| Access Time Write * (ms) | 0.021 | 0.135 -543% | 0.033 -57% | 0.062 -195% | 0.03605 ? -72% |
| Score Read (Points) | 1466 | 533 -64% | 1076 -27% | 1416 -3% | 2047 ? 40% |
| Score Write (Points) | 1953 | 1018 -48% | 1596 -18% | 1606 -18% | 2778 ? 42% |
| Score Total (Points) | 4050 | 1798 -56% | 3169 -22% | 3692 -9% | 5812 ? 44% |
| Total Average (Program / Settings) | -59% /
-65% | -16% /
-19% | -18% /
-21% | 42% /
38% |
* ... smaller is better

Continuous load read: DiskSpd Read Loop, Queue Depth 8
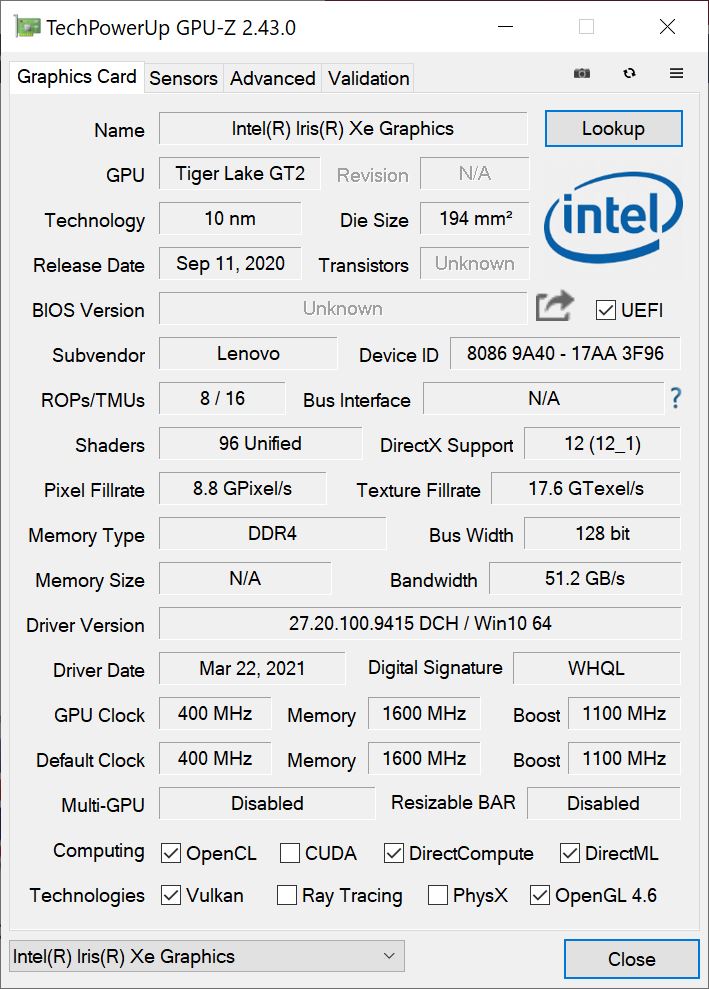
图形卡
对于图像内容的显示,内部图形单元 Intel Iris Xe Graphics G7 96EUs负责。它适用于对图形性能有低到中等要求的应用,例如,简单的照片编辑。它还得益于工作存储器的双通道配置,因为它在这里使用。
在3DMark测试中,ThinkBook 13x取得了平均成绩,可以在我们的测试领域处于中间位置。由于UP4处理器的iGPU时钟速度稍慢,普通UP3 CPU的图形单元(如 酷睿i7-1165G7或 i7-1185G7)的速度稍快一些。在电池供电时,Fire Strike 图形得分保持不变。
在我们的GPU基准列表中,我们已经列出了与此相比,其他图形单元可以预期的情况。
| 3DMark 11 Performance | 6391 points | |
| 3DMark Cloud Gate Standard Score | 15841 points | |
| 3DMark Fire Strike Score | 4370 points | |
| 3DMark Time Spy Score | 1602 points | |
Help | ||
游戏性能
联想ThinkBook 13x G1只适用于对图形性能要求不高的游戏或较老的游戏。即使在这里,为了获得流畅的游戏体验,可能仍然需要降低细节水平和分辨率。我们对TheWitcher 3 的耐力测试表明,ThinkBook 13x可以在较长时间内保持其图形性能不下降。
在其他游戏中可以预期的性能,可以在我们的GPU游戏列表中看到。
| The Witcher 3 - 1366x768 Medium Graphics & Postprocessing | |
| Average of class Subnotebook (71 - 115, n=8, last 2 years) | |
| Dell XPS 13 9310 OLED | |
| Fujitsu LifeBook U9311X i7 LTE | |
| Average Intel Iris Xe Graphics G7 96EUs (21.4 - 77.8, n=185) | |
| Lenovo ThinkBook 13x G1-20WJ001KGE | |
Witcher 3 FPS-Diagram
| low | med. | high | ultra | |
|---|---|---|---|---|
| GTA V (2015) | 85 | 78.7 | 27.7 | 10.6 |
| The Witcher 3 (2015) | 82.1 | 53.5 | 30.4 | 12.8 |
| Dota 2 Reborn (2015) | 82.5 | 73.8 | 53.5 | 49.1 |
| Final Fantasy XV Benchmark (2018) | 42 | 20.7 | 20.2 | |
| X-Plane 11.11 (2018) | 37.9 | 30.5 | 28.5 | |
| Strange Brigade (2018) | 76.5 | 35.6 | 28.2 | 22.8 |
排放 - 办公模式下无声
噪声排放
在负载情况下,ThinkBook 13x的风扇会发出高达34 dB(A)的可闻噪音。这是很均匀的,可以很好地淡化。笔记本在办公和浏览器模式下基本无声。
我们无法确定任何其他背景噪音,如线圈的啸叫或类似的声音。
Noise level
| Idle |
| 24.3 / 24.3 / 24.3 dB(A) |
| Load |
| 33.9 / 33.9 dB(A) |
 | ||
30 dB silent 40 dB(A) audible 50 dB(A) loud |
||
min: | ||
温度
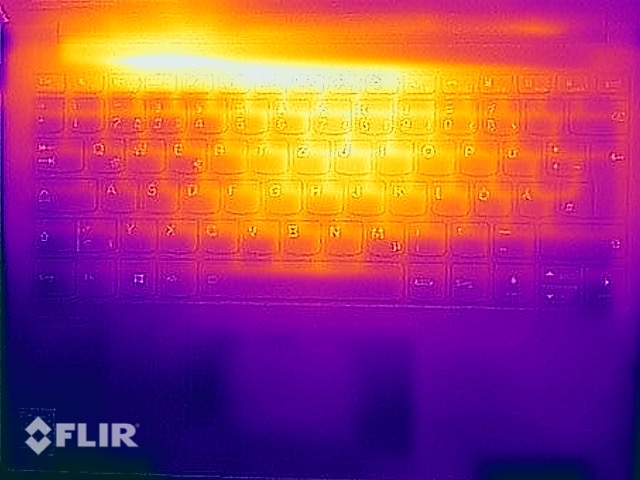
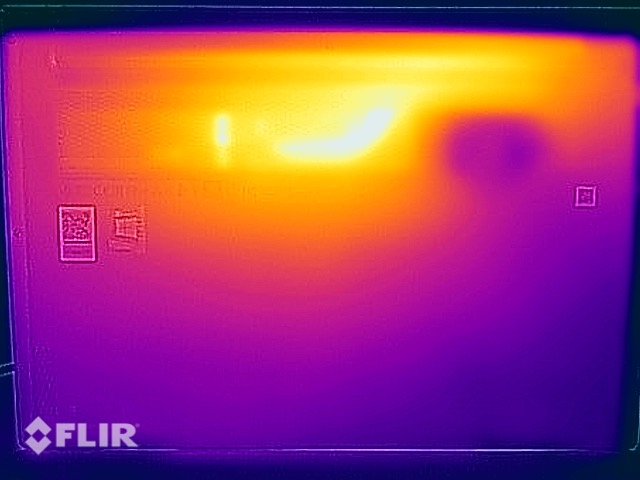
在我们的压力测试场景中,联想笔记本的表面加热到了47.5℃(~117.5°F)。在日常使用中,温度明显降低,这意味着ThinkBook 13x可以在任何时候顺利使用。
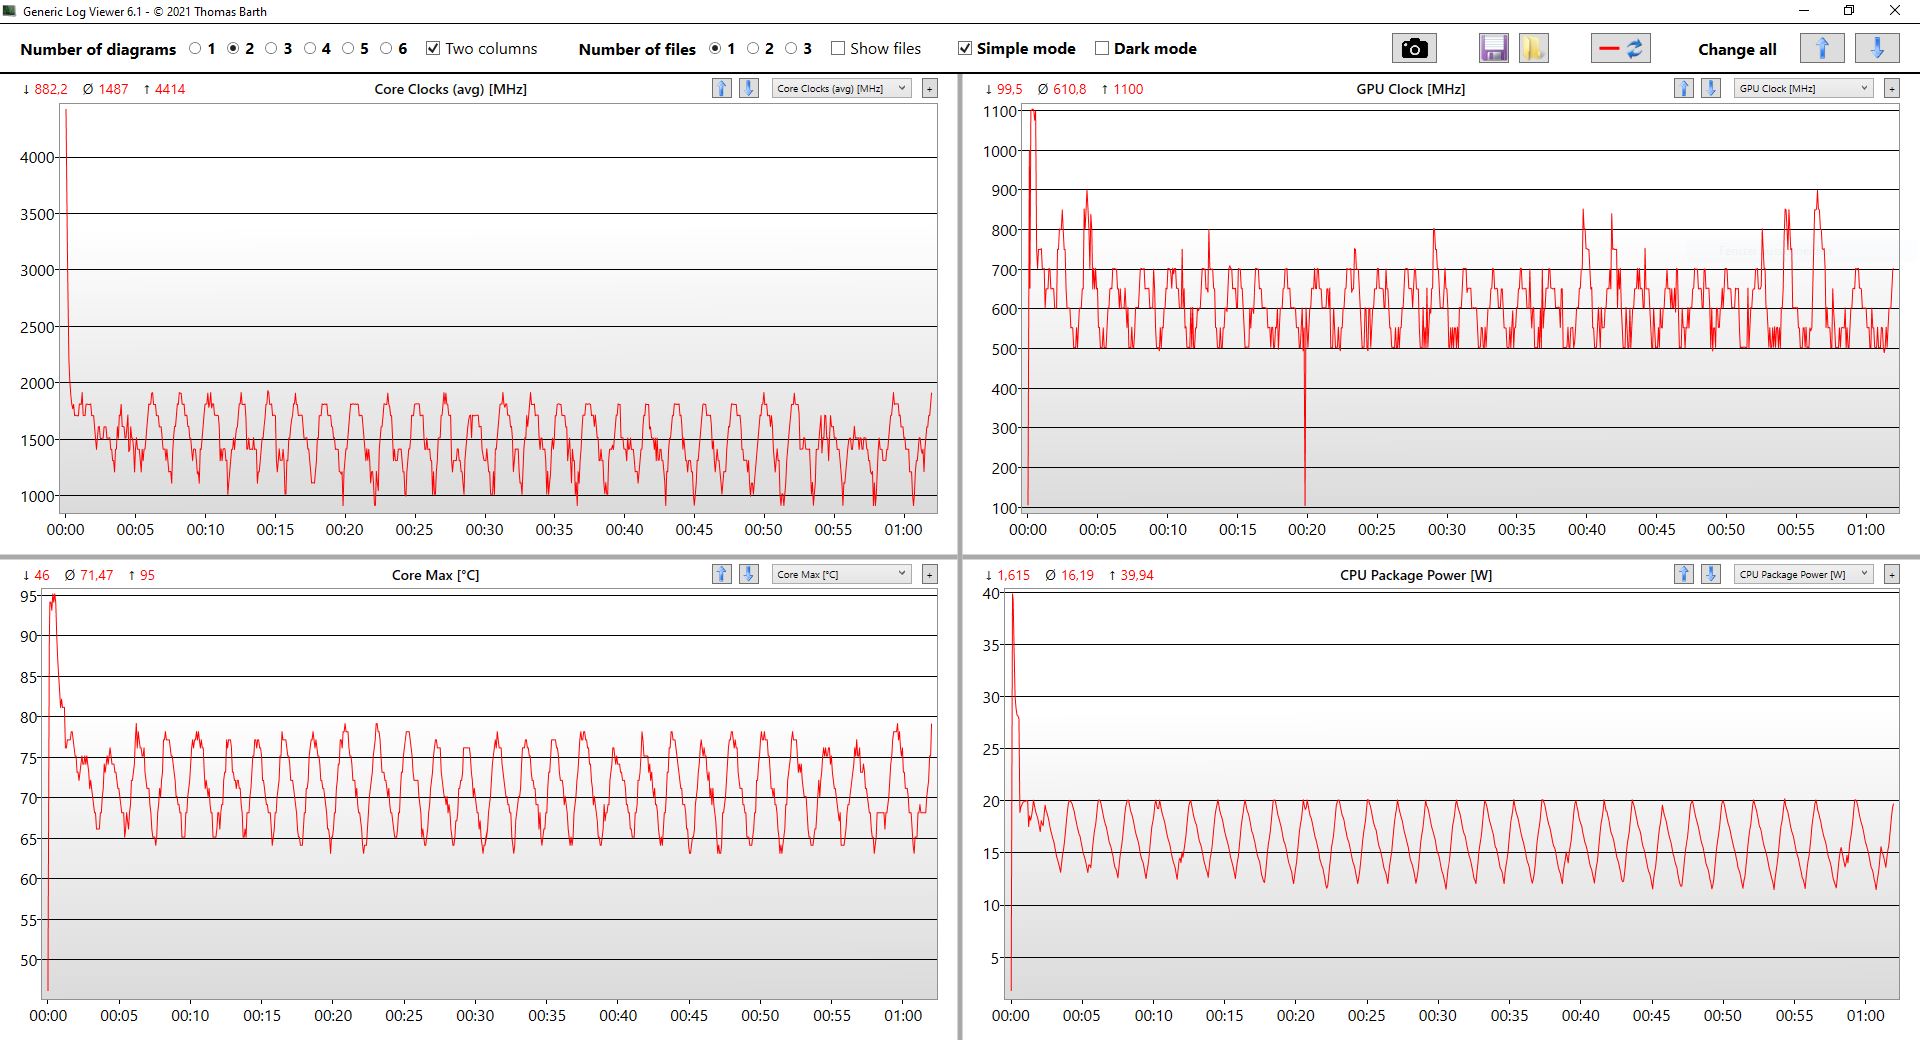
在我们的长期压力测试中,联想笔记本内部的温度上升到95℃(203°F)。时钟频率经常低于1.2 GHz的基本时钟,然而,冷却系统总是能够在交替的频率下反复临时增加。在测试期间,系统仍然可以运行。由于这样的负载在日常使用中不应该出现,所以没有因为温度过高而受到限制。
(±) The maximum temperature on the upper side is 43.2 °C / 110 F, compared to the average of 35.9 °C / 97 F, ranging from 21.4 to 59 °C for the class Subnotebook.
(-) The bottom heats up to a maximum of 47.5 °C / 118 F, compared to the average of 39.2 °C / 103 F
(+) In idle usage, the average temperature for the upper side is 26.2 °C / 79 F, compared to the device average of 30.8 °C / 87 F.
(±) Playing The Witcher 3, the average temperature for the upper side is 33.2 °C / 92 F, compared to the device average of 30.8 °C / 87 F.
(+) The palmrests and touchpad are cooler than skin temperature with a maximum of 26.8 °C / 80.2 F and are therefore cool to the touch.
(±) The average temperature of the palmrest area of similar devices was 28.2 °C / 82.8 F (+1.4 °C / 2.6 F).
演讲者
ThinkBook 13x的扬声器提供了良好的音量和相对宽广的声谱。因此,它们适用于在安静的环境中播放媒体内容。
Lenovo ThinkBook 13x G1-20WJ001KGE audio analysis
(±) | speaker loudness is average but good (81.7 dB)
Bass 100 - 315 Hz
(±) | reduced bass - on average 14.1% lower than median
(±) | linearity of bass is average (9.7% delta to prev. frequency)
Mids 400 - 2000 Hz
(+) | balanced mids - only 2.7% away from median
(+) | mids are linear (4.2% delta to prev. frequency)
Highs 2 - 16 kHz
(+) | balanced highs - only 1.8% away from median
(+) | highs are linear (4.6% delta to prev. frequency)
Overall 100 - 16.000 Hz
(+) | overall sound is linear (11% difference to median)
Compared to same class
» 10% of all tested devices in this class were better, 3% similar, 87% worse
» The best had a delta of 5%, average was 18%, worst was 53%
Compared to all devices tested
» 6% of all tested devices were better, 2% similar, 92% worse
» The best had a delta of 4%, average was 24%, worst was 134%
HP Pavilion Aero 13 be0097nr audio analysis
(±) | speaker loudness is average but good (76.5 dB)
Bass 100 - 315 Hz
(-) | nearly no bass - on average 20.3% lower than median
(±) | linearity of bass is average (13.1% delta to prev. frequency)
Mids 400 - 2000 Hz
(±) | higher mids - on average 5.2% higher than median
(+) | mids are linear (4.2% delta to prev. frequency)
Highs 2 - 16 kHz
(+) | balanced highs - only 3.6% away from median
(±) | linearity of highs is average (9.7% delta to prev. frequency)
Overall 100 - 16.000 Hz
(±) | linearity of overall sound is average (19.4% difference to median)
Compared to same class
» 60% of all tested devices in this class were better, 7% similar, 33% worse
» The best had a delta of 5%, average was 18%, worst was 53%
Compared to all devices tested
» 48% of all tested devices were better, 7% similar, 45% worse
» The best had a delta of 4%, average was 24%, worst was 134%
电源管理 - 长时间运行和快速充电能力
能源消耗
在我们的空闲情况下,联想的笔记本显示平均功耗为6.6瓦,因此是一款与竞争对手相当的经济型笔记本。在负载情况下,功耗会短暂上升到43.8瓦,但会稳定在平均33.3瓦的水平。因此,ThinkBook 13x是我们测试领域中最节俭的笔记本。
附带的电源有65瓦的输出,因此足够高了。
| Off / Standby | |
| Idle | |
| Load |
|
Key:
min: | |
| Lenovo ThinkBook 13x G1-20WJ001KGE i7-1160G7, Iris Xe G7 96EUs, Samsung PM9A1 MZVL2512HCJQ, IPS, 2560x1600, 13.3" | HP Pavilion Aero 13 be0097nr R7 5800U, Vega 8, Intel SSD 660p SSDPEKNW512G8, IPS, 1920x1200, 13.3" | Fujitsu LifeBook U9311X i7 LTE i7-1185G7, Iris Xe G7 96EUs, Toshiba XG6 KXG6AZNV1T02, IPS, 1920x1080, 13.3" | Dell XPS 13 9310 OLED i7-1185G7, Iris Xe G7 96EUs, Toshiba XG6 KXG60ZNV512G, OLED, 3456x2160, 13.4" | Average Intel Iris Xe Graphics G7 96EUs | Average of class Subnotebook | |
|---|---|---|---|---|---|---|
| Power Consumption | -9% | -8% | -32% | -47% | -20% | |
| Idle Minimum * (Watt) | 3.3 | 3.4 -3% | 3.5 -6% | 5.7 -73% | 5.51 ? -67% | 3.86 ? -17% |
| Idle Average * (Watt) | 6.6 | 6.9 -5% | 6.1 8% | 6 9% | 8.66 ? -31% | 6.61 ? -0% |
| Idle Maximum * (Watt) | 7.5 | 8 -7% | 7.2 4% | 12.3 -64% | 10.9 ? -45% | 8 ? -7% |
| Load Average * (Watt) | 33.3 | 42.6 -28% | 39.9 -20% | 44.4 -33% | 45.6 ? -37% | 42.2 ? -27% |
| Witcher 3 ultra * (Watt) | 30.6 | 35.2 -15% | 34.1 -11% | 36.5 -19% | ||
| Load Maximum * (Watt) | 43.8 | 43.1 2% | 54.9 -25% | 47.8 -9% | 67.8 ? -55% | 64.5 ? -47% |
* ... smaller is better
Energy consumption Witcher 3 / Stress test
电池寿命
在我们的实际WLAN电池测试中,联想ThinkBook 13x G1的运行时间达到了9小时19分钟。这意味着在我们的测试领域,它比其他竞争者持续的时间更长,但13x G1的电池也是对比设备中最大的56Wh。
由于具有快速充电功能,在使用65瓦的电源适配器的情况下,大约一小时后,电池就能再次充电80%。
| Lenovo ThinkBook 13x G1-20WJ001KGE i7-1160G7, Iris Xe G7 96EUs, 56 Wh | HP Pavilion Aero 13 be0097nr R7 5800U, Vega 8, 43 Wh | Fujitsu LifeBook U9311X i7 LTE i7-1185G7, Iris Xe G7 96EUs, 50 Wh | Dell XPS 13 9310 OLED i7-1185G7, Iris Xe G7 96EUs, 52 Wh | Average of class Subnotebook | |
|---|---|---|---|---|---|
| Battery runtime | |||||
| WiFi v1.3 (h) | 9.3 | 9 -3% | 8.2 -12% | 6.5 -30% | 14 ? 51% |
Pros
Cons
结论 - 联想的ThinkBook 13x是移动的,并提供良好的性能


联想ThinkBook 13x G1是一款小型的移动工作设备,看起来非常高质量。尽管光亮的显示屏不必要地阻碍了户外工作,但其制造质量和内部工作原理并不逊于第一印象。然而,由于亮度和色彩还原度都很高,这种情况可以根据使用情况来克服。
只要光面显示屏不是问题,联想ThinkBook 13x G1可以很好地处理日常移动工作。
性能在这个价格区间的竞争者范围内,因此没有理由提出批评。海量存储仍然可以被替换,这也是一个优点,因为在这种超薄设备中有时不再有这种情况。因此,结合体面的输入设备,联想ThinkBook 13x G1是一个吸引人的、坚实的工作设备。
ThinkBook 13x G1的一个不错的替代品是 戴尔XPS 13 9310,它的价格稍高,但有更好的显示屏。如果你非常重视CPU的性能,你也应该考虑仔细研究一下 惠普Pavilion Aero 13.
价格和可用性
除了我们从Campuspoint借来的东西外,联想ThinkBook 13x G1,例如,在Cyberport有售。.
Lenovo ThinkBook 13x G1-20WJ001KGE
- 10/19/2021 v7 (old)
Mike Wobker
Price comparison

