


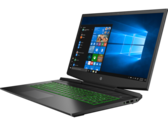
惠普光影精灵笔记本电脑评测:一台安静的游戏本
光影精灵系列并不是惠普最好的笔记本电脑的所在地,而光影精灵17是迄今为止我们从HP那里看到的更好的游戏笔记本电脑之一。 考虑到其价格范围,该系统非常安静,甚至时尚。
Intel Core i7-9750H, NVIDIA GeForce GTX 1660 Ti Max-Q, 17.3", 2.8 kg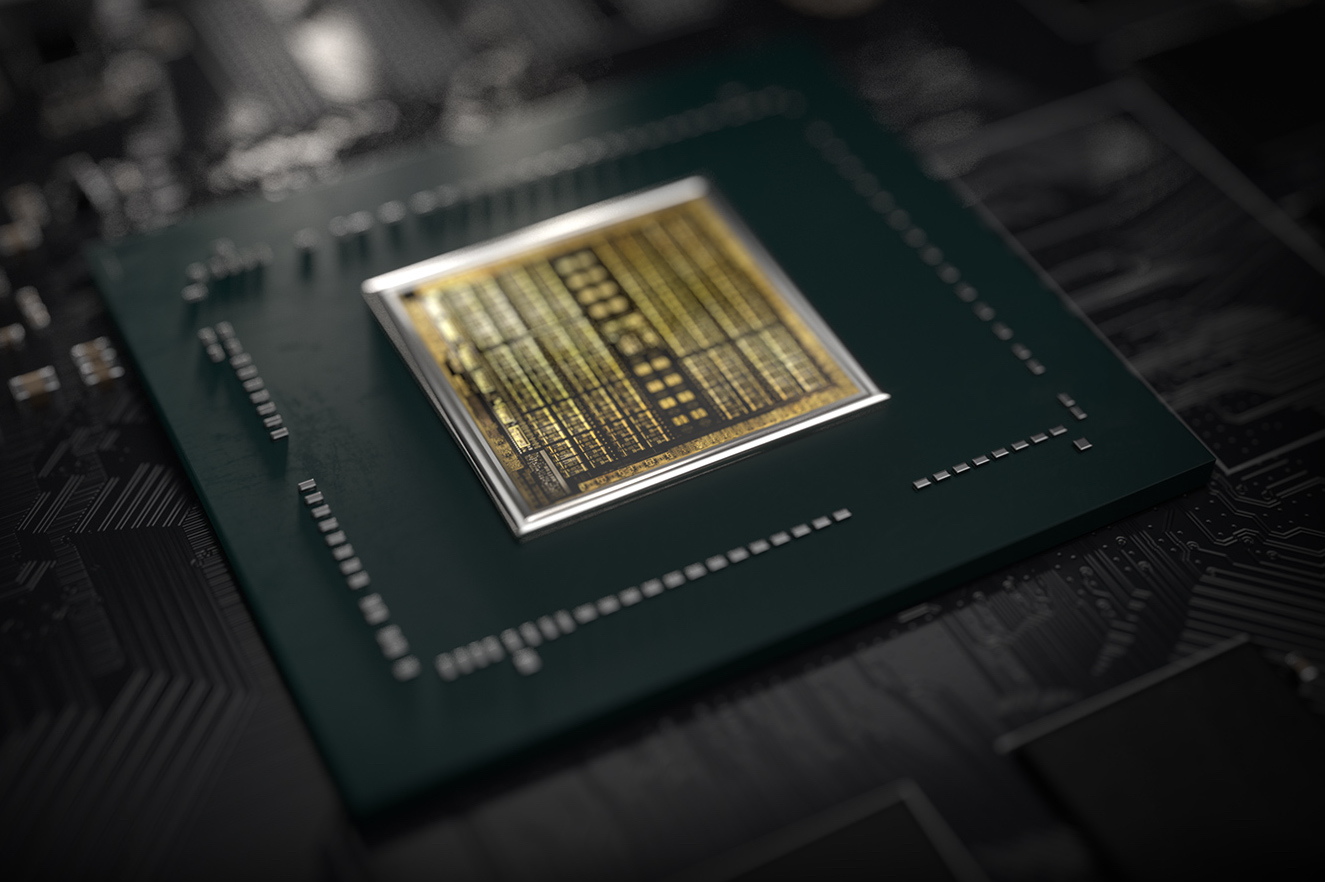
采用Max-Q设计的Nvidia GeForce GTX 1660 Ti是基于Turing架构(TU116芯片)的笔记本电脑移动图形卡。它专为轻薄型笔记本电脑而设计,比笔记本电脑的常规GTX 1660 Ti慢约10-15%(取决于散热能力)。根据规格,Max-Q型号的基频慢22%,睿频慢16%。
与更快的RTX 2000 GPU(例如RTX 2060)相比,1660Ti没有集成光线追踪或Tensor内核。性能与旧GTX 1070(Max-Q)相似,但降低的TGP为60瓦(笔记本电脑版本为80,台式机版本为115瓦)。
Turing一代不仅为RTX卡引入了光追,而且还优化了内核和缓存的体系结构。根据Nvidia的说法,CUDA内核现在可以同时执行浮点和整数运算,以提高现代游戏中计算繁重的工作负载的性能。此外,也对缓存进行了重新设计(新的统一内存体系结构的缓存是Pascal的两倍)。与Pascal相比,这使得每个时钟指令增加高达50%,能耗提高40%。
Nvidia规定功耗为60瓦TGP(总图形功率),因此比笔记本电脑的正常版(Max-P)1660Ti低20瓦。因此,Max-Q型号非常适合轻薄型游戏笔记本电脑。 TU116芯片采用台积电12nm FFN制成。
GeForce GTX 1600 Series
| ||||||||||||||||||||||||||||||||||
| Codename | N18E-G0 | |||||||||||||||||||||||||||||||||
| Architecture | Turing | |||||||||||||||||||||||||||||||||
| Pipelines | 1536 - unified | |||||||||||||||||||||||||||||||||
| Core Speed | 1140 - 1335 (Boost) MHz | |||||||||||||||||||||||||||||||||
| Memory Speed | 12000 MHz | |||||||||||||||||||||||||||||||||
| Memory Bus Width | 192 Bit | |||||||||||||||||||||||||||||||||
| Memory Type | GDDR6 | |||||||||||||||||||||||||||||||||
| Max. Amount of Memory | 6 GB | |||||||||||||||||||||||||||||||||
| Shared Memory | no | |||||||||||||||||||||||||||||||||
| API | DirectX 12_1, OpenGL 4.6 | |||||||||||||||||||||||||||||||||
| Power Consumption | 60 Watt | |||||||||||||||||||||||||||||||||
| Man. Technology | 12 nm | |||||||||||||||||||||||||||||||||
| Notebook Size | medium sized | |||||||||||||||||||||||||||||||||
| Date of Announcement | 23.04.2019 | |||||||||||||||||||||||||||||||||
| Link to Manufacturer Page | www.nvidia.com | |||||||||||||||||||||||||||||||||
The following benchmarks stem from our benchmarks of review laptops. The performance depends on the used graphics memory, clock rate, processor, system settings, drivers, and operating systems. So the results don't have to be representative for all laptops with this GPU. For detailed information on the benchmark results, click on the fps number.


For more games that might be playable and a list of all games and graphics cards visit our Gaming List
HP Envy 15-ep0017np: Intel Core i7-10750H, 15.60", 2.1 kg
External Review » HP Envy 15-ep0017np
HP Envy 15-ep0123tx: Intel Core i7-10750H, 15.60", 2.1 kg
External Review » HP Envy 15-ep0123tx
HP Envy 15-ep0813no: Intel Core i7-10750H, 15.60", 2.2 kg
External Review » HP Envy 15-ep0813no
MSI Stealth 15M A11SDK-085: Intel Core i7-1185G7, 15.60"
External Review » MSI Stealth 15M A11SDK-085
MSI Stealth 15M A11SDK-032RU: Intel Core i7-1185G7, 15.60"
External Review » MSI Stealth 15M A11SDK-032RU
MSI Creator 15 A10SD-276ES: Intel Core i7-10875H, 15.60"
External Review » MSI Creator 15 A10SD-276ES
HP Pavilion Gaming 16-a0011ns: Intel Core i7-10750H, 16.10", 2.4 kg
External Review » HP Pavilion Gaming 16-a0011ns
HP Envy 15-ep0060ng: Intel Core i7-10750H, 15.60", 2.1 kg
External Review » HP Envy 15-ep0060ng
Asus ROG Zephyrus G15 GA502IU: AMD Ryzen 7 4800HS, 15.60", 2 kg
External Review » Asus Zephyrus G15 GA502IU
HP Pavilion Gaming 16-a0272ng: Intel Core i7-10750H, 16.10", 2.4 kg
External Review » HP Pavilion Gaming 16-a0272ng
HP Pavilion Gaming 17-cd1275ng: Intel Core i7-10750H, 17.30", 2.7 kg
External Review » HP Pavilion Gaming 17-cd1275ng
Microsoft Surface Book 3 15: Intel Core i7-1065G7, 15.00", 1.9 kg
External Review » Microsoft Surface Book 3 15
Microsoft Surface Book 3 15-SLZ-00005: Intel Core i7-1065G7, 14.00", 1.9 kg
External Review » Microsoft Surface Book 3 15-SLZ-00005
Asus Zephyrus G14 GA401IU-HE001T: AMD Ryzen 7 4800HS, 14.00", 1.6 kg
External Review » Asus Zephyrus G14 GA401IU-HE001T
Asus Zephyrus G14 GA401IU-HE021T: AMD Ryzen 7 4800HS, 14.00", 1.7 kg
External Review » Asus Zephyrus G14 GA401IU-HE021T
Asus ROG Zephyrus G15 GA502IU-AL011T: AMD Ryzen 7 4800HS, 15.60", 2.1 kg
External Review » Asus Zephyrus G15 GA502IU-AL011T
Asus ROG Zephyrus G15 GA502DU-BQ015T: AMD Ryzen 7 3750H, 15.60", 2.1 kg
External Review » Asus Zephyrus G15 GA502DU-BQ015T
HP Pavilion Gaming 15-dk0045cl: Intel Core i7-9750H, 15.60", 2.4 kg
External Review » HP Pavilion Gaming 15-dk0045cl
HP Pavilion Gaming 15-ec0017ng: AMD Ryzen 7 3750H, 15.60", 2.3 kg
External Review » HP Pavilion Gaming 15-ec0017ng
HP Gaming Pavilion 15-dk0009ng: Intel Core i7-9750H, 15.60", 2.4 kg
External Review » HP Gaming Pavilion 15-dk0009ng
» Comparison of GPUs
Detailed list of all laptop GPUs sorted by class and performance.
» Benchmark List
Sort and restrict laptop GPUs based on performance in synthetic benchmarks.
» Notebook Gaming List
Playable games for each graphics card and their average FPS results.
* Approximate position of the graphics adapter
» Notebookcheck多媒体笔记本电脑Top 10排名
» Notebookcheck游戏笔记本电脑Top 10排名
» Notebookcheck低价办公/商务笔记本电脑Top 10排名
» Notebookcheck高端办公/商务笔记本电脑Top 10排名
» Notebookcheck工作站笔记本电脑Top 10排名
» Notebookcheck亚笔记本电脑Top 10排名
» Notebookcheck超级本产品Top 10排名
» Notebookcheck变形本产品Top 10排名
» Notebookcheck平板电脑Top 10排名
» Notebookcheck智能手机Top 10排名
» Notebookcheck评测过最出色的笔记本电脑屏幕
» Notebookcheck售价500欧元以下笔记本电脑Top 10排名
» Notebookcheck售价300欧元以下笔记本电脑Top 10排名