


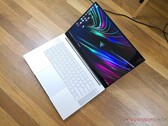
雷蛇灵刃15基础版笔记本电脑评测:10代英特尔升级
最新的Blade 15仅带来少量的升级。用户可以期望键盘会有一些细微的变化,接口也会有一些细微的变化,存储会有所不同,到处都是一些新的可配置选项。不过整体游戏性能将与2019 Blade 15系列大致相同。
Intel Core i7-10750H, NVIDIA GeForce RTX 2070 Max-Q, 15.6", 2.1 kg带有Max-Q设计的NVIDIA GeForce RTX 2070是移动RTX 2070显卡的节能型,具有降低的频率和功耗。因此,它适用于轻薄的游戏笔记本电脑。它基于同一TU106芯片,具有2304个着色器和8 GB GDDR6内存,并通过256位接口(12 GHz)连接。
目前看来,将有两个型号,一个低功耗80瓦版,具有885-1185 MHz的频率,一个更快的90瓦版本,具有1080-1305 MHz的频率。两者的内存频率均为6 GHz,而普通RTX 2070(115 Watt TDP)为7 GHz。
与GTX 1080相比,频率不是唯一的区别。针对Max-Q版本的驱动针对效率进行了优化(而非性能;仅针对Max-Q型号进行了优化),电压被限制在1V,配有高端散热以及针对风扇噪声的40 dB限制进行了的优化(并进行频率调整以确保始终如此)。
特征
TU106芯片以12 nm FinFET工艺制造,并包括深度学习超级采样(DLSS)和实时光线追踪(RTRT)等功能,与基于Pascal架构的旧GPU相比,它们应结合起来可创造出更逼真的光照效果(如果游戏支持)。 RTX 2070还支持DisplayPort 1.4,同时还支持HDMI 2.0b,HDR,同时多投影(SMP)和H.265视频编码/解码(PlayReady 3.0)。
性能
RTX 2070的Max-Q版本的性能应比移动RTX 2070差一些。因此,它应该能够以最高的画质在2560x1440分辨率下运行所有硬件要求高的游戏。但是,光线追踪功能可能会大大降低帧率。
GeForce RTX 2000 Series
| ||||||||||||||||||||||||||||||||||||||||||||||||||||||||||
| Codename | N18E-G2 MAX-Q TU106 | |||||||||||||||||||||||||||||||||||||||||||||||||||||||||
| Architecture | Turing | |||||||||||||||||||||||||||||||||||||||||||||||||||||||||
| Pipelines | 2304 - unified | |||||||||||||||||||||||||||||||||||||||||||||||||||||||||
| TMUs | 144 | |||||||||||||||||||||||||||||||||||||||||||||||||||||||||
| ROPs | 64 | |||||||||||||||||||||||||||||||||||||||||||||||||||||||||
| Raytracing Cores | 36 | |||||||||||||||||||||||||||||||||||||||||||||||||||||||||
| Tensor / AI Cores | 288 | |||||||||||||||||||||||||||||||||||||||||||||||||||||||||
| Core Speed | 885-1080 - 1185-1305 (Boost) MHz | |||||||||||||||||||||||||||||||||||||||||||||||||||||||||
| Memory Speed | 12000 effective = 1500 MHz | |||||||||||||||||||||||||||||||||||||||||||||||||||||||||
| Memory Bus Width | 256 Bit | |||||||||||||||||||||||||||||||||||||||||||||||||||||||||
| Memory Type | GDDR6 | |||||||||||||||||||||||||||||||||||||||||||||||||||||||||
| Max. Amount of Memory | 8 GB | |||||||||||||||||||||||||||||||||||||||||||||||||||||||||
| Shared Memory | no | |||||||||||||||||||||||||||||||||||||||||||||||||||||||||
| Memory Bandwidth | 384 GB/s | |||||||||||||||||||||||||||||||||||||||||||||||||||||||||
| API | DirectX 12_1, OpenGL 4.6 | |||||||||||||||||||||||||||||||||||||||||||||||||||||||||
| Power Consumption | 80-90 Watt | |||||||||||||||||||||||||||||||||||||||||||||||||||||||||
| Transistor Count | 10.8 Billion | |||||||||||||||||||||||||||||||||||||||||||||||||||||||||
| Man. Technology | 12 nm | |||||||||||||||||||||||||||||||||||||||||||||||||||||||||
| PCIe | 3.0 | |||||||||||||||||||||||||||||||||||||||||||||||||||||||||
| Features | DLSS, Raytraycing, VR Ready, G-SYNC, Vulkan, Multi Monitor, | |||||||||||||||||||||||||||||||||||||||||||||||||||||||||
| Notebook Size | large | |||||||||||||||||||||||||||||||||||||||||||||||||||||||||
| Date of Announcement | 06.01.2019 | |||||||||||||||||||||||||||||||||||||||||||||||||||||||||
The following benchmarks stem from our benchmarks of review laptops. The performance depends on the used graphics memory, clock rate, processor, system settings, drivers, and operating systems. So the results don't have to be representative for all laptops with this GPU. For detailed information on the benchmark results, click on the fps number.


For more games that might be playable and a list of all games and graphics cards visit our Gaming List

Alienware m15 P79F: Intel Core i7-8750H, 15.60", 2.2 kg
Review » Alienware外星人m15 P79F (i7-8750H, RTX 2070 Max-Q, OLED) 笔记本电脑评测
MSI P65 Creator 9SF-657: Intel Core i9-9880H, 15.60", 1.9 kg
Review » MSI P65 Creator 9SF (i9-9880H, RTX2070 Max-Q) 笔记本电脑评测
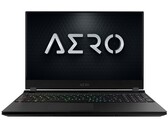
Gigabyte Aero 15 Classic-XA: Intel Core i7-9750H, 15.60", 2.1 kg
Review » 技嘉Aero 15Classic-XA(酷睿 i7-9750H, RTX 2070 Max-Q)笔记本电脑评测
Lenovo Legion Y740-15ICHg: Intel Core i7-8750H, 15.60", 2.3 kg
Review » 联想Legion Y740-15ICH (i7-8750H, RTX 2070 Max-Q) 笔记本电脑评测
Gigabyte Aero 15-X9: Intel Core i7-8750H, 15.60", 2.1 kg
Review » 技嘉Aero 15-X9 (酷睿 i7-8750H, RTX 2070 Max-Q) 笔记本电脑评测
Razer Blade 15 RTX 2070 Max-Q: Intel Core i7-8750H, 15.60", 2.1 kg
Review » 雷蛇灵刃15进阶版(RTX 2070 Max-Q,FHD)笔记本电脑评测
Acer ConceptD 7 Ezel CC715-71-789C: Intel Core i7-10875H, 15.60", 2.5 kg
External Review » Acer ConceptD 7 Ezel CC715-71-789C
Dell G5 15 5500-ND60C: Intel Core i7-10750H, 15.60", 2.4 kg
External Review » Dell G5 15 5500-ND60C
HP Omen 15-ek0039ur: Intel Core i7-10750H, 15.60", 2.5 kg
External Review » HP Omen 15-ek0039ur
Gigabyte Aero 15 WB-7ES1130SH: Intel Core i7-10750H, 15.60", 2 kg
External Review » Gigabyte Aero 15 WB-7ES1130SH
Lenovo Legion C7 15IMH05 82EH0030GE: Intel Core i7-10875H, 15.60", 2.3 kg
External Review » Lenovo Legion C7 15IMH05 82EH0030GE
HP Omen 15-ek0009nw: Intel Core i7-10750H, 15.60", 2.4 kg
External Review » HP Omen 15-ek0009nw
Gigabyte Aero 15 OLED WB-8NL5130SP: Intel Core i7-10875H, 15.60", 2 kg
External Review » Gigabyte Aero 15 OLED WB-8NL5130SP
HP Omen 15-ek0003np: Intel Core i7-10750H, 15.60", 2.4 kg
External Review » HP Omen 15-ek0003np
HP Omen 15-ek0001nc: Intel Core i7-10750H, 15.60", 2.5 kg
External Review » HP Omen 15-ek0001nc
Asus ROG Zephyrus M15 GU502LW-HC201T: Intel Core i7-10875H, 15.60", 2 kg
External Review » Asus ROG Zephyrus M15 GU502LW-HC201T
Acer Predator Helios 300 PH315-53-77M4: Intel Core i7-10750H, 15.60", 2.5 kg
External Review » Acer Predator Helios 300 PH315-53-77M4
HP ZBook Create G7, Core i9 RTX 2070 Max-Q: Intel Core i9-10885H, 15.60", 1.9 kg
External Review » HP ZBook Create G7, Core i9 RTX 2070 Max-Q
HP ZBook Create G7, Core i7 RTX 2070 Max-Q: Intel Core i7-10750H, 15.60", 1.9 kg
External Review » HP ZBook Create G7, Core i7 RTX 2070 Max-Q
Aorus 15P WB: Intel Core i7-10750H, 15.60", 2.1 kg
External Review » Aorus 15P WB
Lenovo Legion 7 15IMH05-81YT000SGE: Intel Core i7-10750H, 15.60", 2.3 kg
External Review » Lenovo Legion 7 15IMH05-81YT000SGE
MSI Creator 15 A10SF-008: Intel Core i7-10875H, 15.60", 2.1 kg
External Review » MSI Creator 15 A10SF-008
Medion Erazer X17805: Intel Core i7-9750H, 17.30", 2.6 kg
External Review » Medion Erazer X17805
HP Omen 15-ek0277ng: Intel Core i7-10750H, 15.60", 2.4 kg
External Review » HP Omen 15-ek0277ng
Acer Predator Helios 300 PH315-53-70HR: Intel Core i7-10750H, 15.60", 2.2 kg
External Review » Acer Predator Helios 300 PH315-53-70HR
Asus ROG Zephyrus M15 GU502LWS: Intel Core i7-10750H, 15.60", 2 kg
External Review » Asus Zephyrus M15 GU502LWS
MSI Creator 17 A10SF-270: Intel Core i7-10875H, 17.30", 2.5 kg
External Review » MSI Creator 17 A10SF-270
Razer Blade 15 Base Model 2020, i7-10750H, RTX 2070 Max-Q: Intel Core i7-10750H, 15.60", 2.1 kg
External Review » Razer Blade 15 Base Model 2020, i7-10750H, RTX 2070 Max-Q
MSI GS66 Stealth 10SF-067: Intel Core i7-10750H, 15.60", 2.1 kg
External Review » MSI GS66 Stealth 10SF-067
Acer Predator Triton 300 PT315-52: Intel Core i7-10750H, 15.60", 2.3 kg
External Review » Acer Predator Triton 300 PT315-52
Razer Blade Pro 17 RTX 2070 Max-Q 300 Hz: Intel Core i7-10875H, 17.30", 2.7 kg
External Review » Razer Blade Pro 17 RTX 2070 Max-Q 300 Hz
MSI GS66 10SF-067 Stealth: Intel Core i7-10750H, 15.60", 2.1 kg
External Review » MSI GS66 10SF-067 Stealth
Gigabyte Aero 17 HDR XA-9UK4130SQ: Intel Core i9-9980HK, 17.30", 2.5 kg
External Review » Gigabyte Aero 17 HDR XA-9UK4130SQ
Aorus 15G WB-8DE2130MD: Intel Core i7-10875H, 15.60", 2.2 kg
External Review » Aorus 15G WB-8DE2130MD
Alienware m17 R2-C1DGG: Intel Core i7-9750H, 17.30", 2.6 kg
External Review » Alienware m17 R2-C1DGG
MSI GS75 Stealth-243: Intel Core i7-9750H, 17.30", 2.3 kg
External Review » MSI GS75 Stealth-243
Acer Predator Triton 500 PT515-51-72QK: Intel Core i7-9750H, 15.60", 2 kg
External Review » Acer Predator Triton 500 PT515-51-72QK
Gigabyte Aero 15 XB-7DE1130SH: Intel Core i7-10750H, 15.60", 2 kg
External Review » Gigabyte Aero 15 XB-7DE1130SH
Gigabyte Aero 17 XA-7DE4130SP: Intel Core i7-9750H, 17.30", 2.5 kg
External Review » Gigabyte Aero 17 XA-7DE4130SP
Dell G5 15 5590-P8RVW: Intel Core i7-9750H, 15.60", 2.8 kg
External Review » Dell G5 15 5590-P8RVW
Schenker XMG Neo 15 XNE15M19: Intel Core i7-9750H, 15.60", 2.1 kg
External Review » Schenker XMG Neo 15 XNE15M19
HP Omen 15-dh0011ng: Intel Core i7-9750H, 15.60", 2.6 kg
External Review » HP Omen 15-dh0011ng
Alienware m15 R2-390W9: Intel Core i7-9750H, 15.60", 2.2 kg
External Review » Alienware m15 R2-390W9
Razer Blade 15 RTX 2070 Max-Q, i7-9750H: Intel Core i7-9750H, 15.60", 2.2 kg
External Review » Razer Blade 15 RTX 2070 Max-Q, i7-9750H
Schenker XMG Fusion 15 XFU15L19: Intel Core i7-9750H, 15.60", 1.9 kg
External Review » Schenker XMG Fusion 15 XFU15L19
Gigabyte Aero 17 XA RP77: Intel Core i9-9980HK, 17.30", 2.5 kg
External Review » Gigabyte Aero 17 XA RP77
MSI GS65 9SF-445: Intel Core i7-9750H, 15.60", 1.9 kg
External Review » MSI GS65 9SF-445
Lenovo Legion Y740-17ICHg-81UJ001UGE: Intel Core i7-9750H, 17.30", 2.9 kg
External Review » Lenovo Legion Y740-17ICHg-81UJ001UGE
HP Omen X 2S 15-dg0075cl: Intel Core i7-9750H, 15.60", 2.4 kg
External Review » HP Omen X 2S 15-dg0075cl
HP Omen 15-dc1303ng: Intel Core i7-8750H, 15.60", 2.4 kg
External Review » HP Omen 15-dc1303ng
Acer Predator Triton 500 PT515-51-71PZ: Intel Core i7-9750H, 15.60", 2.1 kg
External Review » Acer Predator Triton 500 PT515-51-71PZ
Gigabyte Aero 15 OLED XA: Intel Core i7-9750H, 15.60", 2.2 kg
External Review » Gigabyte Aero 15 OLED XA
MSI P65 Creator 9SF-657: Intel Core i9-9880H, 15.60", 1.9 kg
External Review » MSI P65 Creator 9SF-657
Razer Blade Pro 17 RTX 2070 Max-Q : Intel Core i7-9750H, 17.30", 2.8 kg
External Review » Razer Blade Pro 17 RTX 2070 Max-Q
Acer Predator Triton 500 PT515-51-70GK: Intel Core i7-9750H, 15.60", 2.1 kg
External Review » Acer Predator Triton 500 PT515-51-70GK
Medion Erazer X15805: Intel Core i9-8950HK, 15.60", 2.1 kg
External Review » Medion Erazer X15805
Lenovo Legion Y740-15ICHg: Intel Core i7-8750H, 15.60", 2.3 kg
External Review » Lenovo Legion Y740-15ICHg
MSI GS65 8SF-057: Intel Core i7-8750H, 15.60", 1.9 kg
External Review » MSI GS65 8SF-057
Dell G7 17 7790: Intel Core i7-8750H, 17.30", 3.2 kg
External Review » Dell G7 17 7790
Schenker XMG Neo 15 Turing: Intel Core i7-8750H, 15.60", 2 kg
External Review » Schenker XMG Neo 15 Turing
Alienware m15 P79F: Intel Core i7-8750H, 15.60", 2.2 kg
External Review » Alienware m15 P79F
Lenovo Legion Y740-15CHg-81HE0041GE: Intel Core i7-8750H, 15.60", 2.2 kg
External Review » Lenovo Legion Y740-15CHg-81HE0041GE
Medion Erazer X15805: Intel Core i7-8750H, 15.60", 2.2 kg
External Review » Medion Erazer X15805
Lenovo Legion Y740-15ICHg-81HE0044GE: Intel Core i7-8750H, 15.60", 2.2 kg
External Review » Lenovo Legion Y740-15ICHg-81HE0044GE
Lenovo Legion Y740-15ICHg-81HE0004US: Intel Core i7-8750H, 15.60", 2.2 kg
External Review » Lenovo Legion Y740-15ICHg-81HE0004US
Gigabyte Aero 15 Classic-XA: Intel Core i7-9750H, 15.60", 2.1 kg
External Review » Gigabyte Aero 15 Classic-XA
MSI GS75 8SF-071: Intel Core i7-8750H, 17.30", 2.3 kg
External Review » MSI GS75 8SF-071
Alienware m15-KV74W: Intel Core i7-8750H, 15.60", 2.2 kg
External Review » Alienware m15-KV74W
MSI GS75 8SF-005NL: Intel Core i7-8750H, 17.30", 2.3 kg
External Review » MSI GS75 8SF-005NL
Asus Zephyrus S GX531GW-ES035R: Intel Core i7-8750H, 15.60", 2.1 kg
External Review » Asus Zephyrus S GX531GW-ES035R
Lenovo Legion Y740-17ICHG-81HH0012GE: Intel Core i7-8750H, 17.30", 2.9 kg
External Review » Lenovo Legion Y740-17ICHG-81HH0012GE
MSI GS65 Stealth 8SF-051FR: Intel Core i7-8750H, 15.60", 1.9 kg
External Review » MSI GS65 Stealth 8SF-051FR
Lenovo Legion Y740-15CHg-81HE000RCK: Intel Core i7-8750H, 15.60", 2.2 kg
External Review » Lenovo Legion Y740-15CHg-81HE000RCK
Alienware m17-XW6MJ: Intel Core i7-8750H, 17.30", 2.6 kg
External Review » Alienware m17-XW6MJ
Gigabyte Aero 15-X9: Intel Core i7-8750H, 15.60", 2.1 kg
External Review » Gigabyte Aero 15-X9
Razer Blade 15 RTX 2070 Max-Q: Intel Core i7-8750H, 15.60", 2.1 kg
External Review » Razer Blade 15 RTX 2070 Max-Q
» Comparison of GPUs
Detailed list of all laptop GPUs sorted by class and performance.
» Benchmark List
Sort and restrict laptop GPUs based on performance in synthetic benchmarks.
» Notebook Gaming List
Playable games for each graphics card and their average FPS results.
* Approximate position of the graphics adapter
» Notebookcheck多媒体笔记本电脑Top 10排名
» Notebookcheck游戏笔记本电脑Top 10排名
» Notebookcheck低价办公/商务笔记本电脑Top 10排名
» Notebookcheck高端办公/商务笔记本电脑Top 10排名
» Notebookcheck工作站笔记本电脑Top 10排名
» Notebookcheck亚笔记本电脑Top 10排名
» Notebookcheck超级本产品Top 10排名
» Notebookcheck变形本产品Top 10排名
» Notebookcheck平板电脑Top 10排名
» Notebookcheck智能手机Top 10排名
» Notebookcheck评测过最出色的笔记本电脑屏幕
» Notebookcheck售价500欧元以下笔记本电脑Top 10排名
» Notebookcheck售价300欧元以下笔记本电脑Top 10排名