Intel Core i7-1280P
英特尔酷睿i7-1280P是旗舰级Alder Lake-P CPU,也就是说,这是一个昂贵的28W部件,旨在用于超轻笔记本电脑。这款CPU在2022年初公布,它有6个性能核心(P-cores,Golden Cove架构)与8个高效核心(E-cores,Gracemont架构)相搭配。P-cores支持超线程,与E-cores结合使用时可产生高达20个线程。性能集群的时钟速度为1.8GHz至4.8GHz,效率集群的时钟速度为1.3GHz至3.6GHz。这是截至2022年2月唯一的六核28W Alder Lake CPU,胜过更实惠的i7-1270P和i7-1260P所拥有的。这款Core i7支持完整的vPro功能集("企业 "级,允许远程管理)。
架构
E-cores的性能应该类似于Skylake核心(在Core i7-6700HQ和其他选项中发现),目前已经有六年的历史。酷睿i7-1280P的所有CPU核心都可以访问24MB的L3缓存。集成内存控制器支持各种内存类型,最高可达LPDDR5-5200、DDR5-4800、LPDDR4x-4267或DDR4-3200。正如其他Alder Lake处理器一样,Core i7-1280P配备了Thread Director,这是一项新功能,旨在帮助Windows 11决定哪些核心用于哪些工作负载,以实现最佳性能和效率。通过GNA 3.0和DL Boost(通过AVX2)支持AI算法的硬件加速。对PCI-Express 5.0的支持还没有进入笔记本级Alder Lake处理器,所以用户将不得不暂时满足于PCI-Express 4.0。
性能方面
我们预计14个CPU核心将轻松超越任何即将推出的35W四核Tiger Lake部件(如Core i7-11375H),同时也将击败8核笔记本级AMD Ryzen 4000和Ryzen 5000选项,其运行时钟速度与1280P所能提供的相似。性能的可持续性很可能在很大程度上取决于电源限制有多高,以及特定系统的散热效果有多好。也就是说,冷却良好的i7-1280P将有能力与i7-12800H交锋,这是一款游戏玩家和数字艺术家熟悉的高功率CPU。
显卡
内置的图形适配器是96欧盟Iris Xe,运行速度高达1.45GHz,与第11代Tiger Lake-UP3处理器(如i7-1165G7)相比没有任何变化,这几乎不是一个缺点,因为这个iGPU具有现代功能,如AV1视频解码能力和SUHD 4320p显示器支持。当被问及它的游戏性能时,我们会告诉你期望接近NVIDIA的MX450,或者换句话说,在大多数游戏中以1080p/中等设置进行游戏时,只要功率限制足够高,冷却解决方案足够好,就可以接受帧率。由于Iris Xe没有专用的显存,所以快速的内存是获得良好性能的先决条件。
功耗
i7的基本功率(也称为默认TDP值或PL1)为28W,64W为其涡轮功率(也称为PL2)。酷睿i7-1280P采用英特尔第三代10纳米工艺制造,被称为英特尔7,具有良好的能源效率。
Series | Intel Alder Lake-P |
Codename | Alder Lake-P |
Series: Alder Lake-P Alder Lake-P |
Clock Rate | 1300 - 4800 MHz |
Level 1 Cache | 1.2 MB |
Level 2 Cache | 11.5 MB |
Level 3 Cache | 24 MB |
Number of Cores / Threads | 14 / 20 |
Power Consumption (TDP = Thermal Design Power) | 28 Watt |
Manufacturing Technology | 10 nm |
Max. Temperature | 100 °C |
Socket | BGA1744 |
Features | DDR4-3200/LPDDR4x-4266/DDR5-4800/LPDDR5-5200 RAM, PCIe 4, Thr. Director, DL Boost, GNA, Rem. Platf. Erase, MMX, SSE, SSE2, SSE3, SSSE3, SSE4.1, SSE4.2, AVX, AVX2, BMI2, ABM, FMA, ADX, SMEP, SMAP, EIST, TM1, TM2, HT, Turbo, SST, AES-NI, RDRAND, RDSEED, SHA |
GPU | Intel Iris Xe Graphics G7 96EUs ( - 1450 MHz) |
64 Bit | 64 Bit support |
Architecture | x86 |
Announcement Date | 01/04/2022 |
Product Link (external) | ark.intel.com |
Benchmarks
Performance Rating - CB R15 + R20 + 7-Zip + X265 + Blender + 3DM11 CPU
39.9 pt (55%)
...
AMD Ryzen 7 7735H
AMD Ryzen 9 5900HS
AMD Ryzen 9 5980HS
...
max:
Cinebench R23 - Cinebench R23 Multi Core
min: 8632 avg: 11685 median: 11666 (11%) max: 14803 Points
CPU TDP ? | TDP 23 W | TDP 28 W | TDP 30 W | TDP 35 W | TDP 50 W | TDP 80 W |
---|
77% | 58% | 80% | 67% | 91% | 81% | 100% |
...
...
max:
Cinebench R23 - Cinebench R23 Single Core
min: 1609 avg: 1670 median: 1651 (70%) max: 1787 Points
CPU TDP ? | TDP 23 W | TDP 28 W | TDP 30 W | TDP 35 W | TDP 50 W | TDP 80 W |
---|
92% | 94% | 90% | 95% | 100% | 90% | 92% |
...
Intel Core i5-1245U
...
max:
Cinebench R20 - Cinebench R20 CPU (Single Core)
min: 615 avg: 642 median: 629 (70%) max: 701 Points
CPU TDP ? | TDP 23 W | TDP 28 W | TDP 30 W | TDP 35 W | TDP 50 W | TDP 80 W |
---|
89% | 91% | 89% | 88% | 100% | 96% | 90% |
...
Intel Core i7-1265U
Intel Core i5-1245U
...
max:
Cinebench R20 - Cinebench R20 CPU (Multi Core)
min: 3283 avg: 4627 median: 4677.5 (11%) max: 5415 Points
CPU TDP ? | TDP 23 W | TDP 28 W | TDP 30 W | TDP 35 W | TDP 50 W | TDP 80 W |
---|
88% | 61% | 84% | 81% | 98% | 85% | 100% |
...
AMD Ryzen 9 5980HS
AMD Ryzen 9 5900HS
...
max:
Cinebench R15 - Cinebench R15 CPU Multi 64 Bit
min: 1905 avg: 2120 median: 2112 (13%) max: 2332 Points
CPU TDP ? | TDP 23 W | TDP 28 W | TDP 30 W | TDP 35 W | TDP 50 W | TDP 80 W |
---|
88% | 91% | 82% | 85% | 91% | 100% | 100% |
...
AMD Ryzen 9 5980HS
...
max:
Dell XPS 13 Plus 9320 i7-1280P OLED: Ø1467 (1369.16-1905.49)
HP EliteBook 840 G9: Ø1567 (1319.74-1992.03)
Dell XPS 13 Plus 9320 i7 1280P: Ø1701 (1524.97-2057.08)
Lenovo Yoga Slim 9 14IAP7: Ø1774 (1704.67-2112.97)
Lenovo ThinkPad X1 Nano Gen 2 Core i7-1280P: Ø1191 (1063.89-2118.53)
MSI Prestige 15 A12UD-093: Ø1539 (1487.04-2325.04)
MSI Summit E16 Flip A12UDT-031: Ø2059 (1955.03-2339.73)
Cinebench R15 - Cinebench R15 CPU Single 64 Bit
min: 203 avg: 237.3 median: 238 (72%) max: 258 Points
CPU TDP ? | TDP 23 W | TDP 28 W | TDP 30 W | TDP 35 W | TDP 50 W | TDP 80 W |
---|
92% | 92% | 89% | 100% | 100% | 79% | 92% |
...
...
max:
Cinebench R11.5 - Cinebench R11.5 CPU Multi 64 Bit
25.2 Points (33%)
...
AMD Ryzen 9 5900HS
...
max:
Cinebench R11.5 - Cinebench R11.5 CPU Single 64 Bit
3.1 Points (76%)
...
Intel Core i7-1265U
...
max:
Cinebench R10 - Cinebench R10 Rend. Single (32bit)
8881 points (54%)
...
Intel Core i7-1265U
Intel Core i5-11500B
Intel Core i7-11390H
...
max:
Cinebench R10 - Cinebench R10 Rend. Multi (32bit)
46007 points (33%)
...
Intel Xeon W-10885M
Intel Core i9-9980HK
...
max:
Cinebench R10 - Cinebench R10 Rend. Multi (64bit)
70566 Points (49%)
...
AMD Ryzen 9 5900HS
...
max:
Cinebench R10 - Cinebench R10 Rend. Single (64bit)
14362 Points (17%)
...
Intel Core i5-1245U
Intel Core i7-1265U
...
max:
wPrime 2.10 - wPrime 2.0 1024m *
1168 s (14%)
...
Intel Core i3-2377M
Intel Core i5-4300Y
Intel Core 2 Quad Q9000
AMD A4-5000
Intel Atom x5-Z8300
Intel Core i3-2375M
AMD Turion X2 Ultra ZM-85
Intel Core i3-2365M
AMD Athlon II P320
Intel Core 2 Duo T6570
Intel Core 2 Duo T6500
AMD Athlon II M320
AMD Turion X2 RM-75
Intel Pentium Dual Core T4400
Intel Core i3-2367M
Intel Celeron 3865U
Intel Celeron Dual-Core T3500
...
VIA C3-M C3-M-1200
wPrime 2.10 - wPrime 2.0 32m *
34 s (7%)
...
Intel Pentium P6200
Intel Core i3-4010U
Intel Core i5-4202Y
Intel Pentium B980
AMD Athlon II P360
Intel Celeron 2970M
AMD Turion II P520
Intel Pentium B960
AMD A4-6210
Intel Core 2 Duo P8600
Intel Core 2 Duo P8400
Intel Celeron M P4600
Intel Pentium P6100
Intel Atom x5-E8000
Intel Core i5-470UM
AMD Turion II M500
AMD Athlon II P340
...
Transmeta Crusoe TM-5800
wPrime 1.55 - wPrime 1.55 1024m *
1165 s (5%)
...
Intel Core i5-7Y54
AMD A6-7310
Intel Core i5-7Y57
AMD Turion 64 X2 TL-68
Intel Core i3-2367M
Intel Core Duo L2500
Intel Pentium Dual Core T2080
AMD Mobile Sempron SI-40
Intel Atom x5-Z8500
Intel Mobile Pentium 4 538
Intel Celeron M 430
AMD Mobile Sempron 3000+
AMD Turion 64 ML-32
AMD Turion 64 ML-34
...
Intel Celeron M 373
wPrime 1.55 - wPrime 1.55 32m *
28 s (15%)
...
AMD Phenom II X4 N930
Intel Core i5-7Y54
AMD A6-7310
AMD Phenom II X3 N850
AMD Phenom II X2 X640 BE
AMD Phenom II X3 N830
AMD Phenom II X2 N620
AMD Phenom II X3 P820
AMD Turion II N530
Intel Core i5-7Y57
AMD Turion 64 X2 TL-68
AMD Turion II P540
AMD Turion II P520
AMD Athlon II N330
AMD Athlon II P340
...
Intel Pentium M 713
7082 points (11%)
...
Intel Core i5-11500B
Intel Core i7-4870HQ
Intel Xeon W-10885M
Intel Core i9-9980HK
...
max:
7-Zip 18.03 - 7-Zip 18.03 Multli Thread 4 runs
min: 45292 avg: 49730 median: 49572 (28%) max: 53710 MIPS
CPU TDP ? | TDP 23 W | TDP 28 W | TDP 30 W | TDP 35 W | TDP 50 W | TDP 80 W |
---|
99% | 87% | 92% | 89% | 100% | 96% | 84% |
...
AMD Ryzen 7 7735H
...
max:
7-Zip 18.03 - 7-Zip 18.03 Single Thread 4 runs
min: 4995 avg: 5488 median: 5540 (66%) max: 5874 MIPS
CPU TDP ? | TDP 23 W | TDP 28 W | TDP 30 W | TDP 35 W | TDP 50 W | TDP 80 W |
---|
93% | 96% | 85% | 100% | 97% | 94% | 88% |
...
Intel Core i9-9980HK
Apple M1
Intel Core i5-11500B
Intel Core i7-8559U
Intel Xeon W-10885M
...
max:
HWBOT x265 Benchmark v2.2 - HWBOT x265 4k Preset
min: 9.62 avg: 12.5 median: 12.9 (23%) max: 14.5 fps
CPU TDP 23 W | TDP 28 W | TDP 30 W | TDP 35 W | TDP 80 W |
---|
66% | 95% | 89% | 100% | 81% |
...
...
max:
Lenovo ThinkPad X1 Nano Gen 2 Core i7-1280P: Ø11.9 (1.36-27.7)
MSI Summit E16 Flip A12UDT-031: Ø12.9 (1.01-21.6)
HP EliteBook 840 G9: Ø14.8 (1.35-27.1)
Dell XPS 13 Plus 9320 i7-1280P OLED: Ø15.1 (1.32-27.2)
Lenovo Yoga Slim 9 14IAP7: Ø16 (1.26-25.5)
TrueCrypt - TrueCrypt Serpent
1.2 GB/s (0%)
...
AMD Ryzen 7 7735H
...
max:
TrueCrypt - TrueCrypt Twofish
2.1 GB/s (36%)
...
...
max:
TrueCrypt - TrueCrypt AES
11.8 GB/s (31%)
...
AMD Ryzen 7 7735H
...
max:
Blender - Blender 3.3 Classroom CPU *
min: 490 avg: 566 median: 537 (7%) max: 741 Seconds
CPU TDP ? | TDP 23 W | TDP 28 W | TDP 30 W | TDP 35 W | TDP 50 W | TDP 80 W |
---|
103% | 100% | 103% | 101% | 103% | 104% | 103% |
...
Apple M2
...
Intel Celeron J4125
Blender - Blender 2.79 BMW27 CPU *
min: 259 avg: 281.7 median: 285 (2%) max: 309 Seconds
CPU TDP ? | TDP 23 W | TDP 28 W | TDP 30 W | TDP 35 W | TDP 50 W | TDP 80 W |
---|
100% | 100% | 100% | 100% | 100% | 100% | 100% |
...
AMD Ryzen 7 7735H
...
AMD E1-2100
R Benchmark 2.5 - R Benchmark 2.5 *
min: 0.4505 avg: 0.5 median: 0.5 (10%) max: 0.512 sec
CPU TDP ? | TDP 23 W | TDP 28 W | TDP 30 W | TDP 35 W | TDP 50 W | TDP 80 W |
---|
101% | 101% | 100% | 101% | 101% | 101% | 100% |
...
...
AMD E1-2100
3DMark 06 - CPU - 3DMark 06 - CPU
6579 Points (14%)
...
Intel Core i7-3630QM
Intel Core i7-4750HQ
Intel Core i7-3635QM
Intel Core i7-4700MQ
Intel Core i7-4700HQ
Intel Core i7-3720QM
Intel Core i7-4870HQ
Intel Core i5-1230U
Intel Core i7-8650U
Intel Core i7-2960XM
Intel Core i7-3820QM
Intel Core i7-3740QM
...
max:
Super Pi mod 1.5 XS 1M - Super Pi mod 1.5 XS 1M *
7 s (2%)
...
Intel Core i7-11390H
...
VIA C3-M C3-M-1200
Super Pi mod 1.5 XS 2M - Super Pi mod 1.5 XS 2M *
16 s (1%)
...
Intel Core i5-11500B
...
Intel Celeron Dual-Core T1400
Super Pi Mod 1.5 XS 32M - Super Pi mod 1.5 XS 32M *
366 s (2%)
...
Intel Core i7-11390H
Intel Core i5-1230U
Intel Core i5-11500B
...
VIA C3-M C3-M-1200
3DMark 11 - 3DM11 Performance Physics
min: 11415 avg: 15372 median: 15372.5 (42%) max: 18478 Points
CPU TDP 23 W | TDP 28 W | TDP 30 W | TDP 35 W | TDP 50 W | TDP 80 W |
---|
62% | 76% | 83% | 100% | 83% | 95% |
...
AMD Ryzen 9 5980HS
AMD Ryzen 7 7735H
AMD Ryzen 9 5900HS
Intel Core i9-9980HK
Intel Core i5-1245U
...
max:
3DMark - 3DMark Cloud Gate Physics
min: 7264 avg: 12588 median: 12154 (31%) max: 17047 Points
CPU TDP 23 W | TDP 28 W | TDP 30 W | TDP 35 W | TDP 50 W | TDP 80 W |
---|
61% | 43% | 78% | 96% | 64% | 100% |
...
Intel Core i5-1245U
Intel Core i5-11500B
Intel Core i7-4712MQ
...
max:
3DMark - 3DMark Fire Strike Standard Physics
min: 15398 avg: 19695 median: 19017.5 (34%) max: 25756 Points
CPU TDP 23 W | TDP 28 W | TDP 30 W | TDP 35 W | TDP 50 W | TDP 80 W |
---|
60% | 72% | 76% | 91% | 60% | 100% |
...
Intel Xeon W-10885M
Intel Xeon W-2145
Intel Core i9-9980HK
Intel Core i5-11500B
...
max:
3DMark - 3DMark Time Spy CPU
min: 6205 avg: 8459 median: 7672.5 (32%) max: 12031 Points
CPU TDP 23 W | TDP 28 W | TDP 30 W | TDP 35 W | TDP 50 W | TDP 80 W |
---|
52% | 61% | 67% | 86% | 56% | 100% |
...
Intel Xeon W-10885M
AMD Ryzen 7 7735H
Intel Core i9-9980HK
...
max:
Geekbench 5.5 - Geekbench 5.1 - 5.4 64 Bit Single-Core
min: 1571 avg: 1701 median: 1746 (74%) max: 1802 points
CPU TDP ? | TDP 23 W | TDP 28 W | TDP 30 W | TDP 35 W | TDP 50 W | TDP 80 W |
---|
88% | 100% | 100% | 98% | 97% | 87% | 91% |
...
Intel Core i5-1245U
Intel Core i7-1265U
Apple M1
...
Geekbench 5.5 - Geekbench 5.1 - 5.4 64 Bit Multi-Core
min: 9623 avg: 10839 median: 11191 (20%) max: 11811 points
CPU TDP ? | TDP 23 W | TDP 28 W | TDP 30 W | TDP 35 W | TDP 50 W | TDP 80 W |
---|
86% | 88% | 97% | 96% | 95% | 100% | 81% |
...
...
max:
Geekbench 5.0 - Geekbench 5.0 64 Bit Single-Core
min: 1685 avg: 1706 median: 1694 (7%) max: 1738 points
CPU TDP 23 W | TDP 28 W | TDP 30 W |
---|
100% | 97% | 97% |
...
Intel Core i7-1265U
Intel Core i7-11390H
...
max:
Geekbench 5.0 - Geekbench 5.0 64 Bit Multi-Core
min: 9886 avg: 10561 median: 10537 (33%) max: 11260 points
CPU TDP 23 W | TDP 28 W | TDP 30 W |
---|
88% | 100% | 94% |
...
...
max:
AMD Ryzen Threadripper PRO 3995WX
Geekbench 4.4 - Geekbench 4.1 - 4.4 64 Bit Single-Core
7522 points (75%)
...
Intel Core i7-11390H
Intel Core i7-1265U
...
max:
Geekbench 4.4 - Geekbench 4.1 - 4.4 64 Bit Multi-Core
40196 points (45%)
...
...
max:
Mozilla Kraken 1.1 - Kraken 1.1 Total Score *
min: 526 avg: 563 median: 538 (1%) max: 683 ms
CPU TDP ? | TDP 23 W | TDP 28 W | TDP 30 W | TDP 35 W | TDP 50 W | TDP 80 W |
---|
100% | 100% | 100% | 100% | 100% | 100% | 100% |
...
Intel Core i7-1265U
Intel Core i5-1245U
...
AMD A4-1250
max:
Apple S7
Sunspider - Sunspider 1.0 Total Score *
95.5 ms (1%)
...
Intel Xeon W-2145
Intel Core i7-3720QM
Intel Core i5-8265U
Intel Core i3-6100H
Intel Core i7-4712MQ
Intel Core m5-6Y54
Intel Core i7-4650U
Intel Core i7-4712HQ
Intel Core i7-4702HQ
...
max:
Octane V2 - Octane V2 Total Score
min: 83104 avg: 84579 median: 84578.5 (76%) max: 86053 Points
CPU TDP 35 W | TDP 50 W |
---|
100% | 97% |
...
...
WebXPRT 4 - WebXPRT 4 Score
min: 232 avg: 247.2 median: 248.5 (71%) max: 257 Points
CPU TDP ? | TDP 23 W | TDP 28 W | TDP 30 W | TDP 35 W | TDP 80 W |
---|
98% | 100% | 98% | 95% | 96% | 90% |
...
Intel Core i5-1245U
...
max:
WebXPRT 3 - WebXPRT 3 Score
min: 203 avg: 271.3 median: 286 (60%) max: 290 Points
CPU TDP ? | TDP 23 W | TDP 28 W | TDP 30 W | TDP 35 W | TDP 50 W | TDP 80 W |
---|
99% | 100% | 99% | 98% | 99% | 70% | 90% |
...
Apple M1
Intel Core i7-11390H
Intel Core i7-1265U
Intel Core i5-11500B
Intel Core i5-1245U
AMD Ryzen 9 5900HS
...
CrossMark - CrossMark Overall
min: 1652 avg: 1704 median: 1690 (65%) max: 1773 Points
CPU TDP 23 W | TDP 28 W | TDP 30 W | TDP 35 W | TDP 50 W | TDP 80 W |
---|
96% | 99% | 100% | 95% | 94% | 93% |
...
...
max:
Power Consumption - Prime95 Power Consumption - external Monitor *
min: 40.8 avg: 56.1 median: 54.3 (9%) max: 73.4 Watt
CPU TDP 23 W | TDP 28 W | TDP 30 W | TDP 35 W | TDP 50 W | TDP 80 W |
---|
106% | 102% | 104% | 104% | 104% | 100% |
...
AMD Ryzen 7 7735H
Intel Core i5-1245U
...
max:
AMD Ryzen Threadripper PRO 3975WX
Lenovo ThinkPad X1 Nano Gen 2 Core i7-1280P: Ø40.8 (36.9-65.5)
HP EliteBook 840 G9: Ø51.8 (48.3-67.3)
MSI Prestige 15 A12UD-093: Ø53.2 (50.3-63.7)
Lenovo Yoga Slim 9 14IAP7: Ø55.3 (49.5-69.4)
Dell XPS 13 Plus 9320 i7-1280P OLED: Ø62.3 (57.4-63)
MSI Summit E16 Flip A12UDT-031: Ø73.4 (67.2-95.2)
Power Consumption - Cinebench R15 Multi Power Consumption - external Monitor *
min: 45.3 avg: 65.3 median: 65.1 (12%) max: 90.7 Watt
CPU TDP 23 W | TDP 28 W | TDP 30 W | TDP 35 W | TDP 50 W | TDP 80 W |
---|
110% | 106% | 105% | 105% | 107% | 100% |
...
Intel Core i7-7700HQ
Intel Core i7-3720QM
Intel Core i7-7820HQ
Intel Xeon E3-1535M v6
Intel Core i7-8559U
...
max:
Lenovo ThinkPad X1 Nano Gen 2 Core i7-1280P: Ø45.3 (35.8-65.3)
MSI Prestige 15 A12UD-093: Ø56.6 (51.4-63.6)
Dell XPS 13 Plus 9320 i7-1280P OLED: Ø62.8 (62.2-62.9)
HP EliteBook 840 G9: Ø67.3 (67.2-67.3)
Lenovo Yoga Slim 9 14IAP7: Ø69.1 (67.4-69.4)
MSI Summit E16 Flip A12UDT-031: Ø94.2 (86.3-96.2)
Power Consumption - Idle Power Consumption - external Monitor *
min: 3.08 avg: 8.5 median: 8.7 (6%) max: 13.6 Watt
CPU TDP 30 W | TDP 35 W | TDP 50 W | TDP 80 W |
---|
108% | 103% | 104% | 100% |
...
AMD Ryzen 7 7735H
Intel Core i7-11390H
...
max:
HP EliteBook 840 G9: Ø3.08 (2.25-10.2)
MSI Prestige 15 A12UD-093: Ø7.64 (6.85-9.29)
Lenovo Yoga Slim 9 14IAP7: Ø9.8 (7.78-15)
MSI Summit E16 Flip A12UDT-031: Ø13.6 (13-15.1)
Power Consumption - Idle Power Consumption 150cd 1min *
min: 4.07 avg: 10.5 median: 10.2 (11%) max: 17.4 Watt
CPU TDP 30 W | TDP 35 W | TDP 50 W | TDP 80 W |
---|
118% | 106% | 114% | 100% |
...
...
max:
HP EliteBook 840 G9: Ø4.07 (3.28-7.54)
MSI Prestige 15 A12UD-093: Ø7.52 (6.79-9.55)
Lenovo Yoga Slim 9 14IAP7: Ø12.9 (11.6-16.3)
MSI Summit E16 Flip A12UDT-031: Ø17.4 (16.6-19.1)
Power Consumption - Cinebench R15 Multi Power Efficiency - external Monitor
min: 25.7 avg: 32.6 median: 30.3 (23%) max: 46.8 Points per Watt
CPU TDP 23 W | TDP 28 W | TDP 30 W | TDP 35 W | TDP 80 W |
---|
100% | 65% | 63% | 65% | 55% |
...
AMD Ryzen 7 7735H
...
- Range of benchmark values for this graphics card
- Average benchmark values for this graphics card
* Smaller numbers mean a higher performance
v1.26
log 18. 11:38:51
#0 no ids found in url (should be separated by "_") +0s ... 0s
#1 not redirecting to Ajax server +0s ... 0s
#2 did not recreate cache, as it is less than 5 days old! Created at Tue, 16 Apr 2024 05:37:29 +0200 +0.001s ... 0.001s
#3 no comparison url found in template nbc.compare_page_2 needed +0.007s ... 0.008s
#4 no comparison url found in template nbc.compare_page_2 needed +0s ... 0.009s
#5 no comparison url found in template nbc.compare_page_2 needed +0s ... 0.009s
#6 no comparison url found in template nbc.compare_page_2 needed +0s ... 0.009s
#7 no comparison url found in template nbc.compare_page_2 needed +0s ... 0.009s
#8 composed specs +0s ... 0.01s
#9 did output specs +0s ... 0.01s
#10 getting avg benchmarks for device 14059 +0.015s ... 0.025s
#11 got single benchmarks 14059 +0.035s ... 0.06s
#12 got avg benchmarks for devices +0s ... 0.06s
#13 min, max, avg, median took s +0.972s ... 1.032s
#14 no comparison url found in template nbc.compare_page_2 needed +0s ... 1.032s
#15 return log +0s ... 1.032s
Reviews for the Intel Core i7-1280P processor
惠普EliteBook 840 G9笔记本电脑评测。联想ThinkPad X1 Carbon的替代品
与其他大多数商务笔记本不同,EliteBook 840/845 G9配备了英特尔vPro和AMD PRO选项,以吸引两边的粉丝。在最近审查了高端的Ryzen 9 PRO 6950HS AMD SKU之后,我们现在终于可以将其与高端的英特尔Core i7-1280P选项进行比较。...
Intel Core i7-1280P | Intel Iris Xe Graphics G7 96EUs | 14.00" | 1.5 kg
微星Prestige 15笔记本电脑评测。炫目的4K图像质量,坚实的性能
微星的Creator笔记本将杰出的图像价值与一个高效和强大的处理器以及一个实现了光线追踪的独立图形芯片相结合。这种组合似乎特别适合在更高层次上进行图像编辑/处理。 ...
Intel Core i7-1280P | NVIDIA GeForce RTX 3050 Ti Laptop GPU | 15.60" | 1.8 kg
微星Summit E16 Flip回顾。带笔、16:10显示屏和RTX 3050 Ti的二合一笔记本电脑
Summit E16 Flip提供了一个16英寸的触摸屏,采用更适合办公的16:10格式,雷电4,以及一个专用的GeForce RTX 3050 Ti Laptop GPU。触摸屏可以用手指或附带的微星输入笔操作。...
Intel Core i7-1280P | NVIDIA GeForce RTX 3050 Ti Laptop GPU | 16.00" | 1.9 kg
联想Yoga Slim 9i评测。可以说是最快的Evo笔记本电脑
英特尔的酷睿i7-1280P使联想Yoga Slim 9i成为这次可能是最快的超极本。由于采用了3K 90 Hz OLED显示屏,低排放,以及高质量的四扬声器,你得到的是一台结实而灵巧的笔记本电脑。...
Intel Core i7-1280P | Intel Iris Xe Graphics G7 96EUs | 14.00" | 1.4 kg
联想ThinkPad X1 Nano第二代回顾。史上最小的X1笔记本电脑
450尼特,全sRGB色彩,16:10长宽比,5G Sub 6广域网,以及12代酷睿P处理器,所有这些都在一个轻于1公斤的系统中。你真的能在一个小的13英寸外形尺寸中容纳所有这些功能而不走弯路吗?...
Intel Core i7-1280P | Intel Iris Xe Graphics G7 96EUs | 13.00" | 958 gDell XPS 13 Plus 9320 i7-1280P OLED: Intel Iris Xe Graphics G7 96EUs, 13.40", 1.3 kg
Review » 所有三个戴尔XPS 13 Plus 9320 SKU的回顾。酷睿i5-1240P,i7-1260P,还是i7-1280P OLED?
Getac B360 G2: Intel Iris Xe Graphics G7 96EUs, 13.30", 2.3 kg
External Review » Getac B360 G2
MSI Prestige 13 Evo A12M: Intel Iris Xe Graphics G7 96EUs, 13.30", 1 kg
External Review » MSI Prestige 13 Evo A12M
Lenovo ThinkPad P16s G1, i7-1280P: NVIDIA T550 Laptop GPU, 16.00", 1.7 kg
External Review » Lenovo ThinkPad P16s G1, i7-1280P
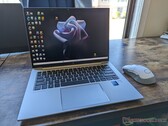
HP EliteBook 840 G9: Intel Iris Xe Graphics G7 96EUs, 14.00", 1.5 kg
External Review » HP EliteBook 840 G9
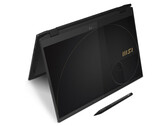
MSI Summit E13 Flip Evo A12MT-059RU: Intel Iris Xe Graphics G7 96EUs, 13.40", 1.4 kg
External Review » MSI Summit E13 Flip Evo A12MT-059RU
MSI Prestige 14 Evo A12M-248RU: Intel Iris Xe Graphics G7 96EUs, 14.00", 1.3 kg
External Review » MSI Prestige 14 Evo A12M-248RU
Lenovo Yoga 9 14IAP7-82LU007FGE: Intel Iris Xe Graphics G7 96EUs, 14.00", 1.4 kg
External Review » Lenovo Yoga 9 14IAP7-82LU007FGE
Lenovo ThinkPad X1 Nano Gen 2 Core i7-1280P: Intel Iris Xe Graphics G7 96EUs, 13.00", 1 kg
External Review » Lenovo ThinkPad X1 Nano Gen 2 Core i7-1280P
MSI Summit E16 Flip Evo A12MT: Intel Iris Xe Graphics G7 96EUs, 16.00", 1.9 kg
External Review » MSI Summit E16 Flip Evo A12MT
Lenovo Yoga Slim 9 14IAP7: Intel Iris Xe Graphics G7 96EUs, 14.00", 1.4 kg
External Review » Lenovo Yoga Slim 9 14IAP7
MSI Summit E13 Flip Evo A12MT-023: Intel Iris Xe Graphics G7 96EUs, 13.40", 1.4 kg
External Review » MSI Summit E13 Flip Evo A12MT-023
MSI Prestige 14 A12SC-086CA: NVIDIA GeForce GTX 1650 Mobile, 14.00", 1.6 kg
External Review » MSI Prestige 14 A12SC-086CA
MSI Stealth 17M A12UE: NVIDIA GeForce RTX 3060 Laptop GPU, 17.30", 2.2 kg
External Review » MSI Stealth 17M A12UE
MSI Prestige 14 Evo A12M-089: Intel Iris Xe Graphics G7 96EUs, 14.00", 1.3 kg
External Review » MSI Prestige 14 Evo A12M-089
MSI Summit E16 Flip A12UDT-031: NVIDIA GeForce RTX 3050 Ti Laptop GPU, 16.00", 1.9 kg
External Review » MSI Summit E16 Flip A12UDT-031
MSI Prestige 15 A12UD-049ES: NVIDIA GeForce RTX 3050 Ti Laptop GPU, 15.60", 1.7 kg
External Review » MSI Prestige 15 A12UD-049ES
Dell XPS 13 Plus 9320 i7-1280P FHD: Intel Iris Xe Graphics G7 96EUs, 13.40", 1.3 kg
External Review » Dell XPS 13 Plus 9320 i7-1280P FHD
Dell XPS 13 Plus 9320 i7-1280P OLED: Intel Iris Xe Graphics G7 96EUs, 13.40", 1.3 kg
External Review » Dell XPS 13 Plus 9320 i7-1280P OLED
MSI Prestige 14 A12UC, i7-1280P: NVIDIA GeForce RTX 3050 4GB Laptop GPU, 14.00", 1.3 kg
External Review » MSI Prestige 14 A12UC, i7-1280P
MSI Stealth 15M B12UE: NVIDIA GeForce RTX 3060 Laptop GPU, 15.60", 1.9 kg
External Review » MSI Stealth 15M B12UE
MSI Prestige 15 A12UC: NVIDIA GeForce RTX 3050 4GB Laptop GPU, 15.60", 1.7 kg
External Review » MSI Prestige 15 A12UC
MSI Prestige 15 A12UD-093: NVIDIA GeForce RTX 3050 Ti Laptop GPU, 15.60", 1.8 kg
External Review » MSI Prestige 15 A12UD-093
MSI Summit E14 Evo A12M-050: Intel Iris Xe Graphics G7 96EUs, 14.00", 1.6 kg
External Review » MSI Summit E14 Evo A12M-050
Please share our article, every link counts!
Other CPUs of the series Alder Lake-P
» Intel Core i5-12600H
12x 2 GHz - 4.5 GHz
Surrounding CPUs
+ AMD Ryzen 9 5980HS
8x 3 GHz - 4.8 GHz
- AMD Ryzen 7 7735H
8x 3.2 GHz - 4.75 GHz
Klaus Hinum (Update: 2022-04- 4)