


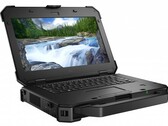
戴尔Latitude 7424 Rugged Extreme (i7-8650U, RX540) 笔记本电脑评测
Latitude 7424 Rugged Extreme绝对是坦克级别的。 Latitude 7424将一台高性能的计算机包裹在防尘防水的外壳中,可以毫不费力地对抗任何冲击。然而,这种耐用性的成本很高——首当其冲的便是重量和尺寸。
Intel Core i7-8650U, AMD Radeon RX 540, 14", 3.5 kg是基于Polaris 12芯片(最有可能)用于笔记本电脑的移动中档显卡。采用改进的14 nm FinFET工艺制造。性能应该在MacBook Pro 2016系列中同样基于Polaris架构的Radeon Pro 450和455之间。AMD以1.2 TFLOPS(Pro 450 1 TFLOP,Pro 455 1.3 TFLOP)定制RX 450。与英伟达显卡相比,游戏性能应该在GeForce GTX 950M和GTX 960M之间。
Radeon RX 540的特点和比它更快的RX 460以及所有其他Polaris芯片相同。 在这查看Polaris构架以获取更多细节。
根据AMD的博客文章,性能更好的Radeon Pro 460的功耗是35瓦。由于性能较差,Radeon RX 540的耗能略少。
Radeon RX 500 Series
| |||||||||||||||||||||||||||||||
| Codename | Polaris 12 | ||||||||||||||||||||||||||||||
| Architecture | Polaris | ||||||||||||||||||||||||||||||
| Pipelines | 512 - unified | ||||||||||||||||||||||||||||||
| Core Speed | 1219 (Boost) MHz | ||||||||||||||||||||||||||||||
| Memory Speed | 6000 MHz | ||||||||||||||||||||||||||||||
| Memory Bus Width | 128 Bit | ||||||||||||||||||||||||||||||
| Memory Type | GDDR5 | ||||||||||||||||||||||||||||||
| Max. Amount of Memory | 4 GB | ||||||||||||||||||||||||||||||
| Shared Memory | no | ||||||||||||||||||||||||||||||
| API | DirectX 12, OpenGL Vulkan | ||||||||||||||||||||||||||||||
| Power Consumption | 75 Watt | ||||||||||||||||||||||||||||||
| Man. Technology | 14 nm | ||||||||||||||||||||||||||||||
| Features | DisplayPort 1.3 HBR / 1.4 HDR Ready, HDMI 2.0, AMD FreeSync | ||||||||||||||||||||||||||||||
| Notebook Size | large | ||||||||||||||||||||||||||||||
| Date of Announcement | 21.03.2017 | ||||||||||||||||||||||||||||||
| Link to Manufacturer Page | www.amd.com | ||||||||||||||||||||||||||||||
The following benchmarks stem from our benchmarks of review laptops. The performance depends on the used graphics memory, clock rate, processor, system settings, drivers, and operating systems. So the results don't have to be representative for all laptops with this GPU. For detailed information on the benchmark results, click on the fps number.


For more games that might be playable and a list of all games and graphics cards visit our Gaming List
Dell Latitude 5424 Rugged: Intel Core i5-8350U, 14.00", 2.5 kg
External Review » Dell Latitude 5424 Rugged
Dell Latitude 5420 Rugged, 8650U, RX540: Intel Core i7-8650U, 14.00", 2.2 kg
External Review » Dell Latitude 5420 Rugged, 8650U, RX540
Dell Latitude 7424 Rugged Extreme: Intel Core i7-8650U, 14.00", 3.5 kg
External Review » Dell Latitude 7424 Rugged Extreme, 8650U, RX540
Lenovo IdeaPad 330-15ICN: Intel Core i3-8121U, 15.60", 2 kg
External Review » Lenovo IdeaPad 330-15ICN
Acer Swift 3 SF315-41G-R6BR: AMD Ryzen 5 2500U, 15.60", 2.2 kg
External Review » Acer Swift 3 SF315-41G-R6BR
Lenovo Ideapad 330S-15IKB-81F5009JMX: Intel Core i7-8550U, 15.60", 1.9 kg
External Review » Lenovo Ideapad 330S-15IKB-81F5009JMX
HP EliteBook 840 G5-3JY07ES: Intel Core i7-8550U, 14.00", 1.5 kg
External Review » HP EliteBook 840 G5-3JY07ES
HP EliteBook 850 G5-3RS15UT: Intel Core i7-8550U, 15.60", 1.8 kg
External Review » HP EliteBook 850 G5-3RS15UT
Acer Aspire 5 A515-41G-17E9: AMD FX-9800P, 15.60", 2.2 kg
External Review » Acer Aspire 5 A515-41G-17E9
Samsung Notebook 9 Pro NP940X5M: Intel Core i7-7500U, 15.00", 1.7 kg
External Review » Samsung Notebook 9 Pro NP940X5M-X01US
» Comparison of GPUs
Detailed list of all laptop GPUs sorted by class and performance.
» Benchmark List
Sort and restrict laptop GPUs based on performance in synthetic benchmarks.
» Notebook Gaming List
Playable games for each graphics card and their average FPS results.
* Approximate position of the graphics adapter
» Notebookcheck多媒体笔记本电脑Top 10排名
» Notebookcheck游戏笔记本电脑Top 10排名
» Notebookcheck低价办公/商务笔记本电脑Top 10排名
» Notebookcheck高端办公/商务笔记本电脑Top 10排名
» Notebookcheck工作站笔记本电脑Top 10排名
» Notebookcheck亚笔记本电脑Top 10排名
» Notebookcheck超级本产品Top 10排名
» Notebookcheck变形本产品Top 10排名
» Notebookcheck平板电脑Top 10排名
» Notebookcheck智能手机Top 10排名
» Notebookcheck评测过最出色的笔记本电脑屏幕
» Notebookcheck售价500欧元以下笔记本电脑Top 10排名
» Notebookcheck售价300欧元以下笔记本电脑Top 10排名