Notebookcheck Logo

NVIDIA GeForce RTX 3070 Laptop GPU

NVIDIA GeForce RTX 3070 Laptop GPU

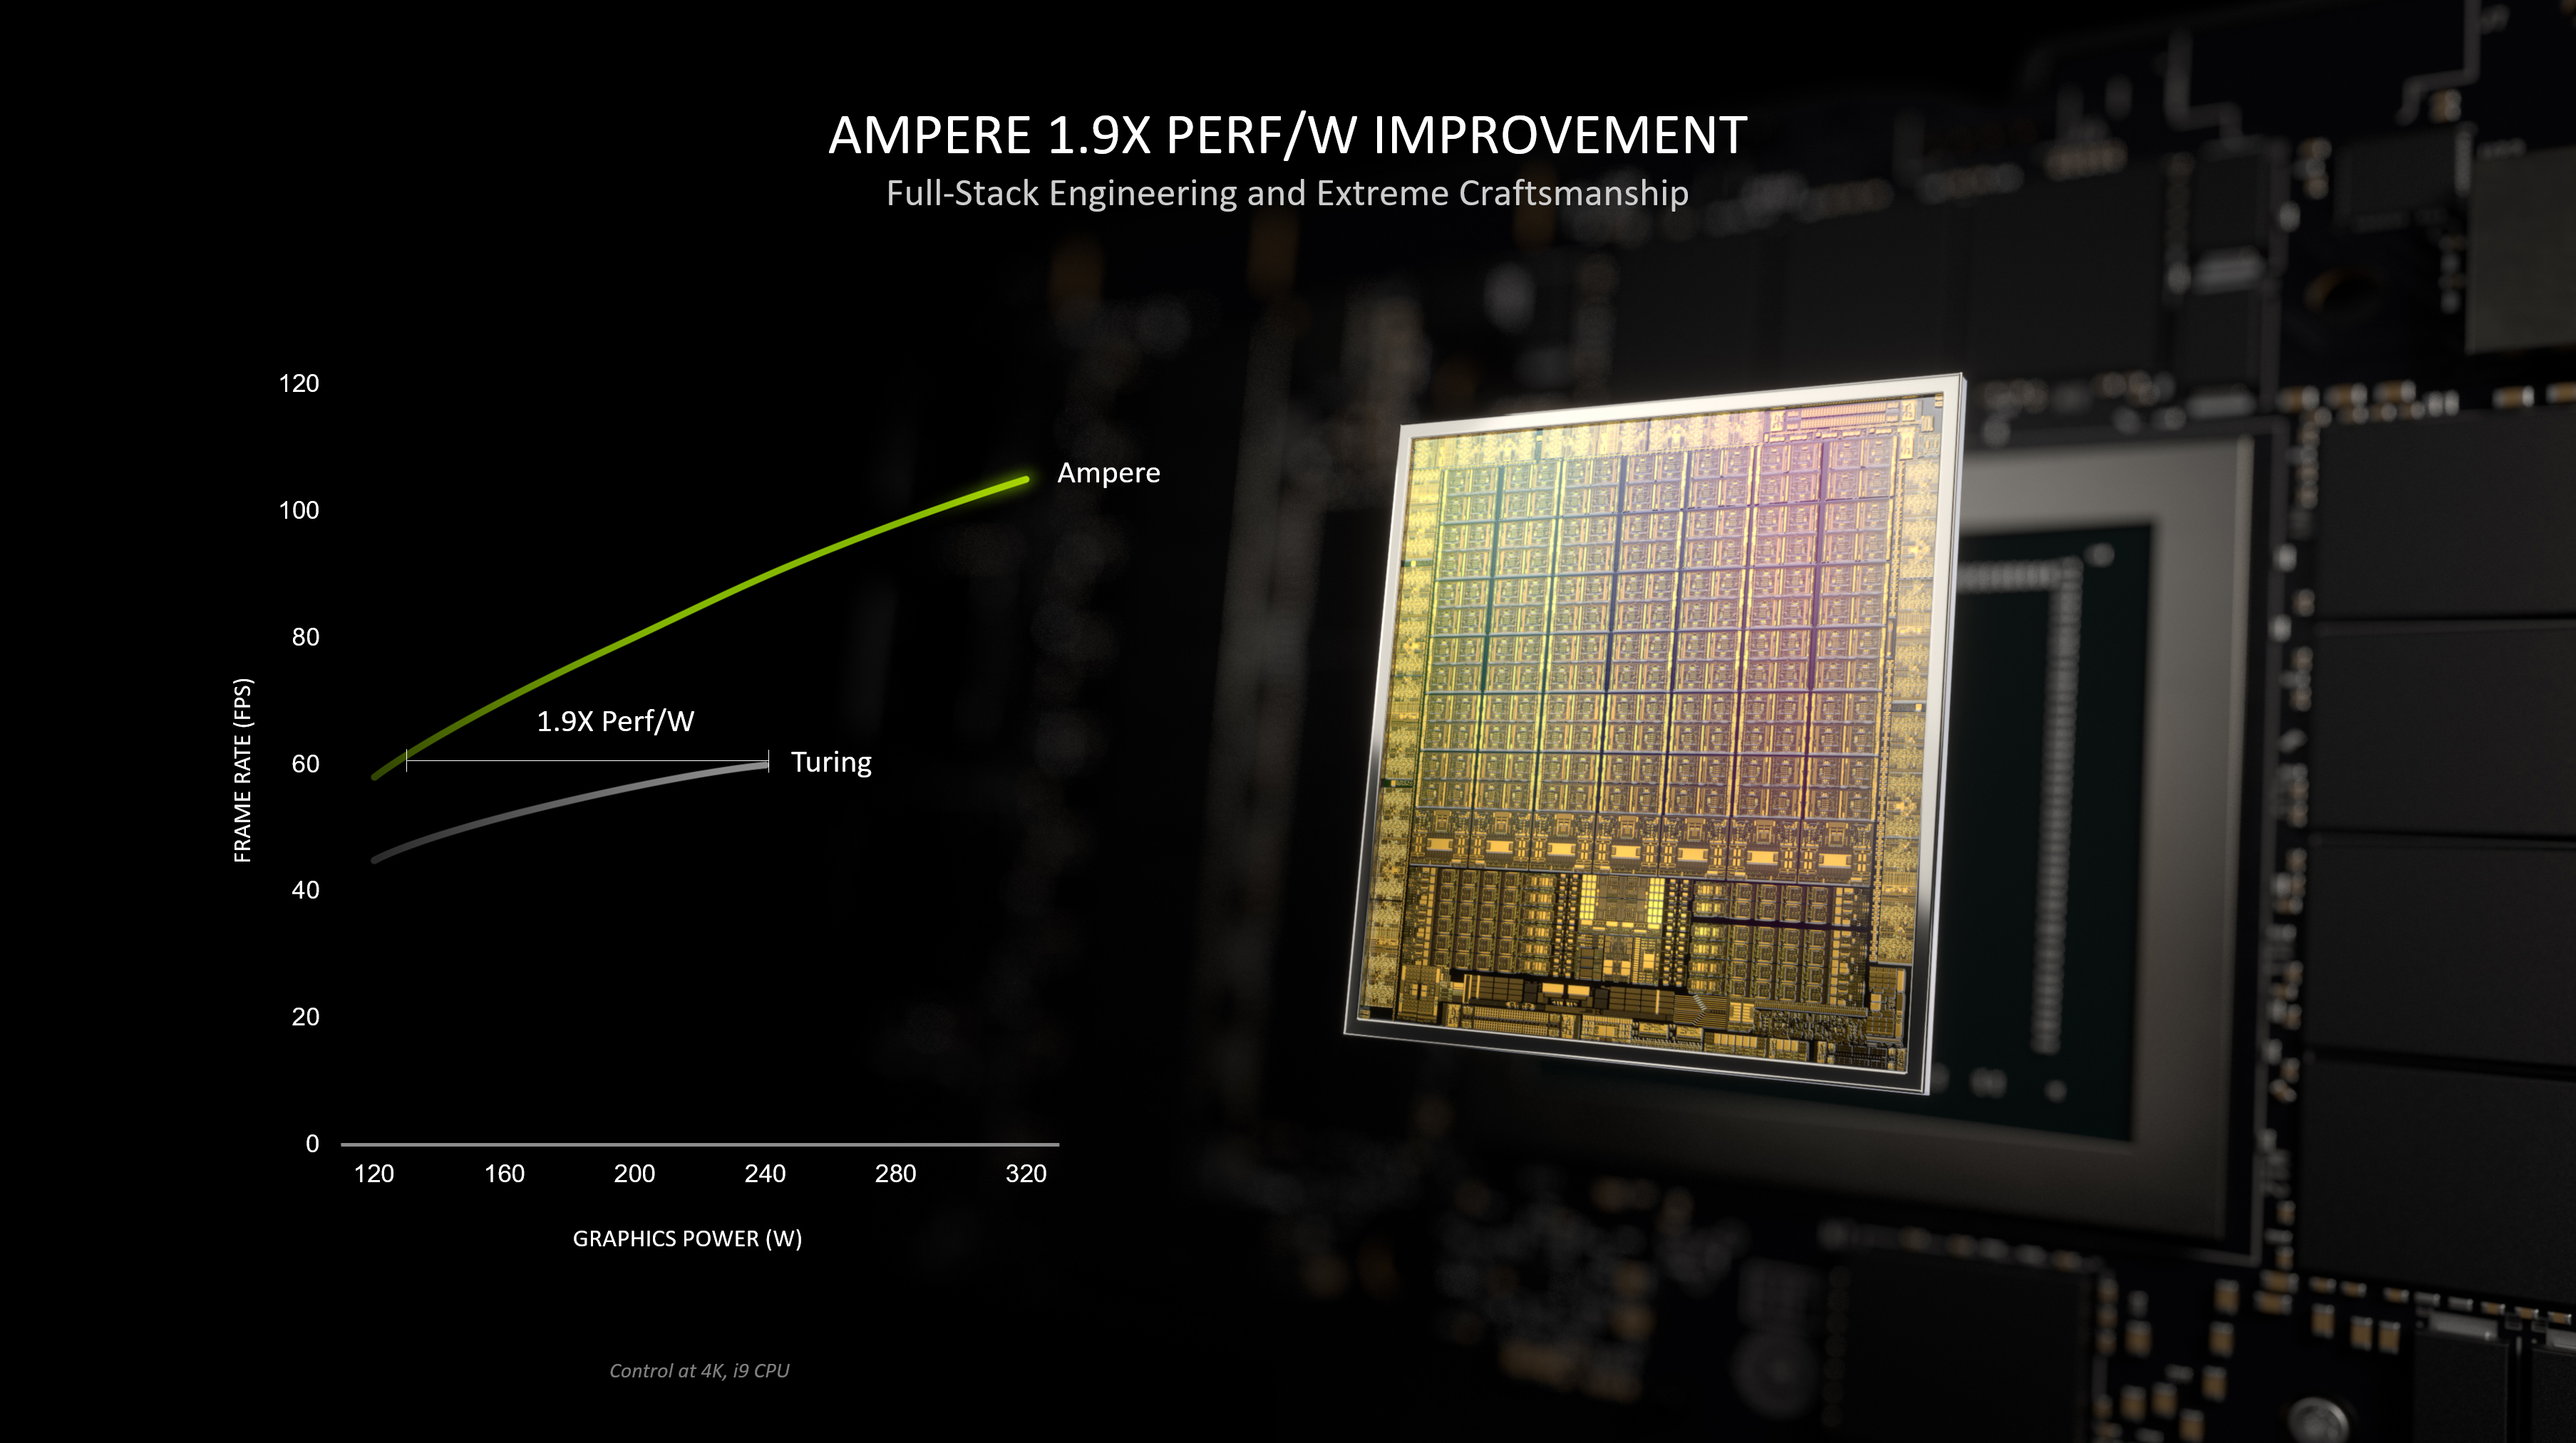
Nvidia GeForce RTX 3070 Mobile(适用于笔记本电脑、GN20-E5、Max-P、ID 249c/249d)是2021年初笔记本电脑第二快的安培显卡。 基于GA104-770-A1安培芯片,提供8GB GDDR6图形内存和256位内存总线。 支持PCIe 4.0,80~125瓦特(TGP)两种不同版本。 作为封装,笔记本电脑的显卡使用GB5-256,芯片大小为40x40mm。 GPU 支持 eDP 1.4b 连接内部监视器。

Max-Q 变体(以前用于低功耗变体),但所有 OEM 都可以选择实施 Max-Q 技术(动态 Boost、Whisper 模式)。

性能取决于笔记本电脑的TGP设置和冷却。 平均而言,与以前的RTX 2080 Super Mobile相似,因此最适合QHD-4K游戏。 类似的RTX 3070台式机卡速度非常快。

GA104芯片提供6,144个FP32ALU,其中一半可以执行INT32指令(3,072个INT32ALU)。 但是,RTX 3070不使用芯片上的所有ALU。 如果使用 Turing,则所有着色器都可以执行 FP32 或 INT32 指令。 Nvidia还改善了芯片上的光线跟踪和张量核。 RTX 3070移动系列使用6,144个内核中的5,120个。 安培芯片还包括改进的第 5代视频编码器 (H.264和 H.265的 NVENC)和第 7代解码器 (包括 AV1的各种格式 )。

GA104芯片由Samsung以8nm(8N)制造,与TSMC的7nm节点(AMD、专业GA100安培芯片等)相比,性能差很多。

GeForce RTX 3000 Series

NVIDIA GeForce RTX 3090 Ti 10752 @ 1.56 - 1.86 GHz384 Bit @ 21000 MHz
NVIDIA GeForce RTX 3090 10496 @ 1.4 - 1.7 GHz384 Bit @ 19500 MHz
NVIDIA GeForce RTX 3080 Ti 10240 @ 1.37 - 1.67 GHz384 Bit @ 19000 MHz
NVIDIA GeForce RTX 3080 12 GB 8960/ cores @ 1.26 - 1.71 GHz384 Bit @ 19000 MHz
NVIDIA GeForce RTX 3080 8704 @ 1.45 - 1.71 GHz320 Bit @ 19000 MHz
GeForce RTX 3070 Ti 6144 @ 1.58 - 1.77 GHz256 Bit @ 19000 MHz
GeForce RTX 3080 Ti Laptop GPU 7424 @ 0.98 - 1.59 GHz256 Bit @ 14000 MHz
NVIDIA GeForce RTX 3070 5888 @ 1.5 - 1.73 GHz256 Bit @ 14000 MHz
GeForce RTX 3080 Laptop GPU 6144 @ 0.78 - 1.25 GHz256 Bit @ 14000 MHz
NVIDIA GeForce RTX 3060 Ti 4864 @ 1.41 - 1.67 GHz256 Bit @ 14000 MHz
GeForce RTX 3070 Ti Laptop GPU 5888 @ 0.92 - 1.48 GHz256 Bit @ 14000 MHz
GeForce RTX 3070 Laptop GPU 5120 @ 0.78 - 1.29 GHz256 Bit @ 14000 MHz
GeForce RTX 3080 Max-Q 6144 @ 0.78 - 1.25 GHz256 Bit @ 6000 MHz
NVIDIA GeForce RTX 3060 3584 @ 1.32 - 1.78 GHz192 Bit @ 15000 MHz
GeForce RTX 3070 Max-Q 5120 @ 1.29 GHz256 Bit
GeForce RTX 3060 Laptop GPU 3840 @ 0.82 - 1.7 GHz192 Bit @ 14000 MHz
GeForce RTX 3060 Max-Q 3840 @ 1.28 GHz192 Bit
NVIDIA GeForce RTX 3050 2560 @ 1.55 - 1.78 GHz128 Bit Bit @ 1750 MHz
GeForce RTX 3050 Ti Laptop GPU 2560 @ 1.22 - 1.49 GHz128 Bit @ 12000 MHz
GeForce RTX 3050 6GB Laptop GPU 2560 @ 1.24 - 1.49 GHz96 Bit @ 12000 MHz
GeForce RTX 3050 4GB Laptop GPU 2048 @ 1.24 - 1.5 GHz128 Bit @ 12000 MHz
CodenameGN20-E5 GA104
ArchitectureAmpere
Pipelines5120 - unified
TMUs160
ROPs96
Raytracing Cores40
Tensor / AI Cores160
Core Speed780 - 1100 - 1290 - 1620 (Boost) MHz
Memory Speed14000 effective = 1750 MHz
Memory Bus Width256 Bit
Memory TypeGDDR6
Max. Amount of Memory8 GB
Shared Memoryno
Memory Bandwidth448 GB/s
APIDirectX 12_2, Shader 6.7, OpenGL 4.6
Power Consumption125 Watt (80 - 125 Watt TGP)
technology8 nm
PCIe4.0
DisplaysHDMI 2.1, DisplayPort 1.4a
FeaturesNVIDIA DLSS, NVIDIA Reflex, Resizable BAR, NVIDIA Broadcast, NVIDIA Ansel, NVIDIA ShadowPlay®, NVIDIA G-SYNC®, Advanced Optimus, Nvidia Max-Q, Dynamic Boost
Notebook Sizelarge
Date of Announcement04.01.2021

Benchmarks

Performance Rating - 3DMark 11 + Fire Strike + Time Spy
11.6 pt (35%)
3DMark - 3DMark Time Spy Score
min: 2952     avg: 9246     median: 9681 (28%)     max: 10872 Points
3DMark - 3DMark Time Spy Graphics
min: 2644     avg: 9300     median: 9619 (25%)     max: 11019 Points
Intel UHD Graphics 605
113 -99%
...
8210 -12%
NVIDIA GeForce RTX 2070 Super Mobile
8238 -11%
8316 -11%
8334 -10%
8700 -6%
8798 -5%
8989 -3%
9033 -3%
9164 -1%
NVIDIA GeForce RTX 3070 Laptop GPU
9300
9332 0%
9443 2%
9652 4%
9785 5%
10043 8%
10046 8%
10206 10%
NVIDIA GeForce RTX 2080 Super Mobile
10301 11%
10455 12%
...
19434 109%
max:
36485 292%
0%
100%
3DMark - 3DMark Ice Storm Unlimited Graphics
min: 386399     avg: 506983     median: 510435 (58%)     max: 586342 Points
3DMark - 3DMark Ice Storm Extreme Graphics
min: 199308     avg: 361585     median: 399566 (51%)     max: 447899 Points
3DMark - 3DMark Cloud Gate Score
min: 29530     avg: 48192     median: 49493 (53%)     max: 59798 Points
3DMark - 3DMark Cloud Gate Graphics
min: 45531     avg: 121367     median: 136558 (36%)     max: 179716 Points
3DMark - 3DMark Fire Strike Standard Score
min: 6019     avg: 20668     median: 21167 (37%)     max: 24431 Points
3DMark - 3DMark Fire Strike Standard Graphics
min: 7178     avg: 24302     median: 25477.5 (29%)     max: 29128 Points
3DMark - 3DMark Ice Storm Graphics
min: 200537     avg: 393010     median: 434822 (52%)     max: 501858 Points
3DMark - 3DMark Wild Life Unlimited
min: 55454     avg: 61652     median: 62900 (32%)     max: 67085 Points
3DMark - 3DMark Wild Life Extreme Unlimited
min: 17126     avg: 19749     median: 20212 (23%)     max: 21693 Points
3DMark - 3DMark Night Raid
min: 43141     avg: 49981     median: 51466.5 (49%)     max: 53851 Points
3DMark - 3DMark Night Raid Graphics Score
min: 76506     avg: 91144     median: 89814.5 (35%)     max: 108442 Points
3DMark 11 - 3DM11 Performance Score
min: 8279     avg: 25052     median: 26152 (36%)     max: 30240 Points
3DMark 11 - 3DM11 Performance GPU
min: 12535     avg: 32331     median: 33996 (29%)     max: 38275 Points
171.8 -99%
...
27852 -14%
NVIDIA GeForce GTX 1080 Mobile
28106 -13%
28539 -12%
28692 -11%
28847 -11%
NVIDIA GeForce RTX 2070 Super Mobile
29416 -9%
29663 -8%
30077 -7%
31142 -4%
NVIDIA GeForce RTX 3070 Laptop GPU
32331
32662 1%
32846 2%
33169 3%
33497 4%
34188 6%
34335 6%
34842 8%
NVIDIA GeForce RTX 2080 Super Mobile
35153 9%
35286 9%
...
59943 85%
max:
106023 228%
0%
100%
3DMark Vantage
3DM Vant. Perf. total +
3DMark Vantage - 3DM Vant. Perf. total
min: 76594     avg: 77148     median: 77147.5 (22%)     max: 77701 Points
3DM Vant. Perf. GPU no PhysX +
3DMark Vantage - 3DM Vant. Perf. GPU no PhysX
min: 83124     avg: 85013     median: 85012.5 (48%)     max: 86901 Points
ATI Radeon HD 3200
62 -100%
...
74946 -12%
NVIDIA GeForce RTX 2070 Super Mobile
75429 -11%
76250 -10%
NVIDIA GeForce RTX 2080 Super Mobile
77180 -9%
77533 -9%
77766 -9%
80346 -5%
80643 -5%
82368 -3%
NVIDIA GeForce RTX 3070 Laptop GPU
85013
85672 1%
86536 2%
88394 4%
88465 4%
93680 10%
96677 14%
102426 20%
106532 25%
129977 53%
...
132443 56%
max:
170928 101%
0%
100%
3DMark 05 - 3DMark 05 - Standard
min: 46264     avg: 46269     median: 46268.5 (51%)     max: 46273 Points
Intel Graphics Media Accelerator (GMA) 500
133.4 -100%
...
36878 -20%
NVIDIA GeForce GTX 1080 Mobile
37669 -19%
AMD Radeon RX Vega 7
38073 -18%
38999 -16%
39066 -16%
42967 -7%
43138 -7%
AMD Radeon 680M
43450 -6%
AMD Radeon 660M
43616 -6%
NVIDIA GeForce RTX 3070 Laptop GPU
46269
48758 5%
50571 9%
50971 10%
52117 13%
53254 15%
54967 19%
55811 21%
61850 34%
max:
87172 88%
0%
100%
3DMark 06 3DMark 06 - Standard 1280x1024 +
3DMark 06
min: 45160     avg: 47013     median: 47262 (62%)     max: 47801 Points
Unigine Valley 1.0 - Unigine Valley 1.0 DX
min: 120.9     avg: 126.3     median: 126.3 (41%)     max: 131.6 fps
Blender - Blender 3.3 Classroom CUDA *
min: 43     avg: 59.1     median: 47 (7%)     max: 168 Seconds
Blender - Blender 3.3 Classroom OPTIX *
min: 26     avg: 40.9     median: 29 (11%)     max: 142 Seconds
SPECviewperf 12
specvp12 sw-03 +
SPECviewperf 12 - specvp12 sw-03
min: 68.6     avg: 72.4     median: 69.1 (17%)     max: 79.4 fps
specvp12 snx-02 +
SPECviewperf 12 - specvp12 snx-02
min: 10.48     avg: 11.1     median: 11.1 (2%)     max: 11.7 fps
specvp12 showcase-01 +
SPECviewperf 12 - specvp12 showcase-01
min: 102     avg: 125.3     median: 136 (30%)     max: 138 fps
specvp12 mediacal-01 +
SPECviewperf 12 - specvp12 mediacal-01
min: 40.43     avg: 51.1     median: 55.7 (14%)     max: 57.2 fps
specvp12 maya-04 +
SPECviewperf 12 - specvp12 maya-04
min: 108     avg: 173     median: 199 (54%)     max: 212 fps
specvp12 energy-01 +
SPECviewperf 12 - specvp12 energy-01
min: 10.01     avg: 11.6     median: 12.1 (11%)     max: 12.8 fps
specvp12 creo-01 +
SPECviewperf 12 - specvp12 creo-01
min: 54     avg: 56.1     median: 55.4 (22%)     max: 59 fps
specvp12 catia-04 +
SPECviewperf 12 - specvp12 catia-04
min: 93.4     avg: 105.5     median: 108 (18%)     max: 115 fps
specvp12 3dsmax-05 +
SPECviewperf 12 - specvp12 3dsmax-05
min: 230     avg: 231.5     median: 231.5 (41%)     max: 233 fps
SPECviewperf 13 specvp13 sw-04 +
SPECviewperf 13 - specvp13 sw-04
min: 78.8     avg: 100     median: 100.8 (27%)     max: 113.7 fps
specvp13 snx-03 +
SPECviewperf 13 - specvp13 snx-03
min: 17.36     avg: 20     median: 19.5 (2%)     max: 22.8 fps
specvp13 showcase-02 +
SPECviewperf 13 - specvp13 showcase-02
min: 100.3     avg: 123.8     median: 129.9 (28%)     max: 138 fps
specvp13 medical-02 +
SPECviewperf 13 - specvp13 medical-02
min: 56.8     avg: 64.8     median: 66.3 (14%)     max: 69.5 fps
specvp13 maya-05 +
SPECviewperf 13 - specvp13 maya-05
min: 186     avg: 273.5     median: 289.3 (33%)     max: 337 fps
specvp13 energy-02 +
SPECviewperf 13 - specvp13 energy-02
min: 21.17     avg: 24.3     median: 24.8 (8%)     max: 26.5 fps
specvp13 creo-02 +
SPECviewperf 13 - specvp13 creo-02
min: 143     avg: 191.2     median: 203.2 (30%)     max: 225 fps
specvp13 catia-05 +
SPECviewperf 13 - specvp13 catia-05
min: 126     avg: 146.4     median: 150.8 (17%)     max: 163 fps
specvp13 3dsmax-06 +
SPECviewperf 13 - specvp13 3dsmax-06
min: 151     avg: 208.7     median: 214.3 (37%)     max: 243.43 fps
SPECviewperf 2020 specvp2020 solidworks-05 1080p +
SPECviewperf 2020 - specvp2020 solidworks-05 1080p
min: 130     avg: 152.8     median: 152.8 (30%)     max: 175.5 fps
specvp2020 snx-04 1080p +
SPECviewperf 2020 - specvp2020 snx-04 1080p
min: 17.03     avg: 19.7     median: 18.7 (3%)     max: 22.9 fps
specvp2020 medical-03 1080p +
SPECviewperf 2020 - specvp2020 medical-03 1080p
min: 27.94     avg: 31.8     median: 32.4 (35%)     max: 35.1 fps
specvp2020 maya-06 1080p +
SPECviewperf 2020 - specvp2020 maya-06 1080p
min: 184     avg: 295.2     median: 289.7 (42%)     max: 371.1 fps
specvp2020 energy-03 1080p +
SPECviewperf 2020 - specvp2020 energy-03 1080p
min: 22.47     avg: 24.5     median: 24.3 (20%)     max: 26.7 fps
specvp2020 creo-03 1080p +
SPECviewperf 2020 - specvp2020 creo-03 1080p
min: 64.2     avg: 81.2     median: 86.1 (42%)     max: 92.3 fps
specvp2020 catia-06 1080p +
SPECviewperf 2020 - specvp2020 catia-06 1080p
min: 54.9     avg: 59.9     median: 61.1 (39%)     max: 64 fps
specvp2020 3dsmax-07 1080p +
SPECviewperf 2020 - specvp2020 3dsmax-07 1080p
min: 74.2     avg: 102.3     median: 107.1 (49%)     max: 114.4 fps
specvp2020 solidworks-05 4k +
SPECviewperf 2020 - specvp2020 solidworks-05 4k
min: 82.9     avg: 98.6     median: 106 (31%)     max: 107 fps
specvp2020 snx-04 4k +
SPECviewperf 2020 - specvp2020 snx-04 4k
min: 14.36     avg: 16.1     median: 16.5 (2%)     max: 17.3 fps
specvp2020 medical-03 4k +
SPECviewperf 2020 - specvp2020 medical-03 4k
min: 9.93     avg: 10.6     median: 10.8 (10%)     max: 11 fps
specvp2020 maya-06 4k +
SPECviewperf 2020 - specvp2020 maya-06 4k
min: 138.6     avg: 184.9     median: 206 (34%)     max: 210 fps
specvp2020 energy-03 4k +
SPECviewperf 2020 - specvp2020 energy-03 4k
min: 19.7     avg: 25     median: 20.1 (4%)     max: 35.24 fps
specvp2020 creo-03 4k +
SPECviewperf 2020 - specvp2020 creo-03 4k
min: 56.1     avg: 70     median: 75.5 (36%)     max: 78.3 fps
specvp2020 catia-06 4k +
SPECviewperf 2020 - specvp2020 catia-06 4k
min: 32.27     avg: 35.2     median: 36.4 (24%)     max: 37 fps
specvp2020 3dsmax-07 4k +
SPECviewperf 2020 - specvp2020 3dsmax-07 4k
min: 64     avg: 70.8     median: 72.1 (30%)     max: 76.4 fps
Cinebench R10 Cinebench R10 Shading (32bit) +
Cinebench R10 - Cinebench R10 Shading (32bit)
min: 6830     avg: 10573     median: 6836 (5%)     max: 18053 points
Cinebench R11.5 Cinebench R11.5 OpenGL 64 Bit +
Cinebench R11.5 - Cinebench R11.5 OpenGL 64 Bit
min: 135.85     avg: 141.5     median: 136.9 (47%)     max: 151.58 fps
Cinebench R15
Cinebench R15 OpenGL 64 Bit +
Cinebench R15 - Cinebench R15 OpenGL 64 Bit
min: 50.2     avg: 177.6     median: 175.7 (10%)     max: 264 fps
Cinebench R15 OpenGL Ref. Match 64 Bit +
Cinebench R15 - Cinebench R15 OpenGL Ref. Match 64 Bit
99.6 % (100%)
Basemark GPU 1.2 - Basemark GPU 1.2 Vulkan Official Medium Offscreen 1080
985 fps (6%)
Geekbench 6.2 - Geekbench 6.2 GPU OpenCL
min: 101720     avg: 102040     median: 102040 (30%)     max: 102359 points
Geekbench 6.2 - Geekbench 6.2 GPU Vulkan
min: 89822     avg: 93980     median: 93979.5 (31%)     max: 98137 points
Power Consumption - Furmark Stress Test Power Consumption - external Monitor *
min: 120     avg: 165.6     median: 166.8 (24%)     max: 238 Watt
0153045607590105120135150165180195210225240Tooltip
Power Consumption - The Witcher 3 Power Consumption - external Monitor *
min: 125     avg: 166.6     median: 161 (22%)     max: 231 Watt
0153045607590105120135150165180195210225Tooltip
Power Consumption - Witcher 3 Power Consumption *
min: 121     avg: 171.7     median: 167 (37%)     max: 233 Watt
0153045607590105120135150165180195210225Tooltip
Power Consumption - Witcher 3 ultra Power Efficiency
min: 0.4146     avg: 0.6     median: 0.6 (55%)     max: 0.671 fps per Watt
Power Consumption - Witcher 3 ultra Power Efficiency - external Monitor
min: 0.4182     avg: 0.6     median: 0.6 (48%)     max: 0.736 fps per Watt
Emissions Witcher 3 Fan Noise +
Emissions - Witcher 3 Fan Noise
min: 42     avg: 49.6     median: 49.2 (79%)     max: 57 dB(A)
Clock Speed - GPU Clock Witcher 3 ultra
min: 1365     avg: 1620     median: 1657.5 (65%)     max: 1830 MHz
Clock Speed - GPU Clock Speed Furmark
1275 MHz (51%)
- Range of benchmark values for this graphics card
- Average benchmark values for this graphics card
* Smaller numbers mean a higher performance

Game Benchmarks

The following benchmarks stem from our benchmarks of review laptops. The performance depends on the used graphics memory, clock rate, processor, system settings, drivers, and operating systems. So the results don't have to be representative for all laptops with this GPU. For detailed information on the benchmark results, click on the fps number.

Dragon's Dogma 2

Dragon's Dogma 2

2024
low 1920x1080
54.2  fps    + Compare + 📈 Graph
high 1920x1080
52.7  fps    + Compare + 📈 Graph
QHD 2560x1440
49.3  fps    + Compare + 📈 Graph
4K 3840x2160
33.9  fps    + Compare + 📈 Graph
3840x2160
38.7  fps    + Compare + 📈 Graph
3840x2160
37.5  fps    + Compare + 📈 Graph
» With all tested laptops playable in detail settings high.
Additional Benchmarks
Low Preset 1280x720
57.3
Horizon Forbidden West

Horizon Forbidden West

2024
low 1920x1080
104.2  fps    + Compare + 📈 Graph
med. 1920x1080
96.2  fps    + Compare + 📈 Graph
high 1920x1080
62.7  fps    + Compare + 📈 Graph
ultra 1920x1080
60.5  fps    + Compare + 📈 Graph
QHD 2560x1440
47  fps    + Compare + 📈 Graph
4K 3840x2160
29.3  fps    + Compare + 📈 Graph
3840x2160
42.2  fps    + Compare + 📈 Graph
3840x2160
38.8  fps    + Compare + 📈 Graph
» With all tested laptops playable in detail settings ultra.
Additional Benchmarks
Very Low Preset 1280x720
134.8
Alone in the Dark

Alone in the Dark

2024
low 1920x1080
172.9  fps    + Compare + 📈 Graph
med. 1920x1080
156.8  fps    + Compare + 📈 Graph
high 1920x1080
149.9  fps    + Compare + 📈 Graph
ultra 1920x1080
102.4  fps    + Compare + 📈 Graph
QHD 2560x1440
51.5  fps    + Compare + 📈 Graph
4K 3840x2160
16.1  fps    + Compare + 📈 Graph
3840x2160
36.7  fps    + Compare + 📈 Graph
3840x2160
53.1  fps    + Compare + 📈 Graph
» With all tested laptops playable in detail settings ultra.
Additional Benchmarks
Low Preset 1280x720
171.8
Last Epoch

Last Epoch

2024
low 1920x1080
192.2  fps    + Compare + 📈 Graph
med. 1920x1080
184.2  fps    + Compare + 📈 Graph
high 1920x1080
167.2  fps    + Compare + 📈 Graph
ultra 1920x1080
127.3  fps    + Compare + 📈 Graph
QHD 2560x1440
83.6  fps    + Compare + 📈 Graph
4K 3840x2160
40.7  fps    + Compare + 📈 Graph
» With all tested laptops playable in detail settings ultra.
Additional Benchmarks
Very Low Preset 1280x720
207
Skull & Bones

Skull & Bones

2024
low 1920x1080
112  fps    + Compare
med. 1920x1080
103  fps    + Compare
high 1920x1080
84  fps    + Compare
ultra 1920x1080
63  fps    + Compare
QHD 2560x1440
50  fps    + Compare
4K 3840x2160
31  fps    + Compare
3840x2160
46  fps    + Compare
3840x2160
43  fps    + Compare
» With all tested laptops playable in detail settings ultra.
Additional Benchmarks
Low Preset TAA 1280x720
131
Helldivers 2

Helldivers 2

2024
low 1920x1080
130  fps    + Compare + 📈 Graph
med. 1920x1080
101  fps    + Compare + 📈 Graph
high 1920x1080
91.3  fps    + Compare + 📈 Graph
ultra 1920x1080
89.5  fps    + Compare + 📈 Graph
QHD 2560x1440
65.6  fps    + Compare + 📈 Graph
4K 3840x2160
35.3  fps    + Compare + 📈 Graph
» With all tested laptops playable in detail settings ultra.
Additional Benchmarks
Low Preset 1280x720
129.4
Enshrouded

Enshrouded

2024
low 1920x1080
80.3  fps    + Compare + 📈 Graph
med. 1920x1080
68.8  fps    + Compare + 📈 Graph
high 1920x1080
58.8  fps    + Compare + 📈 Graph
ultra 1920x1080
49.2  fps    + Compare + 📈 Graph
QHD 2560x1440
38  fps    + Compare + 📈 Graph
4K 3840x2160
22.8  fps    + Compare + 📈 Graph
3840x2160
34  fps    + Compare + 📈 Graph
3840x2160
32.8  fps    + Compare + 📈 Graph
» With all tested laptops playable in detail settings ultra.
Additional Benchmarks
Max. Performance 1280x720
127.4
Palworld

Palworld

2024
low 1920x1080
116.7  fps    + Compare + 📈 Graph
med. 1920x1080
106.1  fps    + Compare + 📈 Graph
high 1920x1080
103  fps    + Compare + 📈 Graph
ultra 1920x1080
102.1  fps    + Compare + 📈 Graph
QHD 2560x1440
72.9  fps    + Compare + 📈 Graph
4K 3840x2160
38.7  fps    + Compare + 📈 Graph
3840x2160
54.9  fps    + Compare + 📈 Graph
» With all tested laptops playable in detail settings ultra.
Additional Benchmarks
Very Low Preset 1280x720
119.4
Prince of Persia The Lost Crown

Prince of Persia The Lost Crown

2024
med. 1920x1080
356  fps    + Compare + 📈 Graph
high 1920x1080
356  fps    + Compare + 📈 Graph
ultra 1920x1080
356  fps    + Compare + 📈 Graph
QHD 2560x1440
340  fps    + Compare + 📈 Graph
4K 3840x2160
178  fps    + Compare + 📈 Graph
» With all tested laptops playable in detail settings ultra.
Ready or Not

Ready or Not

2023
low 1920x1080
210  fps    + Compare + 📈 Graph
med. 1920x1080
189.1  fps    + Compare + 📈 Graph
high 1920x1080
174.8  fps    + Compare + 📈 Graph
ultra 1920x1080
131.3  fps    + Compare + 📈 Graph
QHD 2560x1440
82  fps    + Compare + 📈 Graph
4K 3840x2160
37.2  fps    + Compare + 📈 Graph
3840x2160
75.1  fps    + Compare + 📈 Graph
» With all tested laptops playable in detail settings ultra.
The Finals

The Finals

2023
low 1920x1080
222  fps    + Compare + 📈 Graph
med. 1920x1080
181.7  fps    + Compare + 📈 Graph
high 1920x1080
160.6  fps    + Compare + 📈 Graph
ultra 1920x1080
127.2  fps    + Compare + 📈 Graph
QHD 2560x1440
80.2  fps    + Compare + 📈 Graph
4K 3840x2160
37.6  fps    + Compare + 📈 Graph
» With all tested laptops playable in detail settings ultra.
Additional Benchmarks
Low Preset 1280x720
229
Epic Preset + Epic RTX Global Illumination 1920x1080
119.9
Avatar Frontiers of Pandora

Avatar Frontiers of Pandora

2023
low 1920x1080
76  fps    + Compare
med. 1920x1080
72  fps    + Compare
high 1920x1080
61  fps    + Compare
ultra 1920x1080
46  fps    + Compare
QHD 2560x1440
31  fps    + Compare
4K 3840x2160
16  fps    + Compare
3840x2160
28  fps    + Compare
» With all tested laptops playable in detail settings ultra.
Additional Benchmarks
Low Preset TAA 1280x720
114
Call of Duty Modern Warfare 3 2023

Call of Duty Modern Warfare 3 2023

2023
low 1920x1080
146  fps    + Compare
med. 1920x1080
129  fps    + Compare
high 1920x1080
101  fps    + Compare
ultra 1920x1080
83  fps    + Compare
QHD 2560x1440
67  fps    + Compare
4K 3840x2160
43  fps    + Compare
3840x2160
46  fps    + Compare
» With all tested laptops playable in detail settings ultra.
Additional Benchmarks
Minimum Preset 1280x720
206
EA Sports WRC

EA Sports WRC

2023
low 1920x1080
130.8  fps    + Compare + 📈 Graph
med. 1920x1080
98.1  fps    + Compare + 📈 Graph
high 1920x1080
90.7  fps    + Compare + 📈 Graph
ultra 1920x1080
83.4  fps    + Compare + 📈 Graph
QHD 2560x1440
63.2  fps    + Compare + 📈 Graph
4K 3840x2160
35.5  fps    + Compare + 📈 Graph
3840x2160
52.5  fps    + Compare + 📈 Graph
» With all tested laptops playable in detail settings ultra.
Additional Benchmarks
Ultra Low Preset LowAA 1280x720
181.5
Alan Wake 2

Alan Wake 2

2023
low 1920x1080
67  fps    + Compare + 📈 Graph
med. 1920x1080
61.2  fps    + Compare + 📈 Graph
high 1920x1080
53.2  fps    + Compare + 📈 Graph
QHD 2560x1440
33.6  fps    + Compare + 📈 Graph
4K 3840x2160
14.1  fps    + Compare + 📈 Graph
» With all tested laptops playable in detail settings high.
Additional Benchmarks
Low Preset 1280x720
98.7
High Preset + High Ray Tracing 1920x1080
4.7
Lords of the Fallen

Lords of the Fallen

2023
low 1920x1080
68  fps    + Compare + 📈 Graph
med. 1920x1080
68.1  fps    + Compare + 📈 Graph
high 1920x1080
65.2  fps    + Compare + 📈 Graph
ultra 1920x1080
53.9  fps    + Compare + 📈 Graph
QHD 2560x1440
54.6  fps    + Compare + 📈 Graph
4K 3840x2160
34  fps    + Compare + 📈 Graph
3840x2160
26.1  fps    + Compare + 📈 Graph
» With all tested laptops playable in detail settings ultra.
Additional Benchmarks
Low Preset 1280x720
82.6
Total War Pharaoh

Total War Pharaoh

2023
low 1920x1080
329.3  fps    + Compare
med. 1920x1080
205.4  fps    + Compare
high 1920x1080
127.1  fps    + Compare
ultra 1920x1080
99.1  fps    + Compare
QHD 2560x1440
78.3  fps    + Compare
4K 3840x2160
42.5  fps    + Compare
» With all tested laptops playable in detail settings ultra.
Additional Benchmarks
Low Preset 1280x720
368.7
Assassin's Creed Mirage

Assassin's Creed Mirage

2023
low 1920x1080
114  fps    + Compare
med. 1920x1080
106  fps    + Compare
high 1920x1080
101  fps    + Compare
ultra 1920x1080
79  fps    + Compare
QHD 2560x1440
64  fps    + Compare
4K 3840x2160
41  fps    + Compare
3840x2160
52  fps    + Compare
» With all tested laptops playable in detail settings ultra.
Additional Benchmarks
Low Preset (Adaptive Quality Off) 1280x720
150
EA Sports FC 24

EA Sports FC 24

2023
low 1920x1080
249  fps    + Compare + 📈 Graph
med. 1920x1080
199.3  fps    + Compare + 📈 Graph
high 1920x1080
161.7  fps    + Compare + 📈 Graph
ultra 1920x1080
151.4  fps    + Compare + 📈 Graph
QHD 2560x1440
129  fps    + Compare + 📈 Graph
4K 3840x2160
79.5  fps    + Compare + 📈 Graph
» With all tested laptops playable in detail settings ultra.
Additional Benchmarks
Low Preset 1280x720
256
Counter-Strike 2

Counter-Strike 2

2023
low 1920x1080
241  fps    + Compare + 📈 Graph
med. 1920x1080
230  fps    + Compare + 📈 Graph
high 1920x1080
193.8  fps    + Compare + 📈 Graph
ultra 1920x1080
149.5  fps    + Compare + 📈 Graph
QHD 2560x1440
105.9  fps    + Compare + 📈 Graph
4K 3840x2160
63.3  fps    + Compare + 📈 Graph
» With all tested laptops playable in detail settings ultra.
Additional Benchmarks
Low Preset 1280x720
246
Cyberpunk 2077 2.0 Phantom Liberty

Cyberpunk 2077 2.0 Phantom Liberty

2023
low 1920x1080
122.9  fps    + Compare
med. 1920x1080
99.3  fps    + Compare
high 1920x1080
84.8  fps    + Compare
ultra 1920x1080
75  fps    + Compare
QHD 2560x1440
46.9  fps    + Compare
4K 3840x2160
20.9  fps    + Compare
» With all tested laptops playable in detail settings ultra.
Additional Benchmarks
Low Preset (FSR off) 1280x720
140.5
Ray Tracing Ultra Preset (DLSS off) 1920x1080
31.6
Steam Deck 1280x720
135
Ultra Preset (FSR on) 1920x1080
89.8
Lies of P

Lies of P

2023
low 1920x1080
160.7  fps    + Compare + 📈 Graph
med. 1920x1080
152  fps    + Compare + 📈 Graph
high 1920x1080
130.2  fps    + Compare + 📈 Graph
ultra 1920x1080
117.1  fps    + Compare + 📈 Graph
QHD 2560x1440
80.2  fps    + Compare + 📈 Graph
4K 3840x2160
41.6  fps    + Compare + 📈 Graph
3840x2160
65  fps    + Compare + 📈 Graph
» With all tested laptops playable in detail settings ultra.
Additional Benchmarks
Low Preset 1280x720
217
Starfield

Starfield

2023
low 1920x1080
73.5  fps    + Compare + 📈 Graph
med. 1920x1080
64  fps    + Compare + 📈 Graph
high 1920x1080
51.6  fps    + Compare + 📈 Graph
ultra 1920x1080
47.1  fps    + Compare + 📈 Graph
QHD 2560x1440
32.5  fps    + Compare + 📈 Graph
4K 3840x2160
23.1  fps    + Compare + 📈 Graph
» With all tested laptops playable in detail settings ultra.
Additional Benchmarks
Low Preset 1280x720
98.2
low 1920x1080
104.3  fps    + Compare + 📈 Graph
med. 1920x1080
102.4  fps    + Compare + 📈 Graph
high 1920x1080
101.1  fps    + Compare + 📈 Graph
ultra 1920x1080
96.3  fps    + Compare + 📈 Graph
QHD 2560x1440
76.6  fps    + Compare + 📈 Graph
4K 3840x2160
44.6  fps    + Compare + 📈 Graph
» With all tested laptops playable in detail settings ultra.
Additional Benchmarks
Low Preset 1280x720
102.8
low 1920x1080
62.4  fps    + Compare + 📈 Graph
high 1920x1080
51.2  fps    + Compare + 📈 Graph
ultra 1920x1080
41.7  fps    + Compare + 📈 Graph
QHD 2560x1440
28.2  fps    + Compare + 📈 Graph
4K 3840x2160
15.9  fps    + Compare + 📈 Graph
» With all tested laptops playable in detail settings ultra.
Additional Benchmarks
Low 1280x720
90.4
low 1920x1080
144.5  fps    + Compare + 📈 Graph
med. 1920x1080
135  fps    + Compare + 📈 Graph
high 1920x1080
127  fps    + Compare + 📈 Graph
ultra 1920x1080
106.8  fps    + Compare + 📈 Graph
QHD 2560x1440
42.6  fps    + Compare + 📈 Graph
4K 3840x2160
75.9  fps    + Compare + 📈 Graph
» With all tested laptops playable in detail settings ultra.
Additional Benchmarks
Low Preset 1280x720
181.5
low 1920x1080
163.1  fps    + Compare + 📈 Graph
med. 1920x1080
121.6  fps    + Compare + 📈 Graph
high 1920x1080
102  fps    + Compare + 📈 Graph
ultra 1920x1080
86.7  fps    + Compare + 📈 Graph
QHD 2560x1440
84.7  fps    + Compare + 📈 Graph
4K 3840x2160
30.3  fps    + Compare + 📈 Graph
» With all tested laptops playable in detail settings ultra.
Additional Benchmarks
Low Preset 1280x720
177
low 1920x1080
87.6  fps    + Compare + 📈 Graph
med. 1920x1080
75.7  fps    + Compare + 📈 Graph
high 1920x1080
66.8  fps    + Compare + 📈 Graph
ultra 1920x1080
63.5  fps    + Compare + 📈 Graph
QHD 2560x1440
61.7  fps    + Compare + 📈 Graph
4K 3840x2160
51.3  fps    + Compare + 📈 Graph
» With all tested laptops playable in detail settings ultra.
Additional Benchmarks
Very Low Preset 1280x720
108.3
Very High Preset + Very High Raytracing TAA 1920x1080
55.8
Diablo 4

Diablo 4

2023
low 1920x1080
202 250 ~ 226 fps    + Compare + 📈 Graph
med. 1920x1080
171.6 197.9 ~ 185 fps    + Compare + 📈 Graph
high 1920x1080
159.4 164.1 ~ 162 fps    + Compare + 📈 Graph
ultra 1920x1080
133.2 155.6 ~ 144 fps    + Compare + 📈 Graph
QHD 2560x1440
89.1 111.2 ~ 100 fps    + Compare + 📈 Graph
4K 3840x2160
47.1 57.3 ~ 52 fps    + Compare + 📈 Graph
» With all tested laptops playable in detail settings ultra.
Additional Benchmarks
Low Preset 1280x720
274
low 1920x1080
81.1  fps    + Compare + 📈 Graph
med. 1920x1080
72.3  fps    + Compare + 📈 Graph
high 1920x1080
67.4  fps    + Compare + 📈 Graph
ultra 1920x1080
49.4 64.2 ~ 57 fps    + Compare + 📈 Graph
QHD 2560x1440
32.8 40.5 ~ 37 fps    + Compare + 📈 Graph
4K 3840x2160
16.1 19.8 ~ 18 fps    + Compare + 📈 Graph
» With all tested laptops playable in detail settings ultra.
Additional Benchmarks
Low Preset 1280x720
103.3
Epic Preset + Ray Tracing 1920x1080
50.6
Dead Island 2

Dead Island 2

2023
low 1920x1080
209  fps    + Compare + 📈 Graph
med. 1920x1080
205  fps    + Compare + 📈 Graph
high 1920x1080
164.3  fps    + Compare + 📈 Graph
ultra 1920x1080
99.7 126.1 ~ 113 fps    + Compare + 📈 Graph
QHD 2560x1440
71.2 89.9 ~ 81 fps    + Compare + 📈 Graph
4K 3840x2160
32.8 45.1 ~ 39 fps    + Compare + 📈 Graph
» With all tested laptops playable in detail settings ultra.
Additional Benchmarks
Low Preset Low TAA 1280x720
206
The Last of Us

The Last of Us

2023
low 1920x1080
96.6  fps    + Compare + 📈 Graph
med. 1920x1080
82.2  fps    + Compare + 📈 Graph
high 1920x1080
71.6  fps    + Compare + 📈 Graph
ultra 1920x1080
53.7 56.9 ~ 55 fps    + Compare + 📈 Graph
QHD 2560x1440
26.9 36.6 ~ 32 fps    + Compare + 📈 Graph
4K 3840x2160
0 (!) 16.5 ~ 8 fps    + Compare + 📈 Graph
3840x2160
31  fps    + Compare + 📈 Graph
» With all tested laptops playable in detail settings ultra.
Additional Benchmarks
Low Preset 1280x720
106.6
low 1920x1080
140  fps    + Compare + 📈 Graph
med. 1920x1080
103.1  fps    + Compare + 📈 Graph
high 1920x1080
96.7  fps    + Compare + 📈 Graph
ultra 1920x1080
57.2 67.6 ~ 62 fps    + Compare + 📈 Graph
QHD 2560x1440
43.6 52.6 ~ 48 fps    + Compare + 📈 Graph
4K 3840x2160
23.1 30.5 ~ 27 fps    + Compare + 📈 Graph
» With all tested laptops playable in detail settings ultra.
Additional Benchmarks
Prioritize Performance Preset 1280x720
171.8
low 1920x1080
193.5  fps    + Compare
med. 1920x1080
167.4  fps    + Compare
high 1920x1080
134.3  fps    + Compare
ultra 1920x1080
109.5 133.9 ~ 122 fps    + Compare
QHD 2560x1440
81.4 100.8 ~ 91 fps    + Compare
4K 3840x2160
48.4 58.4 ~ 53 fps    + Compare
» With all tested laptops playable in detail settings ultra.
Additional Benchmarks
Minimum Settings 1280x720
275.9
low 1920x1080
80.4  fps    + Compare + 📈 Graph
med. 1920x1080
75.8  fps    + Compare + 📈 Graph
high 1920x1080
72.8  fps    + Compare + 📈 Graph
ultra 1920x1080
61.8 72.5 ~ 67 fps    + Compare + 📈 Graph
QHD 2560x1440
49.9 57.7 ~ 54 fps    + Compare + 📈 Graph
4K 3840x2160
31.8 37.8 ~ 35 fps    + Compare + 📈 Graph
» With all tested laptops playable in detail settings ultra.
Additional Benchmarks
Ultra Low Preset 1280x720
81.1
low 1920x1080
186.7  fps    + Compare + 📈 Graph
med. 1920x1080
143.9  fps    + Compare + 📈 Graph
high 1920x1080
88.5  fps    + Compare + 📈 Graph
ultra 1920x1080
57.6 69.8 ~ 64 fps    + Compare + 📈 Graph
QHD 2560x1440
44.4 53.8 ~ 49 fps    + Compare + 📈 Graph
4K 3840x2160
27.2 32.5 ~ 30 fps    + Compare + 📈 Graph
» With all tested laptops playable in detail settings ultra.
Additional Benchmarks
Low Preset 1280x720
192.3
Returnal

Returnal

2023
low 1920x1080
104  fps    + Compare
med. 1920x1080
101  fps    + Compare
high 1920x1080
93  fps    + Compare
ultra 1920x1080
79  fps    + Compare
QHD 2560x1440
59  fps    + Compare
4K 3840x2160
34  fps    + Compare
» With all tested laptops playable in detail settings ultra.
Additional Benchmarks
Low Preset 1280x720
131
low 1920x1080
97.1  fps    + Compare + 📈 Graph
med. 1920x1080
88.4  fps    + Compare + 📈 Graph
high 1920x1080
72.4  fps    + Compare + 📈 Graph
ultra 1920x1080
59.1  fps    + Compare + 📈 Graph
QHD 2560x1440
47  fps    + Compare + 📈 Graph
4K 3840x2160
26.7  fps    + Compare + 📈 Graph
» With all tested laptops playable in detail settings ultra.
Additional Benchmarks
Low Preset Low TAA 1280x720
99.2
Ultra Preset + Full Ray Tracing High TAA 1920x1080
40.2
Ultra Preset + Full Ray Tracing High TAA 3840x2160
16.4
low 1920x1080
87.7  fps    + Compare + 📈 Graph
med. 1920x1080
83.9  fps    + Compare + 📈 Graph
high 1920x1080
73.3  fps    + Compare + 📈 Graph
ultra 1920x1080
73.6  fps    + Compare + 📈 Graph
QHD 2560x1440
53.8  fps    + Compare + 📈 Graph
4K 3840x2160
27.5  fps    + Compare + 📈 Graph
» With all tested laptops playable in detail settings ultra.
Additional Benchmarks
Low Preset TAA 1280x720
119.6
low 1920x1080
161.1 188.6 ~ 175 fps    + Compare + 📈 Graph
med. 1920x1080
151.2 160.7 ~ 156 fps    + Compare + 📈 Graph
high 1920x1080
128.4 136.7 ~ 133 fps    + Compare + 📈 Graph
ultra 1920x1080
112.6 117.3 ~ 115 fps    + Compare + 📈 Graph
QHD 2560x1440
81.9 83 ~ 82 fps    + Compare + 📈 Graph
4K 3840x2160
46.5  fps    + Compare + 📈 Graph
» With all tested laptops playable in detail settings ultra.
Additional Benchmarks
Low Preset / Off 1280x720
163.7
RT Ultra Preset / On FXAA 1920x1080
30.1
29.1
low 1920x1080
216  fps    + Compare + 📈 Graph
med. 1920x1080
157  fps    + Compare + 📈 Graph
high 1920x1080
124.3 216 ~ 170 fps    + Compare + 📈 Graph
ultra 1920x1080
103  fps    + Compare + 📈 Graph
QHD 2560x1440
65.5  fps    + Compare + 📈 Graph
4K 3840x2160
27.6  fps    + Compare + 📈 Graph
» With all tested laptops playable in detail settings ultra.
Additional Benchmarks
Low Preset 1280x720
217
low 1920x1080
124.9  fps    + Compare
med. 1920x1080
105.2 113 ~ 109 fps    + Compare
high 1920x1080
78.9 100.2 ~ 90 fps    + Compare
ultra 1920x1080
72.5 78.4 ~ 75 fps    + Compare
QHD 2560x1440
53.2 56.4 ~ 55 fps    + Compare
4K 3840x2160
30.8 32.7 ~ 32 fps    + Compare
» With all tested laptops playable in detail settings ultra.
Additional Benchmarks
Low Preset (without FSR Upscaling) 1280x720
136.6
Ultra Preset (without FSR Upscaling) + Full Ray-Tracing 1920x1080
49.4
50.2
low 1920x1080
100.6 116.8 ~ 109 fps    + Compare + 📈 Graph
med. 1920x1080
95 108.2 ~ 102 fps    + Compare + 📈 Graph
high 1920x1080
90.2 92.7 ~ 91 fps    + Compare + 📈 Graph
ultra 1920x1080
83.5 89.7 ~ 87 fps    + Compare + 📈 Graph
QHD 2560x1440
77.8 78.1 ~ 78 fps    + Compare + 📈 Graph
4K 3840x2160
44.8  fps    + Compare + 📈 Graph
» With all tested laptops playable in detail settings ultra.
Additional Benchmarks
Low Preset 1280x720
117.7
low 1920x1080
124.8  fps    + Compare + 📈 Graph
med. 1920x1080
110.4 114.7 ~ 113 fps    + Compare + 📈 Graph
high 1920x1080
100.6 111.3 ~ 106 fps    + Compare + 📈 Graph
ultra 1920x1080
98.3 100.4 ~ 99 fps    + Compare + 📈 Graph
QHD 2560x1440
66.6 71.9 ~ 69 fps    + Compare + 📈 Graph
4K 3840x2160
42.7 44.6 ~ 44 fps    + Compare + 📈 Graph
» With all tested laptops playable in detail settings ultra.
Additional Benchmarks
Very Low Preset 1280x720
138.6
Very High Preset + Ray-Tracing TAA 1920x0180
50.8
57.2
low 1920x1080
129  fps    + Compare
med. 1920x1080
117 138 ~ 128 fps    + Compare
high 1920x1080
90 99 ~ 95 fps    + Compare
ultra 1920x1080
87 97 ~ 92 fps    + Compare
QHD 2560x1440
62 66 ~ 64 fps    + Compare
4K 3840x2160
37 39 ~ 38 fps    + Compare
3840x2160
58  fps    + Compare
» With all tested laptops playable in detail settings ultra.
Additional Benchmarks
Basic Quality Preset T2X SMAA 1280x720
179
low 1920x1080
83.4  fps    + Compare + 📈 Graph
med. 1920x1080
80.6 81.9 ~ 81 fps    + Compare + 📈 Graph
high 1920x1080
76.8 77.8 ~ 77 fps    + Compare + 📈 Graph
ultra 1920x1080
73.4 73.7 ~ 74 fps    + Compare + 📈 Graph
QHD 2560x1440
56.4 58.2 ~ 57 fps    + Compare + 📈 Graph
4K 3840x2160
21.9 26.6 ~ 24 fps    + Compare + 📈 Graph
» With all tested laptops playable in detail settings ultra.
Additional Benchmarks
Low Preset 1280x720
85.6
low 1920x1080
107.9  fps    + Compare + 📈 Graph
med. 1920x1080
64.2 84.8 ~ 75 fps    + Compare + 📈 Graph
high 1920x1080
55.9 66.2 ~ 61 fps    + Compare + 📈 Graph
ultra 1920x1080
42.6 48.5 50.1 ~ 47 fps    + Compare + 📈 Graph
QHD 2560x1440
30.7 36 36.3 ~ 34 fps    + Compare + 📈 Graph
4K 3840x2160
17 20.4 20.8 ~ 19 fps    + Compare + 📈 Graph
» With all tested laptops playable in detail settings ultra.
Additional Benchmarks
Low Preset 1280x720
122.3
Ultra DLSS Quality 3840x2160
29.4
FIFA 23

FIFA 23

2022
med. 1920x1080
122.9  fps    + Compare + 📈 Graph
high 1920x1080
120.3  fps    + Compare + 📈 Graph
ultra 1920x1080
107.6  fps    + Compare + 📈 Graph
QHD 2560x1440
104.8  fps    + Compare + 📈 Graph
4K 3840x2160
79.7  fps    + Compare + 📈 Graph
» With all tested laptops playable in detail settings ultra.
low 1920x1080
155.9  fps    + Compare + 📈 Graph
med. 1920x1080
114.3 121.8 ~ 118 fps    + Compare + 📈 Graph
high 1920x1080
95.9 101.8 ~ 99 fps    + Compare + 📈 Graph
ultra 1920x1080
75.2 80.8 ~ 78 fps    + Compare + 📈 Graph
QHD 2560x1440
55.5  fps    + Compare + 📈 Graph
4K 3840x2160
28.3  fps    + Compare + 📈 Graph
» With all tested laptops playable in detail settings ultra.
Additional Benchmarks
Low Preset 1280x720
216
F1 22

F1 22

2022
low 1920x1080
239  fps    + Compare
med. 1920x1080
208 209 ~ 209 fps    + Compare
high 1920x1080
171 172.1 ~ 172 fps    + Compare
ultra 1920x1080
61.9 65 ~ 63 fps    + Compare
QHD 2560x1440
39.7 41 ~ 40 fps    + Compare
4K 3840x2160
19.1 20 ~ 20 fps    + Compare
» With all tested laptops playable in detail settings ultra.
med. 1920x1080
235  fps    + Compare + 📈 Graph
high 1920x1080
226  fps    + Compare + 📈 Graph
ultra 1920x1080
218  fps    + Compare + 📈 Graph
QHD 2560x1440
142.8  fps    + Compare + 📈 Graph
4K 3840x2160
73.1  fps    + Compare + 📈 Graph
» With all tested laptops playable in detail settings ultra.
low 1920x1080
164.5  fps    + Compare + 📈 Graph
med. 1920x1080
162.5 168.5 ~ 166 fps    + Compare + 📈 Graph
high 1920x1080
160.4 165.5 ~ 163 fps    + Compare + 📈 Graph
ultra 1920x1080
159.3 161.8 ~ 161 fps    + Compare + 📈 Graph
QHD 2560x1440
101.8  fps    + Compare + 📈 Graph
4K 3840x2160
49.7  fps    + Compare + 📈 Graph
» With all tested laptops playable in detail settings ultra.
Additional Benchmarks
Lowest Settings 1280x720
225
Highest Settings + Maximum Ray Tracing 1920x1080
61.5
61
low 1920x1080
174.7 194.1 210.5 ~ 193 fps    + Compare
med. 1920x1080
142.9 158.8 170.2 181 ~ 163 fps    + Compare
high 1920x1080
103.4 111.6 115.9 124 ~ 114 fps    + Compare
ultra 1920x1080
81.5 88.3 90.1 96 ~ 89 fps    + Compare
QHD 2560x1440
57.2 62.1 66.1 ~ 62 fps    + Compare
4K 3840x2160
33.6 35.4 ~ 35 fps    + Compare
» With all tested laptops playable in detail settings ultra.
Additional Benchmarks
Lowest Preset (DX12) 1280x720
294.4
213.2
242
low 1920x1080
97.9 111.4 117.5 118.8 123 139 145.6 ~ 122 fps    + Compare
med. 1920x1080
76.5 99.8 100.1 102.4 111.6 116 122 129.2 ~ 107 fps    + Compare
high 1920x1080
66.6 81.3 83.2 84.2 90.8 92 95 113.9 ~ 88 fps    + Compare
ultra 1920x1080
61.5 68.6 69.8 72.3 76 76.9 84 93 ~ 75 fps    + Compare
QHD 2560x1440
43.5 43.8 45.3 47 47.3 48.2 49.5 ~ 46 fps    + Compare
4K 3840x2160
21.1 22 22.3 23.3 ~ 22 fps    + Compare
» With all tested laptops playable in detail settings ultra.
Additional Benchmarks
Low Preset 1280x720
154
132.5
135.4
155.9
Ray Tracing Ultra Preset (DLSS off) 1920x1080
34.1
29
35.4
31.2
28.6
Ray Tracing Ultra Preset (DLSS off) 3840x2160
3.7
2
1.4
Elex 2

Elex 2

2022
low 1920x1080
98.4  fps    + Compare + 📈 Graph
med. 1920x1080
95.1 98.5 ~ 97 fps    + Compare + 📈 Graph
high 1920x1080
87.3 89.3 ~ 88 fps    + Compare + 📈 Graph
ultra 1920x1080
79.5 83.6 ~ 82 fps    + Compare + 📈 Graph
QHD 2560x1440
61.7 61.8 ~ 62 fps    + Compare + 📈 Graph
4K 3840x2160
34.5 36.1 ~ 35 fps    + Compare + 📈 Graph
» With all tested laptops playable in detail settings ultra.
Additional Benchmarks
Low / Off 1280x720
99.4
low 1920x1080
147 194 197.6 ~ 180 fps    + Compare
med. 1920x1080
163 169.2 189 205 ~ 182 fps    + Compare
high 1920x1080
153 153 158 168 ~ 158 fps    + Compare
ultra 1920x1080
122 122 123 124.2 ~ 123 fps    + Compare
QHD 2560x1440
81 95 100 ~ 92 fps    + Compare
4K 3840x2160
56 62 64.6 ~ 61 fps    + Compare
» With all tested laptops playable in detail settings ultra.
Additional Benchmarks
Low Preset 1280x720
195
198
med. 1920x1080
59.7  fps    + Compare + 📈 Graph
high 1920x1080
59.4  fps    + Compare + 📈 Graph
ultra 1920x1080
59.3  fps    + Compare + 📈 Graph
QHD 2560x1440
59.3  fps    + Compare + 📈 Graph
4K 3840x2160
48.1  fps    + Compare + 📈 Graph
» With all tested laptops playable in detail settings ultra.
low 1920x1080
111.6  fps    + Compare + 📈 Graph
med. 1920x1080
88.8 92.7 ~ 91 fps    + Compare + 📈 Graph
high 1920x1080
75.3 81.8 ~ 79 fps    + Compare + 📈 Graph
QHD 2560x1440
57.4  fps    + Compare + 📈 Graph
4K 3840x2160
31.2  fps    + Compare + 📈 Graph
» With all tested laptops playable in detail settings high.
Additional Benchmarks
Low Quality 1280x720
166.9
High Quality Raytracing 1920x1080
33.3
32.2
low 1920x1080
225 241 266 ~ 244 fps    + Compare
med. 1920x1080
182 189 206 208 ~ 196 fps    + Compare
high 1920x1080
171 181 201 202 ~ 189 fps    + Compare
ultra 1920x1080
149 155 155 157 ~ 154 fps    + Compare
QHD 2560x1440
97 103 103 ~ 101 fps    + Compare
4K 3840x2160
49 53 ~ 51 fps    + Compare
» With all tested laptops playable in detail settings ultra.
Additional Benchmarks
Ultra Low Preset (with Fixed Resolution Quality) 1280x720
420
374
low 1920x1080
122.2 128.1 ~ 125 fps    + Compare + 📈 Graph
med. 1920x1080
109.4 111 112 ~ 111 fps    + Compare + 📈 Graph
high 1920x1080
88.1 91.5 91.9 ~ 91 fps    + Compare + 📈 Graph
ultra 1920x1080
61.7 63.6 67.7 ~ 64 fps    + Compare + 📈 Graph
QHD 2560x1440
50.7 52.4 57.4 ~ 54 fps    + Compare + 📈 Graph
4K 3840x2160
33.8 36.1 37 ~ 36 fps    + Compare + 📈 Graph
» With all tested laptops playable in detail settings ultra.
Additional Benchmarks
Low Preset 1280x720
122
140.7
med. 1920x1080
106 126 ~ 116 fps    + Compare + 📈 Graph
high 1920x1080
93.9 108 ~ 101 fps    + Compare + 📈 Graph
ultra 1920x1080
90.1 102 ~ 96 fps    + Compare + 📈 Graph
QHD 2560x1440
73  fps    + Compare + 📈 Graph
4K 3840x2160
41.2  fps    + Compare + 📈 Graph
» With all tested laptops playable in detail settings ultra.
Additional Benchmarks
Low Preset 1920x1080
121
low 1280x720
205  fps    + Compare + 📈 Graph
med. 1920x1080
161.1 189 ~ 175 fps    + Compare + 📈 Graph
high 1920x1080
138.8 163 ~ 151 fps    + Compare + 📈 Graph
ultra 1920x1080
132.8 141 ~ 137 fps    + Compare + 📈 Graph
QHD 2560x1440
124.8 127 ~ 126 fps    + Compare + 📈 Graph
4K 3840x2160
79.2 79.9 ~ 80 fps    + Compare + 📈 Graph
» With all tested laptops playable in detail settings ultra.
Additional Benchmarks
Low Preset 1920x1080
215
low 1280x720
134  fps    + Compare + 📈 Graph
med. 1920x1080
107 141 ~ 124 fps    + Compare + 📈 Graph
high 1920x1080
95.5 118 ~ 107 fps    + Compare + 📈 Graph
ultra 1920x1080
86.6 102 ~ 94 fps    + Compare + 📈 Graph
QHD 2560x1440
77.3  fps    + Compare + 📈 Graph
4K 3840x2160
47.3  fps    + Compare + 📈 Graph
» With all tested laptops playable in detail settings ultra.
Additional Benchmarks
Low Preset 1920x1080
116
Ultra Preset + Ray Tracing 1920x1080
81.7
69.3
low 1280x720
191 206 213 235 ~ 211 fps    + Compare
med. 1920x1080
120 141 144 145 155 ~ 141 fps    + Compare
high 1920x1080
109 129 132 132 142 ~ 129 fps    + Compare
ultra 1920x1080
75 81 82 82 86 ~ 81 fps    + Compare
QHD 2560x1440
70 70 71 ~ 70 fps    + Compare
4K 3840x2160
48 50 52 ~ 50 fps    + Compare
» With all tested laptops playable in detail settings ultra.
Additional Benchmarks
Low Preset 1920x1080
166
162
179
163
med. 1920x1080
138  fps    + Compare + 📈 Graph
high 1920x1080
118  fps    + Compare + 📈 Graph
ultra 1920x1080
107  fps    + Compare + 📈 Graph
QHD 2560x1440
77.7  fps    + Compare + 📈 Graph
4K 3840x2160
43.8  fps    + Compare + 📈 Graph
» With all tested laptops playable in detail settings ultra.
Additional Benchmarks
Low Preset 1920x1080
149
low 1280x720
163 174 ~ 169 fps    + Compare
med. 1920x1080
122 136 144 151 ~ 138 fps    + Compare
high 1920x1080
106 114 118 121 ~ 115 fps    + Compare
ultra 1920x1080
98 105 107 111 ~ 105 fps    + Compare
QHD 2560x1440
77 79 ~ 78 fps    + Compare
4K 3840x2160
40 43 ~ 42 fps    + Compare
» With all tested laptops playable in detail settings ultra.
Additional Benchmarks
Low Preset 1920x1080
169
138
low 1280x720
123  fps    + Compare
med. 1920x1080
112 124 124 140 ~ 125 fps    + Compare
high 1920x1080
111 122 122 139 ~ 124 fps    + Compare
ultra 1920x1080
110 120 135 ~ 122 fps    + Compare
QHD 2560x1440
102 102 ~ 102 fps    + Compare
4K 3840x2160
55 56 ~ 56 fps    + Compare
» With all tested laptops playable in detail settings ultra.
Additional Benchmarks
Low Preset 1920x1080
123
Ultra Preset + Ultra Ray-Tracing 1920x1080
80
75
med. 1920x1080
220 273 ~ 247 fps    + Compare + 📈 Graph
high 1920x1080
205 227 ~ 216 fps    + Compare + 📈 Graph
ultra 1920x1080
193 209 ~ 201 fps    + Compare + 📈 Graph
QHD 2560x1440
140  fps    + Compare + 📈 Graph
4K 3840x2160
71.7  fps    + Compare + 📈 Graph
» With all tested laptops playable in detail settings ultra.
Additional Benchmarks
Low Preset (DX12) 1920x1080
377
Far Cry 6

Far Cry 6

2021
low 1280x720
119 127.5 ~ 123 fps    + Compare + 📈 Graph
med. 1920x1080
101 103 109.5 111 ~ 106 fps    + Compare + 📈 Graph
high 1920x1080
91 91 91 99 100 ~ 94 fps    + Compare + 📈 Graph
ultra 1920x1080
74 84 87 99.8 ~ 86 fps    + Compare + 📈 Graph
QHD 2560x1440
63 79.2 ~ 71 fps    + Compare + 📈 Graph
4K 3840x2160
41 44 ~ 43 fps    + Compare + 📈 Graph
» With all tested laptops playable in detail settings ultra.
Additional Benchmarks
Low Graphics Quality 1920x1080
125
112
121.3
Ultra Graphics Quality + HD Textures + DXR TAA 1920x1080
59
69
19.1
med. 1920x1080
82.7 98.7 119.2 ~ 100 fps    + Compare + 📈 Graph
high 1920x1080
79.2 93.9 118.2 ~ 97 fps    + Compare + 📈 Graph
QHD 2560x1440
90.1 118.2 ~ 104 fps    + Compare + 📈 Graph
4K 3840x2160
68.7 113.1 ~ 91 fps    + Compare + 📈 Graph
» With all tested laptops playable in detail settings high.
Additional Benchmarks
Low Preset 1920x1080
103
146.1
FIFA 22

FIFA 22

2021
med. 1920x1080
311  fps    + Compare + 📈 Graph
high 1920x1080
272  fps    + Compare + 📈 Graph
ultra 1920x1080
237  fps    + Compare + 📈 Graph
QHD 2560x1440
229  fps    + Compare + 📈 Graph
4K 3840x2160
220  fps    + Compare + 📈 Graph
» With all tested laptops playable in detail settings ultra.
Additional Benchmarks
Low Rendering Quality 1920x1080
317
New World

New World

2021
low 1280x720
115.7 128 ~ 122 fps    + Compare + 📈 Graph
med. 1920x1080
84.6 95.2 96.8 96.8 ~ 93 fps    + Compare + 📈 Graph
high 1920x1080
81.7 89.1 92.7 94.8 ~ 90 fps    + Compare + 📈 Graph
ultra 1920x1080
79.4 81.8 84.2 86.8 ~ 83 fps    + Compare + 📈 Graph
QHD 2560x1440
66.4 67.5 ~ 67 fps    + Compare + 📈 Graph
4K 3840x2160
35.7 40 ~ 38 fps    + Compare + 📈 Graph
» With all tested laptops playable in detail settings ultra.
Additional Benchmarks
Low Video Quality 1920x1080
99.8
120.5
109.7
Deathloop

Deathloop

2021
med. 1920x1080
117 118 ~ 118 fps    + Compare + 📈 Graph
high 1920x1080
106 110 ~ 108 fps    + Compare + 📈 Graph
ultra 1920x1080
90.1 100 ~ 95 fps    + Compare + 📈 Graph
QHD 2560x1440
72  fps    + Compare + 📈 Graph
4K 3840x2160
40.3  fps    + Compare + 📈 Graph
» With all tested laptops playable in detail settings ultra.
Additional Benchmarks
Low Preset 1920x1080
120
F1 2021

F1 2021

2021
low 1280x720
118.3 205 217 259 267 270 276 283 291 291 298 314 319 367 381 460 ~ 289 fps    + Compare
med. 1920x1080
83.5 154 169 175 179 194.2 199 203 210 212 224 228 255 303 309 324 ~ 214 fps    + Compare
high 1920x1080
66.1 137 149 158 161 170.1 171 171 178.7 186.2 191.5 192.6 218 244 246 256 ~ 181 fps    + Compare
ultra 1920x1080
33.1 34.1 35.2 85.9 91.2 96 96 97.7 98.1 100.6 105 109 110 114 115 115.4 119 119.8 122.6 122.6 122.7 122.8 123.1 ~ 100 fps    + Compare
QHD 2560x1440
67.1 73.9 74.1 79.8 84.8 85.8 86.3 88.3 89.8 90 90.2 ~ 83 fps    + Compare
4K 3840x2160
37.1 49.8 51.1 ~ 46 fps    + Compare
» With most tested laptops playable in detail settings ultra.
Additional Benchmarks
Ultra Low Preset 1920x1080
179
190
med. 1920x1080
144 144 ~ 144 fps    + Compare + 📈 Graph
high 1920x1080
143 144 ~ 144 fps    + Compare + 📈 Graph
QHD 2560x1440
144  fps    + Compare + 📈 Graph
4K 3840x2160
142  fps    + Compare + 📈 Graph
» With all tested laptops playable in detail settings high.
Additional Benchmarks
Low Preset 1920x1080
144
Days Gone

Days Gone

2021
low 1280x720
147 160 ~ 154 fps    + Compare + 📈 Graph
med. 1920x1080
121 138 154 ~ 138 fps    + Compare + 📈 Graph
high 1920x1080
112 123 140 ~ 125 fps    + Compare + 📈 Graph
ultra 1920x1080
88.6 95.9 106 ~ 97 fps    + Compare + 📈 Graph
QHD 2560x1440
71.3  fps    + Compare + 📈 Graph
» With all tested laptops playable in detail settings ultra.
Additional Benchmarks
Low Preset 1920x1080
147
127
low 1280x720
105 107 ~ 106 fps    + Compare + 📈 Graph
ultra 1920x1080
94.3 100 105 ~ 100 fps    + Compare + 📈 Graph
QHD 2560x1440
94.3  fps    + Compare + 📈 Graph
» With all tested laptops playable in detail settings ultra.
low 1280x720
162  fps    + Compare + 📈 Graph
med. 1920x1080
137 178 ~ 158 fps    + Compare + 📈 Graph
high 1920x1080
136 176 ~ 156 fps    + Compare + 📈 Graph
ultra 1920x1080
134 156 ~ 145 fps    + Compare + 📈 Graph
QHD 2560x1440
97.4  fps    + Compare + 📈 Graph
» With all tested laptops playable in detail settings ultra.
Additional Benchmarks
Prioritize Performance Preset 1920x1080
143
Ray Tracing Preset 1920x1080
93
Outriders

Outriders

2021
low 1280x720
104 114 ~ 109 fps    + Compare + 📈 Graph
med. 1920x1080
94 99.5 118 ~ 104 fps    + Compare + 📈 Graph
high 1920x1080
93.6 108 117 ~ 106 fps    + Compare + 📈 Graph
ultra 1920x1080
89.4 106 117 ~ 104 fps    + Compare + 📈 Graph
QHD 2560x1440
79.3  fps    + Compare + 📈 Graph
» With all tested laptops playable in detail settings ultra.
Additional Benchmarks
Low Preset 1920x1080
103
102
Hitman 3

Hitman 3

2021
low 1280x720
174.4 185.6 ~ 180 fps    + Compare
med. 1920x1080
128 147.8 176 ~ 151 fps    + Compare
high 1920x1080
120.7 140.1 170 ~ 144 fps    + Compare
ultra 1920x1080
134.8 135.6 162 ~ 144 fps    + Compare
QHD 2560x1440
97.8  fps    + Compare
» With all tested laptops playable in detail settings ultra.
Additional Benchmarks
Minimum Settings 1920x1080
172.4
176.3
low 1280x720
97.3 104.5 106 111.1 112.1 116 116.7 ~ 109 fps    + Compare + 📈 Graph
med. 1920x1080
75.4 76.8 81 86.1 89.5 89.6 94.8 ~ 85 fps    + Compare + 📈 Graph
high 1920x1080
57.9 62 64.6 67 72.6 76.9 77.1 81.2 82 ~ 71 fps    + Compare + 📈 Graph
ultra 1920x1080
50 53.7 57 58 59.4 61.8 66.3 67.7 67.8 70.3 70.5 ~ 62 fps    + Compare + 📈 Graph
QHD 2560x1440
32 38.4 39 45.3 45.6 ~ 40 fps    + Compare + 📈 Graph
4K 3840x2160
15.5 17 19.1 22.1 ~ 18 fps    + Compare + 📈 Graph
» With all tested laptops playable in detail settings ultra.
Additional Benchmarks
Low Preset 1920x1080
97
96
90.6
Ray Tracing Ultra Preset (DLSS off) 1920x1080
24.1
33.9
33.1
56.4
27
44.2
Ray Tracing Ultra Preset (DLSS off) 3840x2160
4.1
5.4
3.9
low 1280x720
104 127 ~ 116 fps    + Compare
med. 1920x1080
89 112 ~ 101 fps    + Compare
high 1920x1080
73 87 101 101 ~ 91 fps    + Compare
ultra 1920x1080
69 70 85 94 ~ 80 fps    + Compare
QHD 2560x1440
56 57 74 ~ 62 fps    + Compare
4K 3840x2160
37 38 49 ~ 41 fps    + Compare
» With all tested laptops playable in detail settings ultra.
low 1280x720
113 128 134 ~ 125 fps    + Compare + 📈 Graph
med. 1920x1080
100 114 115 ~ 110 fps    + Compare + 📈 Graph
high 1920x1080
90.2 99.5 113 115 ~ 104 fps    + Compare + 📈 Graph
ultra 1920x1080
84.3 90.7 106 106 ~ 97 fps    + Compare + 📈 Graph
QHD 2560x1440
59.2 76.5 ~ 68 fps    + Compare + 📈 Graph
4K 3840x2160
31  fps    + Compare + 📈 Graph
» With all tested laptops playable in detail settings ultra.
high 1920x1080
82 83 ~ 83 fps    + Compare + 📈 Graph
ultra 1920x1080
73.5 76.1 ~ 75 fps    + Compare + 📈 Graph
QHD 2560x1440
53.7 64.5 ~ 59 fps    + Compare + 📈 Graph
4K 3840x2160
29.8 33.8 ~ 32 fps    + Compare + 📈 Graph
» With all tested laptops playable in detail settings ultra.
Additional Benchmarks
Highest Settings + Ultra Ray Tracing 1920x1080
44.7
49.3
low 1280x720
112 126 ~ 119 fps    + Compare
med. 1920x1080
86 95 ~ 91 fps    + Compare
high 1920x1080
63 75 77 84 ~ 75 fps    + Compare
ultra 1920x1080
56 67 69 75 ~ 67 fps    + Compare
QHD 2560x1440
44 53 60 ~ 52 fps    + Compare
4K 3840x2160
27 38 ~ 33 fps    + Compare
» With all tested laptops playable in detail settings ultra.
Dirt 5

Dirt 5

2020
low 1280x720
175 176 181 181 210 227 ~ 192 fps    + Compare
med. 1920x1080
105 107 113 120 147 153 ~ 124 fps    + Compare
high 1920x1080
76.5 86 86.5 93.6 105 114 123 ~ 98 fps    + Compare
ultra 1920x1080
50 71.5 72.2 77.1 77.3 77.3 77.5 82.6 86.1 91 96 ~ 78 fps    + Compare
QHD 2560x1440
58.6 61.9 67.5 72.4 73 75 ~ 68 fps    + Compare
4K 3840x2160
33.3 49 49 ~ 44 fps    + Compare
» With all tested laptops playable in detail settings ultra.
low 1280x720
79.1 108 114 ~ 100 fps    + Compare + 📈 Graph
med. 1920x1080
67.8 74 104 106 ~ 88 fps    + Compare + 📈 Graph
high 1920x1080
61.9 67.8 68 81 94.7 96 ~ 78 fps    + Compare + 📈 Graph
ultra 1920x1080
55 56.2 59.5 59.9 66 72.3 73 ~ 63 fps    + Compare + 📈 Graph
QHD 2560x1440
42 55 64 ~ 54 fps    + Compare
4K 3840x2160
25 27 33 ~ 28 fps    + Compare
» With all tested laptops playable in detail settings ultra.
Additional Benchmarks
Ultra Preset + Ultra Ray Tracing (DX12) 1920x1080
34
45
45.4
37
36.4
35.7
35
FIFA 21

FIFA 21

2020
high 1920x1080
148 214 ~ 181 fps    + Compare + 📈 Graph
ultra 1920x1080
144 209 ~ 177 fps    + Compare + 📈 Graph
QHD 2560x1440
114 204 ~ 159 fps    + Compare + 📈 Graph
4K 3840x2160
67.5 201 ~ 134 fps    + Compare + 📈 Graph
» With all tested laptops playable in detail settings ultra.
high 1920x1080
180 278 ~ 229 fps    + Compare + 📈 Graph
ultra 1920x1080
167 261 ~ 214 fps    + Compare + 📈 Graph
QHD 2560x1440
129 183 ~ 156 fps    + Compare + 📈 Graph
4K 3840x2160
70.5 109 ~ 90 fps    + Compare + 📈 Graph
» With all tested laptops playable in detail settings ultra.
high 1920x1080
77.6  fps    + Compare + 📈 Graph
QHD 2560x1440
57.9  fps    + Compare + 📈 Graph
4K 3840x2160
31.4  fps    + Compare + 📈 Graph
» With all tested laptops playable in detail settings high.
low 1280x720
117 130 131 ~ 126 fps    + Compare + 📈 Graph
med. 1920x1080
82.6 91.3 98.1 ~ 91 fps    + Compare + 📈 Graph
high 1920x1080
74.3 78.9 85.4 91.8 ~ 83 fps    + Compare + 📈 Graph
ultra 1920x1080
66.4 69 70.5 77.1 82.1 ~ 73 fps    + Compare + 📈 Graph
QHD 2560x1440
55.9  fps    + Compare
» With all tested laptops playable in detail settings ultra.
high 1920x1080
63.1 86.7 ~ 75 fps    + Compare + 📈 Graph
ultra 1920x1080
47.2 61.4 ~ 54 fps    + Compare + 📈 Graph
QHD 2560x1440
37.3 50 ~ 44 fps    + Compare + 📈 Graph
4K 3840x2160
23.9 30.9 ~ 27 fps    + Compare + 📈 Graph
» With all tested laptops playable in detail settings ultra.
low 1280x720
59.1  fps    + Compare + 📈 Graph
med. 1920x1080
41.6  fps    + Compare + 📈 Graph
high 1920x1080
42.2  fps    + Compare + 📈 Graph
ultra 1920x1080
38  fps    + Compare + 📈 Graph
» With all tested laptops playable in detail settings ultra.
Additional Benchmarks
Low-End TAAAA 1920x1080
56.1
low 1280x720
118 118 127 ~ 121 fps    + Compare
med. 1920x1080
90 93 99 ~ 94 fps    + Compare
high 1920x1080
83 86 88 92 ~ 87 fps    + Compare
ultra 1920x1080
70 79 81 86 ~ 79 fps    + Compare
QHD 2560x1440
56 70 ~ 63 fps    + Compare
4K 3840x2160
34  fps    + Compare
» With all tested laptops playable in detail settings ultra.
low 1280x720
137 150 ~ 144 fps    + Compare + 📈 Graph
med. 1920x1080
121 143 ~ 132 fps    + Compare + 📈 Graph
high 1920x1080
73.8 118 137 ~ 110 fps    + Compare + 📈 Graph
ultra 1920x1080
73.4 115 134 ~ 107 fps    + Compare + 📈 Graph
QHD 2560x1440
70.7  fps    + Compare + 📈 Graph
4K 3840x2160
43.7  fps    + Compare + 📈 Graph
» With all tested laptops playable in detail settings ultra.
F1 2020

F1 2020

2020
low 1280x720
119 186 240 266 315 333 ~ 243 fps    + Compare
med. 1920x1080
157 178 186 212 267 273 ~ 212 fps    + Compare
high 1920x1080
118 158 159 177 207 230 238 ~ 184 fps    + Compare
ultra 1920x1080
97 125 130 132 165.8 166.2 173 ~ 141 fps    + Compare
QHD 2560x1440
74 99.8 123.6 123.7 ~ 105 fps    + Compare
4K 3840x2160
45 57.7 68.3 69.7 ~ 60 fps    + Compare
» With all tested laptops playable in detail settings ultra.
Valorant

Valorant

2020
QHD 2560x1440
254  fps    + Compare + 📈 Graph
4K 3840x2160
238  fps    + Compare + 📈 Graph
low 1280x720
240.2  fps    + Compare
med. 1920x1080
176.6  fps    + Compare
high 1920x1080
110 127 ~ 119 fps    + Compare
ultra 1920x1080
85.2 99.2 ~ 92 fps    + Compare
QHD 2560x1440
62.2 75.6 ~ 69 fps    + Compare
4K 3840x2160
32.5  fps    + Compare
» With all tested laptops playable in detail settings ultra.
high 1920x1080
152  fps    + Compare + 📈 Graph
ultra 1920x1080
149 216 ~ 183 fps    + Compare + 📈 Graph
QHD 2560x1440
118  fps    + Compare + 📈 Graph
4K 3840x2160
64  fps    + Compare + 📈 Graph
» With all tested laptops playable in detail settings ultra.
high 1920x1080
98.4  fps    + Compare + 📈 Graph
QHD 2560x1440
62.3  fps    + Compare + 📈 Graph
4K 3840x2160
30.9  fps    + Compare + 📈 Graph
» With all tested laptops playable in detail settings high.
low 1280x720
128  fps    + Compare
med. 1920x1080
108  fps    + Compare
high 1920x1080
67.2 88.4 ~ 78 fps    + Compare
ultra 1920x1080
46.3 60.7 ~ 54 fps    + Compare
QHD 2560x1440
37.5  fps    + Compare
4K 3840x2160
24.3  fps    + Compare
» With all tested laptops playable in detail settings ultra.
high 1920x1080
71.5 98.5 ~ 85 fps    + Compare + 📈 Graph
ultra 1920x1080
69.1 94.6 ~ 82 fps    + Compare + 📈 Graph
QHD 2560x1440
60.1 85.3 ~ 73 fps    + Compare + 📈 Graph
4K 3840x2160
35 53 ~ 44 fps    + Compare + 📈 Graph
» With all tested laptops playable in detail settings ultra.
high 1920x1080
66.1 96.2 ~ 81 fps    + Compare + 📈 Graph
ultra 1920x1080
64.8 91.5 ~ 78 fps    + Compare + 📈 Graph
QHD 2560x1440
54.8 83.7 ~ 69 fps    + Compare + 📈 Graph
4K 3840x2160
32.1 53.1 ~ 43 fps    + Compare + 📈 Graph
» With all tested laptops playable in detail settings ultra.
GRID 2019

GRID 2019

2019
high 1920x1080
83.2  fps    + Compare + 📈 Graph
ultra 1920x1080
63.7  fps    + Compare + 📈 Graph
QHD 2560x1440
55.6  fps    + Compare + 📈 Graph
4K 3840x2160
38.1  fps    + Compare + 📈 Graph
» With all tested laptops playable in detail settings ultra.
low 1280x720
135.5 141.9 ~ 139 fps    + Compare
med. 1920x1080
117.3 124.9 ~ 121 fps    + Compare
high 1920x1080
78.2 101 101 105 ~ 96 fps    + Compare
ultra 1920x1080
65.4 84.6 84.7 88.3 ~ 81 fps    + Compare
QHD 2560x1440
47.2 62.2 62.6 64.3 ~ 59 fps    + Compare
4K 3840x2160
25.7 34.2 34.8 36 ~ 33 fps    + Compare
» With all tested laptops playable in detail settings ultra.
Additional Benchmarks
Very Low Overall Quality (DX11) 1920x1080
133.2
141.4
Control

Control

2019
low 1280x720
240 240 ~ 240 fps    + Compare + 📈 Graph
med. 1920x1080
128 131.7 ~ 130 fps    + Compare + 📈 Graph
high 1920x1080
69.6 93.7 96.1 97.4 ~ 89 fps    + Compare + 📈 Graph
QHD 2560x1440
45.2 60.9 61 64.1 ~ 58 fps    + Compare + 📈 Graph
4K 3840x2160
22.3 30.3 30.3 32.6 ~ 29 fps    + Compare + 📈 Graph
» With all tested laptops playable in detail settings high.
Additional Benchmarks
High Quality Preset & High Ray Tracing Preset (DX12) 1920x1080
42.7
58.6
59.3
low 1280x720
202.3  fps    + Compare
med. 1920x1080
135.6  fps    + Compare
high 1920x1080
100.7  fps    + Compare
ultra 1920x1080
78.9  fps    + Compare
» With all tested laptops playable in detail settings ultra.
Rage 2

Rage 2

2019
high 1920x1080
102  fps    + Compare + 📈 Graph
ultra 1920x1080
99.7  fps    + Compare + 📈 Graph
QHD 2560x1440
65.3  fps    + Compare + 📈 Graph
4K 3840x2160
32.7  fps    + Compare + 📈 Graph
» With all tested laptops playable in detail settings ultra.
Anno 1800

Anno 1800

2019
low 1280x720
38.9 143.6 ~ 91 fps    + Compare + 📈 Graph
med. 1920x1080
38.3 132.6 ~ 85 fps    + Compare + 📈 Graph
high 1920x1080
34.5 73.9 78.5 109.8 ~ 74 fps    + Compare + 📈 Graph
ultra 1920x1080
24.4 39.6 39.8 56.7 ~ 40 fps    + Compare + 📈 Graph
QHD 2560x1440
34.2 39.1 48.2 ~ 41 fps    + Compare + 📈 Graph
4K 3840x2160
21.8 31.6 32.1 ~ 29 fps    + Compare + 📈 Graph
» With most tested laptops playable in detail settings ultra.
high 1920x1080
85 131 ~ 108 fps    + Compare
ultra 1920x1080
68 101 ~ 85 fps    + Compare
QHD 2560x1440
48 70 ~ 59 fps    + Compare
4K 3840x2160
26 40 ~ 33 fps    + Compare
» With all tested laptops playable in detail settings ultra.
low 1280x720
112 133 133 134 ~ 128 fps    + Compare + 📈 Graph
med. 1920x1080
99 108 115 116 ~ 110 fps    + Compare + 📈 Graph
high 1920x1080
80 96 103 112 112 112 ~ 103 fps    + Compare + 📈 Graph
ultra 1920x1080
70 86 91 100 100 101 ~ 91 fps    + Compare + 📈 Graph
QHD 2560x1440
62 84 91 91 91 ~ 84 fps    + Compare + 📈 Graph
4K 3840x2160
42 57 58 61 ~ 55 fps    + Compare + 📈 Graph
» With all tested laptops playable in detail settings ultra.
low 1280x720
177.1 185 ~ 181 fps    + Compare
med. 1920x1080
120.8 123 ~ 122 fps    + Compare
high 1920x1080
69.4 93.1 94 97.4 ~ 88 fps    + Compare
ultra 1920x1080
57.1 74.6 74.6 77.2 ~ 71 fps    + Compare
QHD 2560x1440
45.3 58.7 59.9 61.6 ~ 56 fps    + Compare
4K 3840x2160
27.7 36.6 37.6 39.2 ~ 35 fps    + Compare
» With all tested laptops playable in detail settings ultra.
Additional Benchmarks
Ultra Quality DXR 16xAF 1920x1080
48.5
66
63.2
62.8
high 1920x1080
143 144 ~ 144 fps    + Compare + 📈 Graph
ultra 1920x1080
141 144 ~ 143 fps    + Compare + 📈 Graph
QHD 2560x1440
103 142 ~ 123 fps    + Compare + 📈 Graph
4K 3840x2160
58.8 82.3 ~ 71 fps    + Compare + 📈 Graph
» With all tested laptops playable in detail settings ultra.
high 1920x1080
106 162 ~ 134 fps    + Compare + 📈 Graph
ultra 1920x1080
100 152 ~ 126 fps    + Compare + 📈 Graph
QHD 2560x1440
80.5 124 ~ 102 fps    + Compare + 📈 Graph
4K 3840x2160
49.4 76.6 ~ 63 fps    + Compare + 📈 Graph
» With all tested laptops playable in detail settings ultra.
Additional Benchmarks
Ultra Preset DXR 1920x1080
64.5
79.6
low 1280x720
211  fps    + Compare
med. 1920x1080
189  fps    + Compare
high 1920x1080
188  fps    + Compare
ultra 1920x1080
167  fps    + Compare
QHD 2560x1440
140  fps    + Compare
4K 3840x2160
93  fps    + Compare
» With all tested laptops playable in detail settings ultra.
low 1280x720
132 142 159 167.7 169.6 ~ 154 fps    + Compare
med. 1920x1080
111 121 140 143.5 146.4 ~ 132 fps    + Compare
high 1920x1080
88 108 119 134.3 135 142.5 ~ 121 fps    + Compare
ultra 1920x1080
86 107 109 123.1 126 133.7 ~ 114 fps    + Compare
QHD 2560x1440
65 88.6 95.1 ~ 83 fps    + Compare
4K 3840x2160
36 48 50.8 ~ 45 fps    + Compare
» With all tested laptops playable in detail settings ultra.
Additional Benchmarks
Lowest Preset 1920x1080
133
116
157
169.6
166.9
Strange Brigade

Strange Brigade

2018
low 1280x720
106.8 272 285 295 303 309 311 311 311 323 334 337 347 356 369 373 375 389 395 399 405 406 408 414 427 437 442 444 467 474 482 501 519 522 ~ 378 fps    + Compare
med. 1920x1080
44.1 146 170 172 173 178 182 195 197.9 199 203 203 206 206 208 211 213 224 224 231 232 232 233 235 236 251 253 254 257 261 265 267 270 275 279 ~ 217 fps    + Compare
high 1920x1080
39.6 119 152 152 157 163 163 166 167.4 171 171.5 172 173 175 179 179 183 183 186.6 188.8 192 192 193 200 205 206 208 211 212 213 216 217 219 221 225 ~ 182 fps    + Compare
ultra 1920x1080
36.2 56.1 57.1 105 138 139 141 143 149 149.9 150 151 151.5 152 153 154 155 158 159 161 164.5 165.6 167 168 169 170 171 171 173 173.5 174 178 178 178 182.7 184.7 185 185.5 186 186.7 186.9 188.3 189.4 192 192 194 ~ 159 fps    + Compare
QHD 2560x1440
82.3 107 112 112.9 113 113 114 119 124.1 126 126.3 128 131 132 136.7 137.3 137.3 140.5 ~ 122 fps    + Compare
4K 3840x2160
61.1 68.1 69.1 72 78.1 78.6 ~ 71 fps    + Compare
» With all tested laptops playable in detail settings ultra.
Far Cry 5

Far Cry 5

2018
low 1280x720
123 124 125 125 127 131 133 133 134 137 137 138 143 143 145 146 148 149 152 156 157 158 159 165 176 ~ 143 fps    + Compare + 📈 Graph
med. 1920x1080
100 101 103 106 106 108 110 116 116 116 117 117 118 119 120 122 122 124 125 125 129 134 136 138 140 143 ~ 120 fps    + Compare + 📈 Graph
high 1920x1080
93 98 98 101 103 104 105 110 111 111 111 112 113 114 114 115 115 118 119 122 123 127 129 131 135 137 ~ 114 fps    + Compare + 📈 Graph
ultra 1920x1080
89 92 94 95 97 99 99 100 100 100 103 104 105 105 107 107 107 107 107 108 109 110 110 110 112 113 114 115 118 119 120 120 122 126 128 140 ~ 109 fps    + Compare + 📈 Graph
QHD 2560x1440
81 81 81 84 85 86 89 90 91 91 94 96 97 98 99 99 99 101 ~ 91 fps    + Compare + 📈 Graph
4K 3840x2160
44 50 51 55 55 ~ 51 fps    + Compare + 📈 Graph
» With all tested laptops playable in detail settings ultra.
Additional Benchmarks
Low Preset TAA 1920x1080
130
111
155
128
119
120
131
108
143
140
127
129
158
151
163
134
143
136
low 1280x720
15.3 19.4 85 89.1 90.2 91.1 92.7 93.4 94 95.1 95.3 96.5 97.5 97.5 98.1 98.7 98.9 100 101 103 103 104 104 104 104 105 105 107 108 108 110 111 114.6 115 115 115.9 116 120 121.2 122 122 124 124 125 126 129 136 136.6 139.9 141.2 142 142.2 142.8 143.2 144.2 145.5 146 150.1 150.7 151.6 152.8 ~ 113 fps    + Compare
med. 1920x1080
13.7 17.7 73.4 75.4 80.5 81.4 83.3 83.4 83.8 84 84.2 84.9 84.9 85.5 85.9 86.6 86.8 87.8 87.9 90 90.5 91.2 91.6 91.6 91.9 93.9 94.2 94.7 96.3 96.3 97.1 98.9 98.9 102 102.3 103.3 104 104 104 104 104 106 111 111 114 117 121 121.2 122.9 123.9 125 125.2 125.9 126.2 127.9 131 131.7 133.1 135.4 142.3 144.7 ~ 100 fps    + Compare
high 1920x1080
12.4 15.2 62.7 63.3 66.6 68 68.8 69.1 69.9 69.9 70.1 70.4 70.7 71.1 71.8 72 72.2 73.2 73.6 74.4 75 75.2 75.2 75.4 75.7 75.8 76.4 76.8 78 78.8 79.3 79.5 79.7 79.7 80.2 80.7 82.9 83.5 84 84 85.7 86.4 86.8 89.9 91.4 94.8 95.4 95.7 96.7 97.7 98.4 99.2 100 100.2 101.9 105 106.3 106.5 110.7 116.9 118.8 ~ 81 fps    + Compare
4K 3840x2160
49.6 52.4 54.4 57.8 57.8 60.4 66 80.2 80.2 81.5 82.3 84.2 98.7 ~ 70 fps    + Compare
» With most tested laptops playable in detail settings high.
low 1280x720
137 137 139 144 144 144 145 148 150 150 151 152 153.6 157 158.6 161 162 166.6 170 171 171.3 172 173 175 186.3 187.3 190.1 195 207 207 ~ 163 fps    + Compare
med. 1920x1080
67 81 101 104 104 105 106 110 110.5 111 112 112 114 115 116 118 118 118.5 118.8 121.6 123 125 127 127.5 132 135.9 136 138 138.4 139 142 144 ~ 118 fps    + Compare
high 1920x1080
27.9 28.1 30.2 62 65.7 70 75.7 76.7 78.5 78.6 79.2 80.1 83.3 83.8 84.1 85.1 85.7 87.4 87.5 87.6 88 88.9 88.9 89.7 90.2 90.4 91.2 91.6 92.4 93.5 93.5 93.7 93.8 95 95.4 97.6 98 98.6 99.7 100 101 102 102.6 103 103 103.1 103.3 103.6 107 ~ 86 fps    + Compare
QHD 2560x1440
19.8 49.1 56.2 61 61.3 61.6 63.9 65.1 65.7 66.5 68.7 70.3 71.4 71.5 71.9 72.1 72.6 73.8 74.2 75.3 76.4 76.7 78.2 79 79.9 ~ 67 fps    + Compare
4K 3840x2160
36.2 38.7 39.4 40.9 43.5 45.6 46.8 46.9 ~ 42 fps    + Compare
» With most tested laptops playable in detail settings high.
ultra 1920x1080
65  fps    + Compare
» With all tested laptops playable in detail settings ultra.
low 1024x768
272 293 302 ~ 289 fps    + Compare + 📈 Graph
med. 1366x768
203.7 206 216 ~ 209 fps    + Compare + 📈 Graph
high 1920x1080
138.7 141.9 160 ~ 147 fps    + Compare + 📈 Graph
ultra 1920x1080
116.2 122 137 ~ 125 fps    + Compare + 📈 Graph
4K 3840x2160
55.4 56.9 ~ 56 fps    + Compare + 📈 Graph
» With all tested laptops playable in detail settings ultra.
low 1280x720
35.2 35.4 101.6 127 127 127 128 134 136 137 139 139 140 140 140 141 141 142 142 144 146 147 148 149 149 150 151 152 153 154 155.7 156 158 158 158.3 160 162.5 163 164 164.1 164.4 165.9 167 168.1 169 169.9 171 171 171 171 173 174.6 175.3 177.7 192.8 196.2 204 211 ~ 152 fps    + Compare
med. 1366x768
31.5 32.6 97.6 116 116 119 120 125 126 126 128 129 129 130 131 131 131 131 132 132 134 134 134 134 134.5 135 138 139 139.4 140 140 141 141 142 142 142 142.2 144.1 146 146 148 148 148.3 151 151.2 152.1 152.8 153.1 155 156 157.6 158.4 160.4 161.4 173.3 173.8 180 183.8 ~ 137 fps    + Compare
high 1920x1080
30.9 31.2 91.5 107 110 111 112 112 112 115 115 116 119 120 120 121 122 122 123 123 123 124 124 124 124 126.3 127 128 129 131 131 131 132.8 132.9 133 134 135 135.8 135.8 137 139 141 141.2 142.7 142.9 143 145 145.1 145.8 147 148 149 150.4 150.6 151.8 165.1 167.2 176.8 178 ~ 129 fps    + Compare
ultra 1920x1080
26.9 28.8 88.7 103 104 106 107 107 107 107 109 110 110 110.3 111 113 114 115 116.3 117 117 117 117 118 118 118 119 120 120 120 122 122 124 125.2 125.3 126.7 127 127 128 129 130 130 132.8 133.9 135 135.6 137 137.6 138.5 139 140 142 142.7 145 150.9 154.8 158 163.9 ~ 121 fps    + Compare
4K 3840x2160
79.3 93.1 98.8 106.4 107 107.1 109 109 114 124.3 127.2 127.7 ~ 109 fps    + Compare
» With most tested laptops playable in detail settings ultra.
low 1024x768
209 253 259 262 264.1 267 288.3 289 309 312 323 335 335.9 339 345 348 362.7 365.9 368 376.6 377.1 381.1 388.1 415.4 416 417 435 460.9 468 505 672 ~ 360 fps    + Compare + 📈 Graph
med. 1366x768
169.6 179.9 198 213 216 217 241 241 243 243 243 246.7 252.2 252.8 259 260 261 262 263.4 265 279.3 279.4 279.6 294 298.1 304.5 312.7 315 327.3 331 339 ~ 261 fps    + Compare + 📈 Graph
high 1920x1080
122.1 126 132 133.5 135 141 148 152.6 154 154.2 157 158 163.4 164.2 168 168 170 170.5 171 173 174 176 177.8 180 181 184.4 187 189.4 190.1 197.7 199 204 204.8 206.9 ~ 168 fps    + Compare + 📈 Graph
ultra 1920x1080
34.9 45.2 73.5 76.2 76.7 78 78.4 80.9 81.5 81.5 82.8 86.5 86.7 86.8 88.5 88.6 89.1 89.4 89.7 91.3 91.6 91.8 92.1 92.3 92.8 92.9 94.8 95.9 96.5 96.6 98.4 98.6 99 100 100.2 100.6 101 101 101 101 101 101.6 101.7 102.1 102.1 103 104.1 105.5 105.7 107 107.9 109 ~ 92 fps    + Compare + 📈 Graph
4K 3840x2160
40.3 51 56.5 62.9 64.3 66 70.7 71.6 71.9 ~ 62 fps    + Compare + 📈 Graph
» With most tested laptops playable in detail settings ultra.
Additional Benchmarks
Medium Graphics & Postprocessing 1920x1080
187.3
197
180
219.2
189.1
GTA V

GTA V

2015
low 1024x768
124.5 164 169 171 172 174 174 174 176 177 178 178 179 179 179 179 179 179 180 181 181 182 182.7 183.5 184 184 184 184.2 184.7 185 185 185 185 185.7 185.8 186.4 186.9 ~ 178 fps    + Compare
med. 1366x768
102.8 153 158 164 165 169 169 169 171 172 172 172 172 172 172 173 173 174 175 176 177 177 177.1 179 179 179.4 179.9 180 181 182 182 182.3 182.8 183.4 ~ 172 fps    + Compare
high 1920x1080
58.2 111 130 132 134 136 139 141 142 142.5 150 151 151 152 153 153 153 155 155 158 159 159 159 163 164 164 165.3 166 166 167.5 168.5 171.5 172 173 173.8 175 175.5 181.4 ~ 153 fps    + Compare
ultra 1920x1080
21.7 22.9 28 72.6 78.6 79.4 79.6 80.7 81.3 82.5 83.1 83.6 84.1 84.5 85 87.3 88.1 88.2 88.5 90.4 90.4 90.6 91.2 92.9 92.9 93.5 93.6 94 94.7 95.4 95.4 95.5 95.8 96.6 97 100 102.2 103 104 104.2 104.9 105.6 106 108 108.1 113.7 114 123.6 125 125.8 ~ 91 fps    + Compare
QHD 2560x1440
70.8 72.7 73.1 74.5 76.1 78.4 79.7 81.2 83 83.4 83.4 83.7 85.4 85.8 88.9 90.6 93 94.4 97.1 ~ 83 fps    + Compare
4K 3840x2160
74.3 75 83.3 85.6 100.8 ~ 84 fps    + Compare
» With most tested laptops playable in detail settings ultra.
Additional Benchmarks
Highest Settings possible 16xAF 4xMSAA + FXAA 3840x2160
46.7
44.4
39.8
50.8
50.3
Normal/Off 4xAF 1920x1080
138
172
177
167
171
156
181
171
170
173
164
156
158
163
171
167
173
175
160
163
174
178
175
171
171
172
172
170
183
172
176.1
186.2
181.3
178.1
179.2
177.8
94.3
178.5
180
Lowest Settings possible 1920x1080
150
179
182
173
175
185
176
175
180
170
164
165
169
178
173
179
182
168
168
181
183
180
178
176
176
177
186
178
183.2
185.2
183.5
182.3
182.8
183.8
98
184.5
184.2
lowmed.highultraQHD4K
Dragon's Dogma 254.252.749.333.9
Horizon Forbidden West104.296.262.760.54729.3
Alone in the Dark172.9156.8149.9102.451.516.1
Last Epoch192.2184.2167.2127.383.640.7
Skull & Bones11210384635031
Helldivers 213010191.389.565.635.3
Enshrouded80.368.858.849.23822.8
Palworld116.7106.1103102.172.938.7
Prince of Persia The Lost Crown356356356340178
Ready or Not210189.1174.8131.38237.2
The Finals222181.7160.6127.280.237.6
Avatar Frontiers of Pandora767261463116
Call of Duty Modern Warfare 3 2023146129101836743
EA Sports WRC130.898.190.783.463.235.5
Alan Wake 26761.253.233.614.1
Lords of the Fallen6868.165.253.954.634
Total War Pharaoh329.3205.4127.199.178.342.5
Assassin's Creed Mirage114106101796441
EA Sports FC 24249199.3161.7151.412979.5
Counter-Strike 2241230193.8149.5105.963.3
Cyberpunk 2077 2.0 Phantom Liberty122.999.384.87546.920.9
Lies of P160.7152130.2117.180.241.6
Starfield73.56451.647.132.523.1
Armored Core 6104.3102.4101.196.376.644.6
Immortals of Aveum62.451.241.728.215.9
Atlas Fallen144.5135127106.842.675.9
Baldur's Gate 3163.1121.610286.784.730.3
Ratchet & Clank Rift Apart87.675.766.863.561.751.3
Diablo 422618516214410052
Star Wars Jedi Survivor81.172.367.4573718
Dead Island 2209205164.31138139
The Last of Us96.682.271.655328
Resident Evil 4 Remake140103.196.7624827
Company of Heroes 3193.5167.4134.31229153
Sons of the Forest80.475.872.8675435
Atomic Heart186.7143.988.5644930
Returnal10410193795934
Hogwarts Legacy97.188.472.459.14726.7
Dead Space Remake87.783.973.373.653.827.5
The Witcher 3 v4.001751561331158246.5
High On Life21615717010365.527.6
The Callisto Protocol124.910990755532
Need for Speed Unbound10910291877844.8
Spider-Man Miles Morales124.8113106996944
Call of Duty Modern Warfare 2 202212912895926438
Uncharted Legacy of Thieves Collection83.48177745724
A Plague Tale Requiem107.97561473419
FIFA 23122.9120.3107.6104.879.7
The Quarry155.9118997855.528.3
F1 22239209172634020
Vampire Bloodhunt235226218142.873.1
Ghostwire Tokyo164.5166163161101.849.7
Tiny Tina's Wonderlands193163114896235
Cyberpunk 2077 1.612210788754622
Elex 298.49788826235
GRID Legends1801821581239261
Elden Ring59.759.459.359.348.1
Dying Light 2111.6917957.431.2
Rainbow Six Extraction24419618915410151
God of War12511191645436
Halo Infinite116101967341.2
Farming Simulator 2220517515113712680
Battlefield 20421341241079477.347.3
Forza Horizon 5211141129817050
Call of Duty Vanguard13811810777.743.8
Riders Republic1691381151057842
Guardians of the Galaxy12312512412210256
Back 4 Blood24721620114071.7
Far Cry 612310694867143
Alan Wake Remastered1009710491
FIFA 22311272237229220
New World1229390836738
Deathloop118108957240.3
F1 20212892141811008346
Monster Hunter Stories 2144144144142
Days Gone1541381259771.3
Mass Effect Legendary Edition10610094.3
Resident Evil Village16215815614597.4
Outriders10910410610479.3
Hitman 318015114414497.8
Cyberpunk 2077 1.01098571624018
Immortals Fenyx Rising11610191806241
Yakuza Like a Dragon125110104976831
Call of Duty Black Ops Cold War83755932
Assassin´s Creed Valhalla1199175675233
Dirt 519212498786844
Watch Dogs Legion1008878635428
FIFA 21181177159134
Star Wars Squadrons22921415690
Mafia Definitive Edition77.657.931.4
Serious Sam 412691837355.9
Crysis Remastered75544427
Flight Simulator 202059.141.642.238
Horizon Zero Dawn1219487796334
Death Stranding14413211010770.743.7
F1 202024321218414110560
Valorant254238
Gears Tactics240.2176.6119926932.5
Doom Eternal15218311864
Hunt Showdown98.462.330.9
Red Dead Redemption 2128108785437.524.3
Star Wars Jedi Fallen Order85827344
Need for Speed Heat81786943
GRID 201983.263.755.638.1
Borderlands 313912196815933
Control240130895829
Total War: Three Kingdoms202.3135.6100.778.9
Rage 210299.765.332.7
Anno 1800918574404129
The Division 2108855933
Far Cry New Dawn128110103918455
Metro Exodus18112288715635
Apex Legends14414312371
Battlefield V13412610263
Forza Horizon 421118918816714093
Shadow of the Tomb Raider1541321211148345
Strange Brigade37821718215912271
Far Cry 51431201141099151
X-Plane 11.111131008170
Final Fantasy XV Benchmark163118866742
Deus Ex Mankind Divided65
Rise of the Tomb Raider28920914712556
Dota 2 Reborn152137129121109
The Witcher 33602611689262
GTA V178172153918384
< 30 fps
< 60 fps
< 120 fps
≥ 120 fps

2
31
65

2
49
55

7
71
44

14
72
28
1
42
62
13
25
66
20
5

For more games that might be playable and a list of all games and graphics cards visit our Gaming List

v1.26
log 19. 22:02:15

#0 no ids found in url (should be separated by "_") +0s ... 0s

#1 not redirecting to Ajax server +0s ... 0s

#2 did not recreate cache, as it is less than 5 days old! Created at Fri, 19 Apr 2024 05:40:26 +0200 +0.001s ... 0.001s

#3 no comparison url found in template nbc.compare_page_1 needed +0.068s ... 0.069s

#4 no comparison url found in template nbc.compare_page_1 needed +0s ... 0.07s

#5 no comparison url found in template nbc.compare_page_1 needed +0s ... 0.07s

#6 no comparison url found in template nbc.compare_page_1 needed +0s ... 0.07s

#7 no comparison url found in template nbc.compare_page_1 needed +0s ... 0.071s

#8 no comparison url found in template nbc.compare_page_1 needed +0s ... 0.071s

#9 no comparison url found in template nbc.compare_page_1 needed +0s ... 0.071s

#10 no comparison url found in template nbc.compare_page_1 needed +0s ... 0.072s

#11 no comparison url found in template nbc.compare_page_1 needed +0s ... 0.072s

#12 no comparison url found in template nbc.compare_page_1 needed +0s ... 0.072s

#13 no comparison url found in template nbc.compare_page_1 needed +0s ... 0.072s

#14 no comparison url found in template nbc.compare_page_1 needed +0s ... 0.073s

#15 no comparison url found in template nbc.compare_page_1 needed +0s ... 0.073s

#16 no comparison url found in template nbc.compare_page_1 needed +0s ... 0.073s

#17 no comparison url found in template nbc.compare_page_1 needed +0s ... 0.073s

#18 no comparison url found in template nbc.compare_page_1 needed +0s ... 0.074s

#19 no comparison url found in template nbc.compare_page_1 needed +0s ... 0.074s

#20 no comparison url found in template nbc.compare_page_1 needed +0s ... 0.075s

#21 no comparison url found in template nbc.compare_page_1 needed +0s ... 0.075s

#22 no comparison url found in template nbc.compare_page_1 needed +0s ... 0.075s

#23 composed specs +0s ... 0.075s

#24 did output specs +0s ... 0.075s

#25 start showIntegratedCPUs +0s ... 0.075s

#26 getting avg benchmarks for device 10476 +0.035s ... 0.111s

#27 got single benchmarks 10476 +0.204s ... 0.315s

#28 got avg benchmarks for devices +0s ... 0.315s

#29 min, max, avg, median took s +1.543s ... 1.858s

#30 before gaming benchmark output +0.001s ... 1.859s

#31 Got 2590 rows for game benchmarks. +0.95s ... 2.808s

#32 composed SQL query for gamebenchmarks +0s ... 2.809s

#33 got data and put it in $dataArray +0.099s ... 2.907s

#34 benchmarks composed for output. +7.445s ... 10.352s

#35 no comparison url found in template nbc.compare_page_1 needed +0.017s ... 10.37s

#36 return log +0s ... 10.37s

Notebook reviews with NVIDIA GeForce RTX 3070 Laptop GPU graphics card

微星Pulse GL76笔记本电脑评测。105 W TGPGeForce RTX 3070图形

微星Pulse GL76笔记本电脑评测。105 W TGPGeForce RTX 3070图形

如果你不介意放弃一些辅助功能,那么Pulse GL76在性能和显示质量方面可以实现,尤其是其1200至1400美元的报价。预计随着移动GeForce 40笔记本电脑的推出,会有更多的销售。...
Intel Core i7-12700H | NVIDIA GeForce RTX 3070 Laptop GPU | 17.30" | 2.6 kg
微星Crosshair 15彩虹六号。萃取版评测

微星Crosshair 15彩虹六号提取版评论。超越主题的QHD 165 Hz中端机的能力

MSI Crosshair 15 Rainbow Six:萃取版采用了充满活力的设计,迎合了育碧流行的合作射击游戏的粉丝。在引擎盖下,我们得到了英特尔Alder Lake-H Core i7-12700H和Nvidia RTX 3070 Laptop GPU,它们共同对抗市场上一些更昂贵的竞争。QHD 165赫兹的加入...
Intel Core i7-12700H | NVIDIA GeForce RTX 3070 Laptop GPU | 15.60" | 2.5 kg
Minisforum NUCXi7 (来源: Minisforum)

Minisforum NUCXi7台式电脑评论。超薄的游戏电脑与GeForce RTX 3070和Core i7-11800H

通过NUCX系列,Minisforum系统制造商提供了一个全功能的游戏PC,几乎完全使用笔记本电脑的组件。我们能够拿到一台NUCXi7,并对该模型进行了更详细的了解,通过我们的测试课程进行了运行。你可以在我们的广泛评论中找到关于这个令人兴奋的设备的所有重要信息。...
Intel Core i7-11800H | NVIDIA GeForce RTX 3070 Laptop GPU | | 2.4 kg
Schenker XMG Fusion 15 (Mid 22) in review:轻量级RTX 3070笔记本电脑,电池寿命好

Schenker XMG Fusion 15 (Mid 22) in review:轻量级RTX 3070笔记本电脑,电池寿命好

酷睿i7-11800H处理器和GeForce RTX 3070笔记本GPU将所有最新的游戏流畅地呈现在哑光QHD屏幕上(165Hz)。辅之以机械键盘、良好的电池寿命和雷电4端口。...
Intel Core i7-11800H | NVIDIA GeForce RTX 3070 Laptop GPU | 15.60" | 1.9 kg
华硕TUF Dash F15 FX517ZR回顾。拥有移动RTX 3070和可接受的电池寿命的笔记本电脑

华硕TUF Dash F15 FX517ZR回顾。拥有移动RTX 3070和可接受的电池寿命的笔记本电脑

华硕TUF F15是一款中高档的QHD游戏笔记本,配置全面。酷睿i7-12650H,GeForce RTX 3070笔记本版本,16GB内存和1个TB SSD。哑光QHD显示屏几乎完全覆盖了DCI-P3色彩空间。Alder Lake CPU的E-cores可以被停用。...
Intel Core i7-12650H | NVIDIA GeForce RTX 3070 Laptop GPU | 15.60" | 2 kg

SCHENKER XMG Apex 15 Max: AMD Ryzen 9 5900X, 15.60", 2.6 kg
  Review » XMG Apex 15 Max (Clevo NH57VR)回顾。拥有台式机CPU的游戏笔记本

Zotac ZBOX Magnus EN173070C: Intel Core i7-11800H, 1.8 kg
  Review » Zotac ZBOX Magnus回顾。 GeForce RTX 3070移动版和Tiger Lake SoC在一个2.65升的箱子里

Eurocom RX315 NH57AF1: Intel Core i7-11800H, 15.60", 2 kg
  Review » 欧通RX315笔记本电脑评测。微星GS66的隐形替代品

Eurocom Nightsky ARX315: AMD Ryzen 9 5900X, 15.60", 2.6 kg
  Review » 在笔记本电脑上运行AMD Ryzen 9 5900X。Eurocom Nightsky ARX15回顾

Gigabyte A5 X1: AMD Ryzen 9 5900HX, 15.60", 2.2 kg
  Review » 技嘉A5 X1在审查。强大的游戏笔记本电脑

SCHENKER XMG Apex 17 M21: AMD Ryzen 7 5800H, 17.30", 2.6 kg
  Review » XMG Apex 17 (Clevo NH77ERQ)笔记本电脑评测。适用于抗噪的游戏玩家

Lenovo ThinkPad P1 G4-20Y4S0KS00: Intel Core i7-11850H, 16.00", 2 kg
  Review » 联想ThinkPad P1 G4笔记本电脑评测。成功使用Vapor-Chamber和GeForce RTX 3070

Gigabyte A7 X1: AMD Ryzen 9 5900HX, 17.30", 2.5 kg
  Review » Gigabyte A7 X1在审查中。游戏笔记本提供稳定的续航性能

ADATA XPG Xenia 15: Intel Core i7-11800H, 15.60", 1.9 kg
  Review » 威刚XPG Xenia 15笔记本电脑评测。几乎和Razer Blade一样锋利

HP Omen 16-b0085ng: Intel Core i7-11800H, 16.10", 2.4 kg
  Review » 惠普Omen 16笔记本电脑回顾。强大的RTX 3070游戏笔记本有不必要的缺点

Alienware x15 RTX 3070 P111F: Intel Core i7-11800H, 15.60", 2.4 kg
  Review » Alienware x15 R1笔记本电脑评测。戴尔最薄的UFO已经着陆

Razer Blade 17 RTX 3070: Intel Core i7-11800H, 17.30", 2.8 kg
  Review » Razer Blade 17笔记本电脑回顾。现在有130 W TGPGeForce RTX图形

MSI Katana GF66 11UG-220: Intel Core i7-11800H, 15.60", 2.3 kg
  Review » 微星Katana GF66 11UG评论。浪费了潜力的游戏笔记本

HP ZBook Studio 15 G8: Intel Core i9-11950H, 15.60", 1.9 kg
  Review » 惠普ZBook Studio 15 G8笔记本电脑评测。比以往更多的选择

Acer Nitro 5 AN515-45-R1JH: AMD Ryzen 7 5800H, 15.60", 2.3 kg
  Review » Acer Nitro 5 AN515-45在审查中。紧凑型QHD游戏笔记本

Lenovo Legion 5 Pro 16ACH6H (82JQ001PGE): AMD Ryzen 7 5800H, 16.00", 2.6 kg
  Review » 联想Legion 5 Pro 16评论。一个拥有明亮的165-Hz显示屏的游戏笔记本电脑

Gigabyte Aero 15 OLED XD: Intel Core i7-11800H, 15.60", 2.2 kg
  Review » Gigabyte Aero 15 OLED XD笔记本电脑评测。下一代4K OLED

Acer Predator Helios 300 PH315-54-73HX: Intel Core i7-11800H, 15.60", 2.3 kg
  External Review » Acer Predator Helios 300 PH315-54-73HX

HP Omen 16-b1023ns: Intel Core i7-12700H, 16.10", 2.4 kg
  External Review » HP Omen 16-b1023ns

Asus ROG Strix G17 G713QR, R7 5800H: AMD Ryzen 7 5800H, 17.30", 2.7 kg
  External Review » Asus ROG Strix G17 G713QR, R7 5800H

Lenovo Legion 5 Pro 16ARH7H, R7 6800H RTX 3070: AMD Ryzen 7 6800H, 16.00", 2.5 kg
  External Review » Lenovo Legion 5 Pro 16ARH7H, R7 6800H RTX 3070

Acer Nitro 5 AN515-57-77G3: Intel Core i7-11800H, 15.60", 2.2 kg
  External Review » Acer Nitro 5 AN515-57-77G3

HP Omen 16-b1020ns: Intel Core i7-12700H, 16.10", 2.4 kg
  External Review » HP Omen 16-b1020ns

Asus TUF Gaming A15 FA507RR-HQ008: AMD Ryzen 7 6800H, 15.60", 2.2 kg
  External Review » Asus TUF Gaming A15 FA507RR-HQ008

Asus TUF Gaming F15 FX507ZR, i7-12650H: Intel Core i7-12650H, 15.60", 2.2 kg
  External Review » Asus TUF Gaming F15 FX507ZR, i7-12650H

Asus TUF Gaming F15 FX507ZR: Intel Core i7-12700H, 15.60", 2.2 kg
  External Review » Asus TUF Gaming F15 FX507ZR

Lenovo Legion 5 15ACH6H-82JU018EMH: AMD Ryzen 7 5800H, 15.60", 2.4 kg
  External Review » Lenovo Legion 5 15ACH6H-82JU018EMH

HP Omen 16-c0092AX: AMD Ryzen 7 5800H, 16.10", 2.3 kg
  External Review » HP Omen 16-c0092AX

Asus TUF Dash F15 FX517ZR: Intel Core i7-12650H, 15.60", 2 kg
  External Review » Asus TUF Dash F15 FX517ZR

Lenovo Legion 5 15IAH7H-82RB00LLGE: Intel Core i7-12700H, 15.60", 2.4 kg
  External Review » Lenovo Legion 5 15IAH7H-82RB00LLGE

Asus TUF Gaming A15 FA507RR-HN003: AMD Ryzen 7 6800H, 15.60", 2.2 kg
  External Review » Asus TUF Gaming A15 FA507RR-HN003

MSI Pulse GL76 12UGK-091UK: Intel Core i9-12900H, 17.30", 2.6 kg
  External Review » MSI Pulse GL76 12UGK-091UK

Lenovo Legion 5 15ACH6H-82JU0185SP: AMD Ryzen 7 5800H, 15.60", 2.4 kg
  External Review » Lenovo Legion 5 15ACH6H-82JU0185SP

Lenovo Legion 5 15ITH6H-82JH0070SP: Intel Core i7-11800H, 15.60", 2.4 kg
  External Review » Lenovo Legion 5 15ITH6H-82JH0070SP

HP Omen 17-ck0006np: Intel Core i7-11800H, 17.30", 2.8 kg
  External Review » HP Omen 17-ck0006np

MSI Katana GF76 11UG-090: Intel Core i7-11800H, 17.30", 2.3 kg
  External Review » MSI Katana GF76 11UG-090

Alienware x15 R1, i9-11900H RTX 3070: Intel Core i9-11900H, 15.60", 2.4 kg
  External Review » Alienware x15 R1, i9-11900H RTX 3070

Acer Predator Helios 300 PH315-54-94U7: Intel Core i9-11900H, 15.60", 2.3 kg
  External Review » Acer Predator Helios 300 PH315-54-94U7

Acer Predator Helios 300 PH315-54-NH.QC1SN.003: Intel Core i9-11900H, 15.60", 2.2 kg
  External Review » Acer Predator Helios 300 PH315-54-NH.QC1SN.003

MSI Pulse GL66 11UGKV-231CA: Intel Core i7-11800H, 15.60", 2.3 kg
  External Review » MSI Pulse GL66 11UGKV-231CA

MSI Pulse GL76 12UGK-256: Intel Core i7-12700H, 17.30", 2.7 kg
  External Review » MSI Pulse GL76 12UGK-256

Lenovo Legion 5 15ACH6H-82JU0091GE: AMD Ryzen 7 5800H, 15.60", 2.4 kg
  External Review » Lenovo Legion 5 15ACH6H-82JU0091GE

Hyperbook Pulsar V17, 11800H RTX 3070: Intel Core i7-11800H, 17.30", 2 kg
  External Review » Hyperbook Pulsar V17, 11800H RTX 3070

MSI Pulse GL66 12UG: Intel Core i7-12700H, 15.60", 2.3 kg
  External Review » MSI Pulse GL66, 12700H RTX 3070 QHD

MSI Crosshair 15 R6E B12UGZ-050: Intel Core i7-12700H, 15.60", 2.5 kg
  External Review » MSI Crosshair 15 R6E B12UGZ-050

Lenovo ThinkPad P1 G4-20Y4S0KS00: Intel Core i7-11850H, 16.00", 2 kg
  External Review » Lenovo ThinkPad P1 G4-20Y4S0KS00

Asus TUF Gaming A15 FA507RR-HQ007W: AMD Ryzen 7 6800H, 15.60", 2.2 kg
  External Review » Asus TUF Gaming A15 FA507RR-HQ007W

Asus TUF Gaming A17 FA707RR: AMD Ryzen 7 6800H, 17.30", 2.6 kg
  External Review » Asus TUF Gaming A17 FA707RR

Asus ProArt StudioBook Pro 16 H5600QM-L2160W: AMD Ryzen 9 5900HX, 16.00", 2.4 kg
  External Review » Asus ProArt StudioBook Pro 16 H5600QM-L2160W

HP Omen 16-c0087ng: AMD Ryzen 7 5800H, 16.10", 2.3 kg
  External Review » HP Omen 16-c0087ng

ADATA XPG Xenia 15: Intel Core i7-11800H, 15.60", 1.9 kg
  External Review » ADATA XPG Xenia 15

Lenovo Legion 7 16ITHg6-82K600AFGE: Intel Core i7-11800H, 16.00", 2.5 kg
  External Review » Lenovo Legion 7 16ITHg6-82K600AFGE

HP Omen 17-ck0039nf: Intel Core i7-11800H, 17.30", 1.8 kg
  External Review » HP Omen 17-ck0039nf

Asus ROG Strix G17 G713QR-K4048T: AMD Ryzen 9 5900HX, 17.30", 2.7 kg
  External Review » Asus ROG Strix G17 G713QR-K4048T

Alienware m15 R6 9GYW5: Intel Core i9-11900H, 15.60", 2.7 kg
  External Review » Alienware m15 R6 9GYW5

HP Omen 15-en1845no: AMD Ryzen 9 5900HX, 15.60", 2.5 kg
  External Review » HP Omen 15-en1845no

HP Omen 16-b0426no: Intel Core i7-11800H, 16.10", 2.3 kg
  External Review » HP Omen 16-b0426no

MSI GS76 Stealth 11UG-232: Intel Core i9-11900H, 17.30", 2.5 kg
  External Review » MSI GS76 Stealth 11UG-232

Lenovo IdeaPad 5 Pro 16ACH6-82JQ007LMH: AMD Ryzen 7 5800H, 16.00", 2.5 kg
  External Review » Lenovo IdeaPad 5 Pro 16ACH6-82JQ007LMH

Acer Nitro 5 AN517-41-R37U: AMD Ryzen 7 5800H, 17.30", 2.7 kg
  External Review » Acer Nitro 5 AN517-41-R37U

Asus ProArt Studiobook 16 H5600QR: AMD Ryzen 9 5900HX, 16.00", 2.4 kg
  External Review » Asus ProArt Studiobook 16 H5600QR

Acer Predator Helios 300 PH315-53-785U: Intel Core i7-10750H, 15.60", 2.3 kg
  External Review » Acer Predator Helios 300 PH315-53-785U

MSI GE66 Raider 11UG-267: Intel Core i7-11800H, 15.60", 2.4 kg
  External Review » MSI GE66 Raider 11UG-267

MSI Katana GF66 11UG-220: Intel Core i7-11800H, 15.60", 2.3 kg
  External Review » MSI Katana GF66 11UG-220

MSI GP66 Leopard 11UG-017PL: Intel Core i7-11800H, 15.60", 2.4 kg
  External Review » MSI GP66 Leopard 11UG-017PL

MSI GS76 Stealth 11UG-270: Intel Core i7-11800H, 17.30", 2.5 kg
  External Review » MSI GS76 Stealth 11UG-270

Razer Blade 15 Advanced Model RZ09-0409BGA3-R3G1: Intel Core i7-11800H, 15.60", 2 kg
  External Review » Razer Blade 15 Advanced Model RZ09-0409BGA3-R3G1

HP Omen 16-c0093ax: AMD Ryzen 9 5900HX, 16.10", 2.3 kg
  External Review » HP Omen 16-c0093ax

HP Omen 15-en1004ns: AMD Ryzen 7 5800H, 15.60", 2.5 kg
  External Review » HP Omen 15-en1004ns

Alienware x15 R1-JH85R: Intel Core i7-11800H, 15.60", 2.4 kg
  External Review » Alienware x15 R1-JH85R

MSI GP66 Leopard 10UG-471CZ: Intel Core i7-10750H, 15.60", 2.4 kg
  External Review » MSI GP66 Leopard 10UG-471CZ

Acer Predator Helios 300 PH317-55-70YF: Intel Core i7-11800H, 17.30", 3 kg
  External Review » Acer Predator Helios 300 PH317-55-70YF

HP ZBook Studio G8-525U8PA: Intel Core i9-11950H, 15.60", 1.8 kg
  External Review » HP ZBook Studio G8-525U8PA

MSI GP66 Leopard 11UG-296: Intel Core i7-11800H, 15.60", 2.4 kg
  External Review » MSI GP66 Leopard 11UG-296

Alienware x17 R1, i7-11800H RTX 3070 FHD: Intel Core i7-11800H, 17.30", 3 kg
  External Review » Alienware x17 R1, i7-11800H RTX 3070 FHD

HP ZBook Studio 15 G8: Intel Core i9-11950H, 15.60", 1.9 kg
  External Review » HP ZBook Studio 15 G8

Lenovo Legion 5i Pro 16ITH6H-82JD0011HH: Intel Core i7-11800H, 16.00", 2.3 kg
  External Review » Lenovo Legion 5i Pro 16ITH6H-82JD0011HH

Asus ProArt StudioBook 16 H5600, 5900HX 3070: AMD Ryzen 9 5900HX, 16.00", 2.4 kg
  External Review » Asus ProArt StudioBook 16 H5600, 5900HX 3070

Lenovo Legion 5 15ACH-06-82JY0001GE: AMD Ryzen 7 5800H, 15.60", 2.4 kg
  External Review » Lenovo Legion 5 15ACH-06-82JY0001GE

Acer Nitro 5 AN515-45-R7S0: AMD Ryzen 7 5800H, 15.60", 2.3 kg
  External Review » Acer Nitro 5 AN515-45-R7S0

Asus ROG Zephyrus M16 GU603HR-K8030T: Intel Core i7-11800H, 16.00", 1.9 kg
  External Review » Asus ROG Zephyrus M16 GU603HR-K8030T

Acer Nitro 5 AN515-57-729U: Intel Core i7-11800H, 15.60", 2.3 kg
  External Review » Acer Nitro 5 AN515-57-729U

MSI ‎Pulse GL66 11UGK-001: Intel Core i7-11800H, 15.60", 2.3 kg
  External Review » MSI ‎Pulse GL66 11UGK-001

Aorus 15P XD: Intel Core i7-11800H, 15.40", 2.2 kg
  External Review » Aorus 15P XD

Acer Predator Helios 300 PH315-53-7144: Intel Core i7-10750H, 15.60", 2.5 kg
  External Review » Acer Predator Helios 300 PH315-53-7144

Acer Nitro 5 AN515-45-R1JH: AMD Ryzen 7 5800H, 15.60", 2.3 kg
  External Review » Acer Nitro 5 AN515-45-R1JH

Asus ZenBook Pro Duo UX582LR-H2004T: Intel Core i7-10870H, 16.00", 2.4 kg
  External Review » Asus ZenBook Pro Duo UX582LR-H2004T

MSI GE66 Raider 10UG-270ES: Intel Core i9-10980HK, 15.60", 2.4 kg
  External Review » MSI GE66 Raider 10UG-270ES

Alienware m15 R6 8F42P: Intel Core i7-11800H, 15.60", 2.7 kg
  External Review » Alienware m15 R6 8F42P

Lenovo ThinkPad T15g G2-20YS001YUS: Intel Core i9-11950H, 15.60", 2.9 kg
  External Review » Lenovo ThinkPad T15g G2-20YS001YUS

Alienware m15 R5-19XK2: AMD Ryzen 9 5900HX, 15.60", 2.7 kg
  External Review » Alienware m15 R5-19XK2

Lenovo ThinkPad X1 Extreme G4-20Y5000SUS: Intel Core i7-11850H, 16.00", 1.9 kg
  External Review » Lenovo ThinkPad X1 Extreme G4-20Y5000SUS

MSI Creator 15 A10UG: Intel Core i7-10875H, 15.60", 2.1 kg
  External Review » MSI Creator 15 A10UG

HP Omen 15-ek1013ur: Intel Core i7-10750H, 15.60", 2.5 kg
  External Review » HP Omen 15-ek1013ur

MSI GS66 Stealth 10UG: Intel Core i7-10870H, 15.60", 2.1 kg
  External Review » MSI GS66 Stealth 10UG

HP Omen 15-ek1035TX: Intel Core i7-10750H, 15.60", 2.5 kg
  External Review » HP Omen 15-ek1035TX

Acer Predator Helios 300 PH315-54-NH.QC1EK.002: Intel Core i7-11800H, 15.60", 2.3 kg
  External Review » Acer Predator Helios 300 PH315-54-NH.QC1EK.002

Gigabyte Aero 17 HDR XD: Intel Core i7-11800H, 17.30", 2.5 kg
  External Review » Gigabyte Aero 17 HDR XD

MSI GE66 Raider 10UG-269Es: Intel Core i9-10980HK, 15.60", 2.4 kg
  External Review » MSI GE66 Raider 10UG-269Es

MSI GP76 Leopard 11UG-081IT: Intel Core i7-11800H, 17.30", 2.9 kg
  External Review » MSI GP76 Leopard 11UG-081IT

Gigabyte A7 X1: AMD Ryzen 9 5900HX, 17.30", 2.5 kg
  External Review » Gigabyte A7 X1

HP Omen 15-en1177ng: AMD Ryzen 7 5800H, 15.60", 2.5 kg
  External Review » HP Omen 15-en1177ng

Lenovo Legion 5 Pro 16ACH6H (82JQ001PGE): AMD Ryzen 7 5800H, 16.00", 2.6 kg
  External Review » Lenovo Legion 5 Pro 16ACH6H 5800H, RTX 3070

Alienware m15 R5, 5800H RTX 3070: AMD Ryzen 7 5800H, 15.60", 2.7 kg
  External Review » Alienware m15 R5, 5800H RTX 3070

Acer Predator Helios 300 PH315-53-786B: Intel Core i7-10750H, 15.60", 2.2 kg
  External Review » Acer Predator Helios 300 PH315-53-786B

Lenovo Legion 7 16ACHg6-82N60092GE: AMD Ryzen 7 5800H, 16.00", 2.5 kg
  External Review » Lenovo Legion 7 16ACHg6-82N60092GE

Acer Nitro 5 AN517-41-R5Z7: AMD Ryzen 7 5800H, 17.30", 2.7 kg
  External Review » Acer Nitro 5 AN517-41-R5Z7

Acer Predator Triton 500 SE PT516-51s-75WM: Intel Core i7-11800H, 16.00", 2.5 kg
  External Review » Acer Predator Triton 500 SE PT516-51s-75WM

MSI Creator 15 A10UGT-470: Intel Core i7-10870H, 15.60", 2.1 kg
  External Review » MSI Creator 15 A10UGT-470

Asus ZenBook Pro Duo UX582LR-H2002R: Intel Core i9-10980HK, 15.60", 2.5 kg
  External Review » Asus ZenBook Pro Duo UX582LR-H2002R

Razer Blade 14 Ryzen 9 RTX 3070: AMD Ryzen 9 5900HX, 14.00", 1.8 kg
  External Review » Razer Blade 14 Ryzen 9 RTX 3070

Asus ZenBook Pro Duo UX582 LR-1BH2: Intel Core i7-10870H, 15.60", 2.4 kg
  External Review » Asus ZenBook Pro Duo UX582 LR-1BH2

Acer Nitro 5 AN515-45-R8BM: AMD Ryzen 7 5800H, 15.60", 2.3 kg
  External Review » Acer Nitro 5 AN515-45-R8BM

Lenovo Legion 5 Pro 16ACH6H-82JQ007JMH: AMD Ryzen 7 5800H, 16.00", 2.5 kg
  External Review » Lenovo Legion 5 Pro 16ACH6H-82JQ007JMH

HP Omen 15-ek1004ns: Intel Core i7-10870H, 15.60", 2.5 kg
  External Review » HP Omen 15-ek1004ns

Alienware m15 R4, i7-10870H RTX 3070: Intel Core i7-10870H, 15.60", 2.5 kg
  External Review » Alienware m15 R4, i7-10870H RTX 3070

Gigabyte Aero 15 OLED XD: Intel Core i7-11800H, 15.60", 2.2 kg
  External Review » Gigabyte Aero 15 OLED XD

Asus ROG Zephyrus M16 GU603H: Intel Core i9-11900H, 16.00", 2 kg
  External Review » Asus ROG Zephyrus M16 GU603H

Lenovo Legion 5 Pro 16ACH6H-82JQ007GMH: AMD Ryzen 7 5800H, 16.00", 2.5 kg
  External Review » Lenovo Legion 5 Pro 16ACH6H-82JQ007GMH

Asus ROG Strix G17 G713QR-HX023T: AMD Ryzen 7 5800H, 17.30", 2.7 kg
  External Review » Asus ROG Strix G17 G713QR-HX023T

Asus Strix Scar 15 G533QR: AMD Ryzen 9 5900HX, 15.60", 2.3 kg
  External Review » Asus Strix Scar 15 G533QR

HP Omen 15-ek1047nf: Intel Core i7-10750H, 15.60", 2.5 kg
  External Review » HP Omen 15-ek1047nf

MSI GP76 Leopard 10UG-066XES: Intel Core i7-10870H, 17.30"
  External Review » MSI GP76 Leopard 10UG-066XES

Lenovo Legion 5 Pro 16ACH6H-82JQ001FGE: AMD Ryzen 7 5800H, 16.00", 2.5 kg
  External Review » Lenovo Legion 5 Pro 16ACH6H-82JQ001FGE

Asus ROG Strix G15 G513QR-HF010T: AMD Ryzen 7 5800H, 15.60", 2.3 kg
  External Review » Asus ROG Strix G15 G513QR-HF010T

MSI GP76 Leopard 10UG: Intel Core i7-10750H, 17.30", 2.9 kg
  External Review » MSI GP76 Leopard 10UG

MSI GE76 Raider 10UG-289: Intel Core i7-10870H, 17.30", 2.9 kg
  External Review » MSI GE76 Raider 10UG-289

Razer Blade 15 Base Edition 2021, i7-10750H, RTX 3070: Intel Core i7-10750H, 15.60", 2.1 kg
  External Review » Razer Blade 15 Base Edition 2021, i7-10750H, RTX 3070

Asus ROG Zephyrus G15 GA503QR: AMD Ryzen 9 5900HS, 15.60", 1.9 kg
  External Review » Asus Zephyrus G15 GA503QR

MSI GE76 Raider 10UG-258FR: Intel Core i7-10870H, 17.30", 2.9 kg
  External Review » MSI GE76 Raider 10UG-258FR

Asus TUF A15 566QR-HN062T: AMD Ryzen 7 5800H, 15.60", 2.3 kg
  External Review » Asus TUF A15 566QR-HN062T

MSI GE66 Raider 10UG: Intel Core i7-10875H, 15.60", 2.4 kg
  External Review » MSI GE66 Raider 10UG

SCHENKER XMG Pro 17 (Early 2021, RTX 3070): Intel Core i7-10875H, 17.30", 2.3 kg
  External Review » Schenker XMG Pro 17 (Early 2021, RTX 3070)

Alienware m15 R4: Intel Core i9-10980HK, 15.60", 2.3 kg
  External Review » Alienware m15 R4

Asus TUF A15 566QR-AZ057: AMD Ryzen 7 5800H, 15.60", 2.3 kg
  External Review » Asus TUF A15 566QR-AZ057

MSI GP66 Leopard 10UG: Intel Core i7-10870H, 15.60", 2.3 kg
  External Review » MSI GP66 Leopard 10UG

Asus ROG Strix G15 G513QR: AMD Ryzen 9 5900HX, 15.60", 2.3 kg
  External Review » Asus ROG Strix G15 G513QR

Asus ROG Zephyrus Duo 15 SE GX551QR: AMD Ryzen 9 5900HX, 15.60", 2.5 kg
  External Review » Asus ROG Zephyrus Duo 15 SE GX551QR

Asus TUF Dash F15 FX516PR-AZ019T: Intel Core i7-11370H, 15.60", 2 kg
  External Review » Asus TUF Dash F15 FX516PR-AZ019T

Asus TUF Gaming Dash F15 FX516PR-HN002: Intel Core i7-11370H, 15.60", 2 kg
  External Review » Asus TUF Gaming Dash F15 FX516PR-HN002

Aorus 15G XC: Intel Core i7-10870H, 15.60", 2.1 kg
  External Review » Aorus 15G XC

Asus TUF Gaming A17 FA706QR: AMD Ryzen 7 5800H, 17.30", 2.6 kg
  External Review » Asus TUF Gaming A17 FA706QR

Asus TUF Gaming A15 FA506QR: AMD Ryzen 7 5800H, 15.60", 2.3 kg
  External Review » Asus TUF Gaming A15 FA506QR

Asus ROG Strix G15 G513QR: AMD Ryzen 7 5800H, 15.60", 2.1 kg
  External Review » Asus Strix G15 G513QR

Asus Strix G17 G713QR: AMD Ryzen 9 5900HX, 17.30", 2.7 kg
  External Review » Asus Strix G17 G713QR

Gigabyte Aero 15 OLED XC: Intel Core i7-10870H, 15.60", 2.2 kg
  External Review » Gigabyte Aero 15 OLED XC

Aorus 17g XC: Intel Core i7-10870H, 17.30", 2.7 kg
  External Review » Aorus 17g XC

Asus TUF Dash F15 FX516PR: Intel Core i7-11370H, 15.60", 2 kg
  External Review » Asus TUF Dash F15 FX516PR

Asus Strix Scar 17 G733QR: AMD Ryzen 9 5900HX, 17.30", 2.7 kg
  External Review » Asus Strix Scar 17 G733QR

MSI GP76 Leopard 10UG-291: Intel Core i7-10750H, 17.30", 2.9 kg
  External Review » MSI GP76 Leopard 10UE-291

Aorus 15P XC: Intel Core i7-10870H, 15.60", 2.2 kg
  External Review » Aorus 15P XC

Please share our article, every link counts!

» Comparison of GPUs
Detailed list of all laptop GPUs sorted by class and performance.

» Benchmark List
Sort and restrict laptop GPUs based on performance in synthetic benchmarks.

» Notebook Gaming List
Playable games for each graphics card and their average FPS results.

Class 1

GeForce RTX 2080 Super Mobile

Class 2

M1 Max 32-Core GPU *
GeForce RTX 2070 Super Mobile
M1 Max 24-Core GPU *
Quadro RTX 5000 Max-Q
Radeon RX 5700M *
GeForce GTX 1080 Mobile
Quadro RTX 4000 (Laptop)
M1 Pro 16-Core GPU *
Radeon PRO W6600M *
GeForce RTX 2070 Super Max-Q
Quadro RTX 4000 Max-Q *
M1 Pro 14-Core GPU *
Quadro P5200
Quadro RTX 3000 Max-Q *
Quadro P4200
Quadro P5000 Max-Q *
GeForce GTX 980 (Laptop)
Quadro P4000
Quadro P4000 Max-Q
Quadro P3200
Radeon RX 580X (Laptop) *
Radeon RX 580 (Laptop)
Radeon Pro 5300M
Radeon RX 5300M
Quadro P3000 Max-Q *
Quadro T2000 Max-Q *
Radeon Pro WX 7100 *
Radeon RX 570X (Laptop) *
Radeon RX 570 (Laptop) *
Radeon RX 470 (Laptop) *
Quadro T1000 Max-Q *

Class 3

Vega M GH
Quadro M5000M
GeForce GTX 1050 Ti Mobile
Radeon 680M
Quadro P2000
Quadro P2000 Max-Q
Quadro M4000M
T500 Laptop GPU *
Radeon R9 M395X
GeForce GTX 1050 Ti Max-Q *
Radeon Pro Vega 16
WX Vega M GL
Radeon R9 M485X
Quadro M3000M
FirePro W7170M
Radeon R9 M395
GeForce GTX 1050 Max-Q *
Radeon 660M
Radeon Pro WX 4150 *
Radeon RX 560X (Laptop)
Radeon RX 560 (Laptop)
Radeon RX 460 (Laptop)
Quadro P1000
Radeon R9 M390
Xe MAX
Radeon Pro 560X
Radeon Pro 560
Radeon Pro 460
Radeon Pro WX 4130 *
GeForce GTX 960M
Quadro P620 *
Radeon RX 550X (Laptop)
Radeon Pro WX 3200 *
Radeon Pro 555X
Radeon Pro 555
Radeon Pro 455
Quadro P600
Quadro M2000M
Radeon RX 540X *
Radeon Pro WX 2100 *
Radeon Pro WX 3100 *
GeForce GTX 950M
Radeon Pro 450
Radeon 630
Radeon 540X *
Radeon R9 M385X
Quadro P520
Quadro M1000M
GeForce 945M
Quadro P500 *
Iris Plus Graphics G7 (Ice Lake 64 EU) *
Vega 10 *
Iris Pro Graphics 580
FirePro W5170M *
Radeon R9 M370X
Vega 9
FirePro W5130M
UHD Graphics Xe G4 48EUs *
UHD Graphics 32EUs
UHD Graphics Xe 32EUs (Tiger Lake-H) *
UHD Graphics 750
Vega 7
Radeon R7 M465
Iris Pro Graphics 6200
Vega 8
GeForce 940M
Iris Plus Graphics G4 (Ice Lake 48 EU)
Quadro M600M
FirePro W4190M
Radeon R9 M375
Radeon R7 M445
Iris Plus Graphics 650
Iris Graphics 550
Radeon 625
Vega 6 *
Iris Plus Graphics 640
Iris Graphics 540
UHD Graphics 24EUs (Alder Lake-N) *
Radeon R7 M360
GeForce 920M
Radeon 620
Radeon R7 M340
Radeon 610
Radeon 610M *
Vega 6 *
UHD Graphics G1 (Ice Lake 32 EU)
UHD Graphics Xe 16EUs (Tiger Lake-H) *
HD Graphics 530
Radeon R5 (Bristol Ridge)
Adreno 690 *
Adreno 685 *
Adreno 680 *
Radeon R5 M330
GeForce 910M
HD Graphics 520

Class 4

UHD Graphics 730
Radeon R5 M320 *
Radeon R5 M315 *
Radeon R5 M420 *
Vega 2 *
UHD Graphics 617
UHD Graphics 615
HD Graphics 515
UHD Graphics 610
HD Graphics 510
UHD Graphics 605
Radeon R4 (Stoney Ridge)
Radeon R2 (Stoney Ridge)
HD Graphics (Broadwell)
UHD Graphics 600
HD Graphics (Braswell)

Class 5

* Approximate position of the graphics adapter

> Notebookcheck中文版(NBC中国) > FAQ / 小提示/ 技术参数 > 移动显示芯片——基准测试成绩列表 > NVIDIA GeForce RTX 3070 Laptop GPU
Klaus Hinum (Update: 2021-08-13)