


联想 ThinkPad P51s (酷睿 i7, 4k) 工作站简短评测
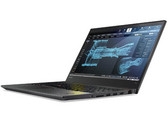
持久。 联想的ThinkPad P51s移动工作站比其前身更轻薄,更简洁。该设备现在也可以搭配现代雷电3接口。由于采用了高容量的外置电池,笔记本电脑的续航时间很长。
Intel Core i7-7600U, NVIDIA Quadro M520, 15.6", 2.2 kg英伟达Quadro M520是一款面向移动工作站的显卡,兼容DirectX 12(FL 11_0)和OpenGL 4.5。是一个基于Maxwell的显卡,采用带有384个着色器核心的GM108芯片,由台积电(TSMC)在28纳米级别制造。这意味着它与Quadro M500M(DDR3)类似,但配备了更快的GDDR5内存。 带有GDDR5内存的GeForce 940MX是Quadro M520的消费级别产品。
Quadro系列提供经过认证的驱动程序,针对CAD或DCC等专业应用程序的稳定性和性能进行了优化。例如,OpenGL的性能应该明显好于类似规格的GeForce显卡。
构架
与Kepler相比,Maxwell已经在几个细节上进行了优化,以提高能源效率。只有128个ALU(Kepler:192)的较小流式多处理器(SMM)和优化的调度程序应该能够更好地利用着色器。英伟达承诺,拥有128个ALU的Maxwell SMM可以提供具有192个ALU的Kepler SMX 90%的性能。GM108具有3个SMM,因此具有384个着色器核心,24个TMU和8个ROP(64位接口)。
另一个优化的地方是:大规模放大的L2缓存。较大的容量可以减少一些内存流量,以允许相对较窄的存储器接口,而不会显着地降低性能。
GM108支持DirectX 11.2 (仅支持的11.0级别)和DirectX 12。
性能
目前,M520型号的时钟频率尚不清楚。应该与带有GDDR5的消费级别产品940 MX类似。因此,性能应该与Quadro K620M相似。
特点
功能应该包括对最多四个活动显示器的支持。使用DisplayPort 1.2或HDMI 1.4a(HDMI 2.0不支持)可以连接高达3840x2160像素的高分辨率显示器。 HD-Audio编解码器(如杜比TrueHD和DTS-HD)可以通过HDMI端口通过比特流模式传输。 但是,由于大多数笔记本电脑都具有Optimus特性,集成的GPU可能会直接控制显示器端口,并可能会限制Nvidia Kepler显卡提供的功能。
采用了CUDA或OpenCL,Quadro M520的内核可用于一般计算。
GM108集成了第六代PureVideo高清视频引擎(VP6),为H.264和MPEG-2视频提供更好的解码性能。 当然,VP6支持上一代的所有功能(支持4K、PIP、通过NVENC API进行视频编码)。
能耗
M520的功耗额定功率为25瓦TGP(包括内存和电路板在内的最大功耗)。略低于额定功率为30瓦的M500M。因此,该显卡最适合的是13-14英寸及以上的笔记本电脑。M500M还支持在集成显卡和英伟达显卡之间的自动切换。
Quadro M Series
| |||||||||||||||||||||||||||||||||||||||||||||||||||||||
| Architecture | Maxwell | ||||||||||||||||||||||||||||||||||||||||||||||||||||||
| Pipelines | 384 - unified | ||||||||||||||||||||||||||||||||||||||||||||||||||||||
| Core Speed | 756 - 1019 (Boost) MHz | ||||||||||||||||||||||||||||||||||||||||||||||||||||||
| Memory Bus Width | 64 Bit | ||||||||||||||||||||||||||||||||||||||||||||||||||||||
| Memory Type | GDDR5 | ||||||||||||||||||||||||||||||||||||||||||||||||||||||
| Max. Amount of Memory | 1024 MB | ||||||||||||||||||||||||||||||||||||||||||||||||||||||
| Shared Memory | no | ||||||||||||||||||||||||||||||||||||||||||||||||||||||
| API | DirectX 12 (FL 11_0), Shader 5.0, OpenGL 4.5 | ||||||||||||||||||||||||||||||||||||||||||||||||||||||
| Power Consumption | 25 Watt | ||||||||||||||||||||||||||||||||||||||||||||||||||||||
| Man. Technology | 28 nm | ||||||||||||||||||||||||||||||||||||||||||||||||||||||
| Features | Optimus, PhysX, 3D Vision Pro, nView, Optimus | ||||||||||||||||||||||||||||||||||||||||||||||||||||||
| Notebook Size | medium sized | ||||||||||||||||||||||||||||||||||||||||||||||||||||||
| Date of Announcement | 13.01.2017 | ||||||||||||||||||||||||||||||||||||||||||||||||||||||
| Link to Manufacturer Page | www.nvidia.de | ||||||||||||||||||||||||||||||||||||||||||||||||||||||
The following benchmarks stem from our benchmarks of review laptops. The performance depends on the used graphics memory, clock rate, processor, system settings, drivers, and operating systems. So the results don't have to be representative for all laptops with this GPU. For detailed information on the benchmark results, click on the fps number.


| low | med. | high | ultra | QHD | 4K | |
|---|---|---|---|---|---|---|
| Prey | 85.4 | 32.8 | 26.7 | 22 | ||
| Ghost Recon Wildlands | 38.1 | 14.3 | 12 | 3.6 | ||
| For Honor | 64.6 | 23 | 21.9 | 15.9 | ||
| Resident Evil 7 | 84 | 40 | 22.1 | 6.6 | ||
| Titanfall 2 | 72.2 | 52.5 | 21.3 | 17.3 | ||
| Farming Simulator 17 | 183.1 | 120.6 | 49.8 | 32.1 | 13.7 | |
| Battlefield 1 | 56.4 | 43.9 | 33 | 28.2 | ||
| Civilization 6 | 50.8 | 30.4 | 15.2 | 11.7 | ||
| Deus Ex Mankind Divided | 27.2 | 21 | 11.6 | 5.3 | ||
| Ashes of the Singularity | 23.6 | 14.3 | 12 | |||
| The Division | 52.2 | 31.8 | 14.8 | 11.2 | ||
| Far Cry Primal | 46 | 20 | 18 | 12 | ||
| Rise of the Tomb Raider | 30 | 21.5 | 13.3 | 11.7 | ||
| Rainbow Six Siege | 94.5 | 60.1 | 31.8 | 22.8 | 8.1 | |
| Star Wars Battlefront | 78.2 | 48.9 | 22.3 | 19.1 | ||
| Anno 2205 | 60.1 | 36.2 | 17.7 | 7.4 | ||
| World of Warships | 135.6 | 108.1 | 54 | 36.7 | 11 | |
| Dirt Rally | 145.6 | 75.1 | 40.5 | 18.7 | 14.7 | |
| Battlefield Hardline | 81.1 | 74.2 | 30.4 | 19.6 | ||
| Dragon Age: Inquisition | 68.2 | 51.7 | 18.3 | 12.2 | ||
| Middle-earth: Shadow of Mordor | 54.6 | 32.9 | 22.8 | 16.2 | ||
| BioShock Infinite | 138.2 | 76.9 | 64.1 | 24.2 | ||
| Tomb Raider | 188.1 | 97.9 | 59.5 | 28.8 | ||
| low | med. | high | ultra | QHD | 4K | < 30 fps < 60 fps < 120 fps ≥ 120 fps | 2 7 9 5 | 6 10 6 1 | 15 7 1 | 20 2 | | 4 |
For more games that might be playable and a list of all games and graphics cards visit our Gaming List
Lenovo ThinkPad P51s 20HB000URT: Intel Core i7-7500U, 15.60", 2.5 kg
External Review » Lenovo ThinkPad P51s 20HB000URT
Lenovo ThinkPad P51s 20HB000SGE: Intel Core i7-7600U, 15.60", 2.2 kg
External Review » Lenovo ThinkPad P51s 20HB000SGE
» Comparison of GPUs
Detailed list of all laptop GPUs sorted by class and performance.
» Benchmark List
Sort and restrict laptop GPUs based on performance in synthetic benchmarks.
» Notebook Gaming List
Playable games for each graphics card and their average FPS results.
* Approximate position of the graphics adapter
» Notebookcheck多媒体笔记本电脑Top 10排名
» Notebookcheck游戏笔记本电脑Top 10排名
» Notebookcheck低价办公/商务笔记本电脑Top 10排名
» Notebookcheck高端办公/商务笔记本电脑Top 10排名
» Notebookcheck工作站笔记本电脑Top 10排名
» Notebookcheck亚笔记本电脑Top 10排名
» Notebookcheck超级本产品Top 10排名
» Notebookcheck变形本产品Top 10排名
» Notebookcheck平板电脑Top 10排名
» Notebookcheck智能手机Top 10排名
» Notebookcheck评测过最出色的笔记本电脑屏幕
» Notebookcheck售价500欧元以下笔记本电脑Top 10排名
» Notebookcheck售价300欧元以下笔记本电脑Top 10排名