DellLatitude 7330 Rugged Extreme评论。最好的13英寸耐用型笔记本电脑之一
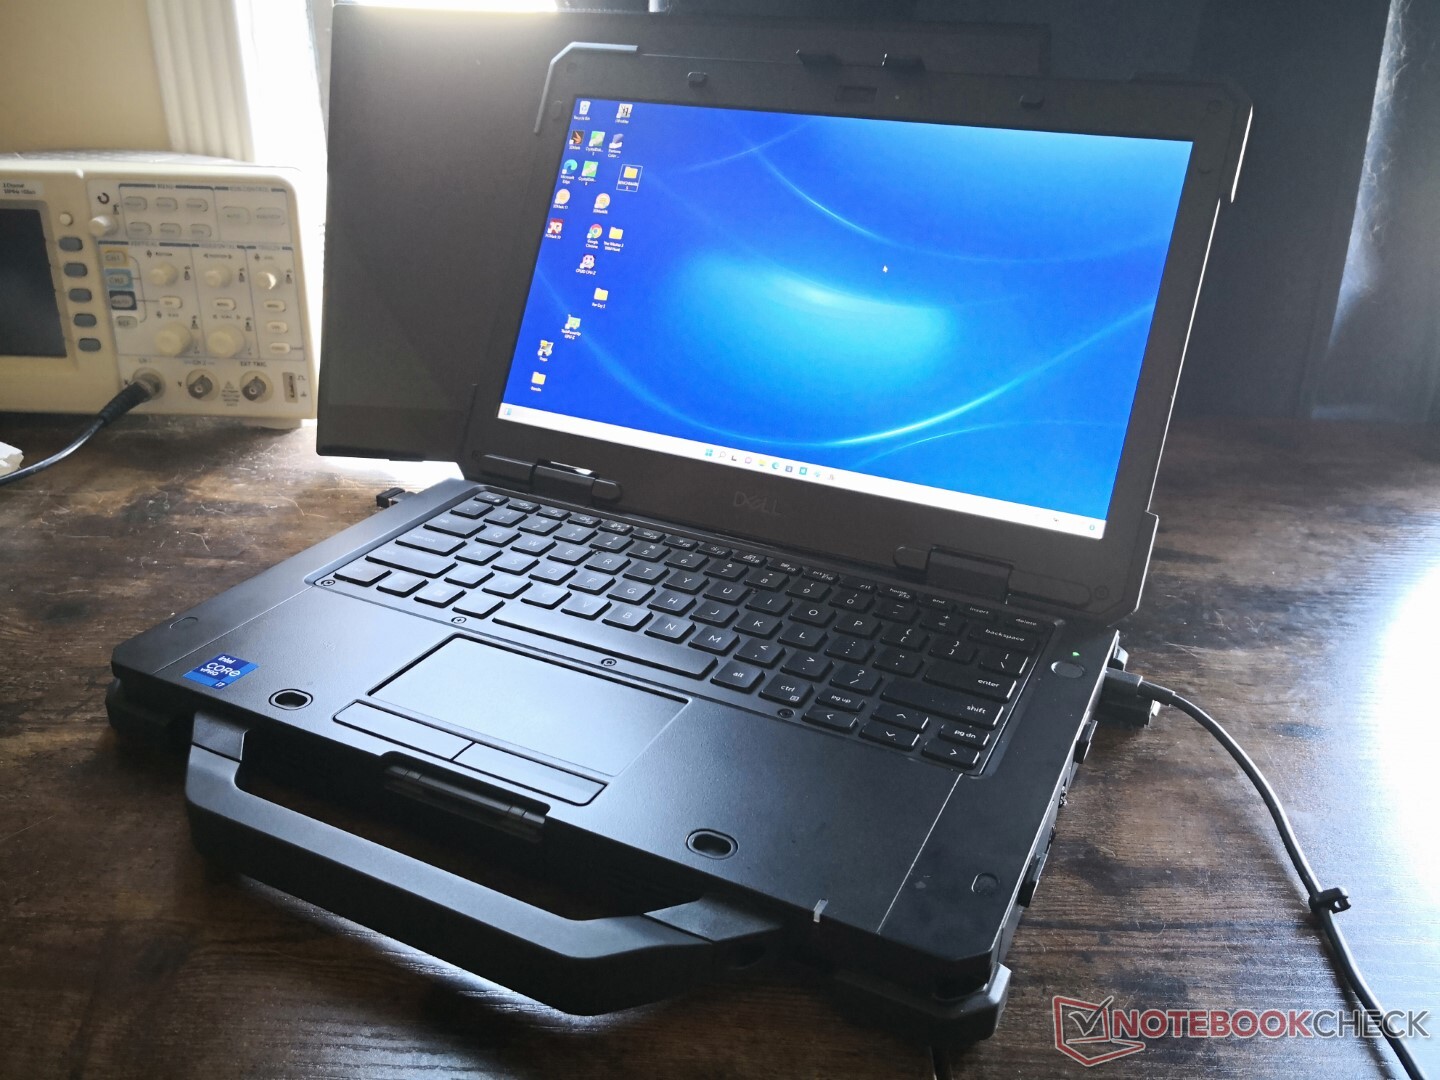
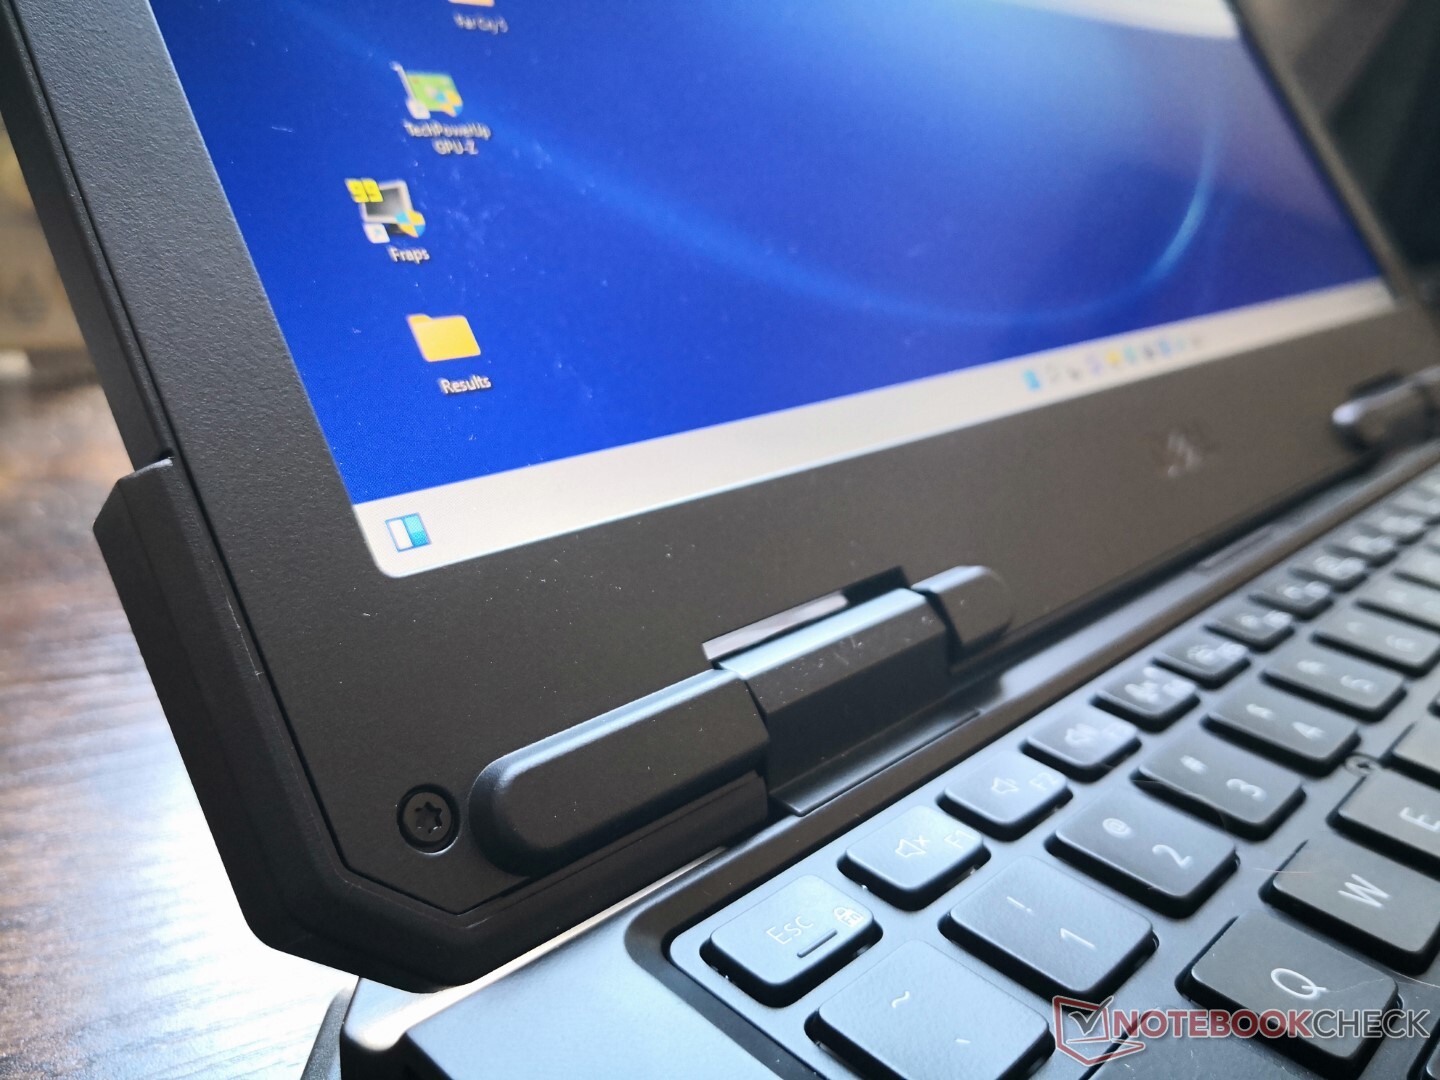
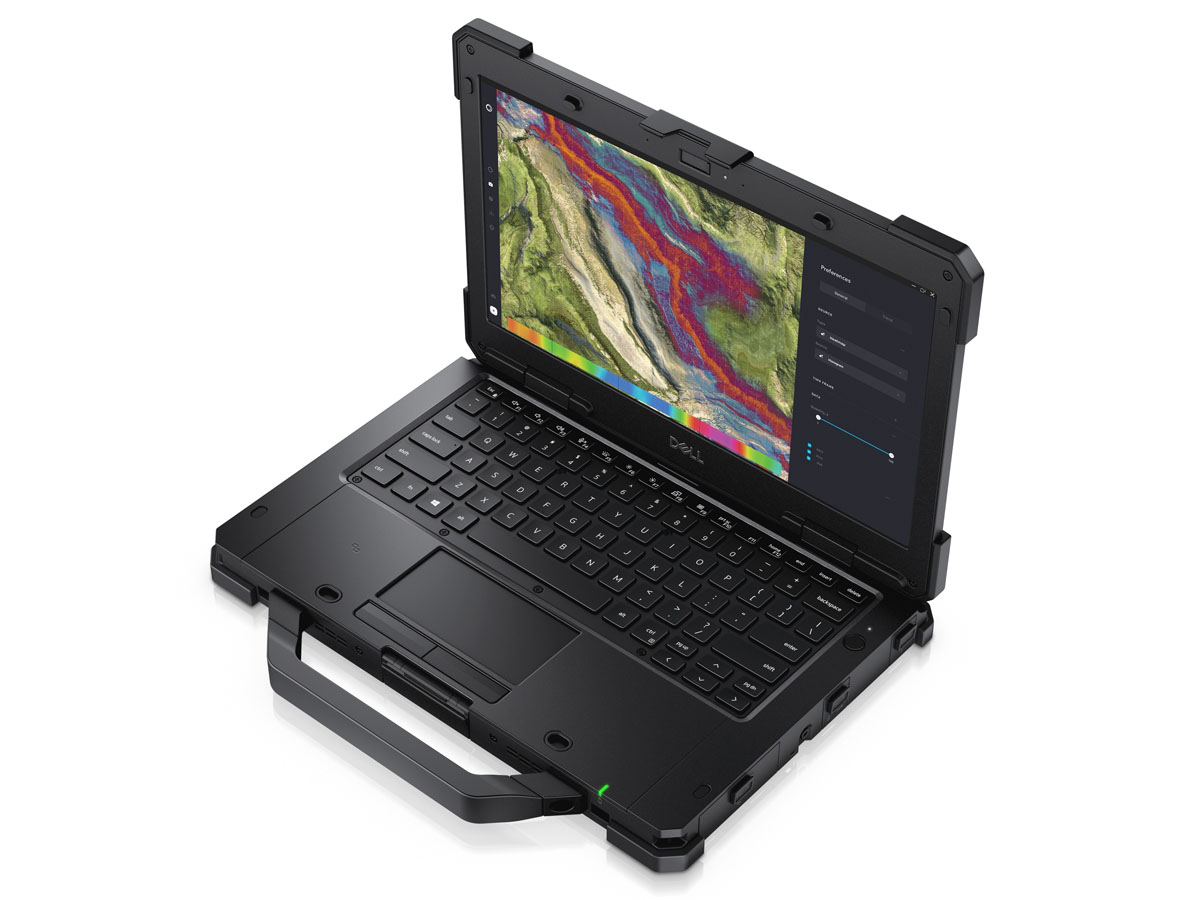
Latitude 7330 Rugged Extreme是戴尔为数不多的--如果不是唯一的--13.3英寸坚固的蛤壳式笔记本电脑之一。它在很大程度上借鉴了现有的14英寸和15英寸的Latitude 强化型,但采用了更小、更紧凑的13英寸外形。
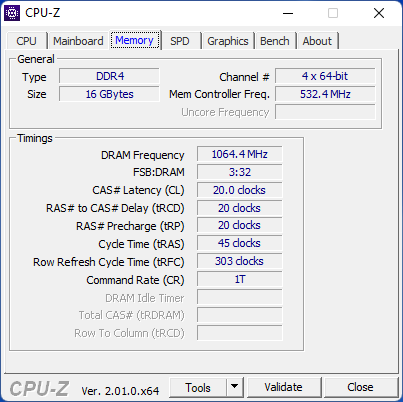
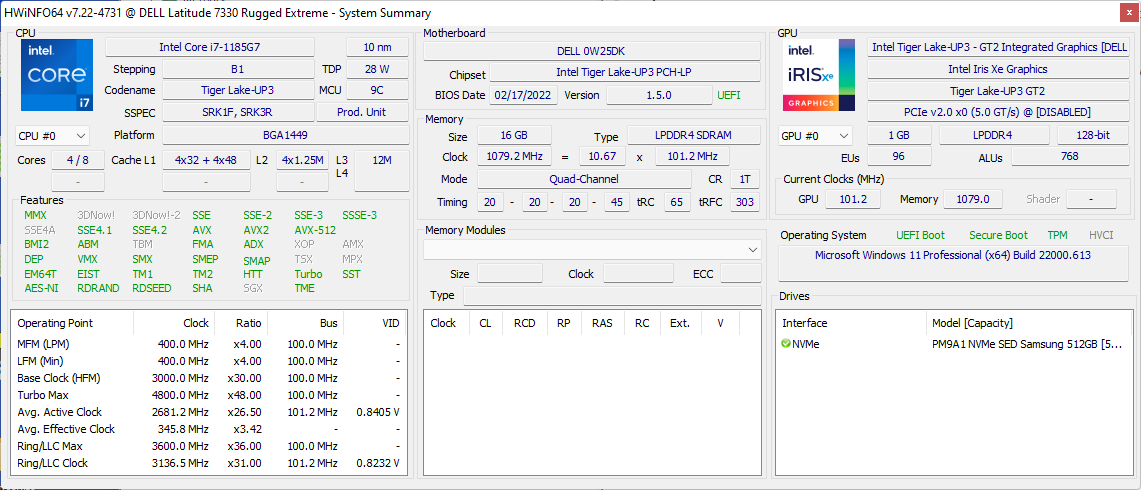
与大多数其他耐用型笔记本电脑一样,Latitude 7330 Rugged Extreme有非常广泛的配置,详情请见产品页面。.我们的具体单位配备了酷睿i7-1185G7 vPro处理器,16GB LPDDR4x-4266内存,以及512GB三星PM9A1 NVMe固态硬盘,售价约5300美元。目前,所有SKU都配备了第11代英特尔U系列CPU和相同的1400尼特1080p IPS面板。
直接竞争对手包括其他13.3英寸的耐用笔记本电脑,如 Getac B360或14英寸的替代品,如杜拉普S14I或松下Toughbook FZ-55 MK2.
更多戴尔评论。
潜在的竞争对手比较
Rating | Date | Model | Weight | Height | Size | Resolution | Price |
|---|---|---|---|---|---|---|---|
v (old) | 05 / 2022 | Dell Latitude 7330 Rugged Extreme i7-1185G7, Iris Xe G7 96EUs | 2.7 kg | 36.5 mm | 13.30" | 1920x1080 | |
| 84.3 % v6 (old) | 06 / 2019 | Dell Latitude 7424 Rugged Extreme i7-8650U, Radeon RX 540 | 3.5 kg | 59.3 mm | 14.00" | 1920x1080 | |
| 89.2 % v6 (old) | Dell Latitude 5420 Rugged-P85G i7-8650U, Radeon RX 540 | 2.8 kg | 32.9 mm | 14.00" | 1920x1080 | ||
| 82.4 % v7 (old) | 12 / 2021 | Acer Enduro Urban N3 EUN314 i7-1165G7, Iris Xe G7 96EUs | 1.8 kg | 21.95 mm | 14.00" | 1920x1080 | |
| 83.9 % v7 (old) | 10 / 2021 | Panasonic Toughbook FZ-55 MK2 i7-1185G7, Iris Xe G7 96EUs | 2.3 kg | 33 mm | 14.00" | 1920x1080 | |
v (old) | 09 / 2021 | Durabook S14I i7-1165G7, Iris Xe G7 96EUs | 3 kg | 38.1 mm | 14.00" | 1920x1080 |
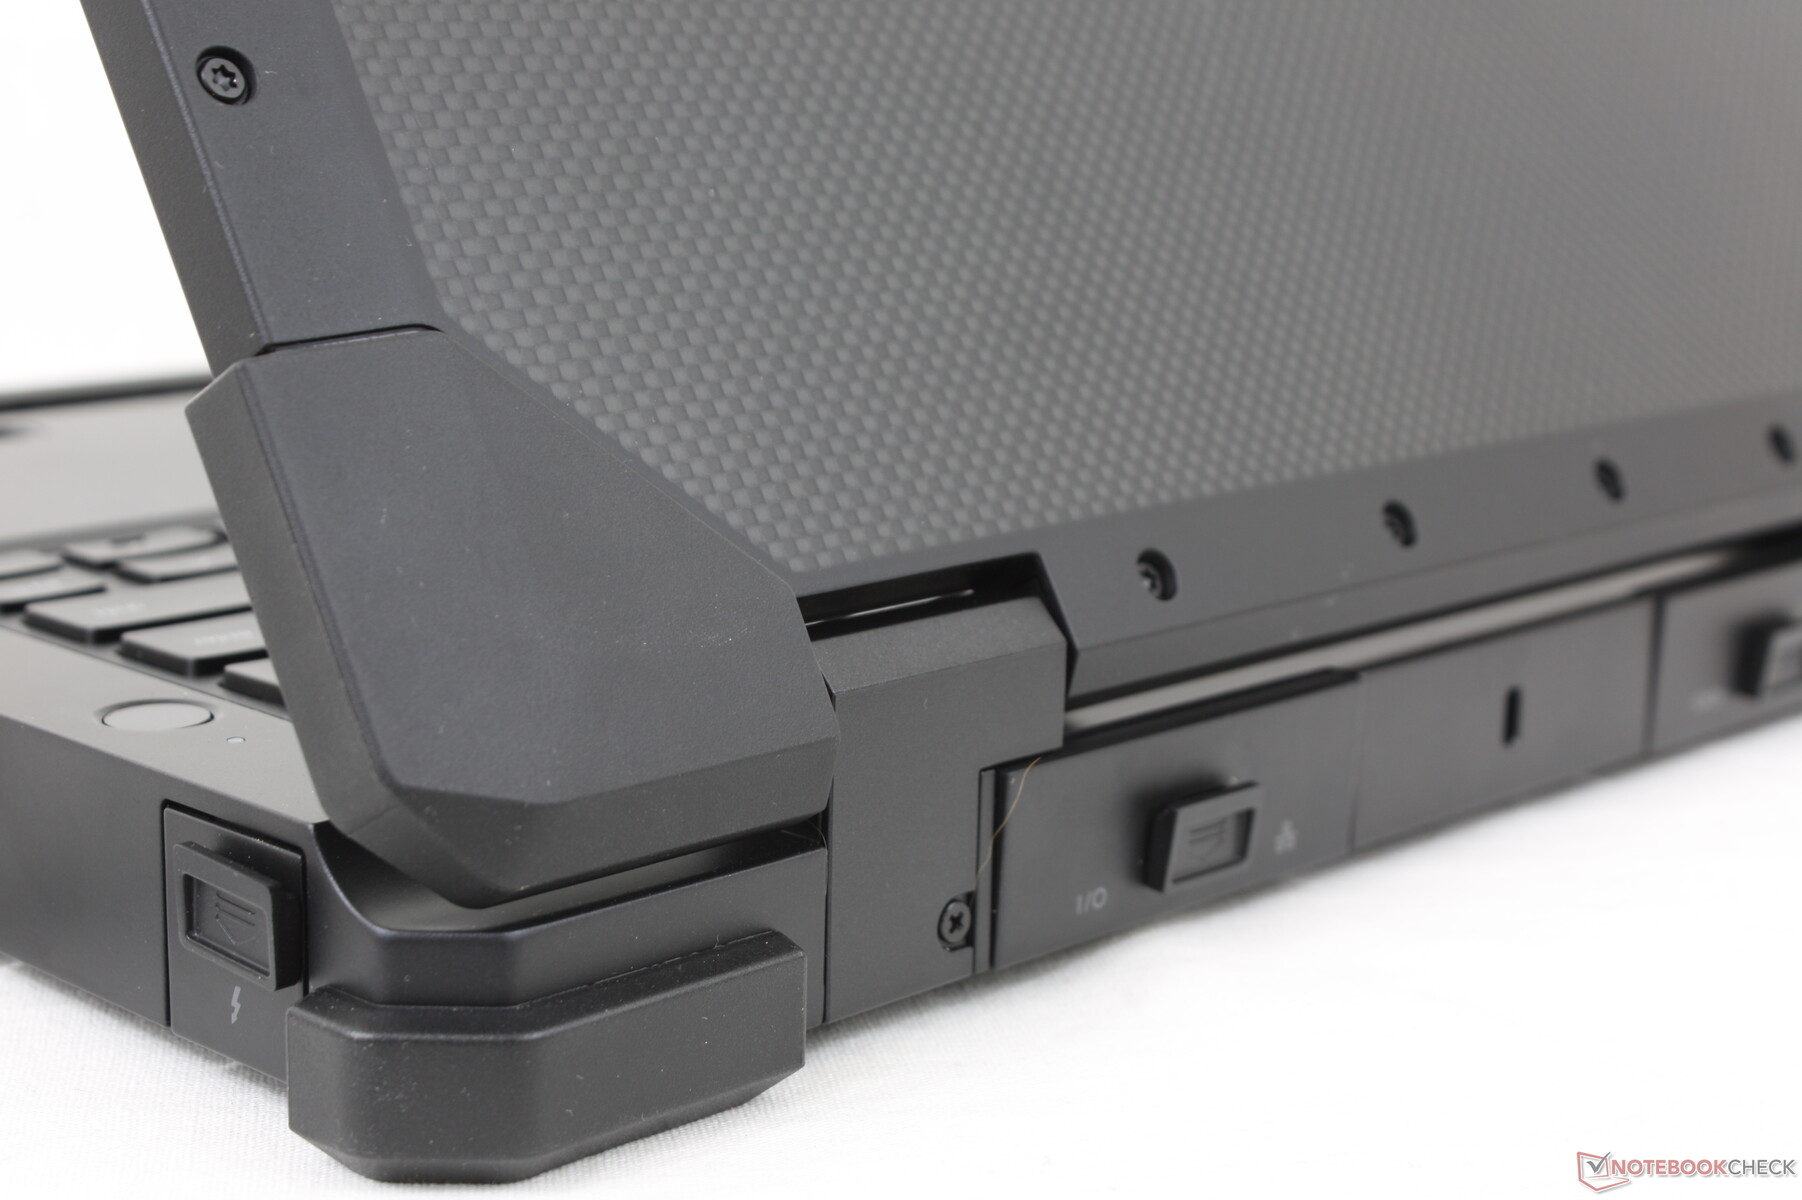
案例
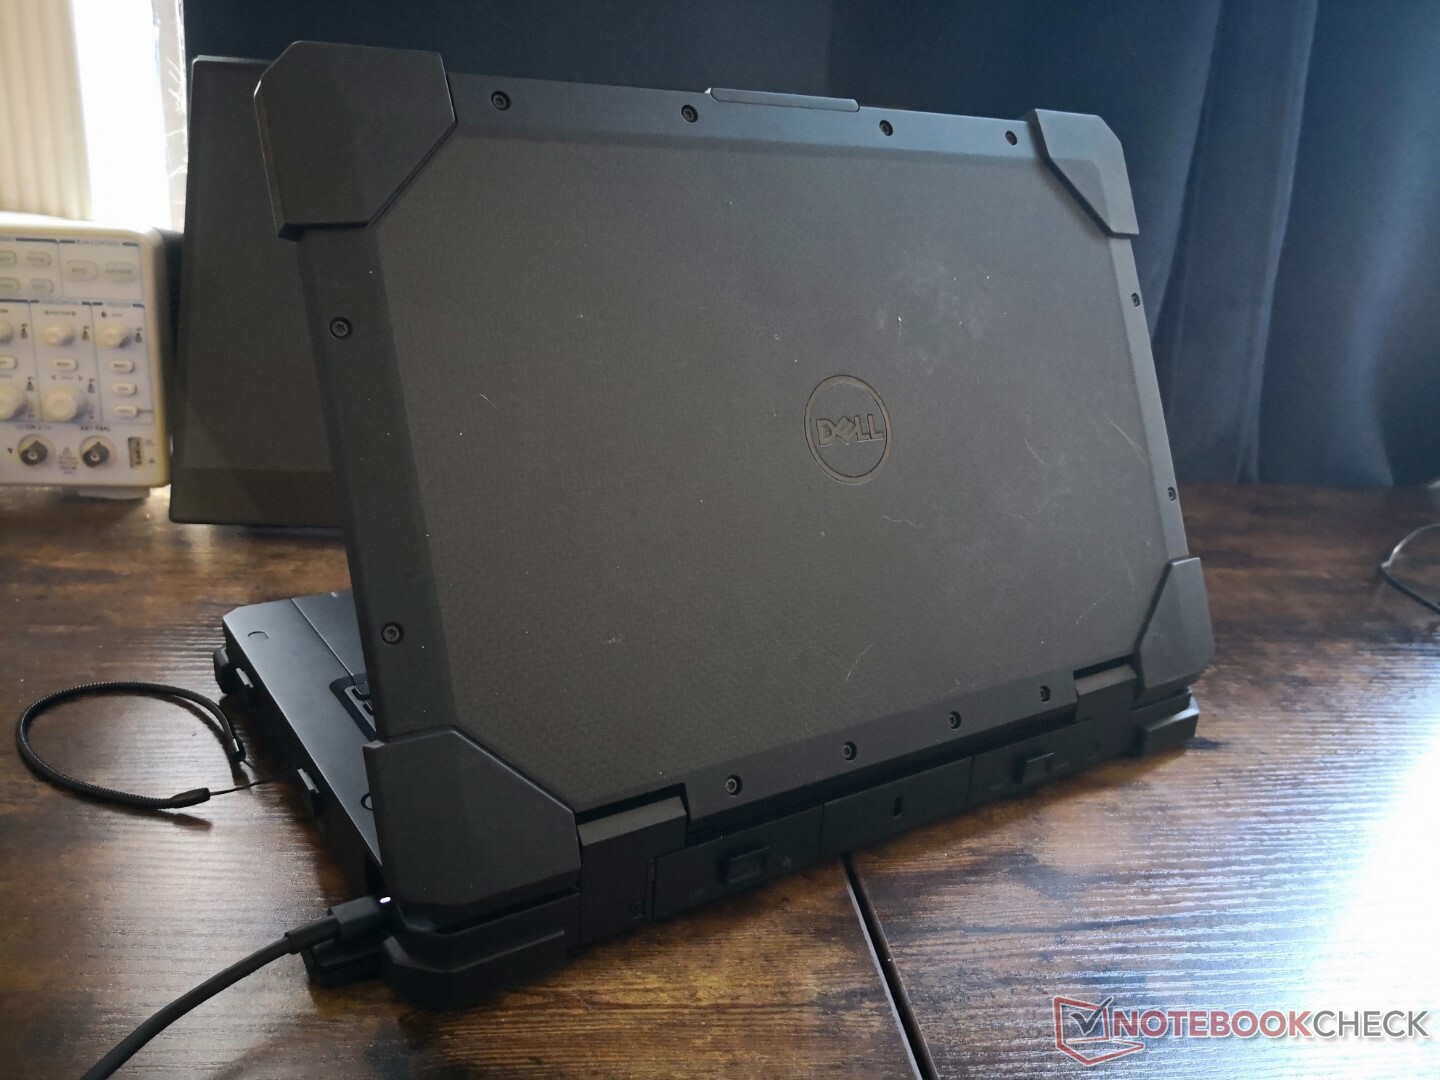
就尺寸和重量而言,戴尔机型明显比14英寸Getac B360或松下Toughbook FZ-55 MK2小,但它却比这两个机型都重。Latitude 7330 Rugged Extreme的纯粹密度不应该被低估。
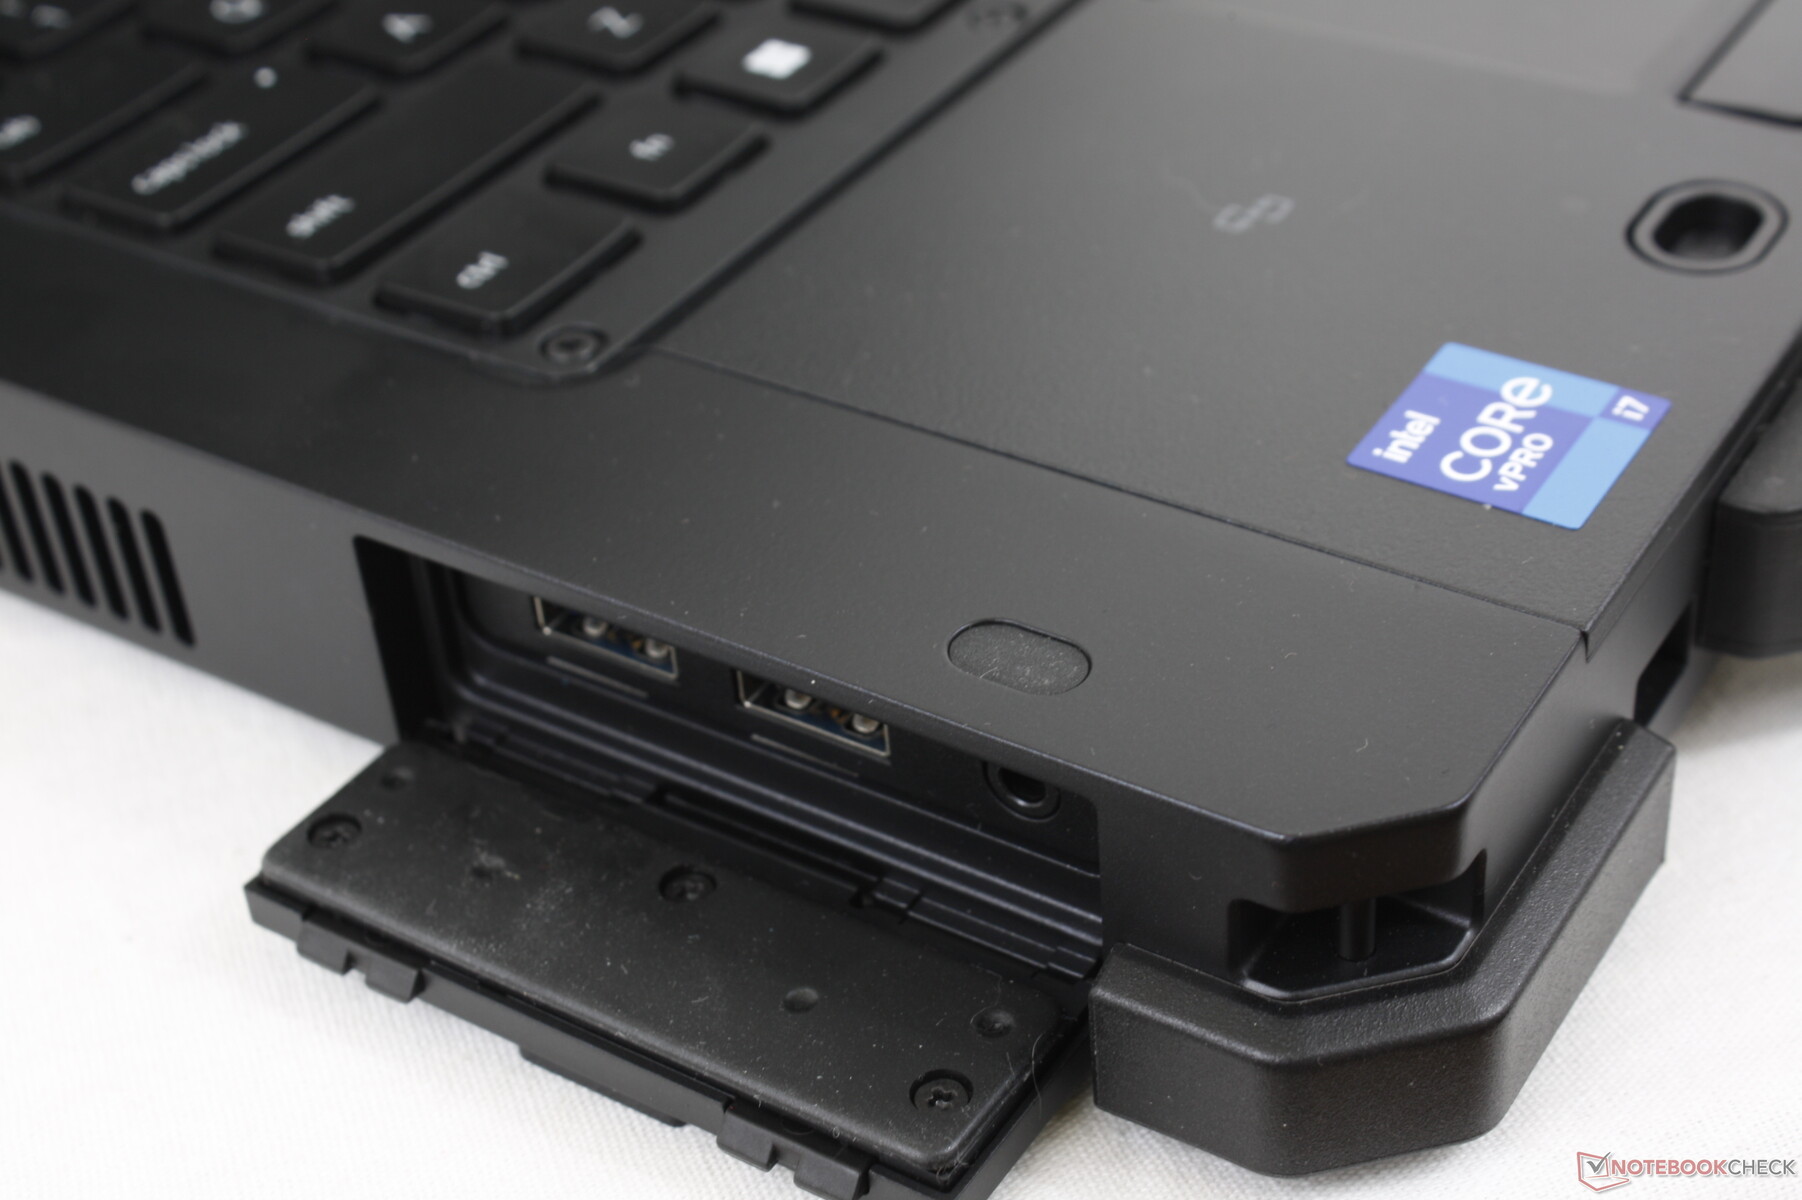
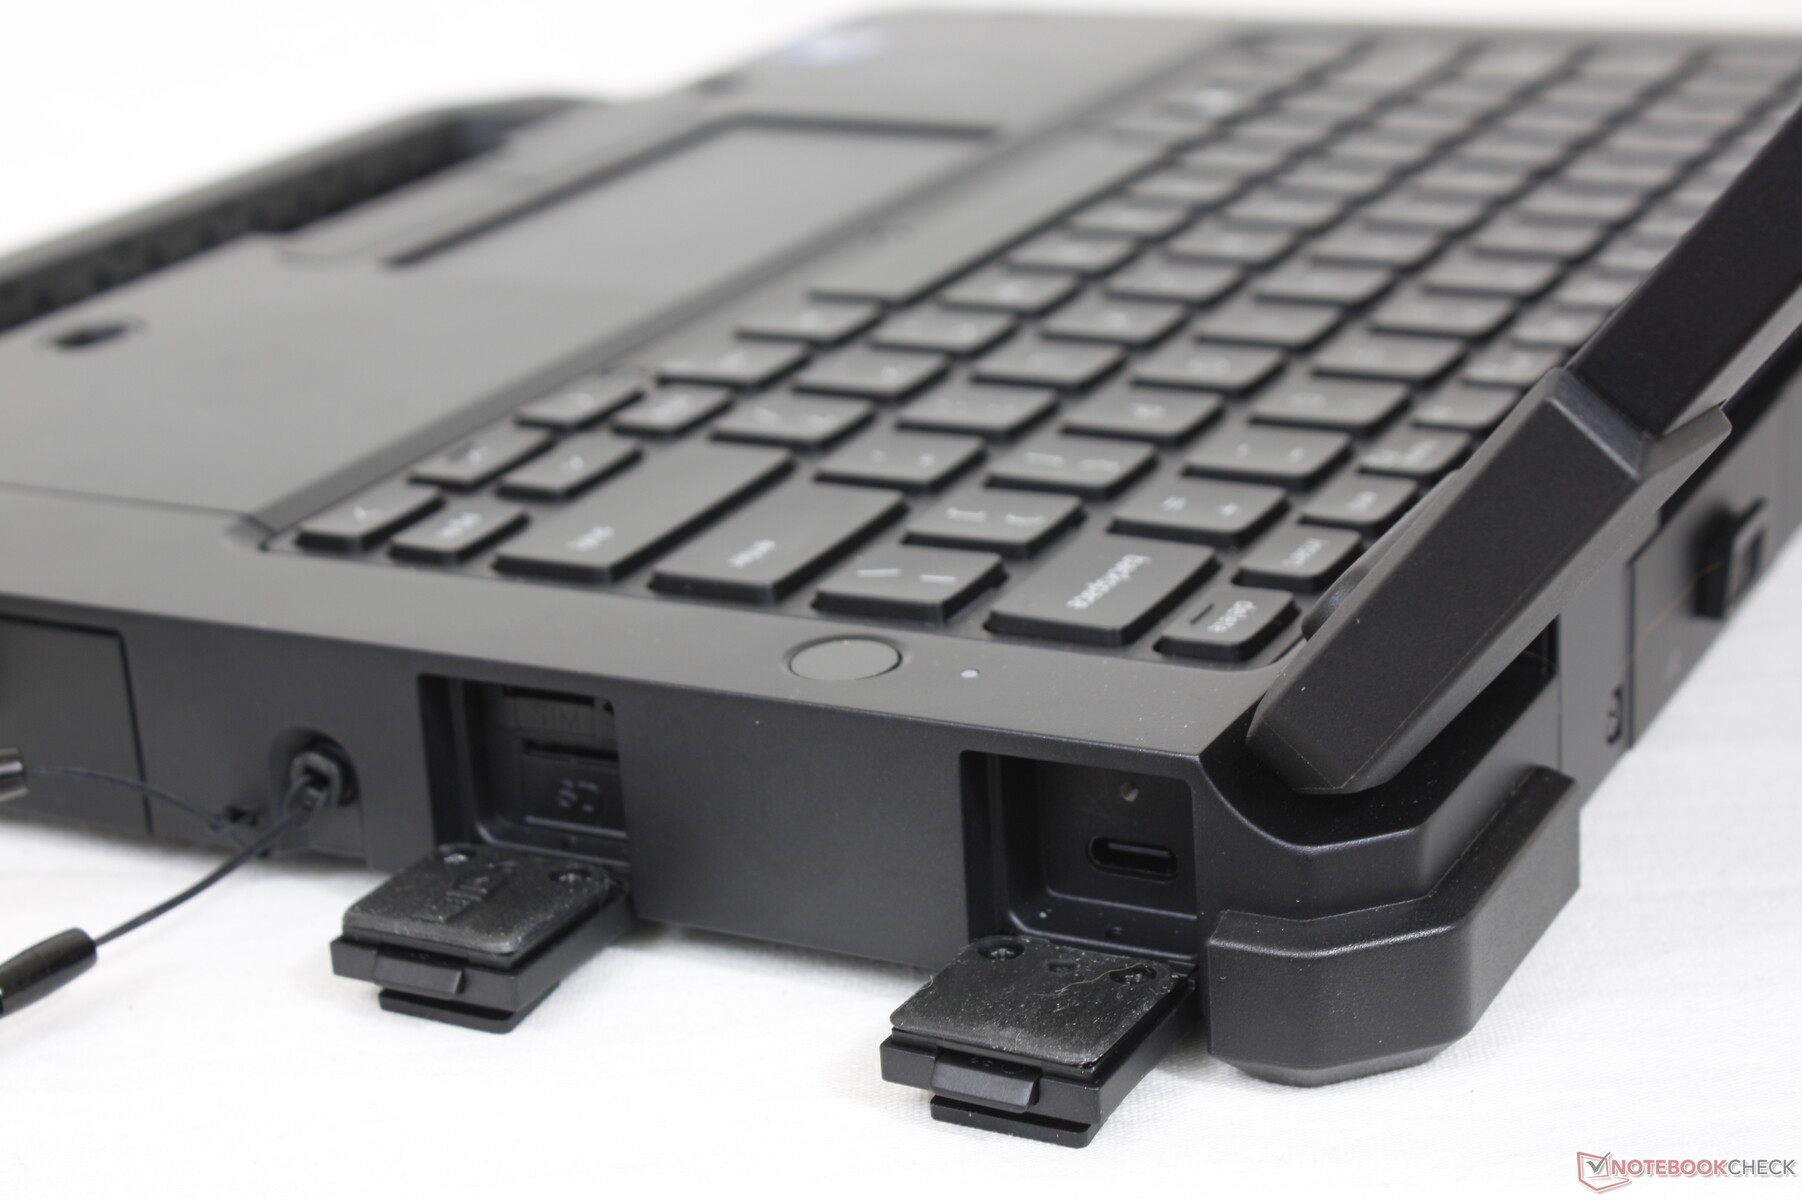
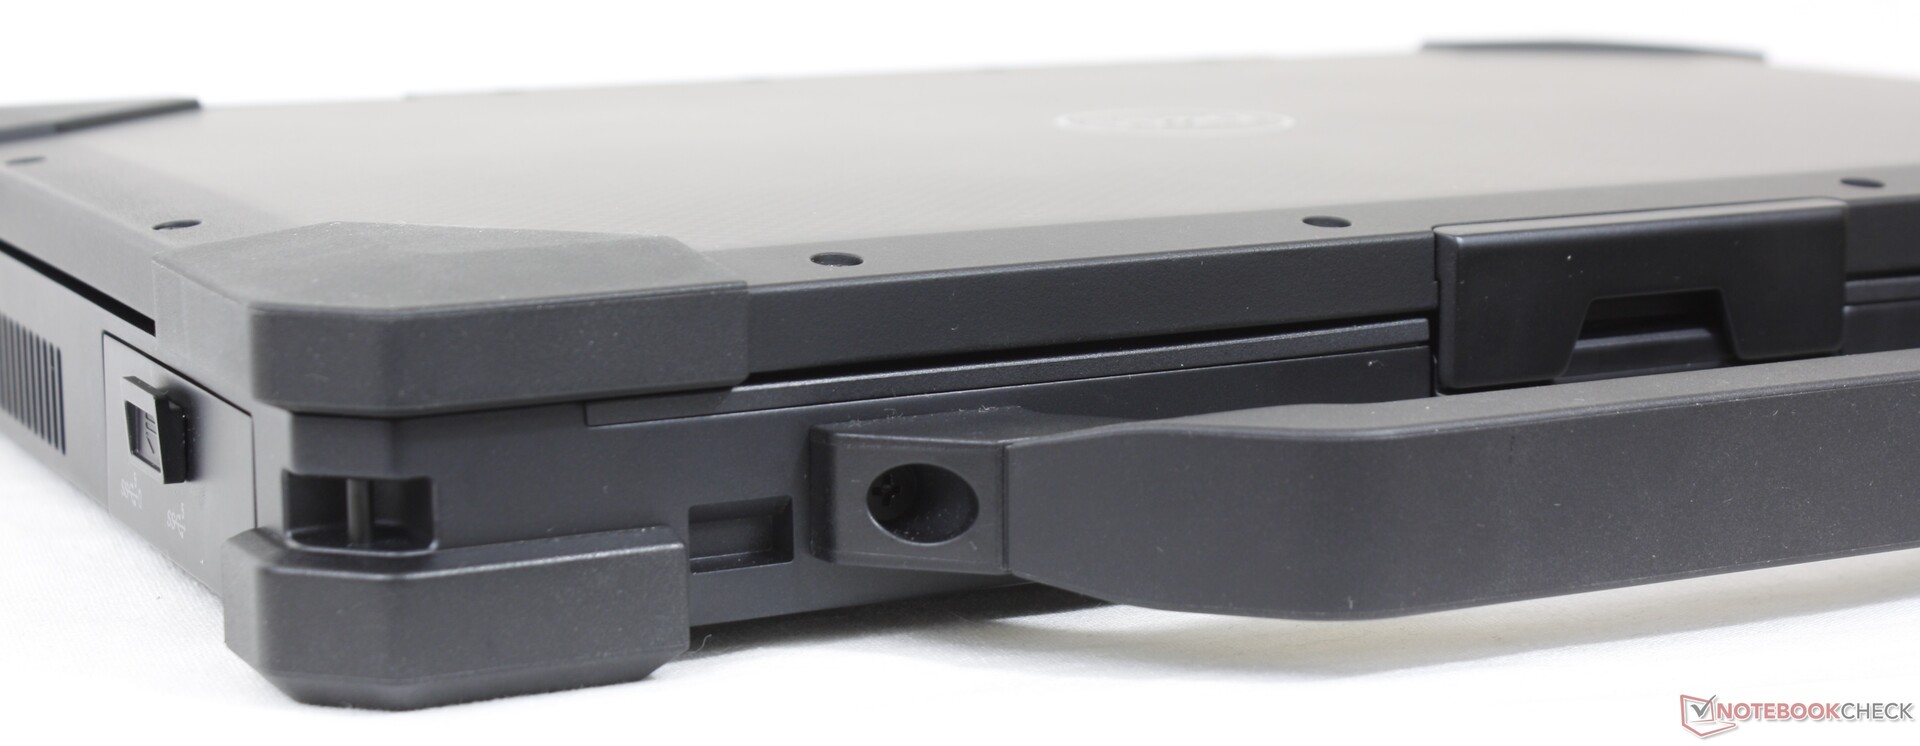
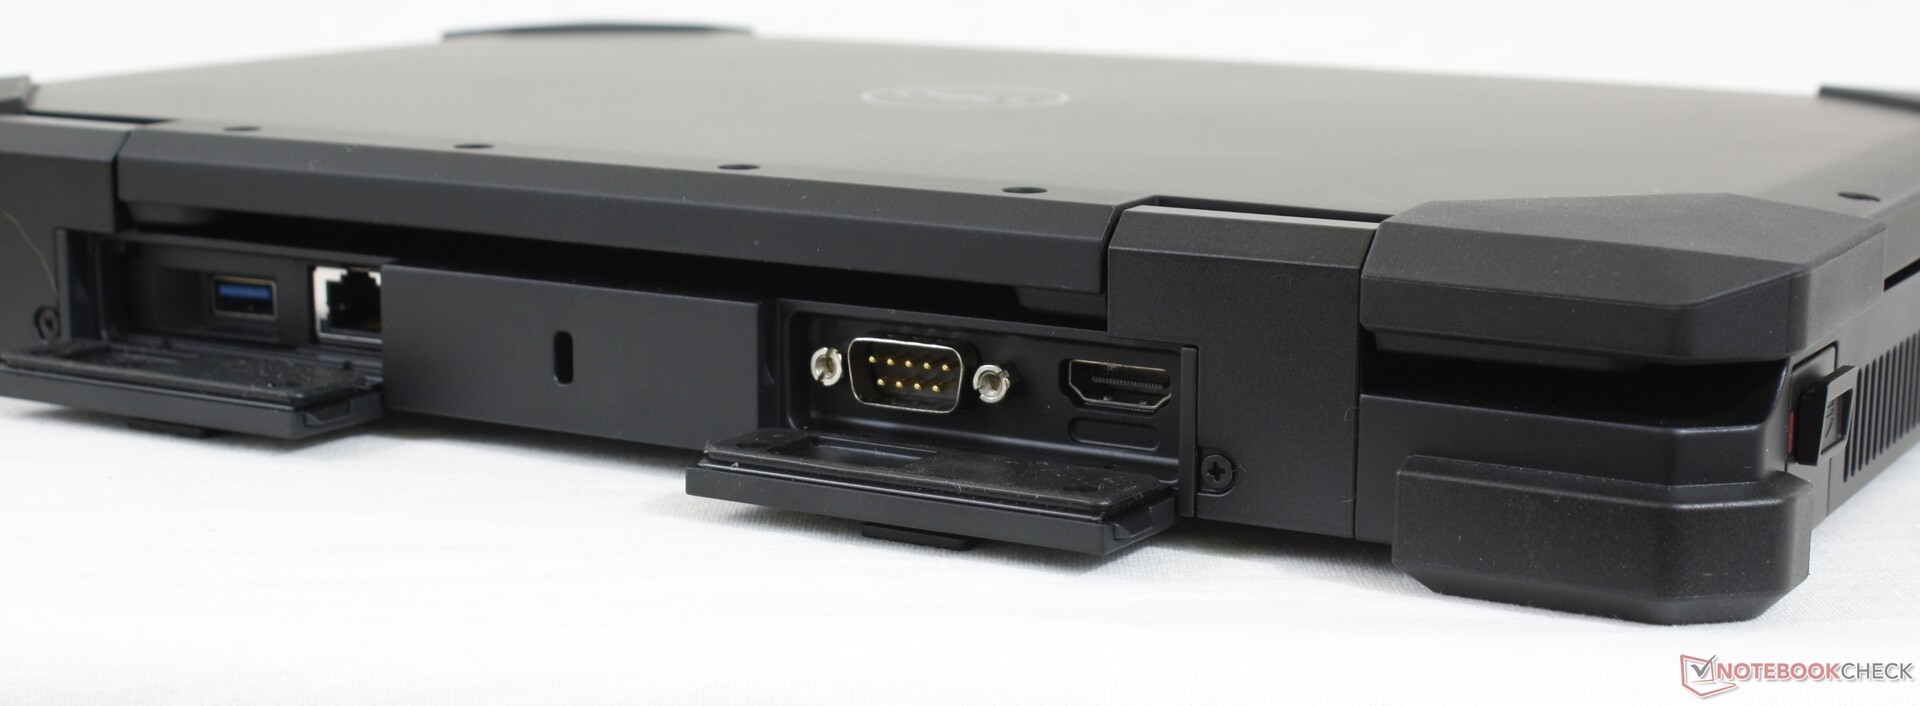
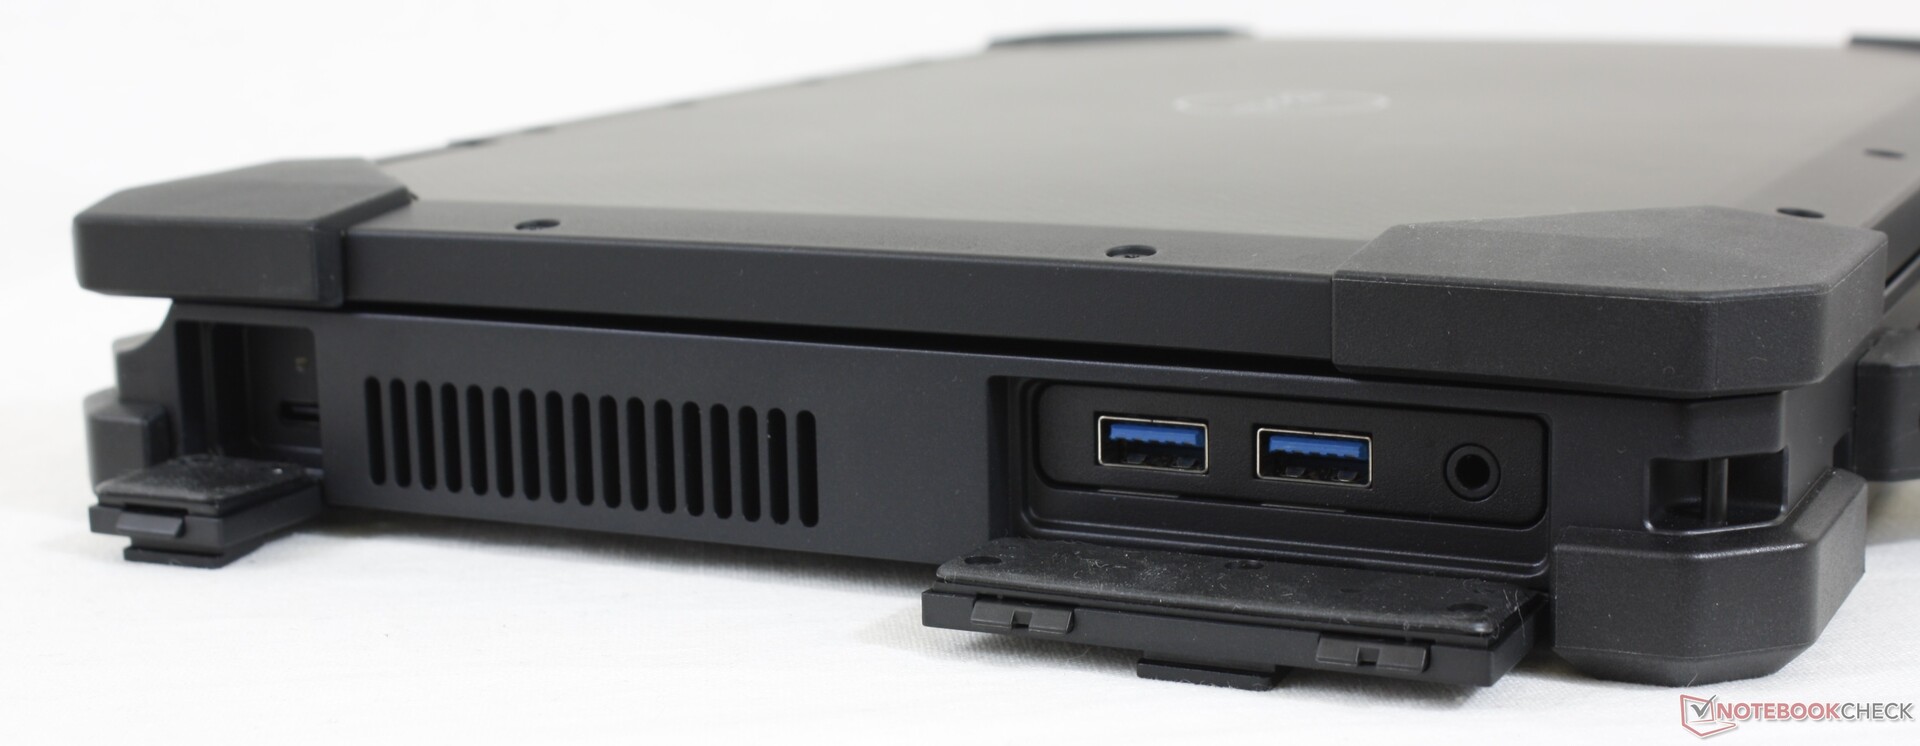
连接性
端口选项很多,包括智能卡和Express Card读卡器,都是可选的。然而,与Getac B360不同的是,它没有VGA端口、DVD读卡器或存储槽盒。
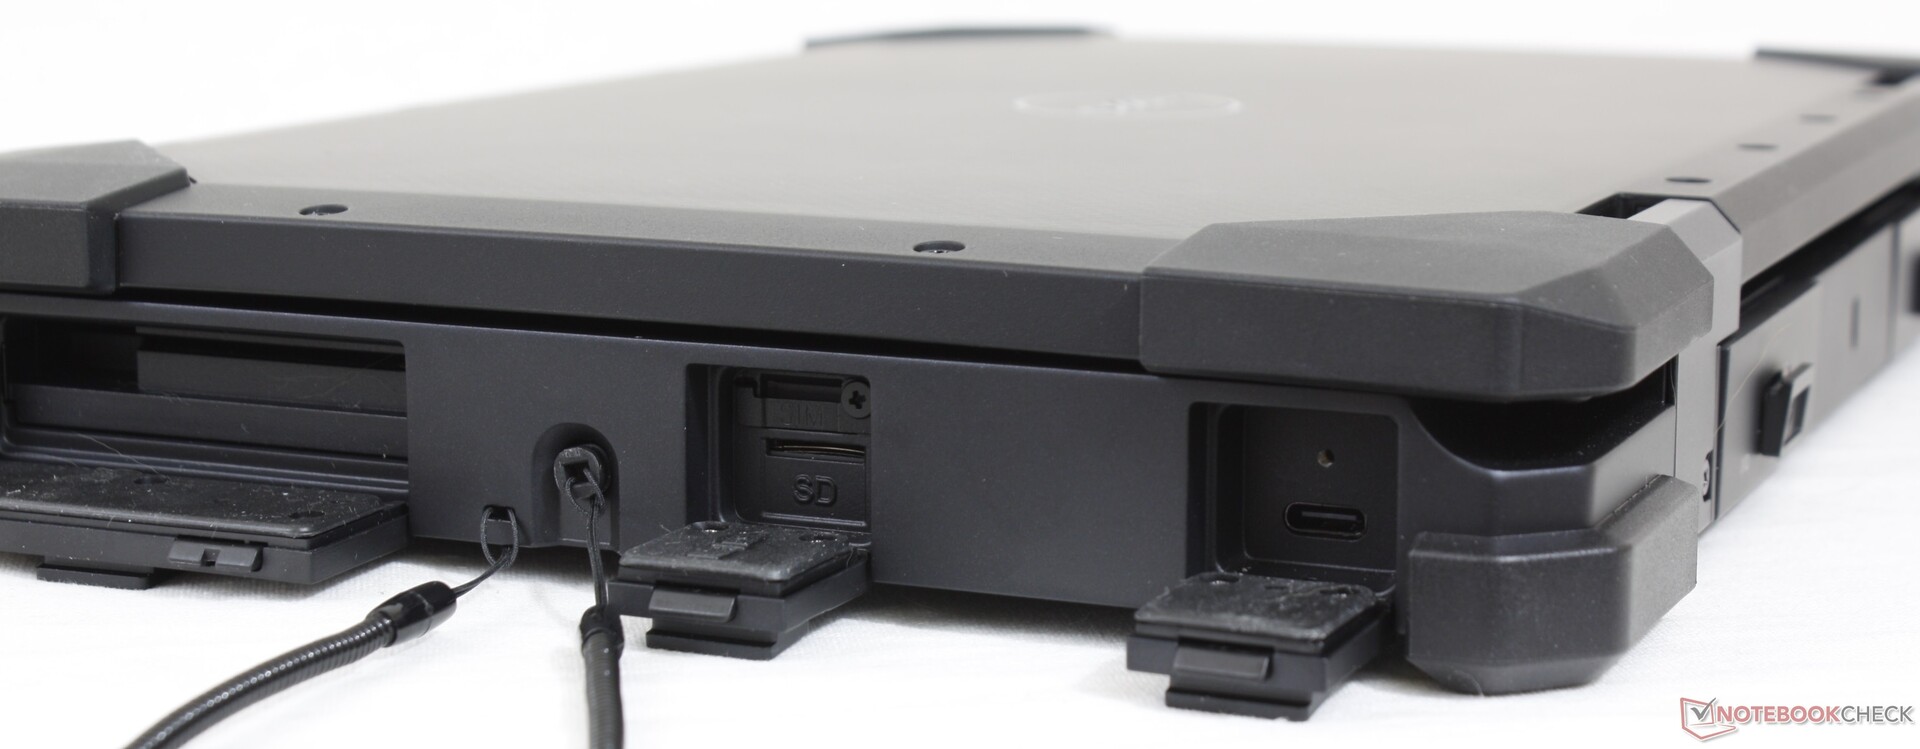
SD卡阅读器
集成的弹簧式MicroSD读卡器的传输速度明显快于其他大多数耐用设备。请记住,MicroSD卡必须颠倒着插入设备中。
对于手掌较大的用户来说,访问读卡器可能特别困难,因为它被嵌入到沿右边缘的厚盖子后面。
| SD Card Reader | |
| average JPG Copy Test (av. of 3 runs) | |
| Dell Latitude 5420 Rugged-P85G (Toshiba Exceria Pro SDXC 64 GB UHS-II) | |
| Dell Latitude 7424 Rugged Extreme (Toshiba Exceria Pro SDXC 64 GB UHS-II) | |
| Dell Latitude 7330 Rugged Extreme (AV Pro V60) | |
| Fujitsu LifeBook U7310 (Toshiba Exceria Pro SDXC 64 GB UHS-II) | |
| Lenovo ThinkPad P15s Gen1-20T4000JGE (Toshiba Exceria Pro M501 64 GB UHS-II) | |
| Panasonic Toughbook FZ-55 MK2 (AV Pro V60) | |
| Acer Enduro Urban N3 EUN314 (AV Pro V60) | |
| Durabook S14I (Angelbird 128GB AV Pro UHS-II) | |
| maximum AS SSD Seq Read Test (1GB) | |
| Dell Latitude 5420 Rugged-P85G (Toshiba Exceria Pro SDXC 64 GB UHS-II) | |
| Dell Latitude 7424 Rugged Extreme (Toshiba Exceria Pro SDXC 64 GB UHS-II) | |
| Dell Latitude 7330 Rugged Extreme (AV Pro V60) | |
| Panasonic Toughbook FZ-55 MK2 (AV Pro V60) | |
| Fujitsu LifeBook U7310 (Toshiba Exceria Pro SDXC 64 GB UHS-II) | |
| Lenovo ThinkPad P15s Gen1-20T4000JGE (Toshiba Exceria Pro M501 64 GB UHS-II) | |
| Durabook S14I (Angelbird 128GB AV Pro UHS-II) | |
| Acer Enduro Urban N3 EUN314 (AV Pro V60) | |
沟通
英特尔AX210是可选的,用于Wi-Fi 6连接。用户还可以配置高通SDX55或Snapdragon X20用于广域网连接。
| Networking | |
| iperf3 transmit AX12 | |
| Acer Enduro Urban N3 EUN314 | |
| Panasonic Toughbook FZ-55 MK2 | |
| Durabook S14I | |
| Dell Latitude 7330 Rugged Extreme | |
| Dell Latitude 7424 Rugged Extreme | |
| Dell Latitude 5420 Rugged-P85G | |
| iperf3 receive AX12 | |
| Durabook S14I | |
| Acer Enduro Urban N3 EUN314 | |
| Panasonic Toughbook FZ-55 MK2 | |
| Dell Latitude 7330 Rugged Extreme | |
| Dell Latitude 5420 Rugged-P85G | |
| Dell Latitude 7424 Rugged Extreme | |
网络摄像头
带手动隐私快门的210万像素网络摄像头是标准配置,而不是通常的100万像素传感器。也支持Windows Hello。


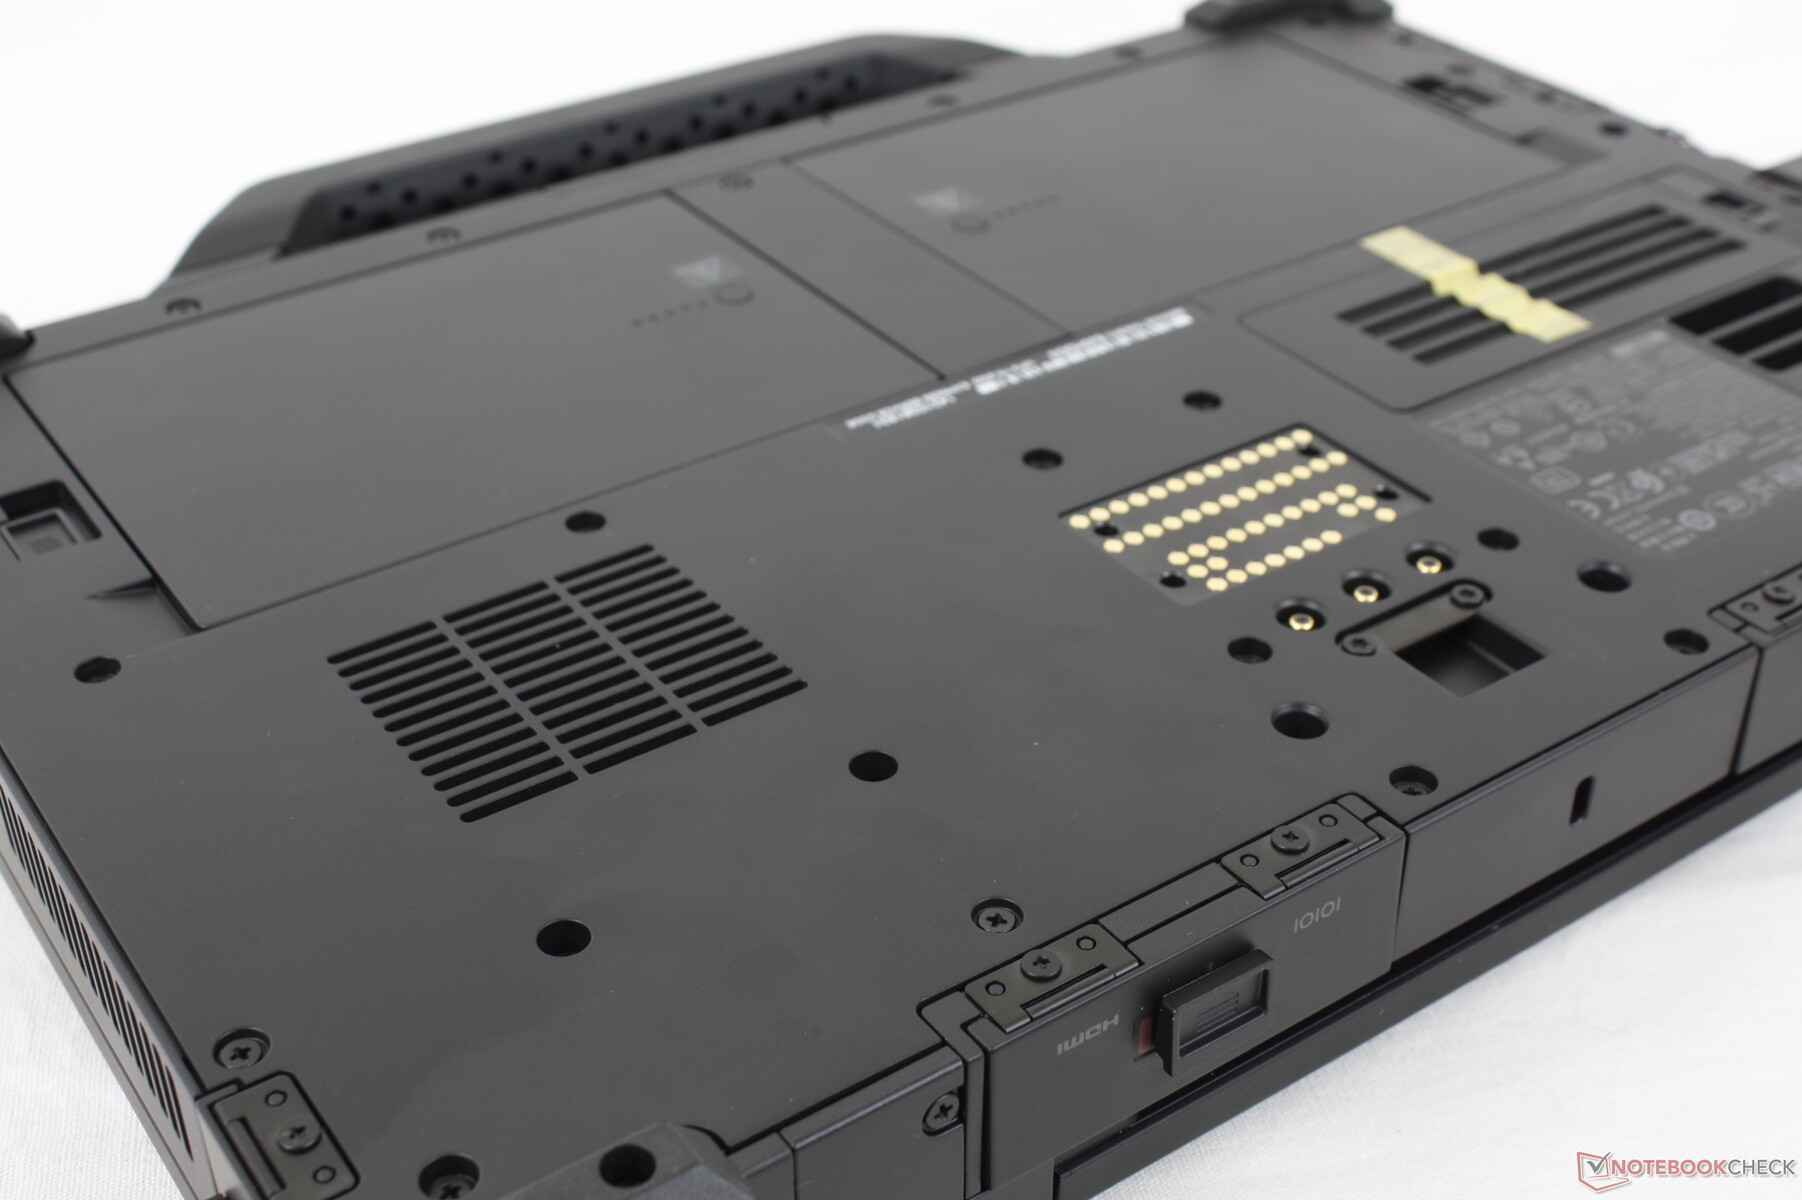
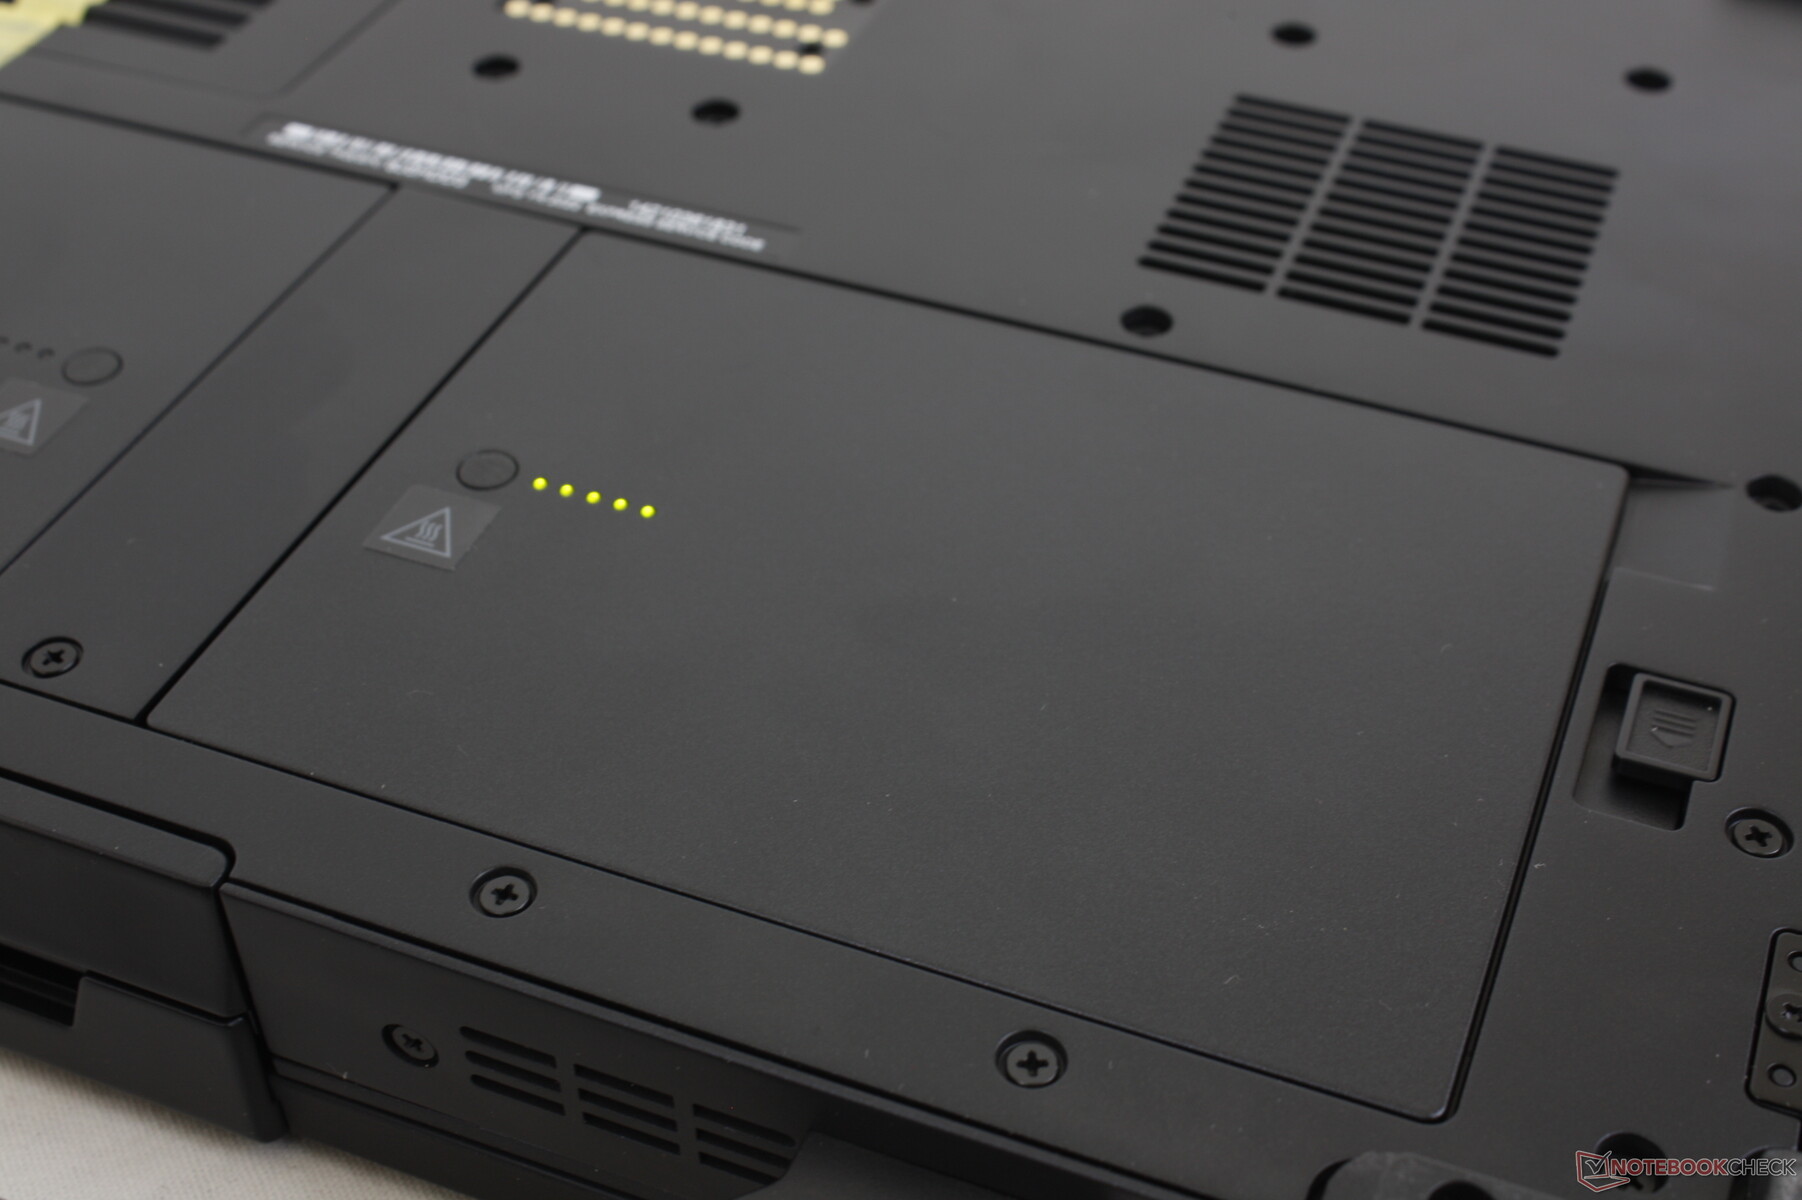
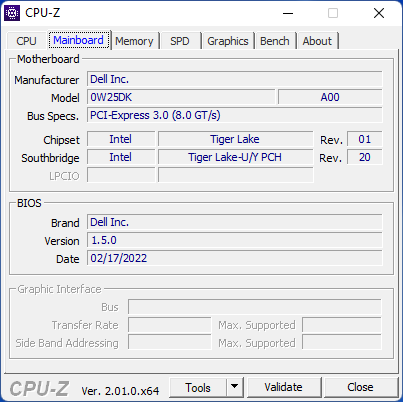
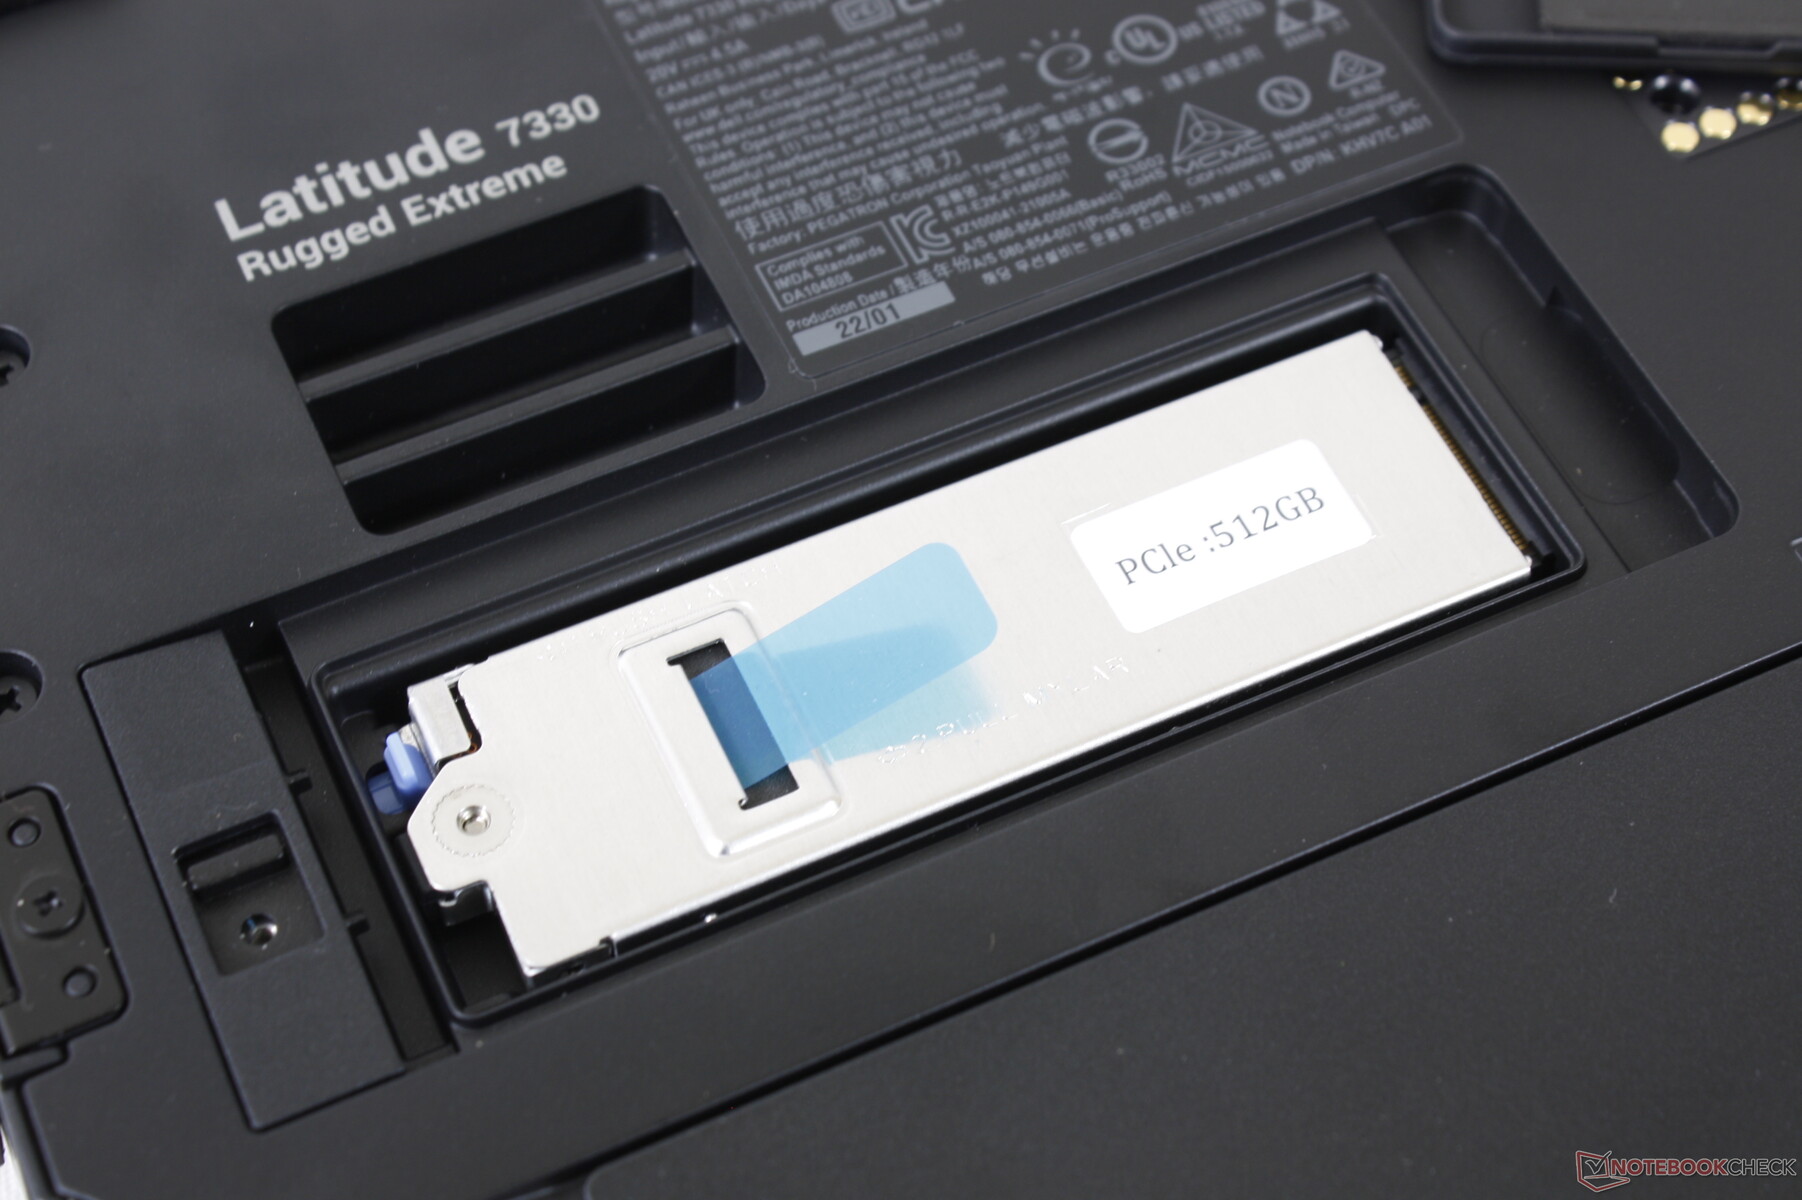
维护
只要你有耐心拧开二十几颗飞利浦螺钉,底板就比较容易拆下来。在大多数情况下,没有什么理由要这样做,因为内存是焊接的,而且单个存储空间已经可以通过一个小舱门进入。
配件和保修
可选的附件可以利用设备底部的专有对接针。标准的三年有限制造商保修。
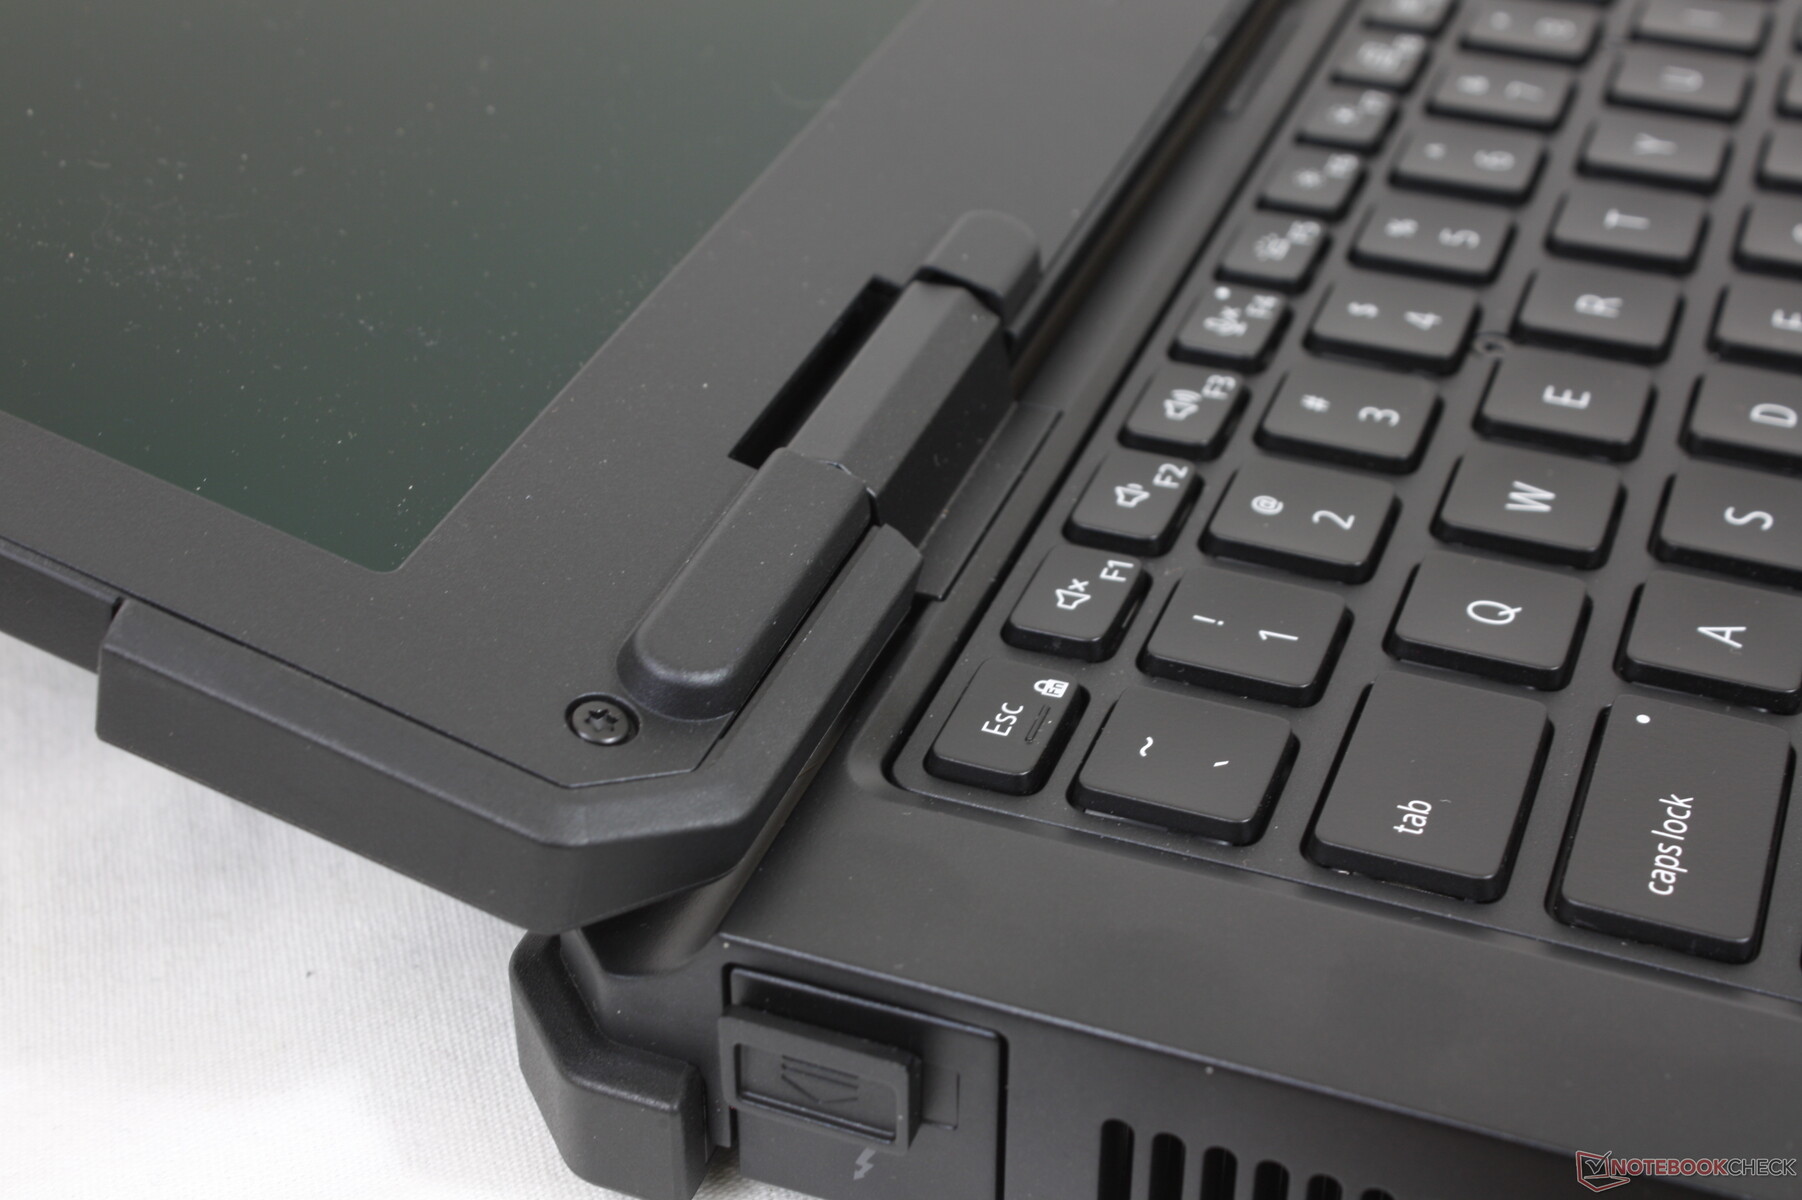
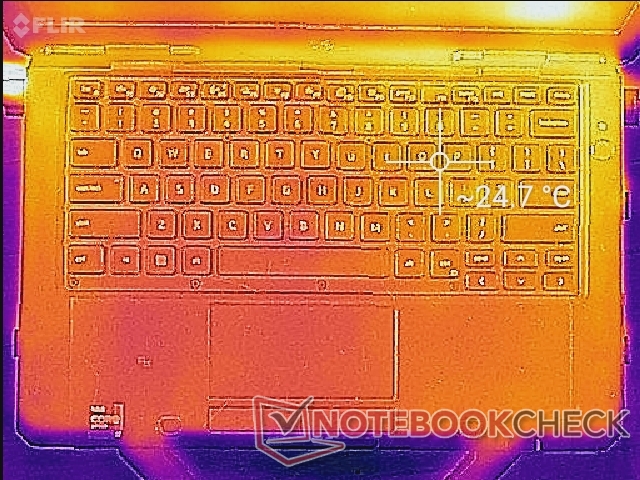
输入设备
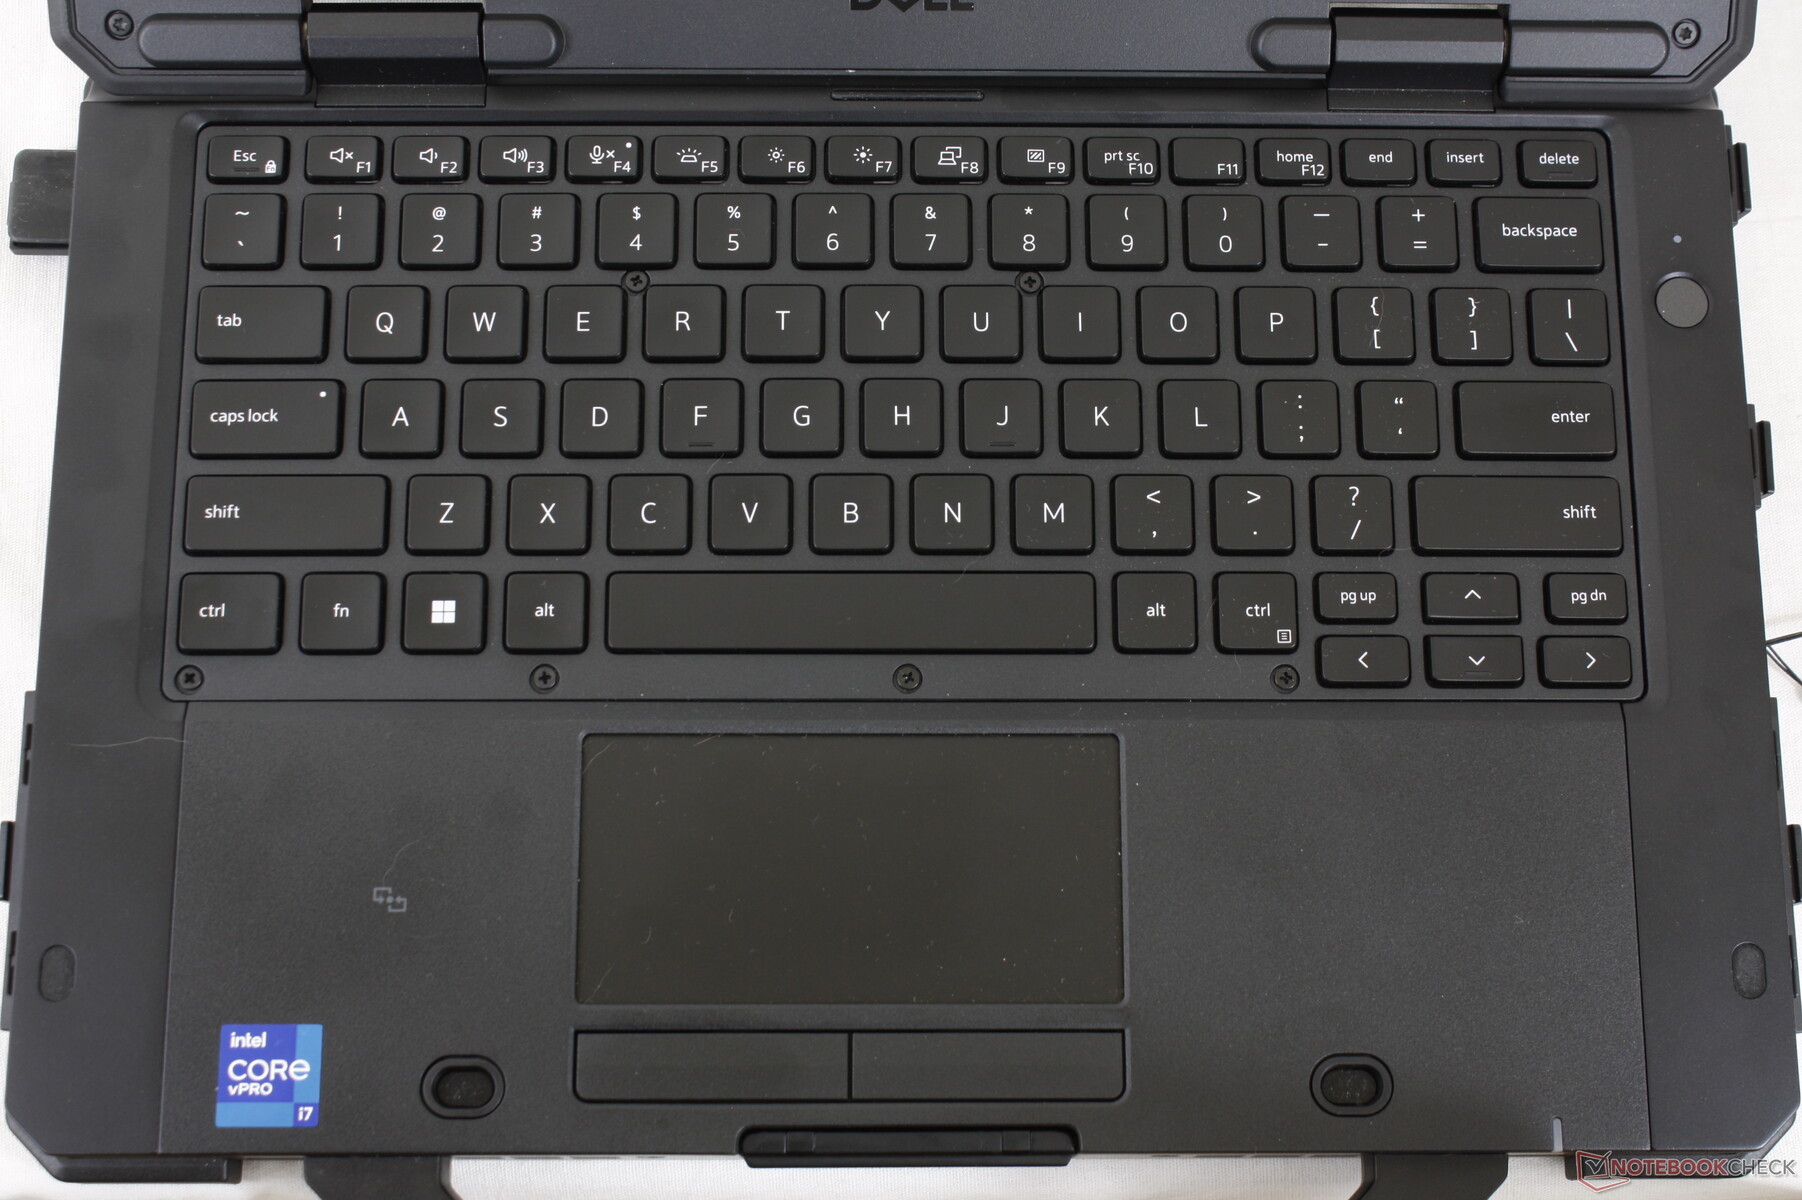
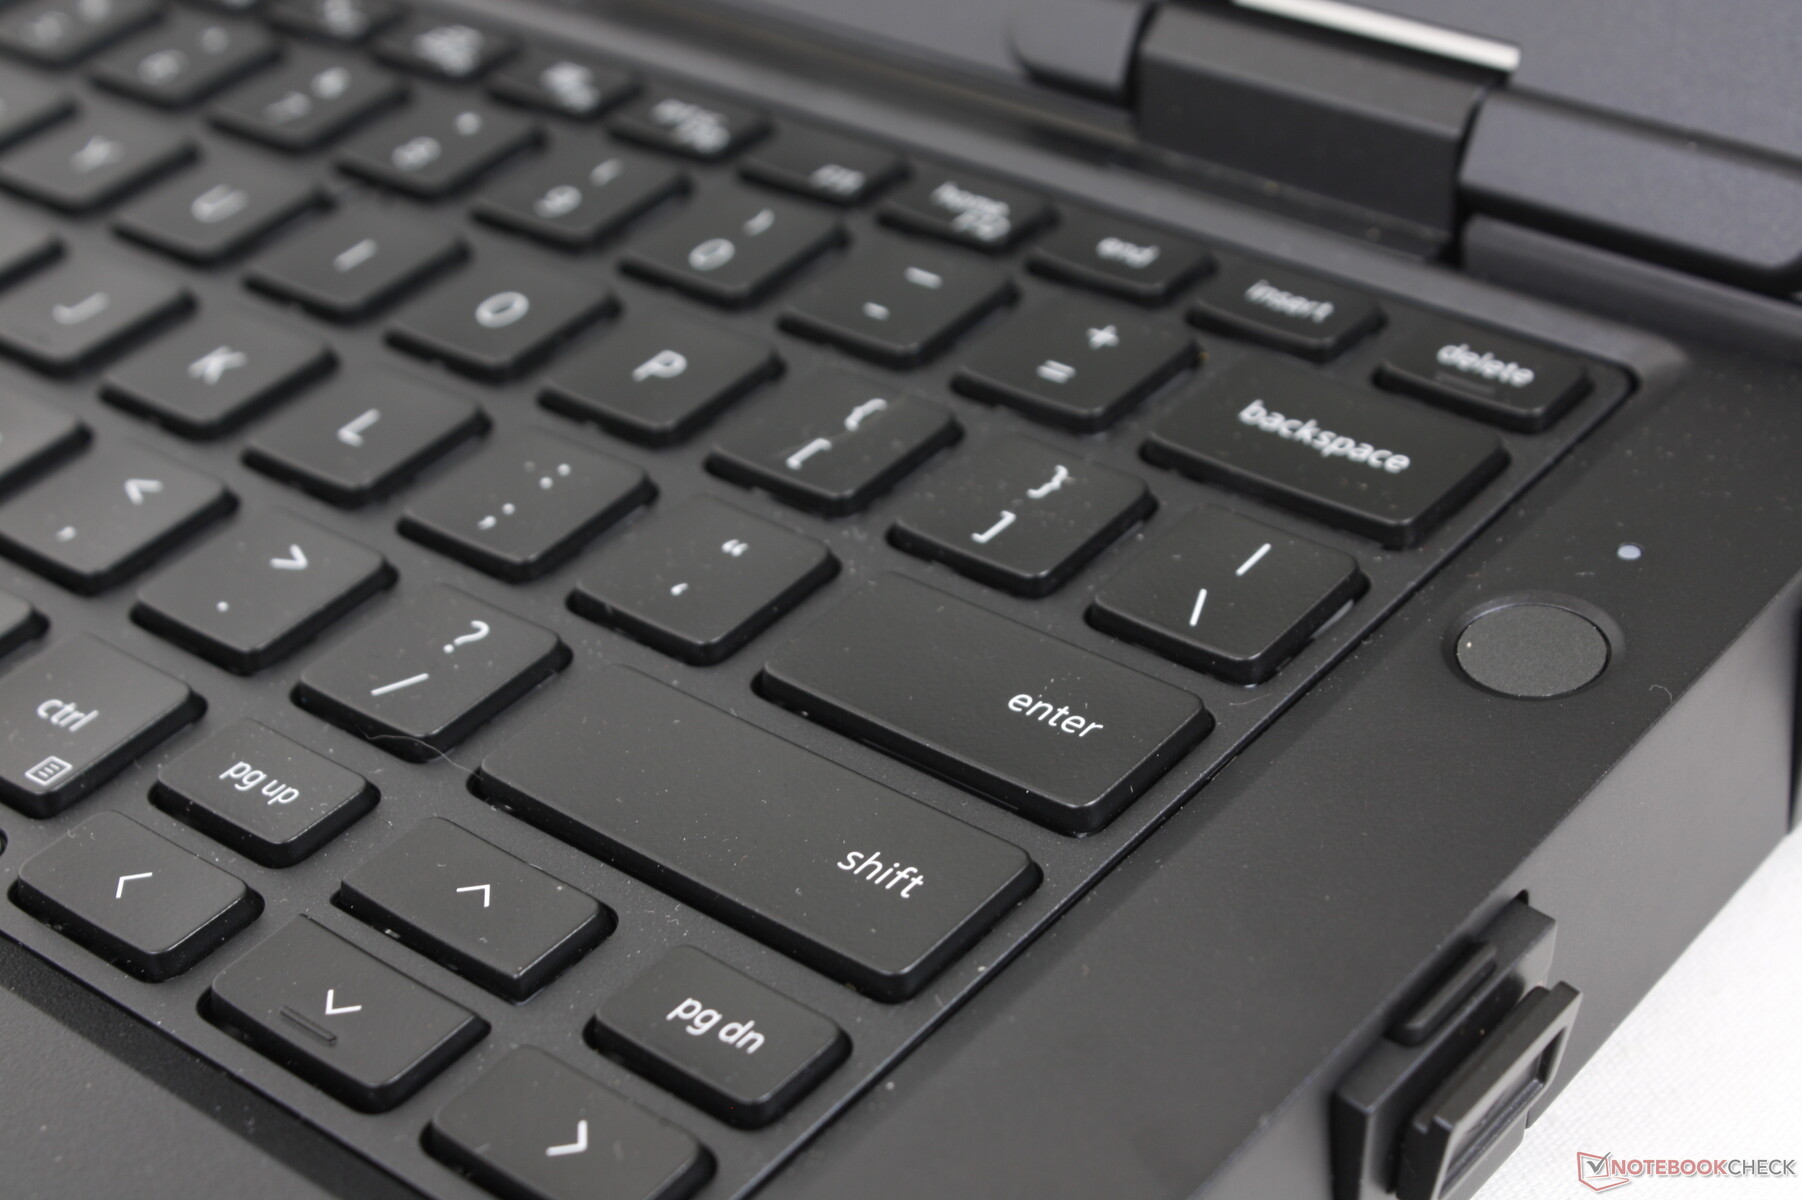
键盘
与Getac B360系列的键盘相比,戴尔的键盘稍显柔软和安静,但打字的舒适度不一定低。用户可能更喜欢使用更安静的按键,这取决于使用场景。然而,我们确实更喜欢B360的红色背光,因为它比戴尔的白色背光更容易入眼。
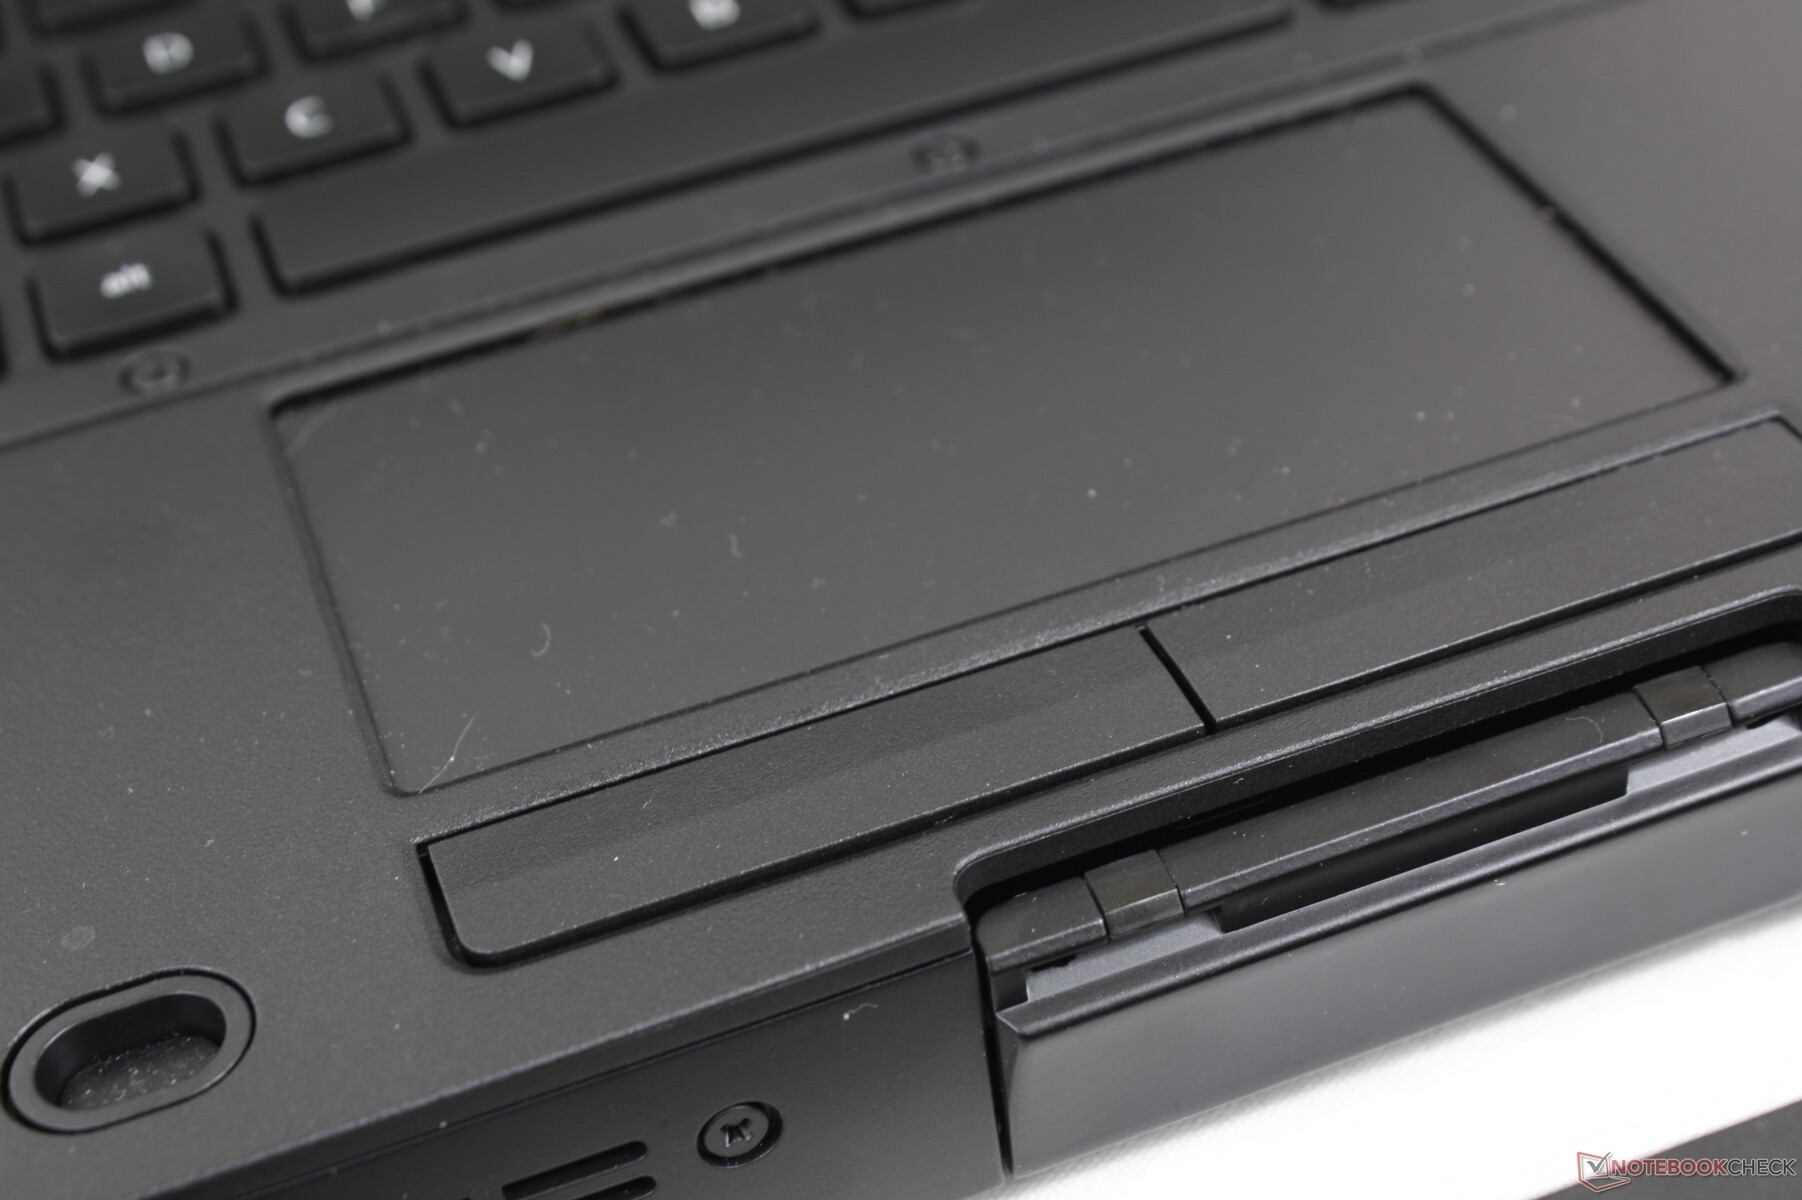
触摸板
触控板的尺寸合理,为10 x 5厘米,而Getac B360为9.3 x 5.3厘米。虽然牵引力很平稳,但光标控制是跳跃的,因为触控板的设计也是为了识别手套输入。我们建议更坚定地按下触控板表面,以减少跳动。

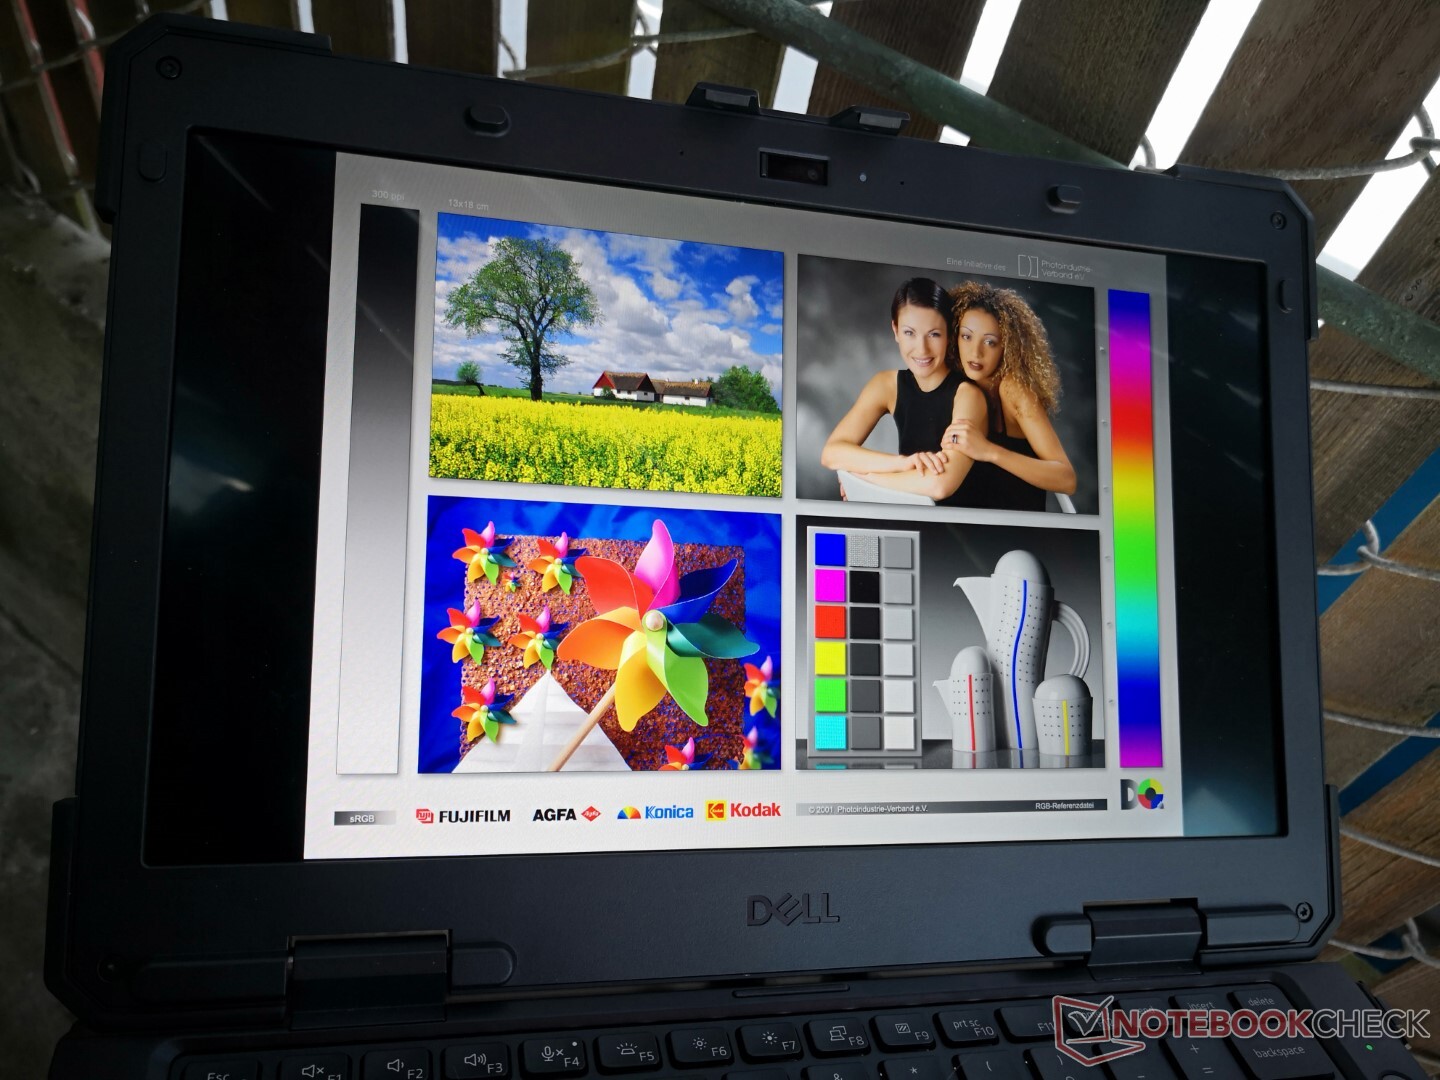
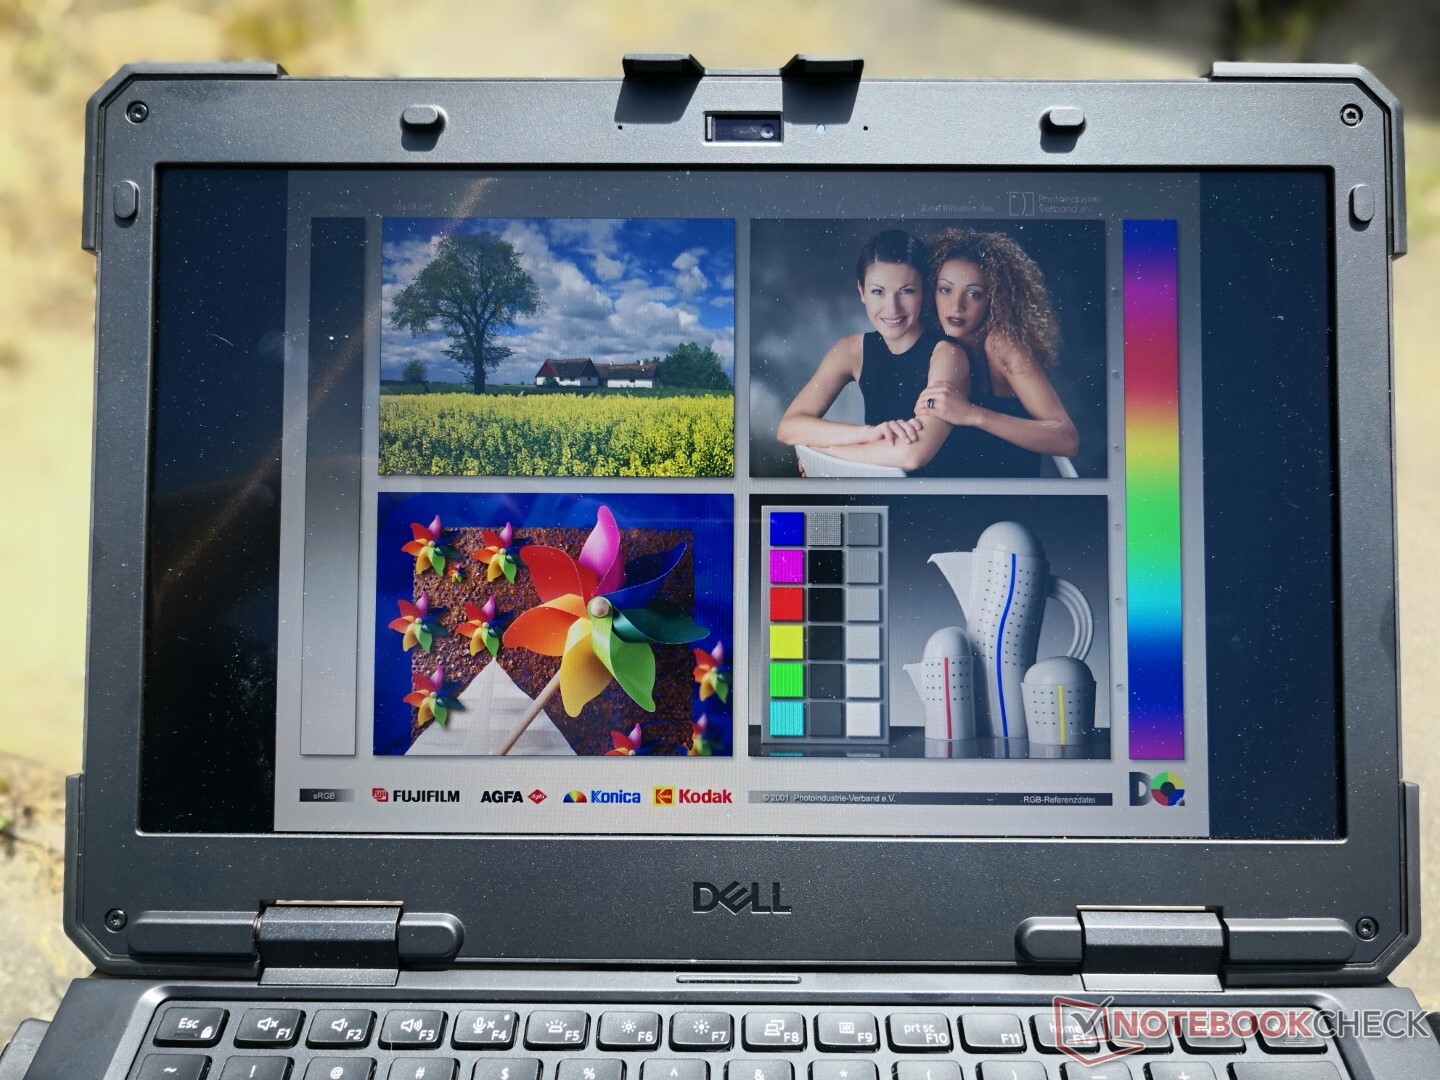
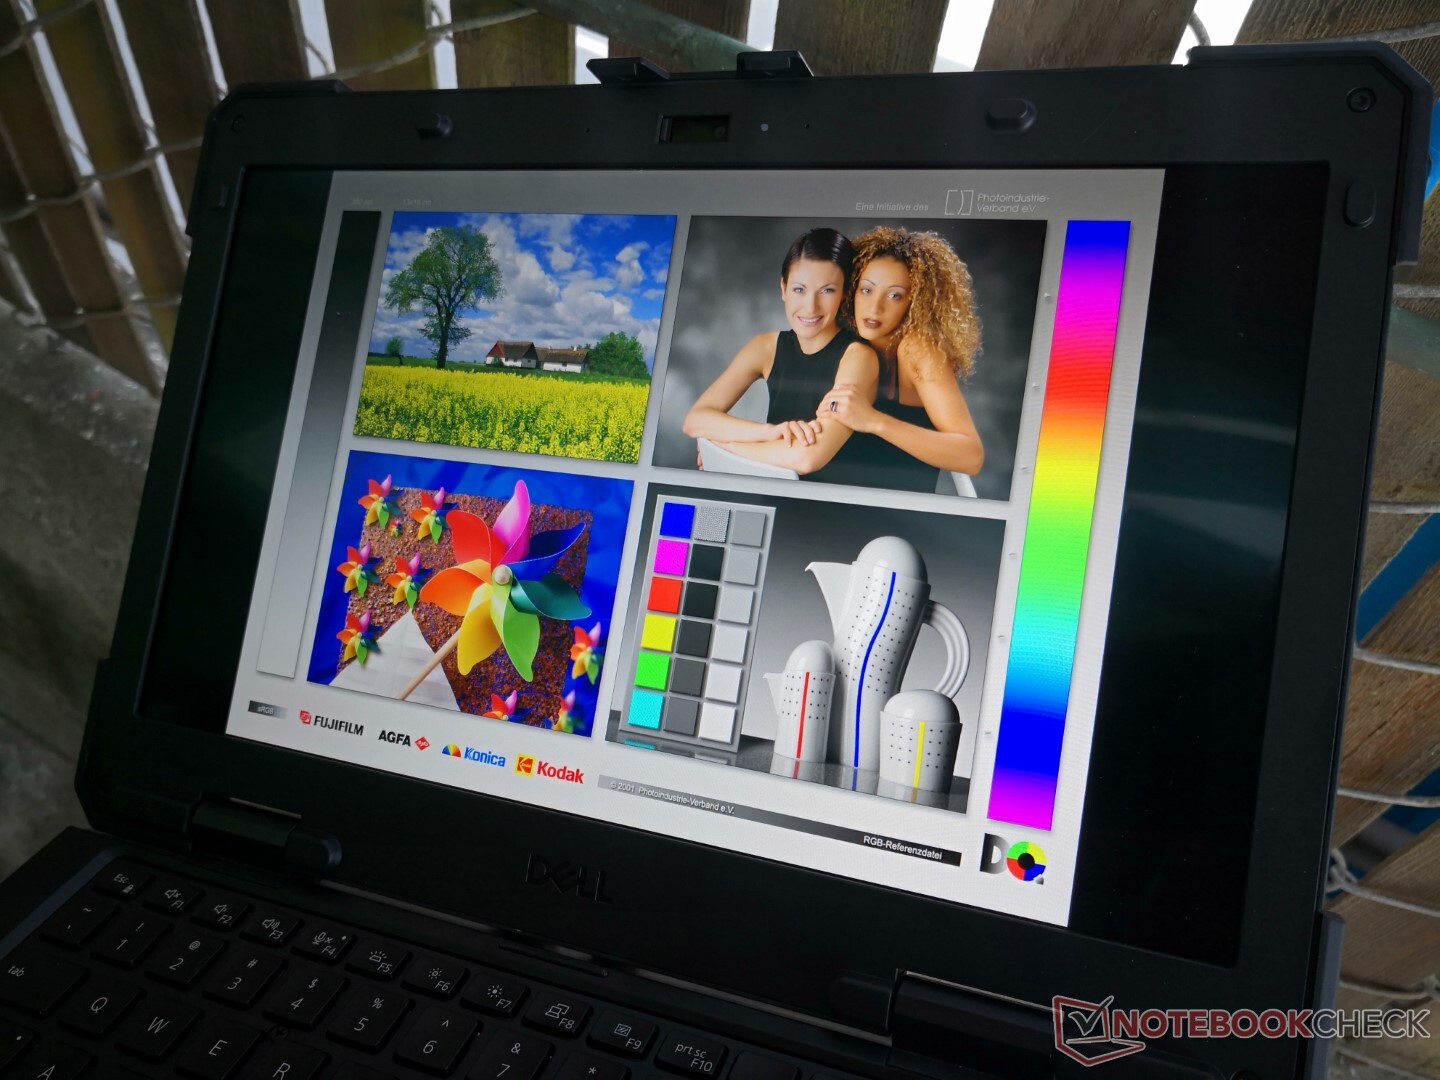
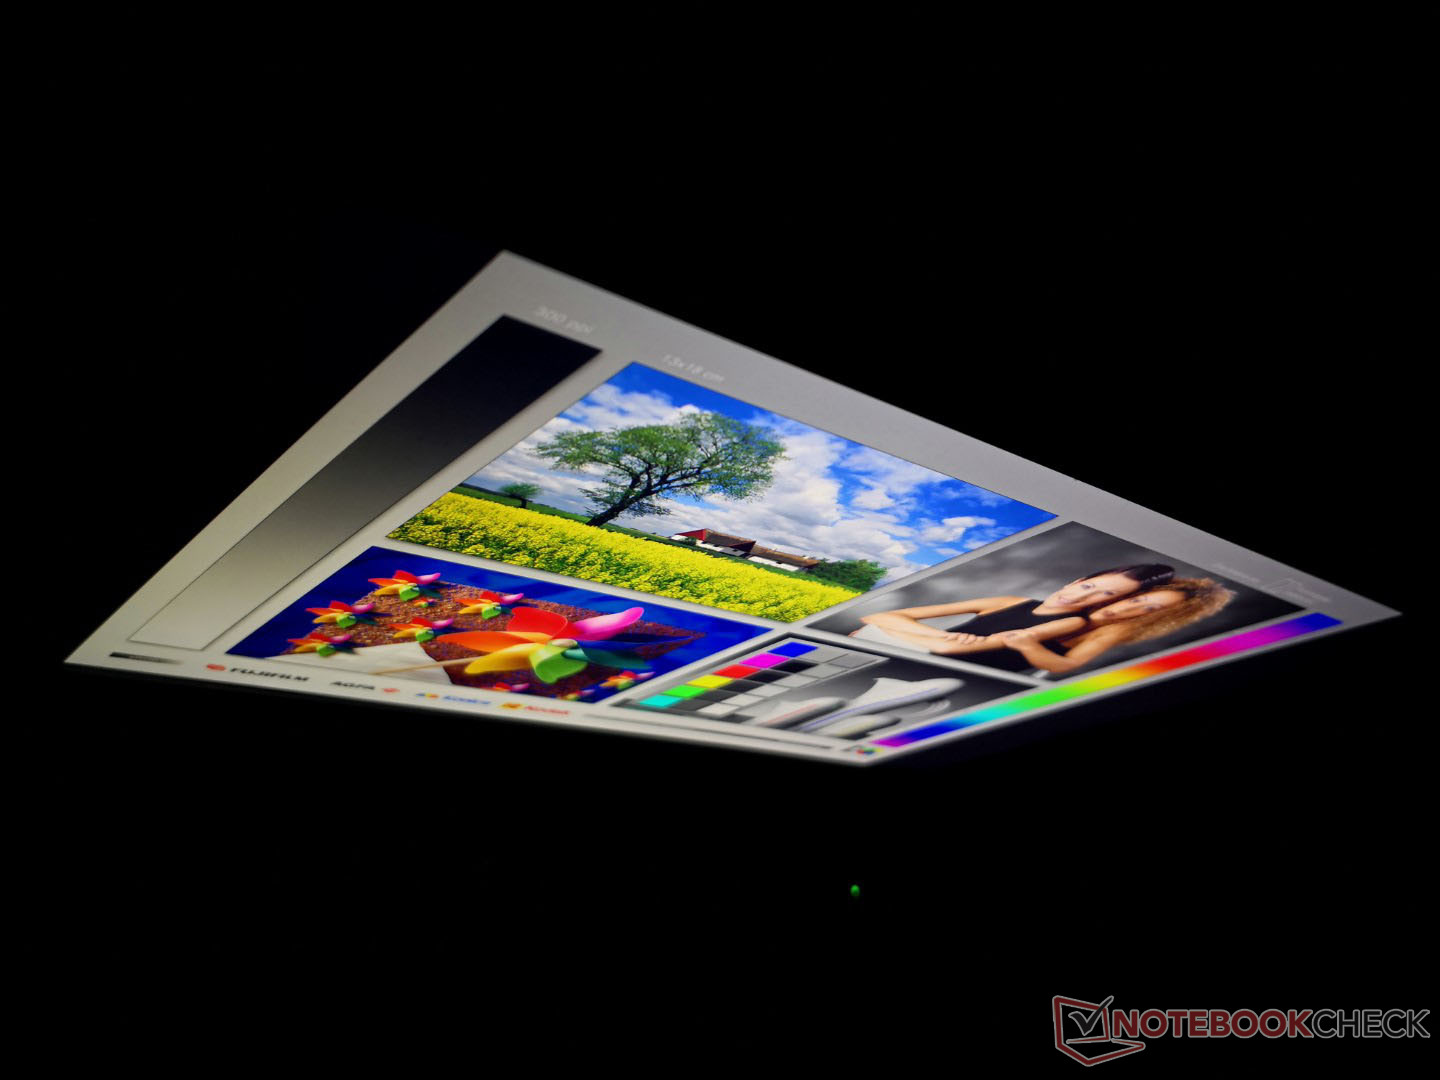
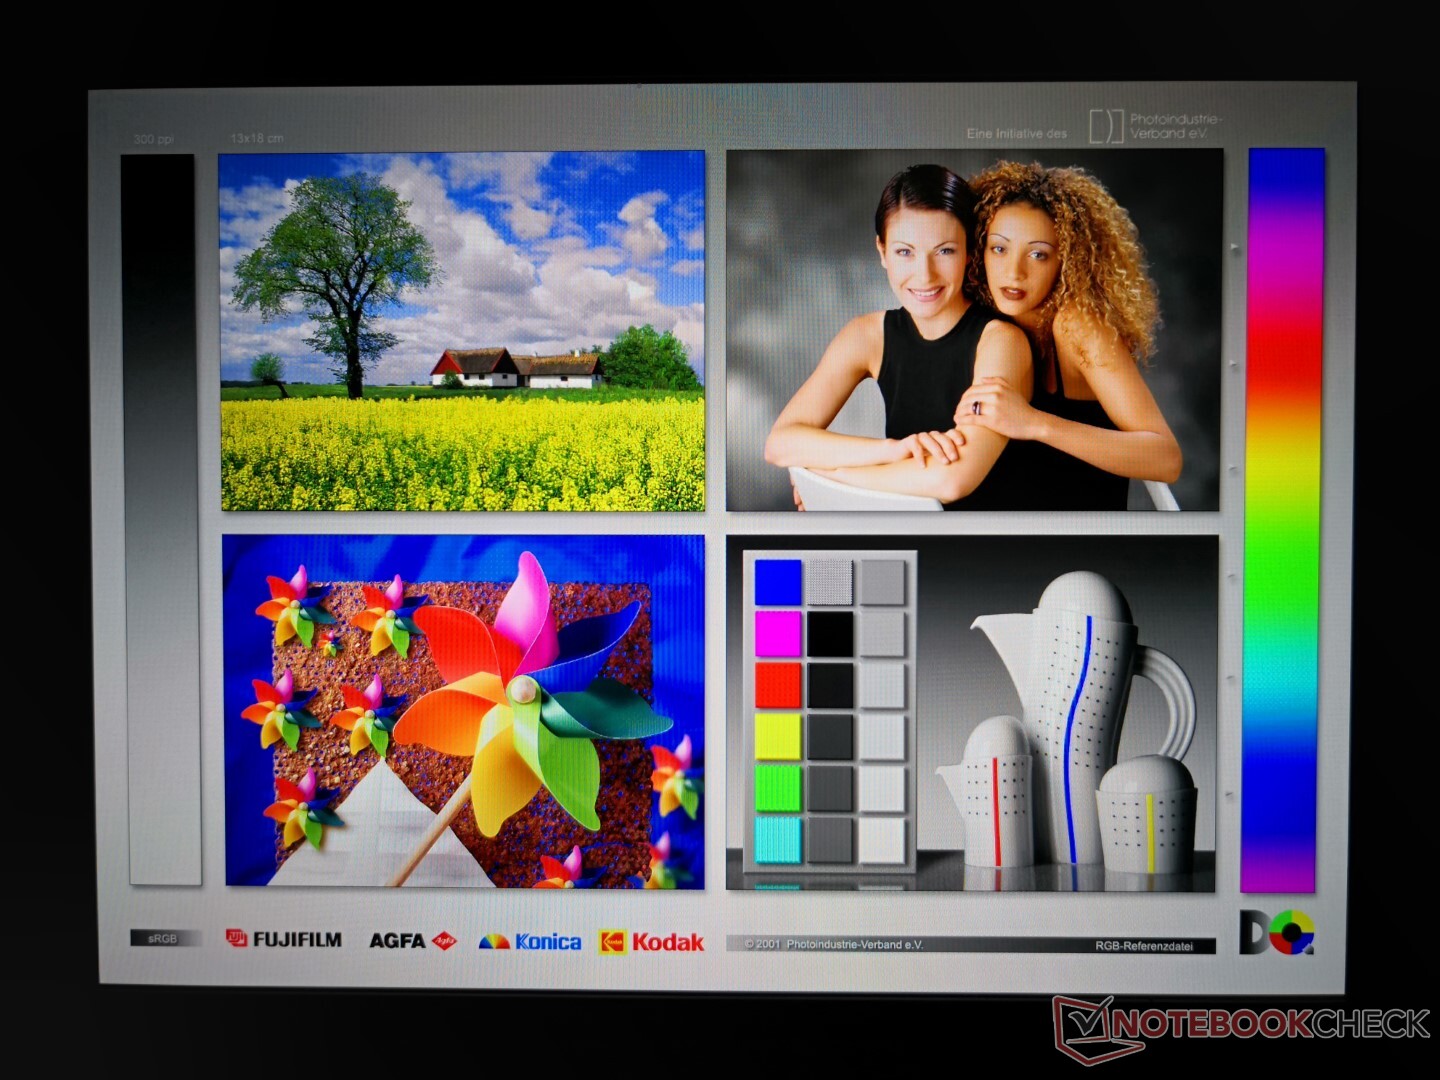
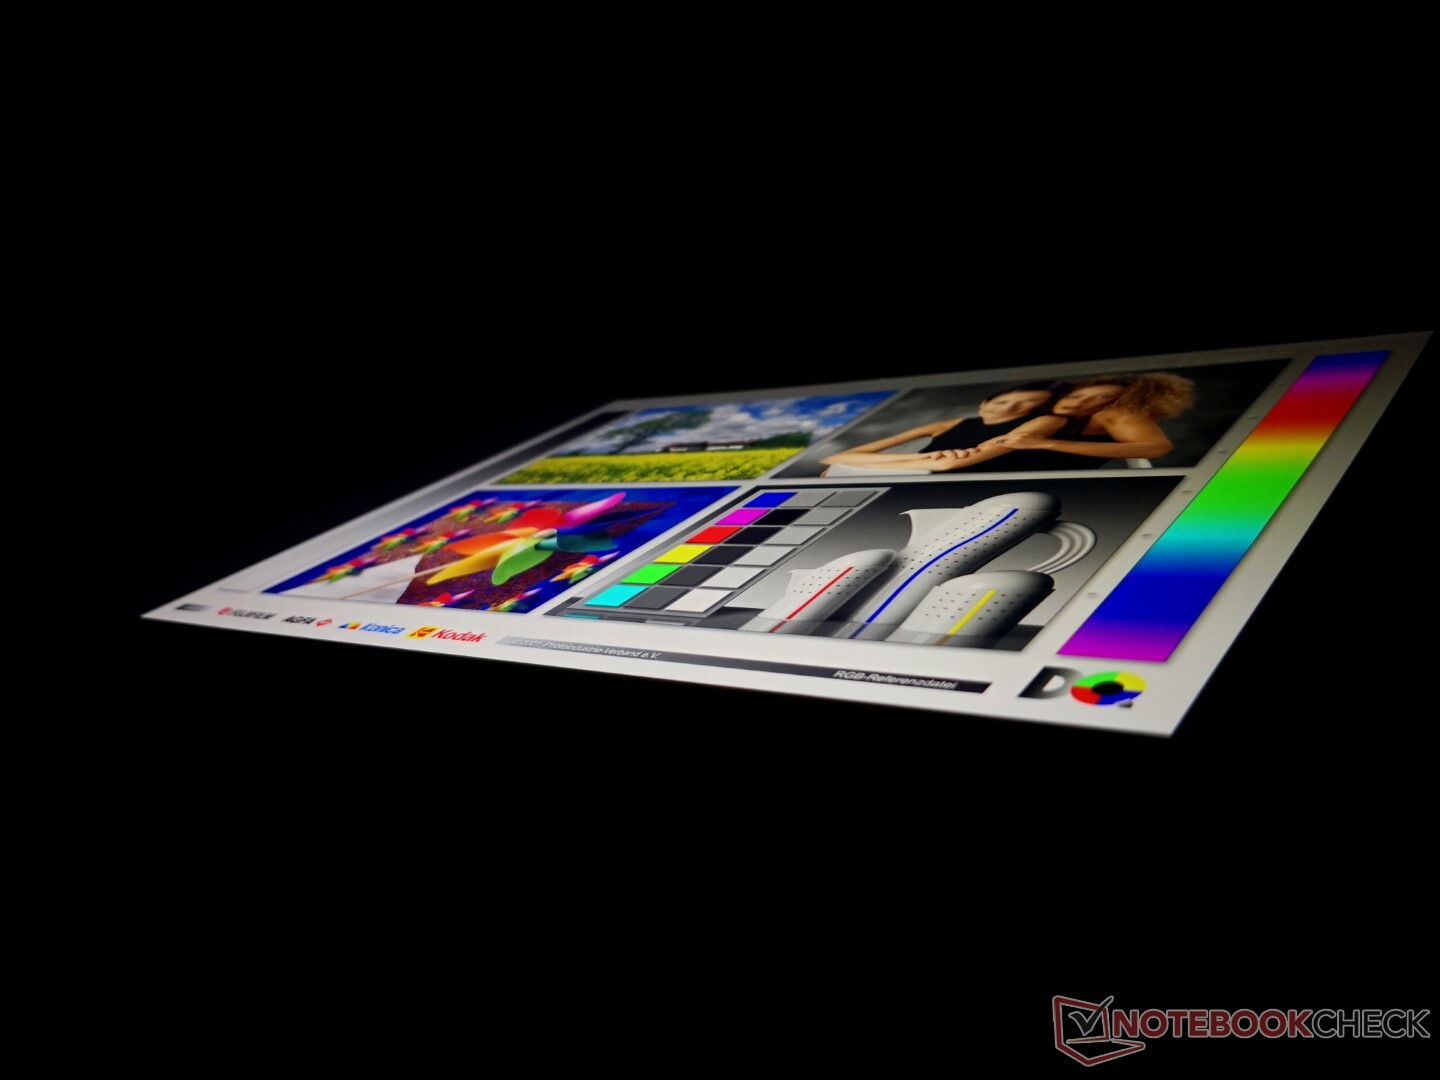
显示
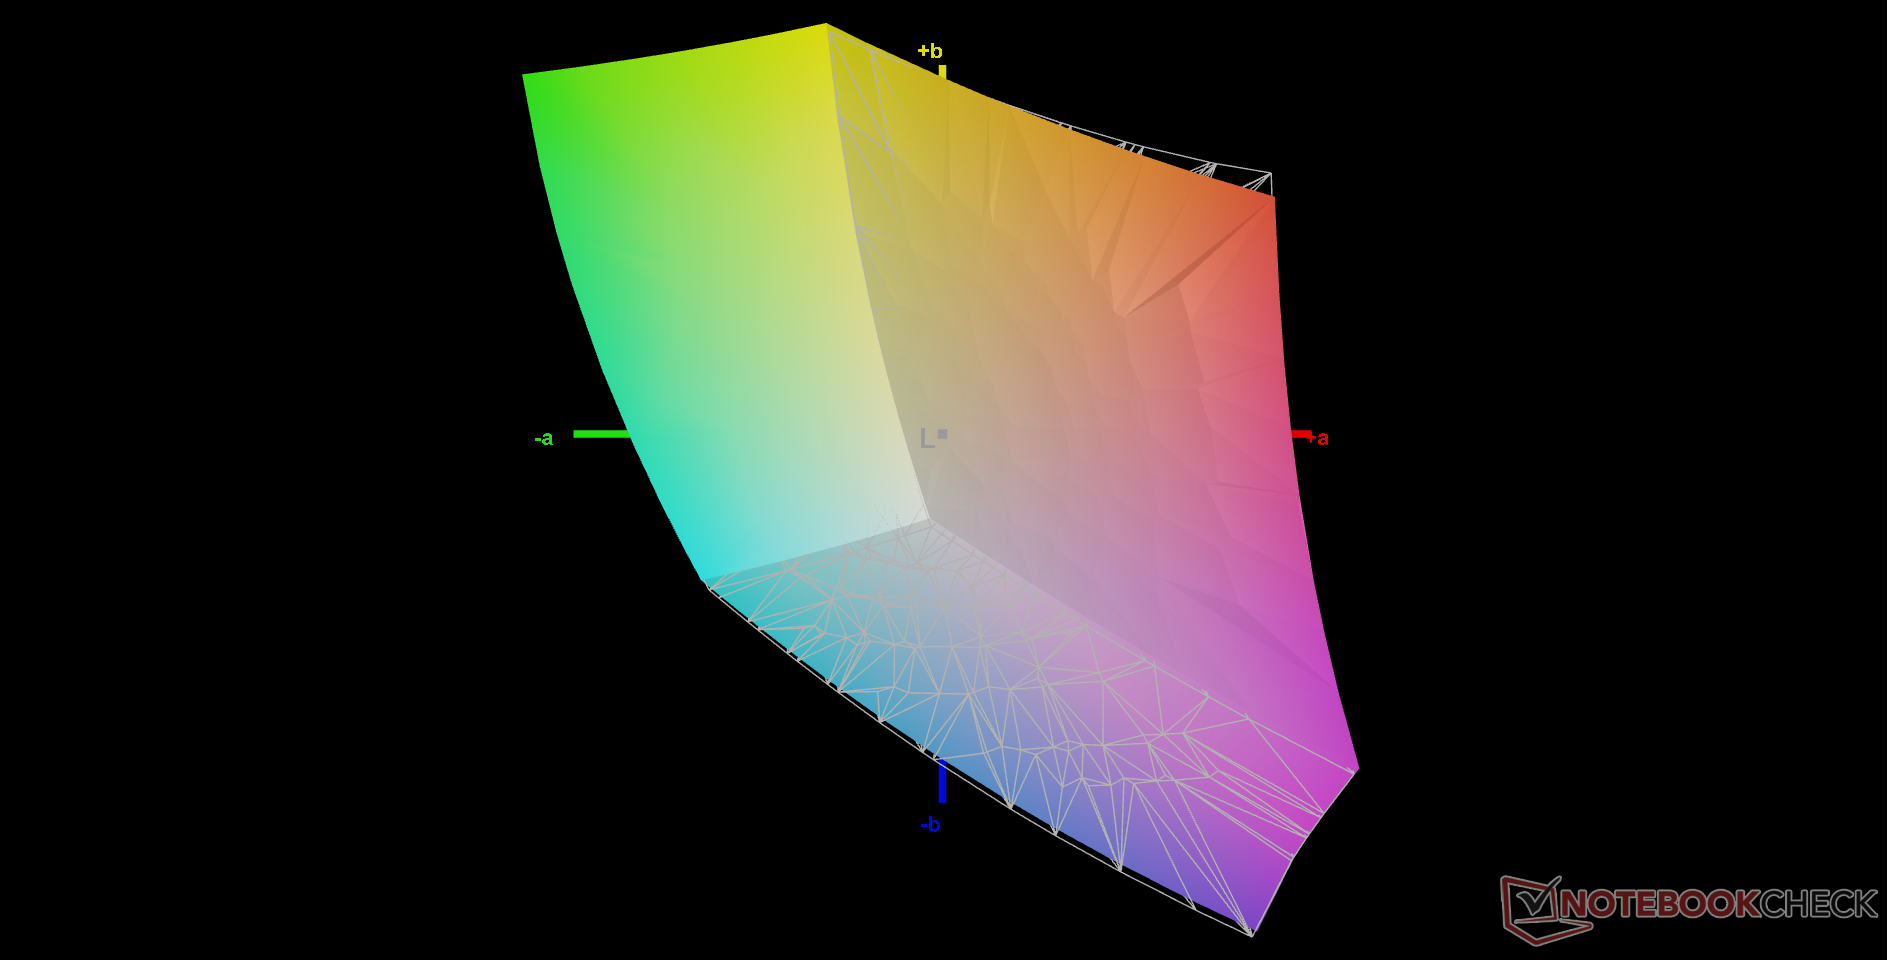
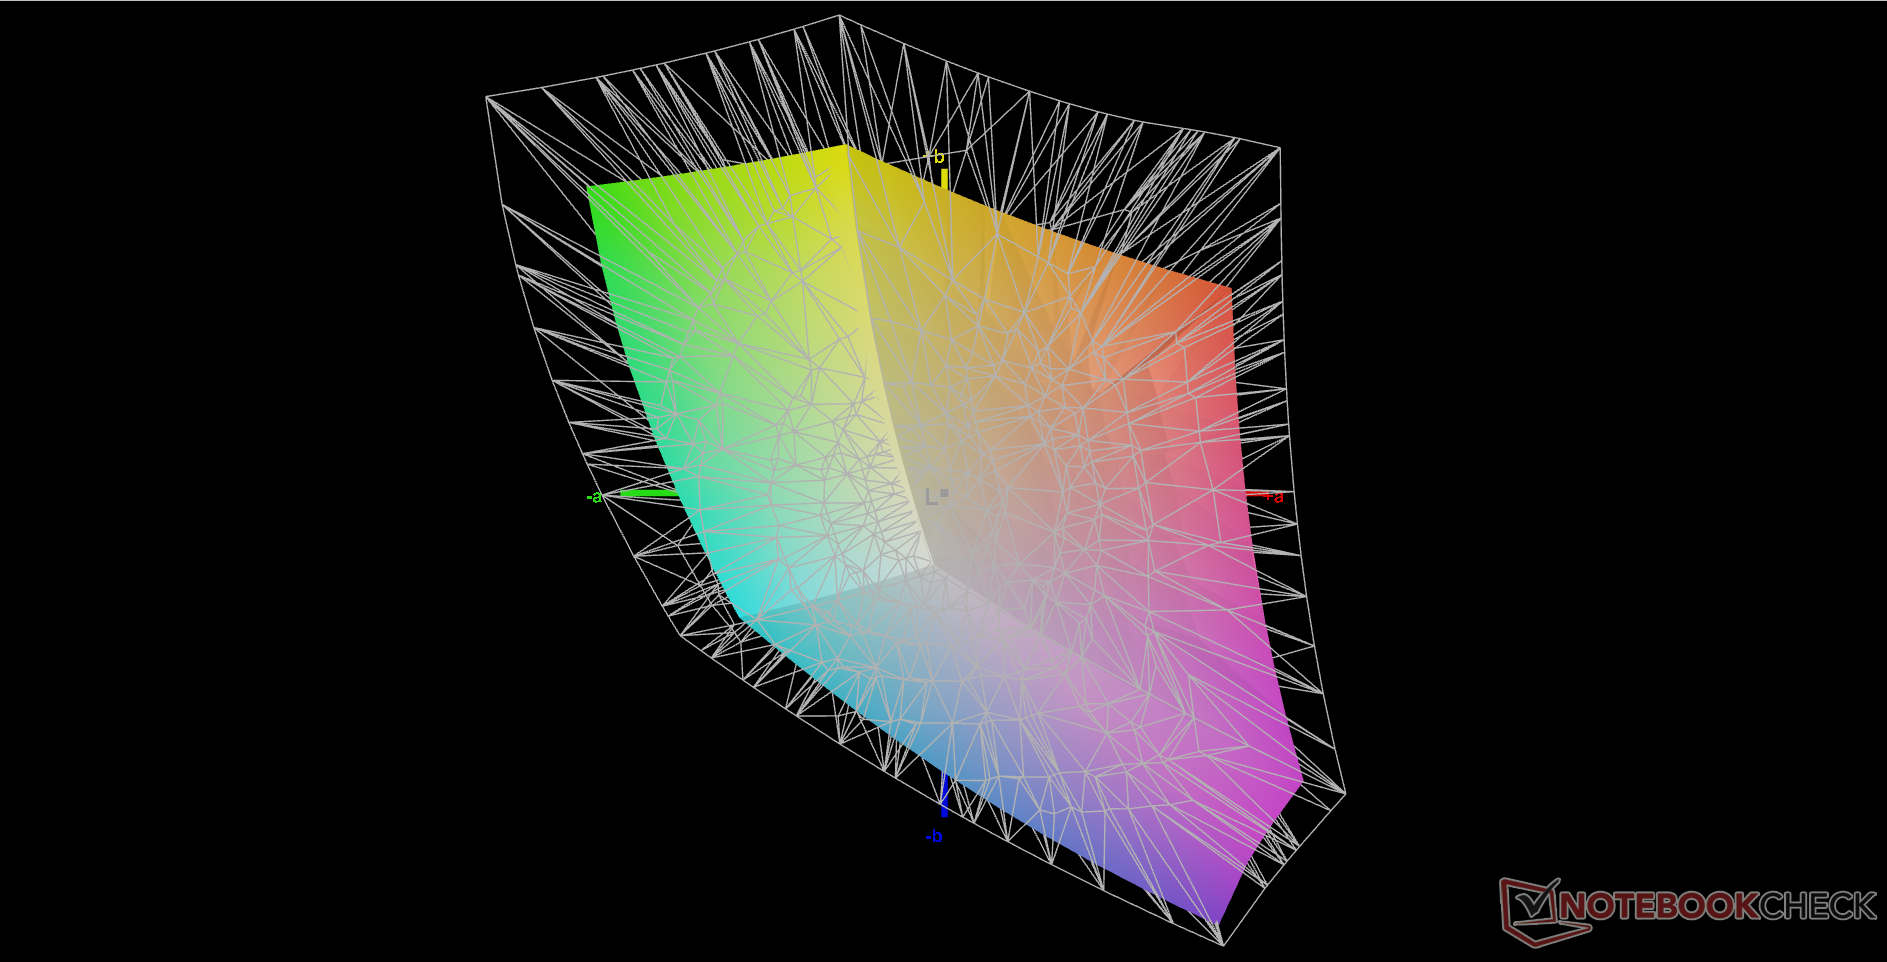
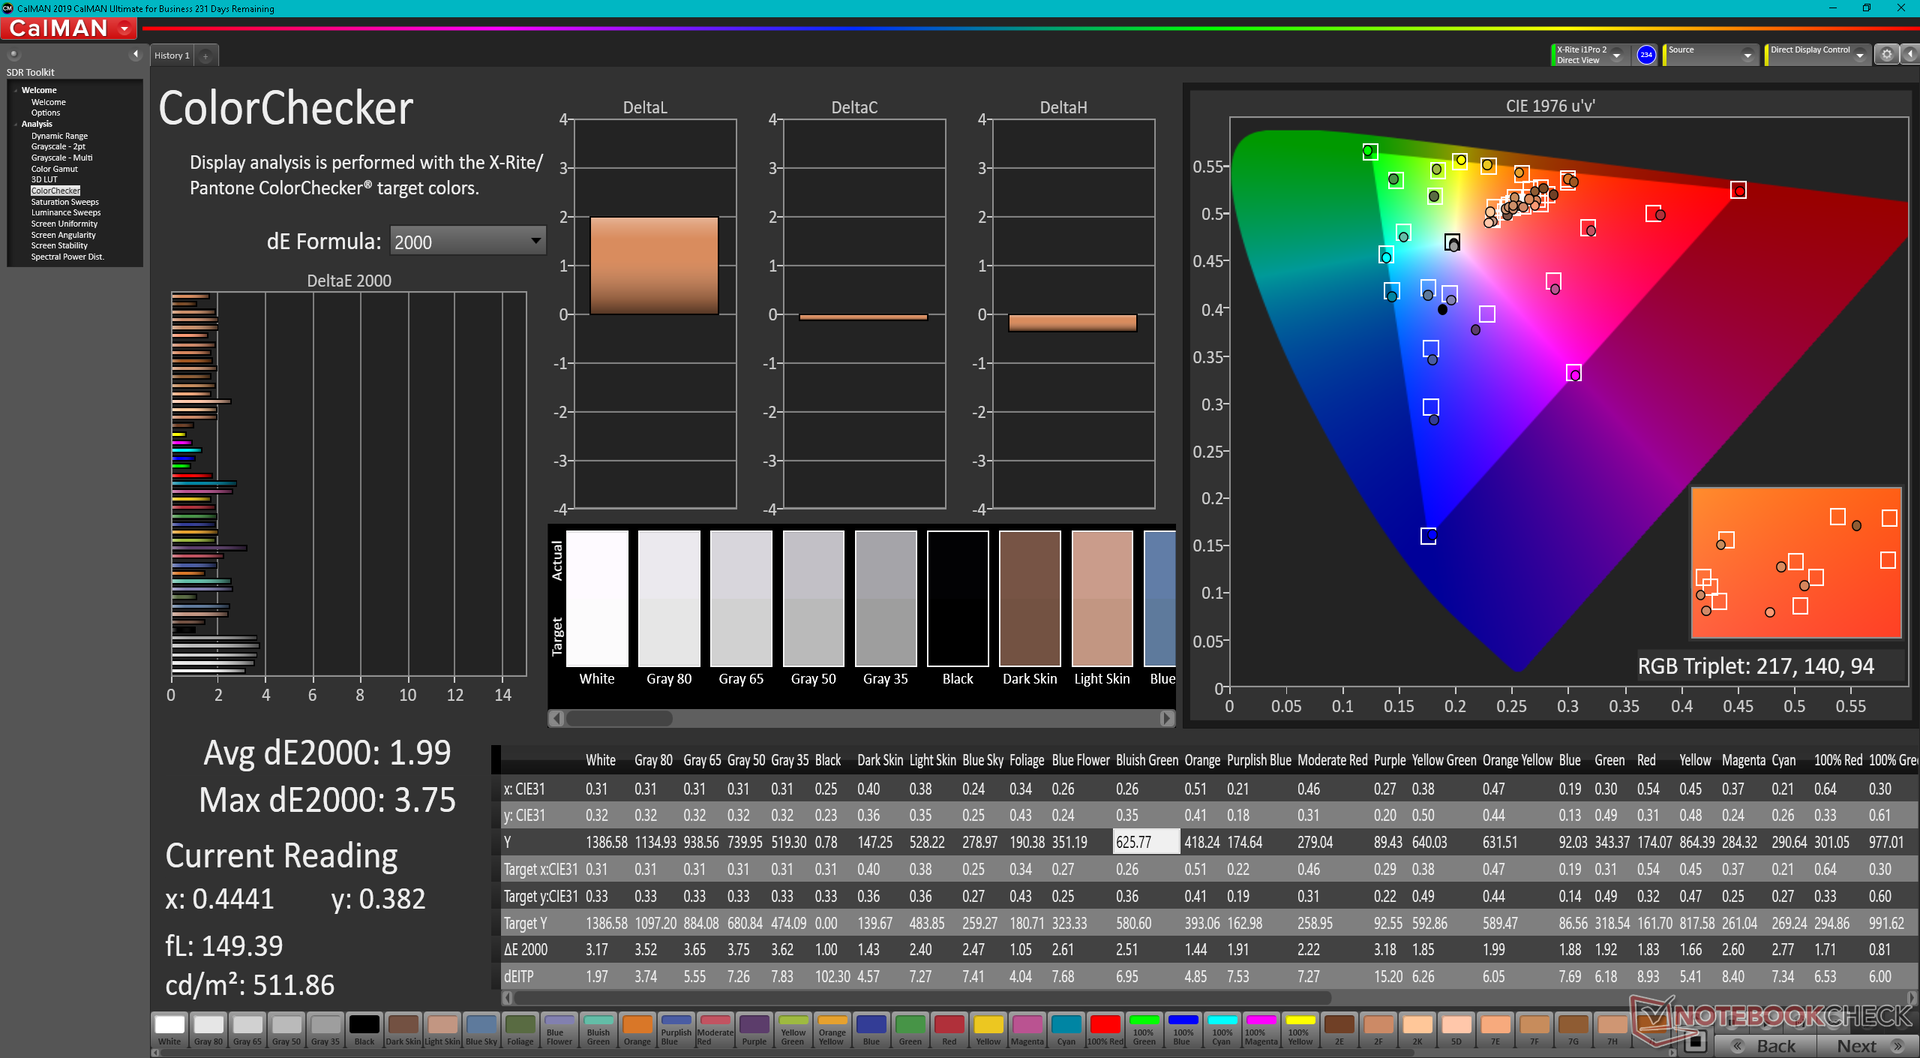
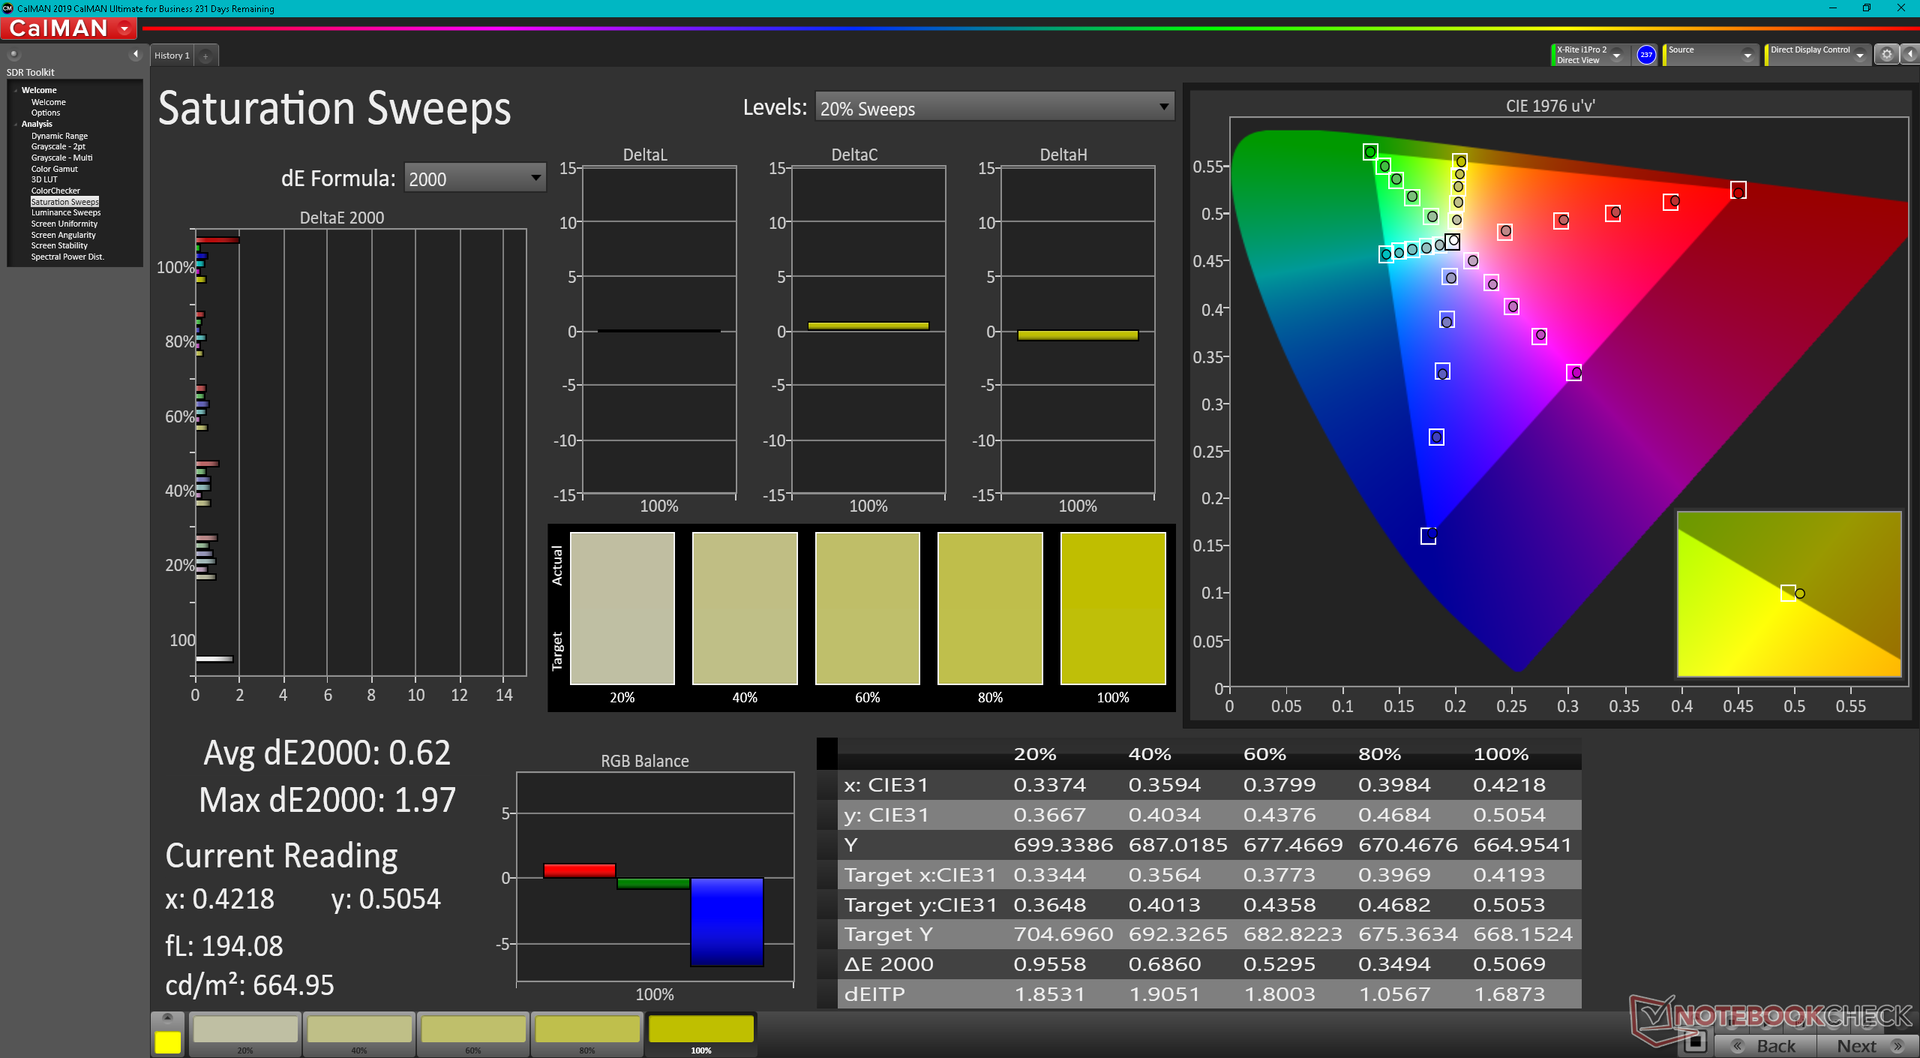
Latitude 7330 Rugged Extreme使用与多年前相同的1080p夏普LQ133M1 IPS面板。 2016 xps 13 9350或Latitude 13 7370.虽然这听起来可能是件坏事,但这种特殊的面板比大多数其他耐用型笔记本电脑的平均面板要好。例如,松下Toughbook FZ-55 MK2、Durabook S14I或Getac B360,都使用了色域明显较窄的面板,因此色彩明显较浅。这是为数不多的能提供1400尼特显示屏、超过1500:1的深度对比度和全sRGB覆盖的耐用机型之一。我们也很欣赏它没有像许多其他耐用设备那样的PWM。
这款面板最明显的缺点是它的黑白和灰白响应时间非常慢,意味着重影非常明显。值得庆幸的是,这对于浏览器或图片编辑等移动速度较慢的应用来说,不会成为问题。
| |||||||||||||||||||||||||
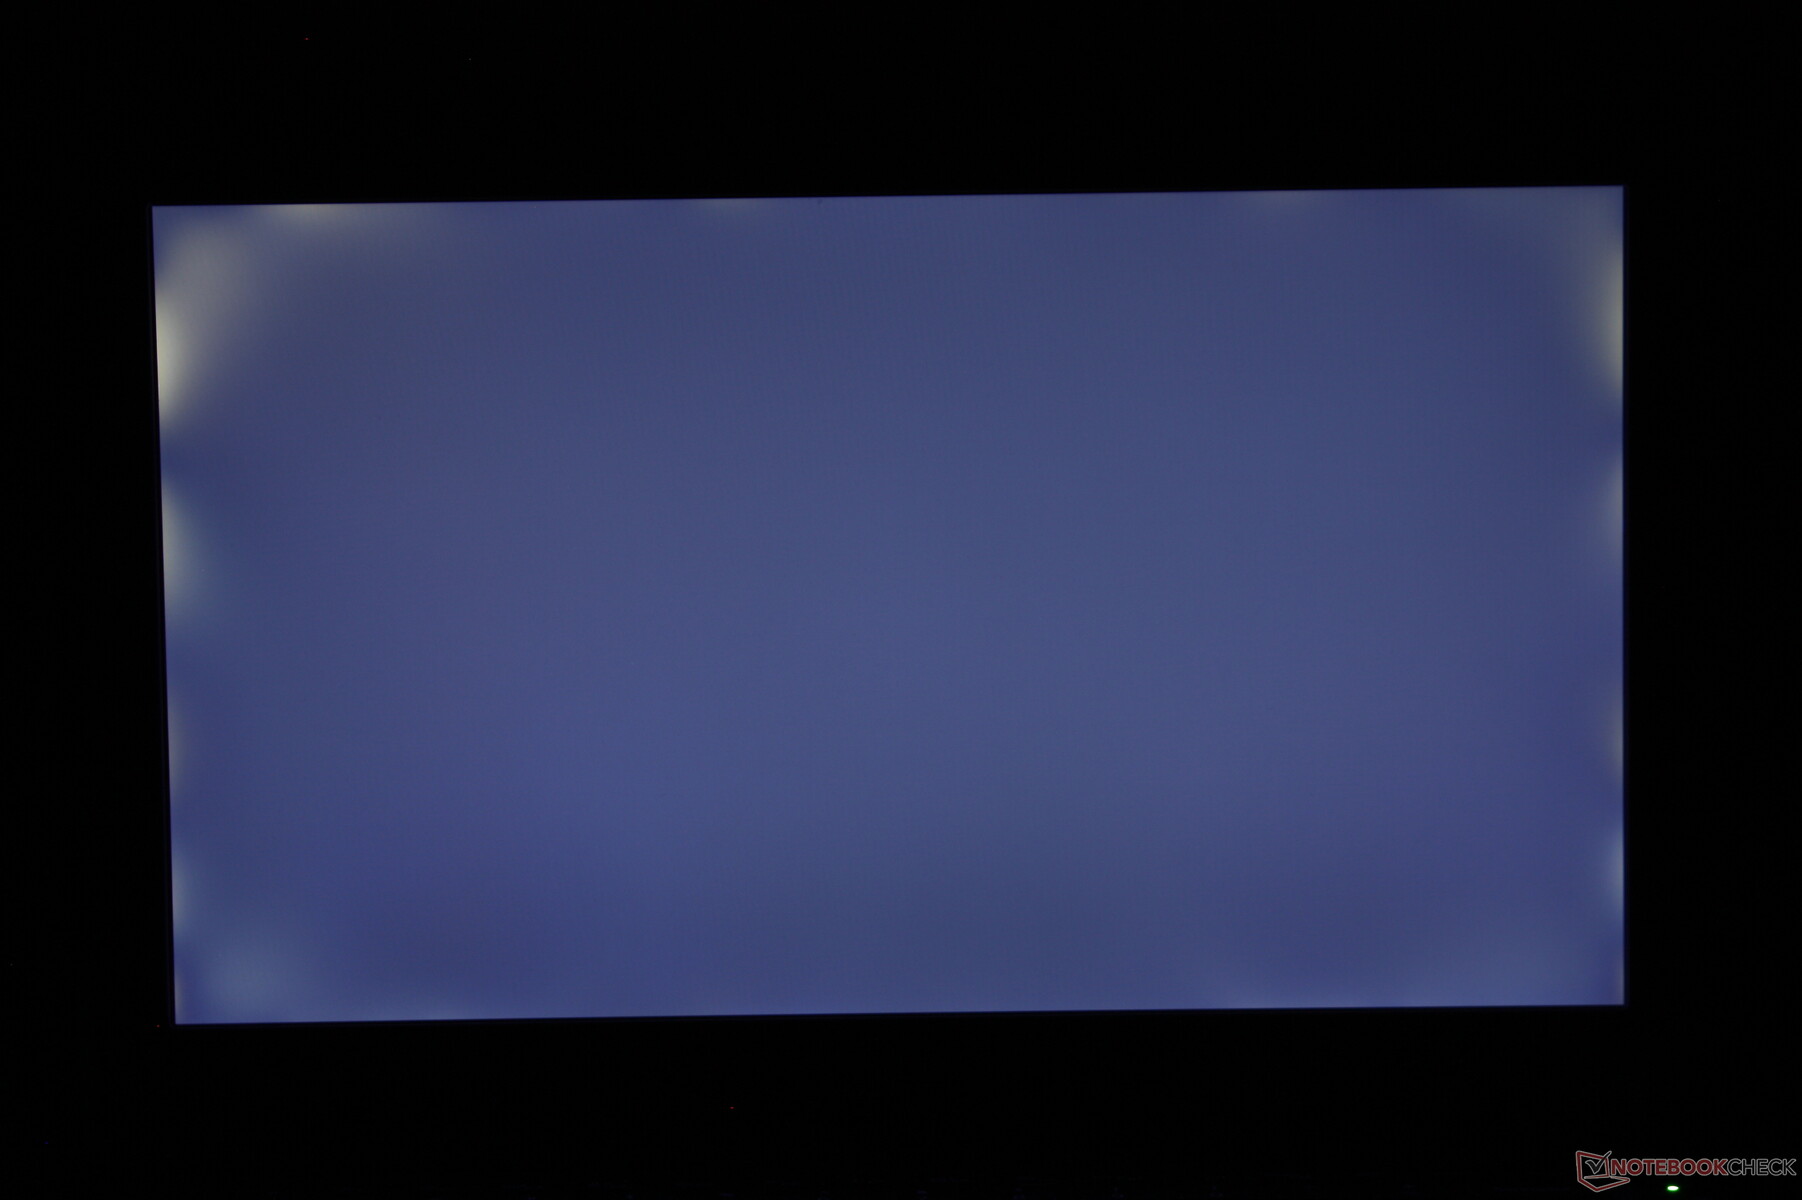
Brightness Distribution: 84 %
Center on Battery: 1414.1 cd/m²
Contrast: 1704:1 (Black: 0.83 cd/m²)
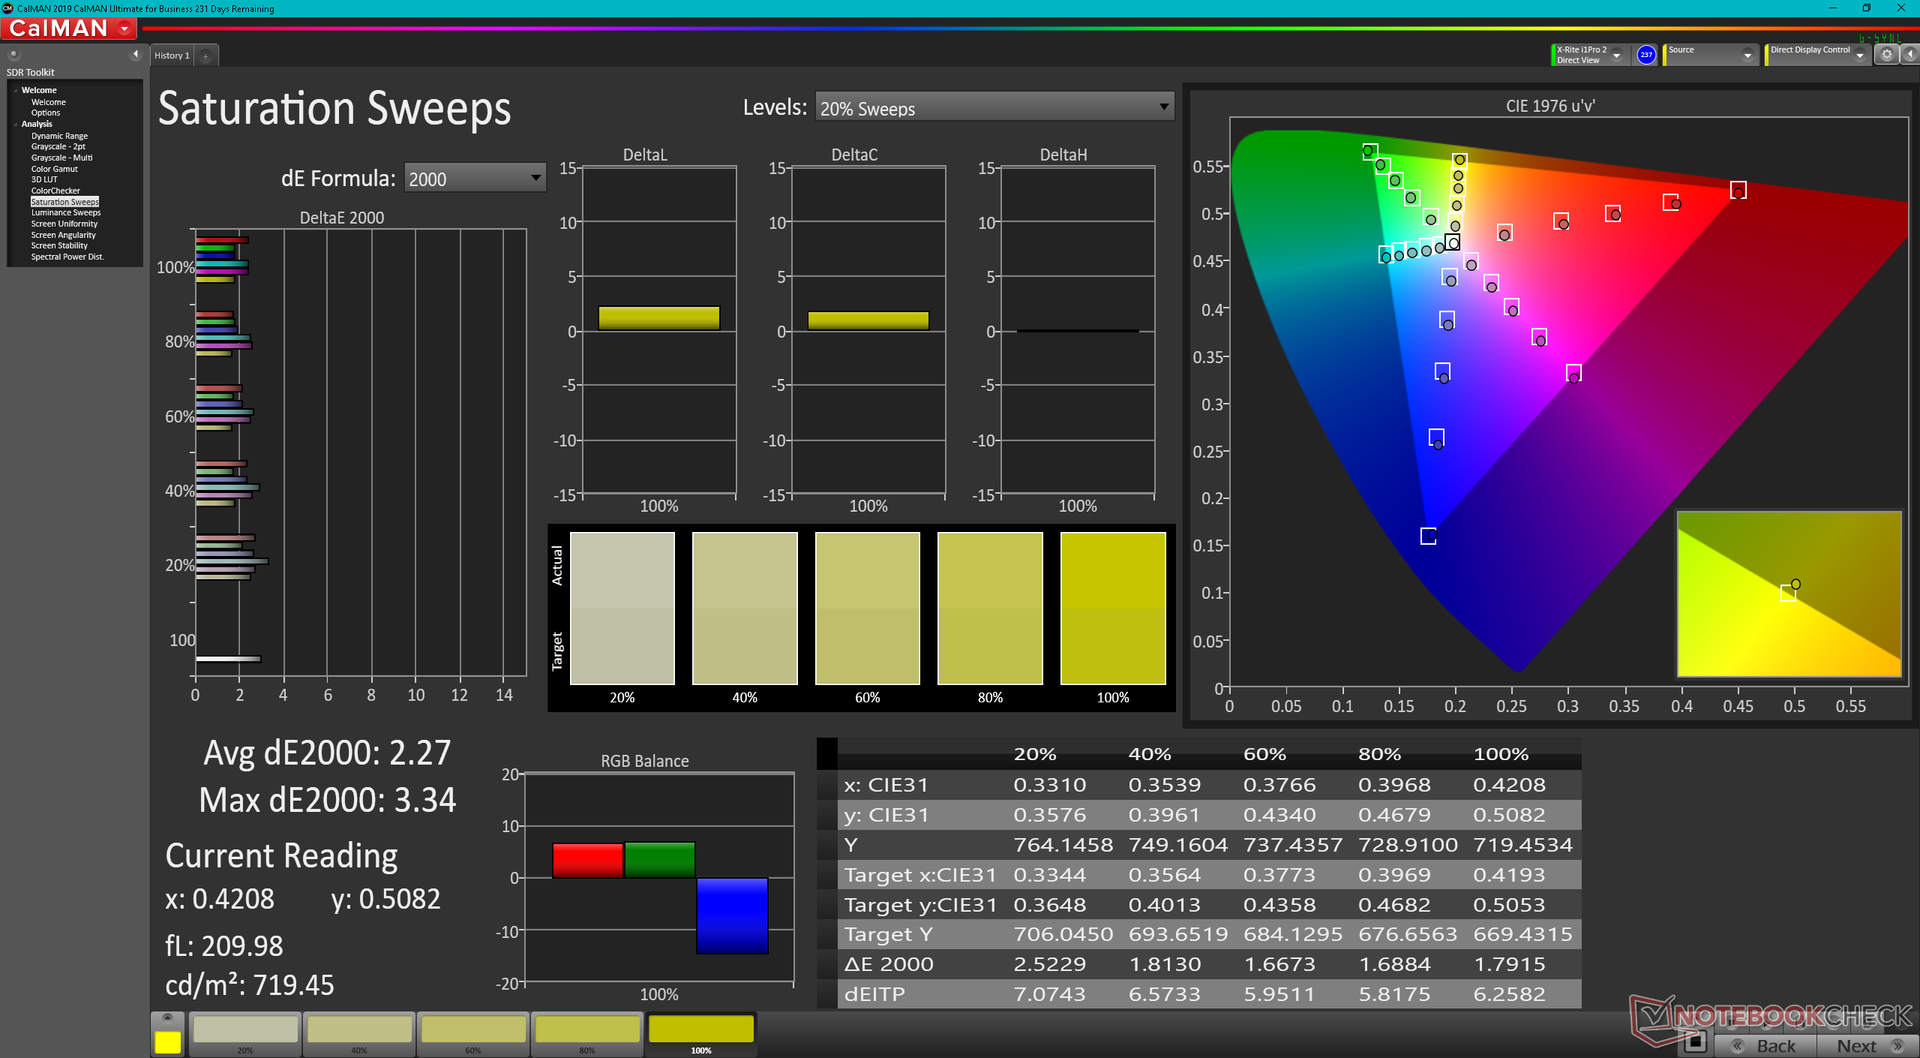
ΔE ColorChecker Calman: 1.99 | ∀{0.5-29.43 Ø4.73}
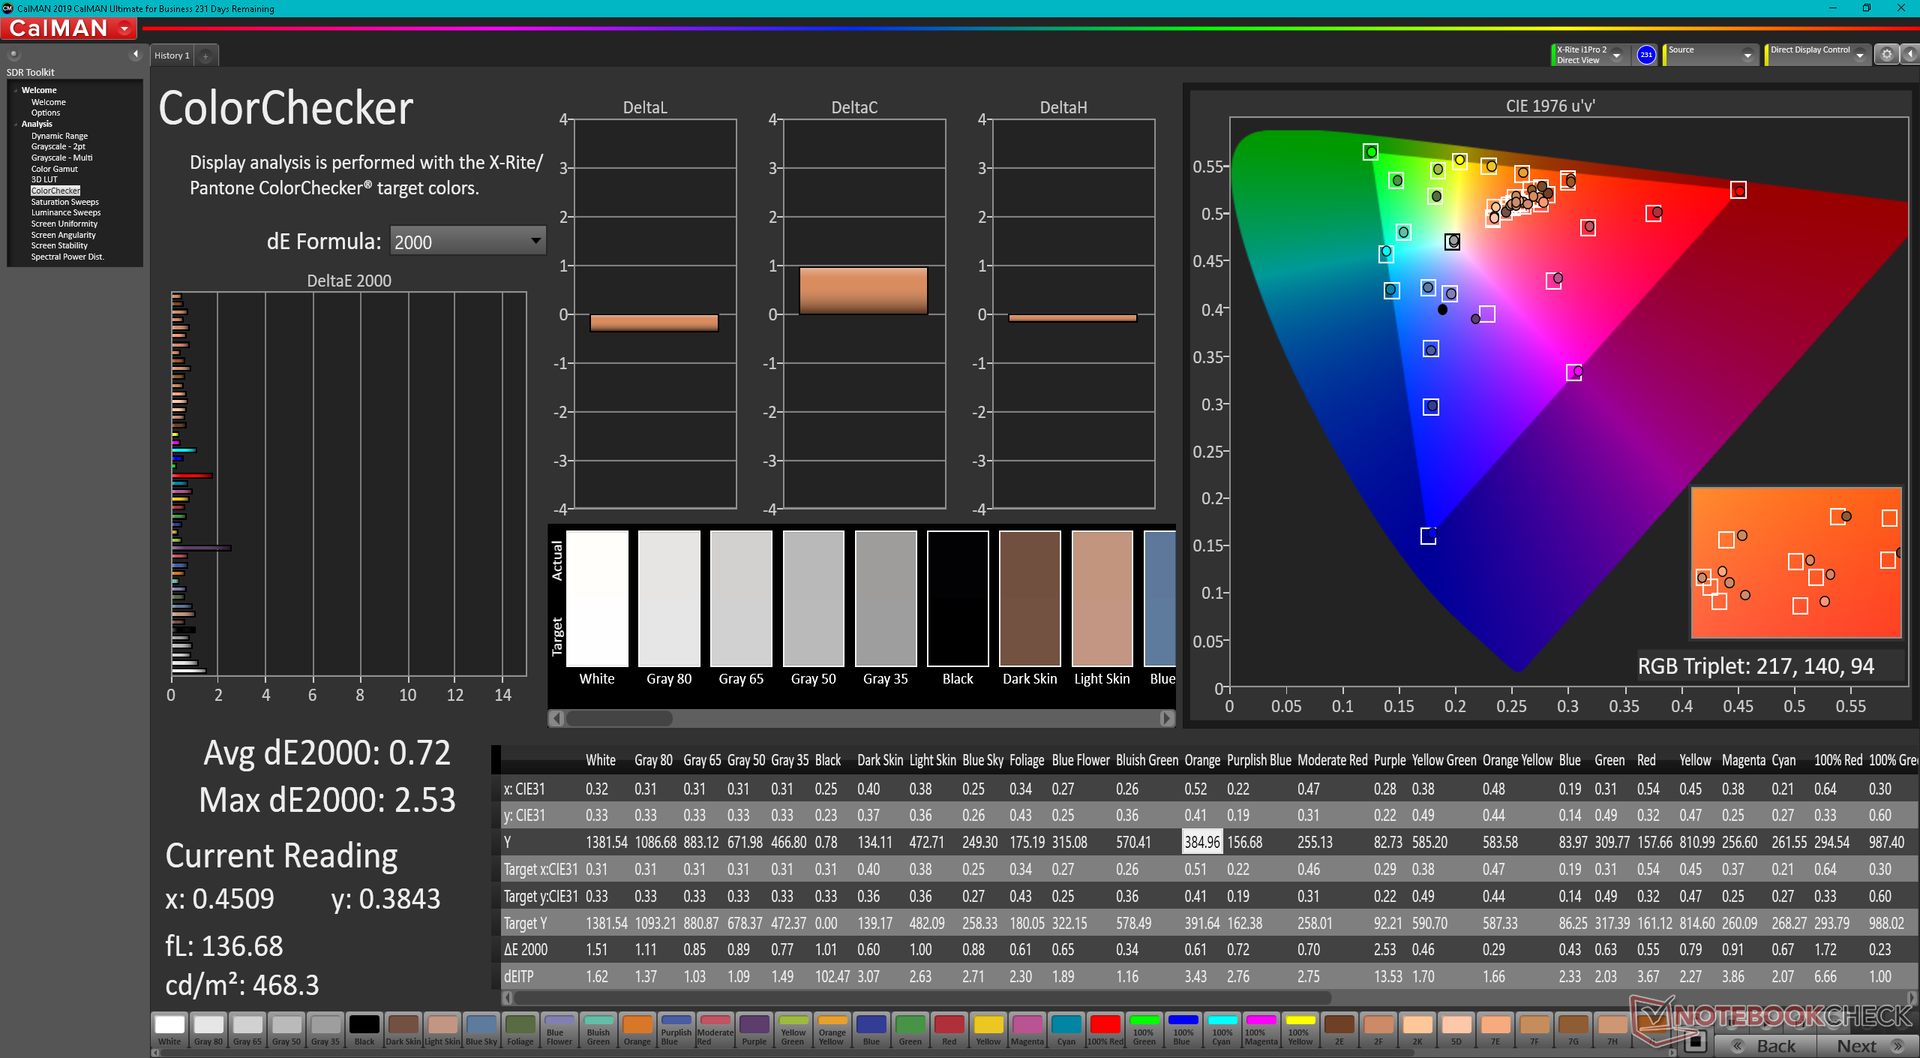
calibrated: 0.72
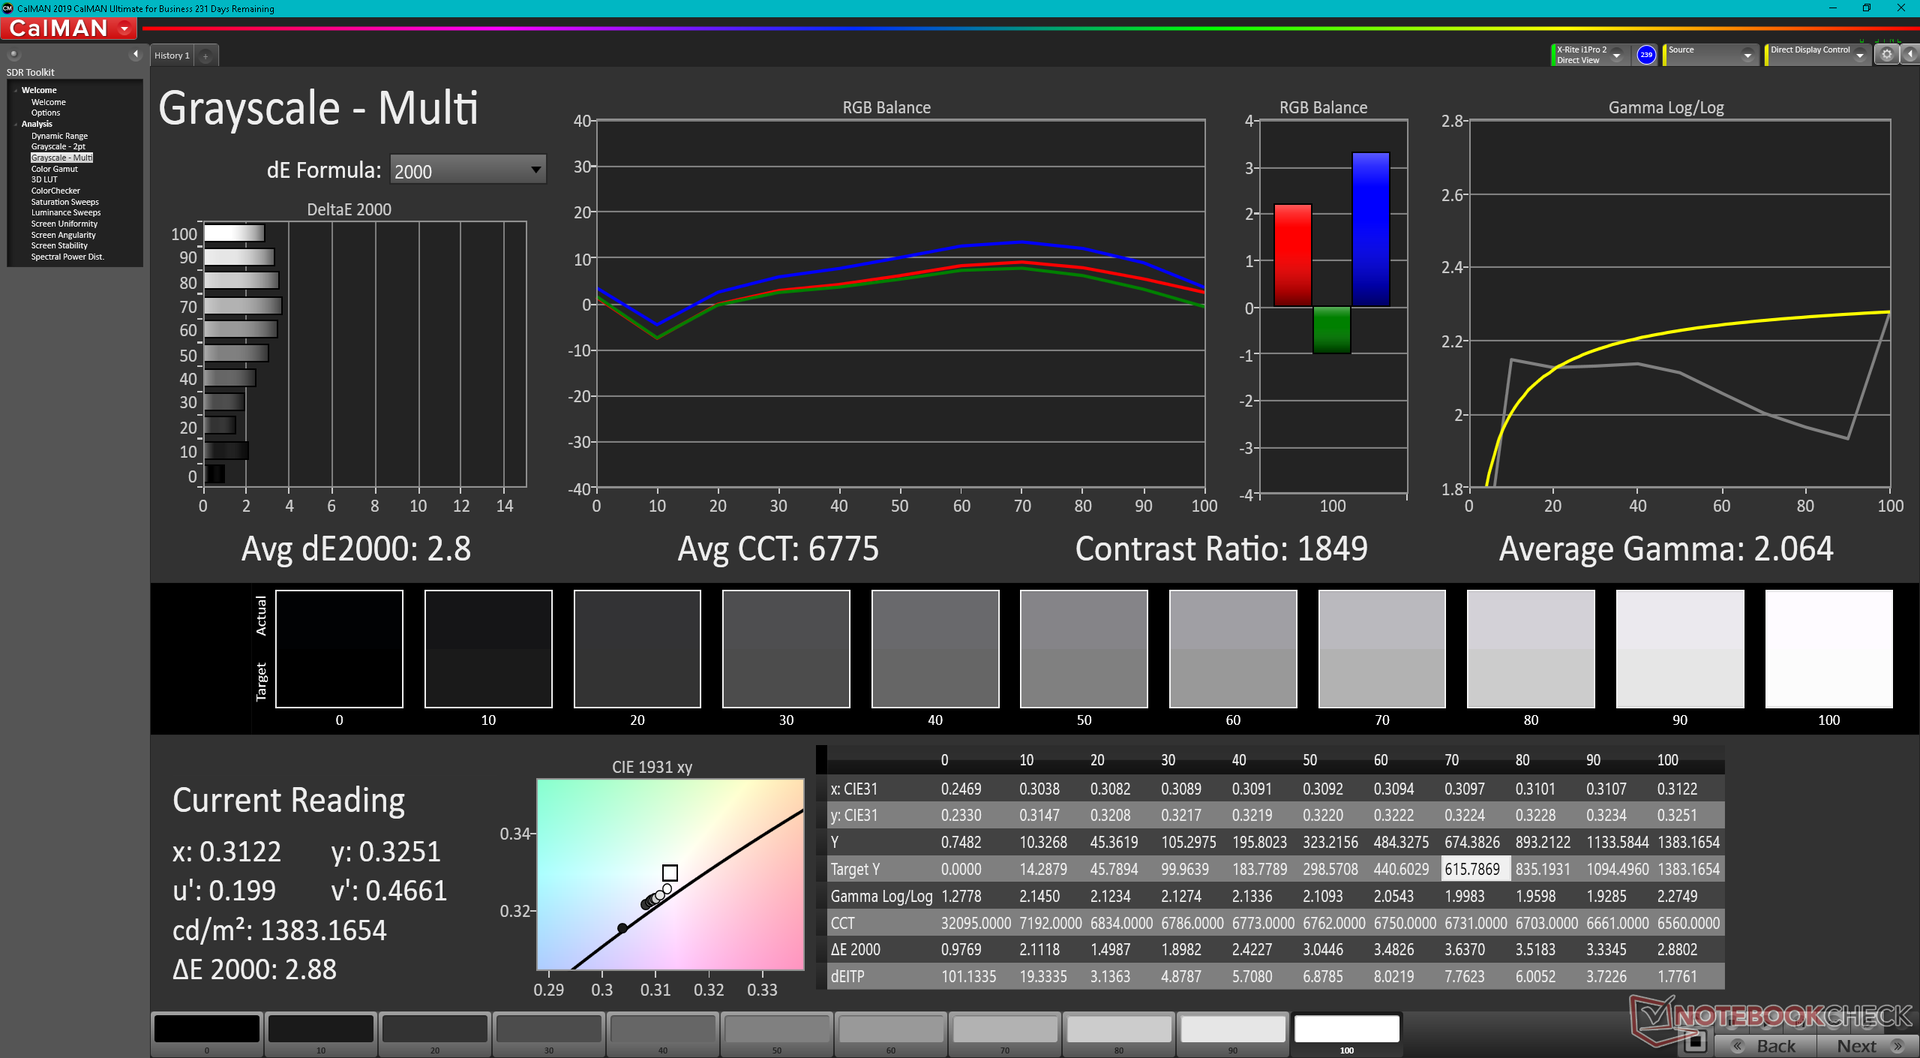
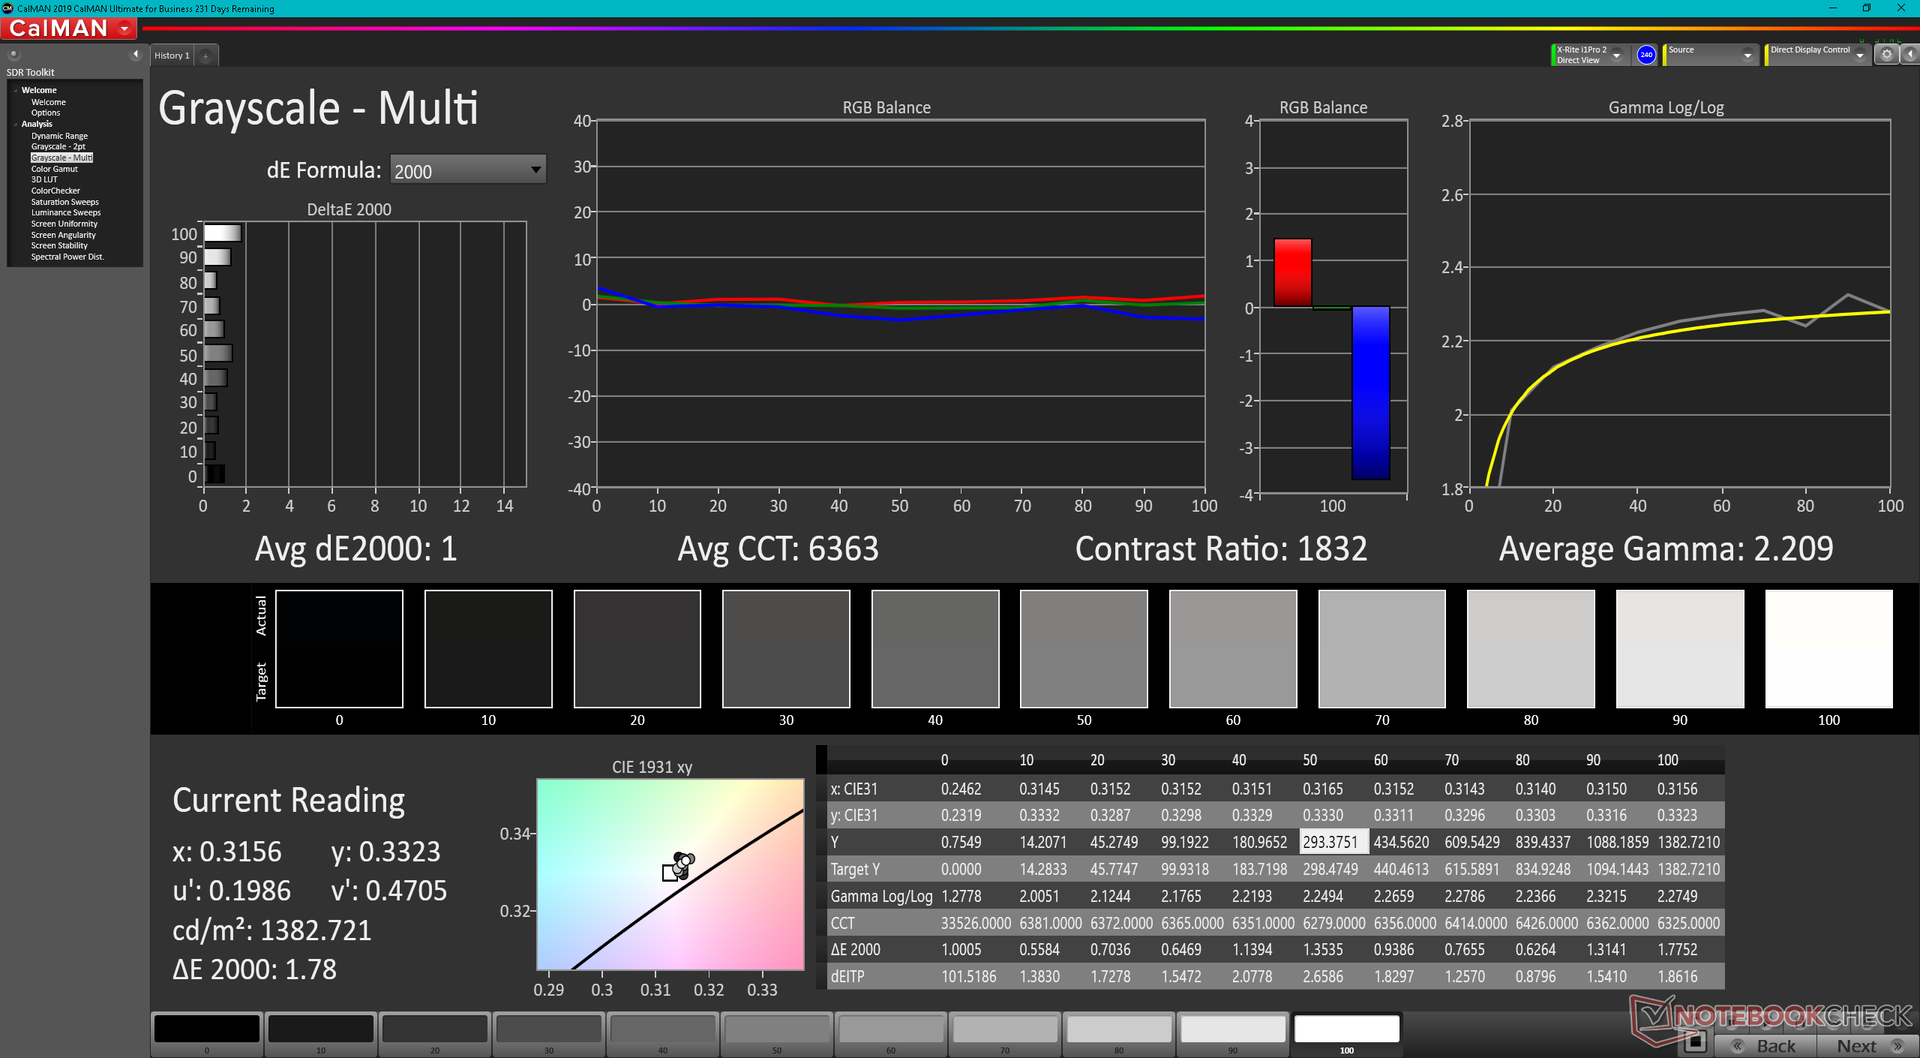
ΔE Greyscale Calman: 2.8 | ∀{0.09-98 Ø4.97}
69% AdobeRGB 1998 (Argyll 3D)
98.2% sRGB (Argyll 3D)
67.1% Display P3 (Argyll 3D)
Gamma: 2.06
CCT: 6775 K
| Dell Latitude 7330 Rugged Extreme Sharp LQ133M1, IPS, 1920x1080, 13.3" | Dell Latitude 7424 Rugged Extreme AU Optronics AUO523D, IPS, 1920x1080, 14" | Dell Latitude 5420 Rugged-P85G AU Optronics AUO523D, IPS, 1920x1080, 14" | Acer Enduro Urban N3 EUN314 XR140EA6T, IPS, 1920x1080, 14" | Panasonic Toughbook FZ-55 MK2 InfoVision M140NWF5 R3, IPS, 1920x1080, 14" | Durabook S14I KD140N0730A01, TN, 1920x1080, 14" | |
|---|---|---|---|---|---|---|
| Display | -2% | -7% | -5% | -48% | -34% | |
| Display P3 Coverage (%) | 67.1 | 65.3 -3% | 62.5 -7% | 63.5 -5% | 34.8 -48% | 43.55 -35% |
| sRGB Coverage (%) | 98.2 | 96.9 -1% | 92.4 -6% | 91.9 -6% | 52.2 -47% | 65.4 -33% |
| AdobeRGB 1998 Coverage (%) | 69 | 67.3 -2% | 64.2 -7% | 65.5 -5% | 36 -48% | 45 -35% |
| Response Times | 11% | 15% | 21% | 46% | 66% | |
| Response Time Grey 50% / Grey 80% * (ms) | 74.4 ? | 62.8 ? 16% | 68 ? 9% | 56 ? 25% | 28.4 ? 62% | 30.4 ? 59% |
| Response Time Black / White * (ms) | 42.4 ? | 40 ? 6% | 33.6 ? 21% | 35.2 ? 17% | 30 ? 29% | 11.8 ? 72% |
| PWM Frequency (Hz) | 763 | 735 ? | 1000 ? | 685 ? | 304.9 ? | |
| Screen | -71% | -75% | -97% | -99% | -232% | |
| Brightness middle (cd/m²) | 1414.1 | 844 -40% | 1111.7 -21% | 487.8 -66% | 1061.1 -25% | 1180.7 -17% |
| Brightness (cd/m²) | 1282 | 793 -38% | 1026 -20% | 464 -64% | 997 -22% | 1102 -14% |
| Brightness Distribution (%) | 84 | 88 5% | 80 -5% | 89 6% | 76 -10% | 89 6% |
| Black Level * (cd/m²) | 0.83 | 0.54 35% | 0.81 2% | 0.48 42% | 0.7 16% | 1.91 -130% |
| Contrast (:1) | 1704 | 1563 -8% | 1372 -19% | 1016 -40% | 1516 -11% | 618 -64% |
| Colorchecker dE 2000 * | 1.99 | 4.8 -141% | 3.83 -92% | 6.51 -227% | 4.64 -133% | 13.45 -576% |
| Colorchecker dE 2000 max. * | 3.75 | 11.88 -217% | 7.85 -109% | 11.36 -203% | 20.92 -458% | 22.52 -501% |
| Colorchecker dE 2000 calibrated * | 0.72 | 1.15 -60% | 2.98 -314% | 1.77 -146% | 2.52 -250% | 3.19 -343% |
| Greyscale dE 2000 * | 2.8 | 7.6 -171% | 5.6 -100% | 7.8 -179% | 2.8 -0% | 15.4 -450% |
| Gamma | 2.06 107% | 2.334 94% | 2.306 95% | 2.28 96% | 2.08 106% | 1.97 112% |
| CCT | 6775 96% | 6546 99% | 7676 85% | 8102 80% | 6364 102% | 21134 31% |
| Color Space (Percent of AdobeRGB 1998) (%) | 62 | 59 | 41.6 | |||
| Color Space (Percent of sRGB) (%) | 97 | 93 | 65.5 | |||
| Total Average (Program / Settings) | -21% /
-44% | -22% /
-48% | -27% /
-61% | -34% /
-68% | -67% /
-147% |
* ... smaller is better
该面板在开箱时就已经被很好地校准了,因此,最终用户的校准就没有必要了。无论如何,我们自己校准面板会使平均灰度和彩色DeltaE值从2.8和1.99进一步下降到只有1.0和0.72。
Display Response Times
| ↔ Response Time Black to White | ||
|---|---|---|
| 42.4 ms ... rise ↗ and fall ↘ combined | ↗ 20.4 ms rise | 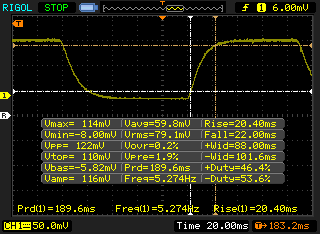 |
| ↘ 22 ms fall | ||
| The screen shows slow response rates in our tests and will be unsatisfactory for gamers. In comparison, all tested devices range from 0.1 (minimum) to 240 (maximum) ms. » 98 % of all devices are better. This means that the measured response time is worse than the average of all tested devices (19.9 ms). | ||
| ↔ Response Time 50% Grey to 80% Grey | ||
| 74.4 ms ... rise ↗ and fall ↘ combined | ↗ 37.6 ms rise | 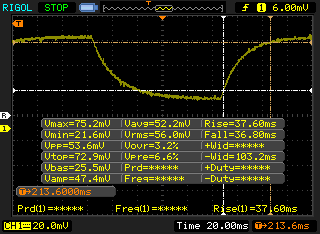 |
| ↘ 36.8 ms fall | ||
| The screen shows slow response rates in our tests and will be unsatisfactory for gamers. In comparison, all tested devices range from 0.165 (minimum) to 636 (maximum) ms. » 99 % of all devices are better. This means that the measured response time is worse than the average of all tested devices (31.1 ms). | ||
Screen Flickering / PWM (Pulse-Width Modulation)
| Screen flickering / PWM not detected | 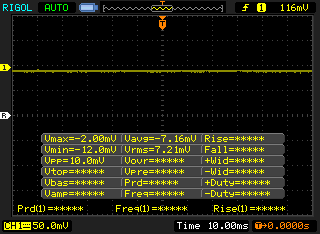 | ||
In comparison: 52 % of all tested devices do not use PWM to dim the display. If PWM was detected, an average of 7798 (minimum: 5 - maximum: 343500) Hz was measured. | |||
业绩
测试条件
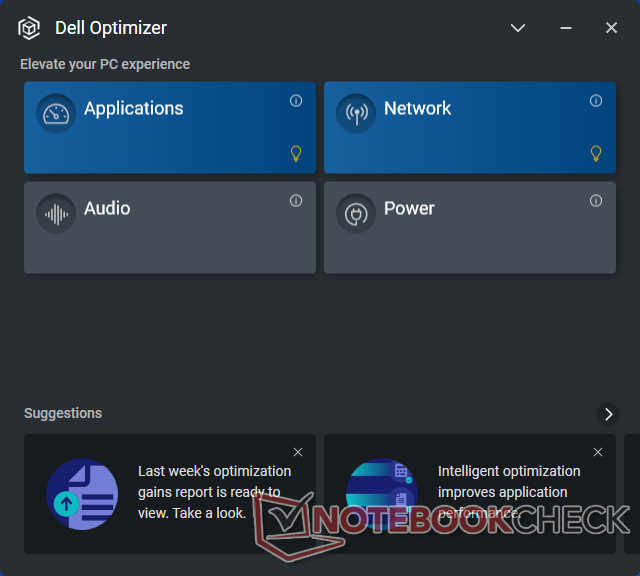
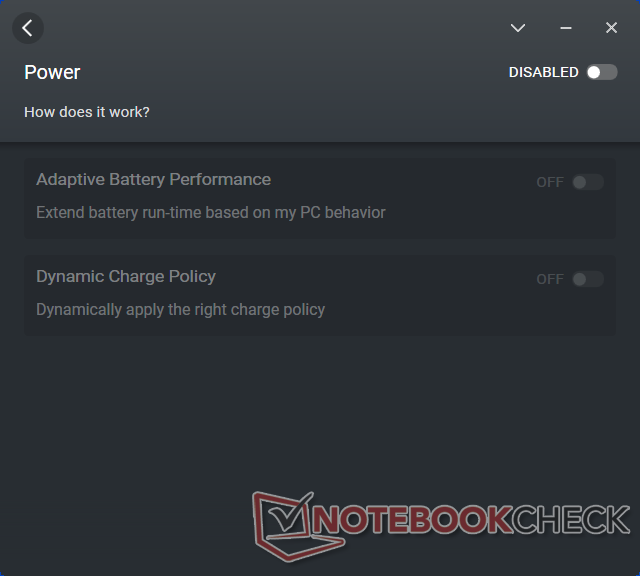
在运行以下任何基准测试之前,我们的设备分别通过Windows和戴尔电源管理器设置为性能模式和超性能模式。我们强烈建议用户熟悉预装的电源管理器和优化器应用程序,因为笔记本电脑的一些功能只能通过这些软件进行切换。

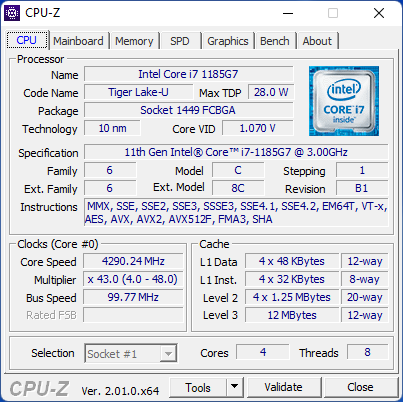
处理器
原始的CPU性能很好,其结果仅在平均水平的几个百分点之内。 酷睿i7-1185G7在我们的数据库中。性能的可持续性也很好,因为在循环运行CineBench R15 xT时,分数不会随时间推移而下降。
请记住,酷睿i7-1185G7的性能类似于价格较低的 酷睿i7-1165G7.如果vPro不重要,那么Core i7-1165G7可以提供基本相同的体验。
Cinebench R15 Multi Loop
Cinebench R20: CPU (Multi Core) | CPU (Single Core)
Cinebench R23: Multi Core | Single Core
Blender: v2.79 BMW27 CPU
7-Zip 18.03: 7z b 4 | 7z b 4 -mmt1
Geekbench 5.5: Multi-Core | Single-Core
HWBOT x265 Benchmark v2.2: 4k Preset
LibreOffice : 20 Documents To PDF
R Benchmark 2.5: Overall mean
| Cinebench R15 / CPU Multi 64Bit | |
| Average Intel Core i7-1185G7 (617 - 1066, n=32) | |
| Acer Enduro Urban N3 EUN314 | |
| Dell Latitude 7330 Rugged Extreme | |
| Panasonic Toughbook FZ-55 MK2 | |
| Lenovo ThinkPad P15s Gen1-20T4000JGE | |
| Getac B360 | |
| Durabook S14I | |
| Fujitsu LifeBook U7310 | |
| Dell Latitude 7424 Rugged Extreme | |
| Dell Latitude 5420 Rugged-P85G | |
| Cinebench R15 / CPU Single 64Bit | |
| Dell Latitude 7330 Rugged Extreme | |
| Panasonic Toughbook FZ-55 MK2 | |
| Average Intel Core i7-1185G7 (168 - 230, n=27) | |
| Acer Enduro Urban N3 EUN314 | |
| Durabook S14I | |
| Lenovo ThinkPad P15s Gen1-20T4000JGE | |
| Getac B360 | |
| Fujitsu LifeBook U7310 | |
| Dell Latitude 5420 Rugged-P85G | |
| Dell Latitude 7424 Rugged Extreme | |
| Cinebench R20 / CPU (Multi Core) | |
| Dell Latitude 7330 Rugged Extreme | |
| Panasonic Toughbook FZ-55 MK2 | |
| Average Intel Core i7-1185G7 (1425 - 2493, n=28) | |
| Acer Enduro Urban N3 EUN314 | |
| Lenovo ThinkPad P15s Gen1-20T4000JGE | |
| Getac B360 | |
| Durabook S14I | |
| Fujitsu LifeBook U7310 | |
| Cinebench R20 / CPU (Single Core) | |
| Dell Latitude 7330 Rugged Extreme | |
| Average Intel Core i7-1185G7 (489 - 593, n=28) | |
| Acer Enduro Urban N3 EUN314 | |
| Panasonic Toughbook FZ-55 MK2 | |
| Durabook S14I | |
| Lenovo ThinkPad P15s Gen1-20T4000JGE | |
| Getac B360 | |
| Fujitsu LifeBook U7310 | |
| Cinebench R23 / Multi Core | |
| Dell Latitude 7330 Rugged Extreme | |
| Average Intel Core i7-1185G7 (3610 - 6383, n=24) | |
| Panasonic Toughbook FZ-55 MK2 | |
| Acer Enduro Urban N3 EUN314 | |
| Getac B360 | |
| Durabook S14I | |
| Cinebench R23 / Single Core | |
| Dell Latitude 7330 Rugged Extreme | |
| Average Intel Core i7-1185G7 (1251 - 1532, n=24) | |
| Panasonic Toughbook FZ-55 MK2 | |
| Acer Enduro Urban N3 EUN314 | |
| Durabook S14I | |
| Getac B360 | |
| Blender / v2.79 BMW27 CPU | |
| Fujitsu LifeBook U7310 | |
| Durabook S14I | |
| Lenovo ThinkPad P15s Gen1-20T4000JGE | |
| Getac B360 | |
| Average Intel Core i7-1185G7 (478 - 745, n=28) | |
| Panasonic Toughbook FZ-55 MK2 | |
| Acer Enduro Urban N3 EUN314 | |
| Dell Latitude 7330 Rugged Extreme | |
| 7-Zip 18.03 / 7z b 4 | |
| Acer Enduro Urban N3 EUN314 | |
| Dell Latitude 7330 Rugged Extreme | |
| Panasonic Toughbook FZ-55 MK2 | |
| Average Intel Core i7-1185G7 (18812 - 27693, n=27) | |
| Getac B360 | |
| Lenovo ThinkPad P15s Gen1-20T4000JGE | |
| Durabook S14I | |
| Fujitsu LifeBook U7310 | |
| 7-Zip 18.03 / 7z b 4 -mmt1 | |
| Dell Latitude 7330 Rugged Extreme | |
| Acer Enduro Urban N3 EUN314 | |
| Panasonic Toughbook FZ-55 MK2 | |
| Durabook S14I | |
| Average Intel Core i7-1185G7 (3678 - 5507, n=27) | |
| Lenovo ThinkPad P15s Gen1-20T4000JGE | |
| Getac B360 | |
| Fujitsu LifeBook U7310 | |
| Geekbench 5.5 / Multi-Core | |
| Dell Latitude 7330 Rugged Extreme | |
| Average Intel Core i7-1185G7 (4620 - 5944, n=21) | |
| Acer Enduro Urban N3 EUN314 | |
| Getac B360 | |
| Lenovo ThinkPad P15s Gen1-20T4000JGE | |
| Durabook S14I | |
| Fujitsu LifeBook U7310 | |
| Geekbench 5.5 / Single-Core | |
| Dell Latitude 7330 Rugged Extreme | |
| Acer Enduro Urban N3 EUN314 | |
| Average Intel Core i7-1185G7 (1398 - 1626, n=21) | |
| Durabook S14I | |
| Getac B360 | |
| Lenovo ThinkPad P15s Gen1-20T4000JGE | |
| Fujitsu LifeBook U7310 | |
| HWBOT x265 Benchmark v2.2 / 4k Preset | |
| Dell Latitude 7330 Rugged Extreme | |
| Panasonic Toughbook FZ-55 MK2 | |
| Acer Enduro Urban N3 EUN314 | |
| Average Intel Core i7-1185G7 (5.02 - 8.13, n=27) | |
| Getac B360 | |
| Lenovo ThinkPad P15s Gen1-20T4000JGE | |
| Durabook S14I | |
| Fujitsu LifeBook U7310 | |
| LibreOffice / 20 Documents To PDF | |
| Lenovo ThinkPad P15s Gen1-20T4000JGE | |
| Acer Enduro Urban N3 EUN314 | |
| Fujitsu LifeBook U7310 | |
| Average Intel Core i7-1185G7 (41.3 - 61.7, n=26) | |
| Dell Latitude 7330 Rugged Extreme | |
| Panasonic Toughbook FZ-55 MK2 | |
| Durabook S14I | |
| R Benchmark 2.5 / Overall mean | |
| Fujitsu LifeBook U7310 | |
| Getac B360 | |
| Lenovo ThinkPad P15s Gen1-20T4000JGE | |
| Durabook S14I | |
| Average Intel Core i7-1185G7 (0.55 - 0.615, n=27) | |
| Acer Enduro Urban N3 EUN314 | |
| Panasonic Toughbook FZ-55 MK2 | |
| Dell Latitude 7330 Rugged Extreme | |
* ... smaller is better
AIDA64: FP32 Ray-Trace | FPU Julia | CPU SHA3 | CPU Queen | FPU SinJulia | FPU Mandel | CPU AES | CPU ZLib | FP64 Ray-Trace | CPU PhotoWorxx
| Performance rating | |
| Dell Latitude 7330 Rugged Extreme | |
| Acer Enduro Urban N3 EUN314 | |
| Average Intel Core i7-1185G7 | |
| Panasonic Toughbook FZ-55 MK2 | |
| Durabook S14I | |
| AIDA64 / FP32 Ray-Trace | |
| Dell Latitude 7330 Rugged Extreme | |
| Acer Enduro Urban N3 EUN314 | |
| Average Intel Core i7-1185G7 (5621 - 7453, n=20) | |
| Panasonic Toughbook FZ-55 MK2 | |
| Durabook S14I | |
| AIDA64 / FPU Julia | |
| Dell Latitude 7330 Rugged Extreme | |
| Acer Enduro Urban N3 EUN314 | |
| Panasonic Toughbook FZ-55 MK2 | |
| Average Intel Core i7-1185G7 (23248 - 32614, n=20) | |
| Durabook S14I | |
| AIDA64 / CPU SHA3 | |
| Dell Latitude 7330 Rugged Extreme | |
| Acer Enduro Urban N3 EUN314 | |
| Average Intel Core i7-1185G7 (1530 - 2209, n=20) | |
| Panasonic Toughbook FZ-55 MK2 | |
| Durabook S14I | |
| AIDA64 / CPU Queen | |
| Dell Latitude 7330 Rugged Extreme | |
| Acer Enduro Urban N3 EUN314 | |
| Durabook S14I | |
| Panasonic Toughbook FZ-55 MK2 | |
| Average Intel Core i7-1185G7 (44677 - 52815, n=20) | |
| AIDA64 / FPU SinJulia | |
| Dell Latitude 7330 Rugged Extreme | |
| Acer Enduro Urban N3 EUN314 | |
| Panasonic Toughbook FZ-55 MK2 | |
| Average Intel Core i7-1185G7 (3870 - 5027, n=20) | |
| Durabook S14I | |
| AIDA64 / FPU Mandel | |
| Dell Latitude 7330 Rugged Extreme | |
| Acer Enduro Urban N3 EUN314 | |
| Panasonic Toughbook FZ-55 MK2 | |
| Average Intel Core i7-1185G7 (14584 - 19594, n=20) | |
| Durabook S14I | |
| AIDA64 / CPU AES | |
| Dell Latitude 7330 Rugged Extreme | |
| Acer Enduro Urban N3 EUN314 | |
| Durabook S14I | |
| Average Intel Core i7-1185G7 (33002 - 76826, n=20) | |
| Panasonic Toughbook FZ-55 MK2 | |
| AIDA64 / CPU ZLib | |
| Dell Latitude 7330 Rugged Extreme | |
| Acer Enduro Urban N3 EUN314 | |
| Average Intel Core i7-1185G7 (258 - 412, n=22) | |
| Panasonic Toughbook FZ-55 MK2 | |
| Durabook S14I | |
| AIDA64 / FP64 Ray-Trace | |
| Dell Latitude 7330 Rugged Extreme | |
| Acer Enduro Urban N3 EUN314 | |
| Panasonic Toughbook FZ-55 MK2 | |
| Average Intel Core i7-1185G7 (2821 - 4094, n=20) | |
| Durabook S14I | |
| AIDA64 / CPU PhotoWorxx | |
| Dell Latitude 7330 Rugged Extreme | |
| Average Intel Core i7-1185G7 (22349 - 43701, n=20) | |
| Acer Enduro Urban N3 EUN314 | |
| Panasonic Toughbook FZ-55 MK2 | |
| Durabook S14I | |
系统性能
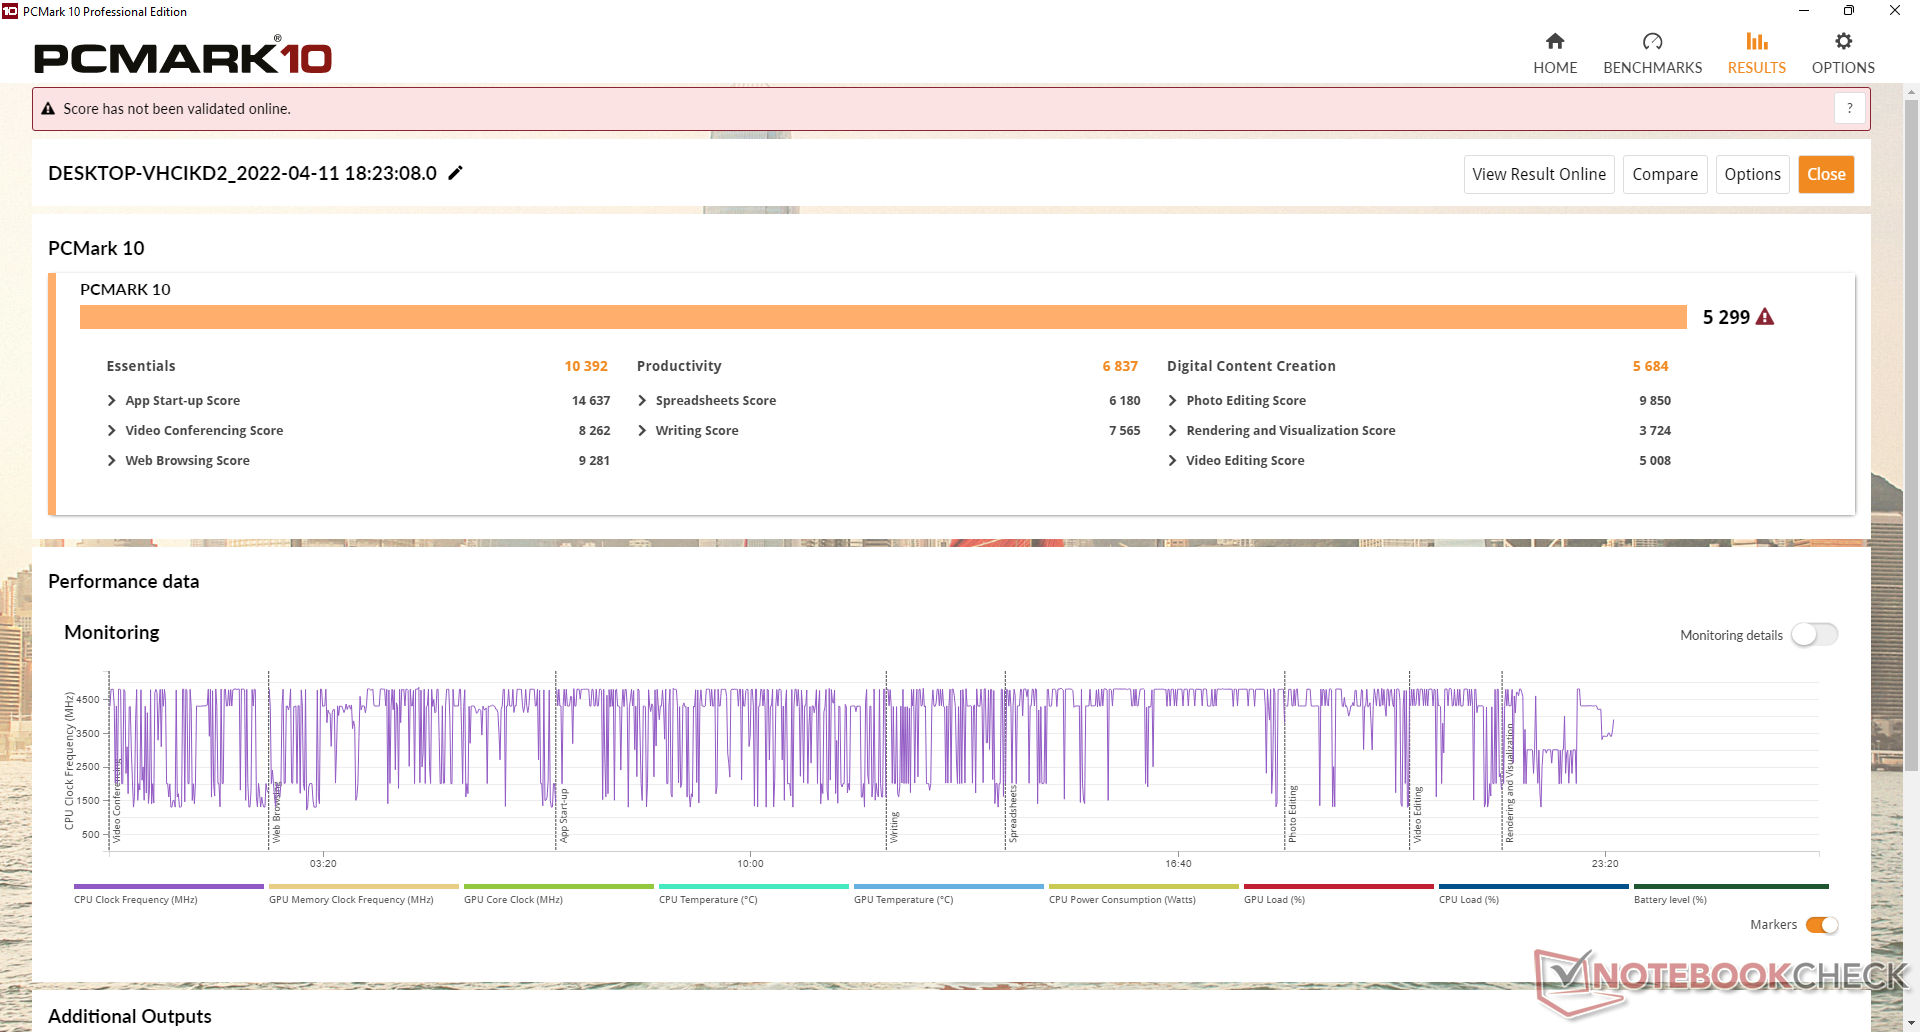
PCMark的结果一直高于松下Toughbook FZ-55 MK2,它配备的处理器与我们的戴尔设备相同。如果可能的话,建议配置双通道内存,否则图形性能会受到影响。
| PCMark 10 / Score | |
| Dell Latitude 7330 Rugged Extreme | |
| Panasonic Toughbook FZ-55 MK2 | |
| Durabook S14I | |
| Acer Enduro Urban N3 EUN314 | |
| Dell Latitude 7424 Rugged Extreme | |
| Dell Latitude 5420 Rugged-P85G | |
| PCMark 10 / Essentials | |
| Dell Latitude 7330 Rugged Extreme | |
| Panasonic Toughbook FZ-55 MK2 | |
| Durabook S14I | |
| Acer Enduro Urban N3 EUN314 | |
| Dell Latitude 7424 Rugged Extreme | |
| Dell Latitude 5420 Rugged-P85G | |
| PCMark 10 / Productivity | |
| Dell Latitude 7424 Rugged Extreme | |
| Dell Latitude 5420 Rugged-P85G | |
| Durabook S14I | |
| Dell Latitude 7330 Rugged Extreme | |
| Panasonic Toughbook FZ-55 MK2 | |
| Acer Enduro Urban N3 EUN314 | |
| PCMark 10 / Digital Content Creation | |
| Dell Latitude 7330 Rugged Extreme | |
| Panasonic Toughbook FZ-55 MK2 | |
| Acer Enduro Urban N3 EUN314 | |
| Durabook S14I | |
| Dell Latitude 5420 Rugged-P85G | |
| Dell Latitude 7424 Rugged Extreme | |
| PCMark 10 Score | 5299 points | |
Help | ||
| AIDA64 / Memory Copy | |
| Dell Latitude 7330 Rugged Extreme | |
| Average Intel Core i7-1185G7 (36515 - 68450, n=20) | |
| Acer Enduro Urban N3 EUN314 | |
| Panasonic Toughbook FZ-55 MK2 | |
| Durabook S14I | |
| AIDA64 / Memory Read | |
| Dell Latitude 7330 Rugged Extreme | |
| Average Intel Core i7-1185G7 (38394 - 64291, n=20) | |
| Acer Enduro Urban N3 EUN314 | |
| Panasonic Toughbook FZ-55 MK2 | |
| Durabook S14I | |
| AIDA64 / Memory Write | |
| Dell Latitude 7330 Rugged Extreme | |
| Average Intel Core i7-1185G7 (37684 - 66873, n=20) | |
| Acer Enduro Urban N3 EUN314 | |
| Panasonic Toughbook FZ-55 MK2 | |
| Durabook S14I | |
| AIDA64 / Memory Latency | |
| Dell Latitude 7330 Rugged Extreme | |
| Average Intel Core i7-1185G7 (78.3 - 117, n=22) | |
| Acer Enduro Urban N3 EUN314 | |
| Panasonic Toughbook FZ-55 MK2 | |
| Durabook S14I | |
* ... smaller is better
DPC延时
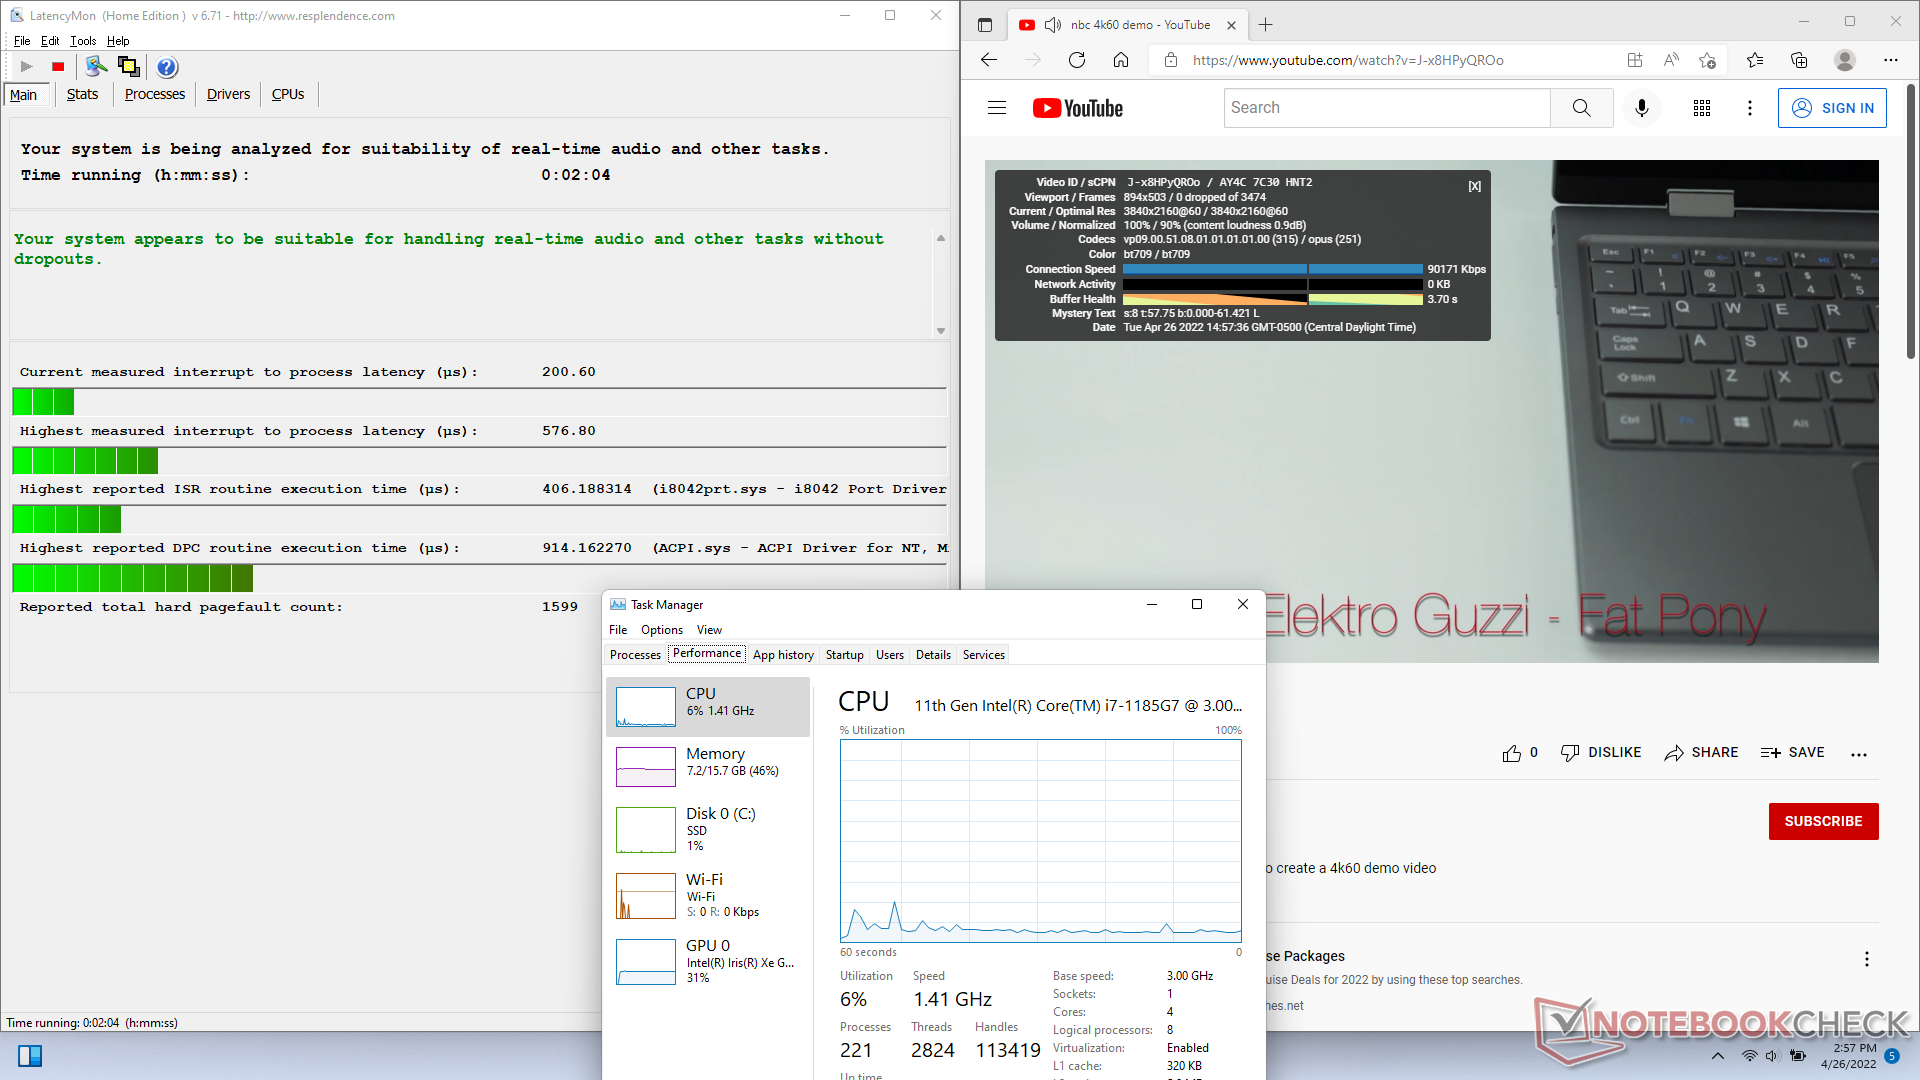
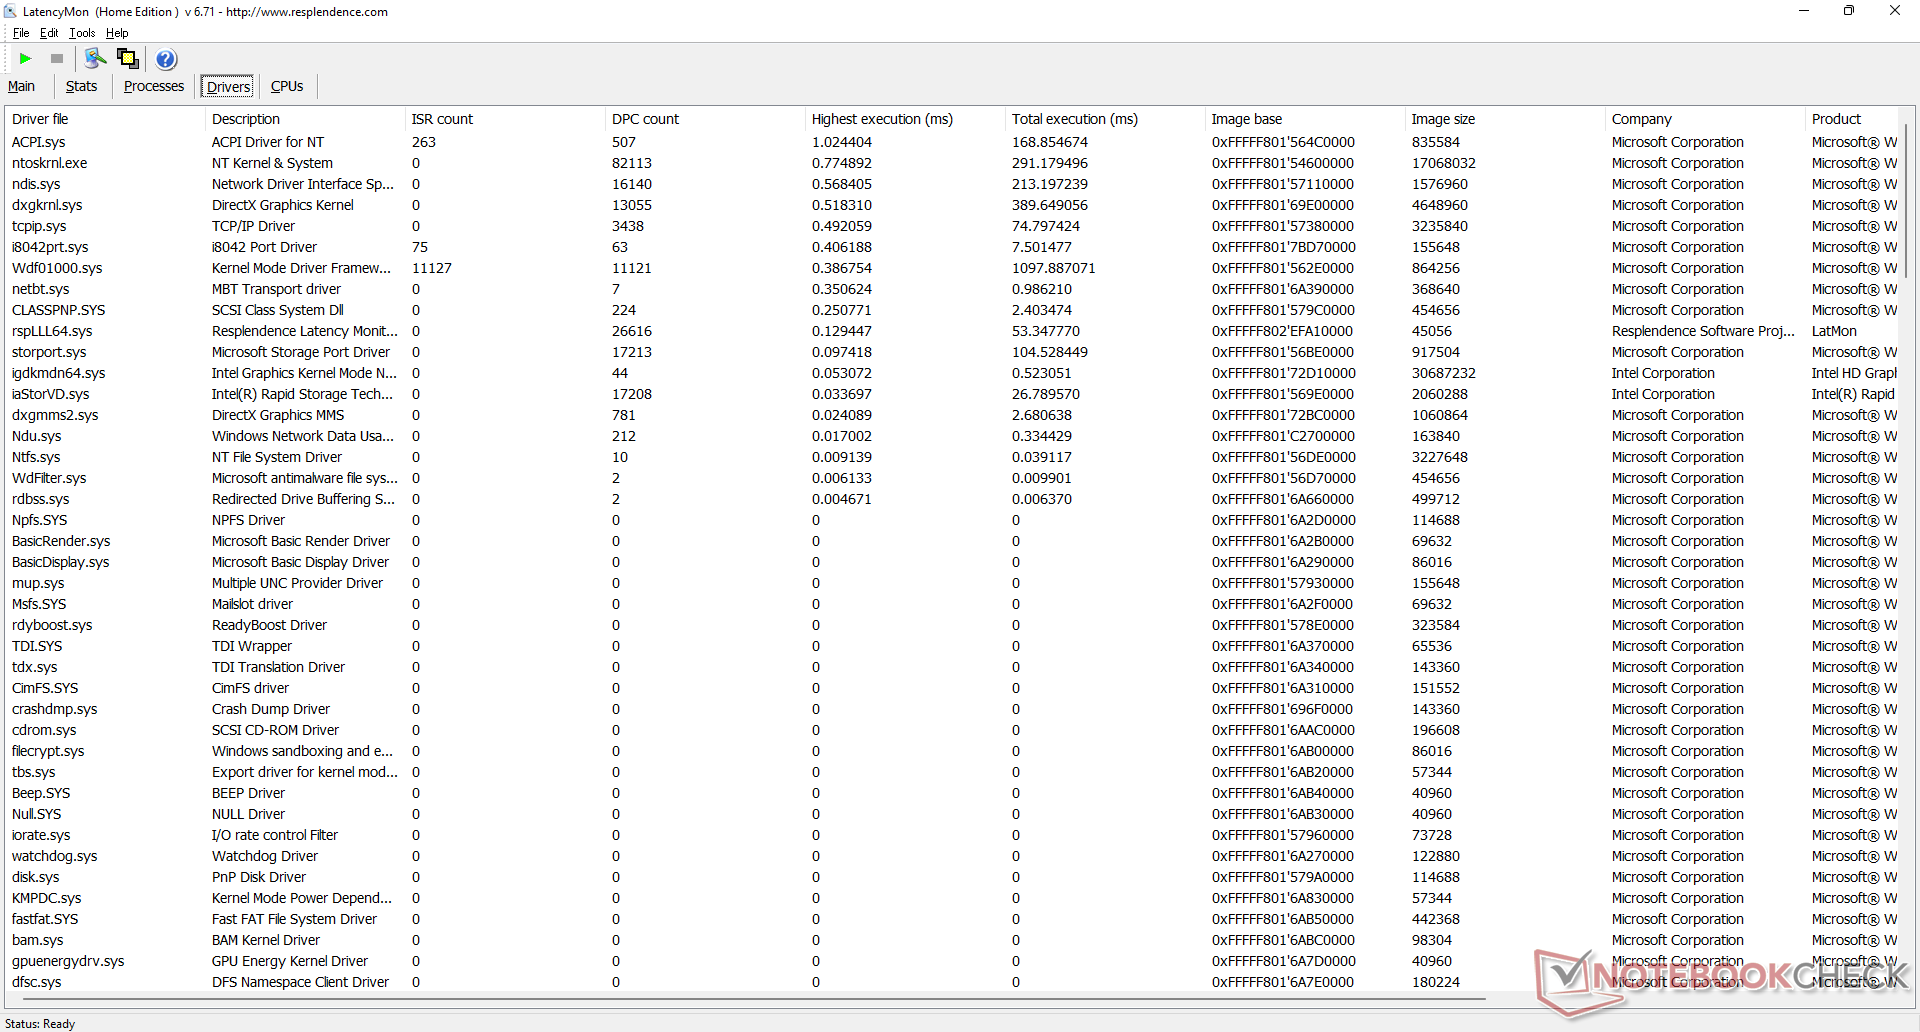
LatencyMon显示,在打开我们的主页的多个标签时没有延迟问题。在60FPS下的4K视频播放也很流畅,没有记录的掉帧。
| DPC Latencies / LatencyMon - interrupt to process latency (max), Web, Youtube, Prime95 | |
| Acer Enduro Urban N3 EUN314 | |
| Panasonic Toughbook FZ-55 MK2 | |
| Durabook S14I | |
| Dell Latitude 7330 Rugged Extreme | |
* ... smaller is better
存储设备
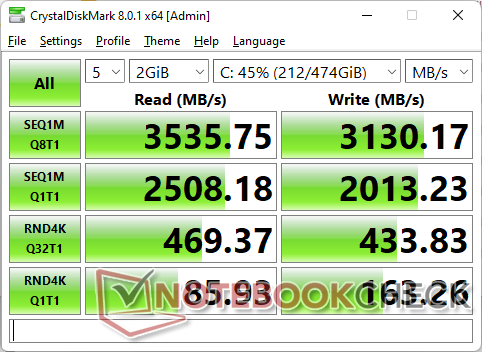
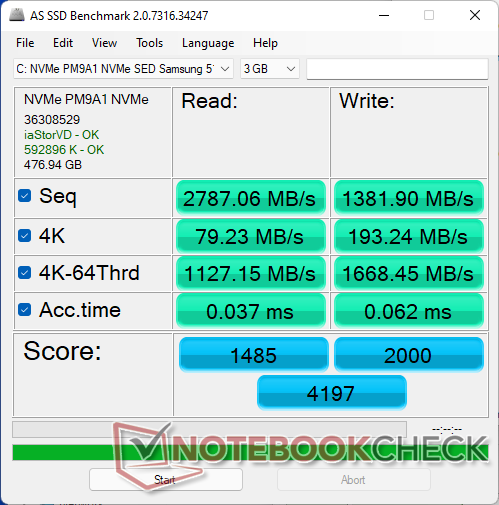
该系统仅支持一个内部M.2 2280驱动器,而Getac B360上的多个驱动器无需任何工具即可快速更换。我们的特定测试单元配备了一个 三星PM9A1 SED NVMe SSD但也有标准的非自加密的选项。虽然原始传输率没有标准的非SED消费者驱动器那么快,但性能非常好,没有性能节流。

| Drive Performance rating - Percent | |
| Dell Latitude 7330 Rugged Extreme | |
| Acer Enduro Urban N3 EUN314 | |
| Durabook S14I | |
| Dell Latitude 5420 Rugged-P85G -8! | |
| Dell Latitude 7424 Rugged Extreme -8! | |
| Panasonic Toughbook FZ-55 MK2 | |
* ... smaller is better
Disk Throttling: DiskSpd Read Loop, Queue Depth 8
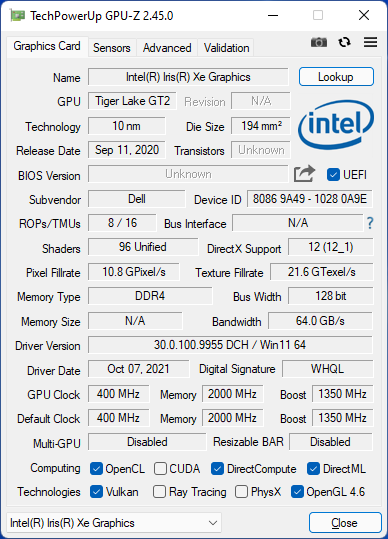
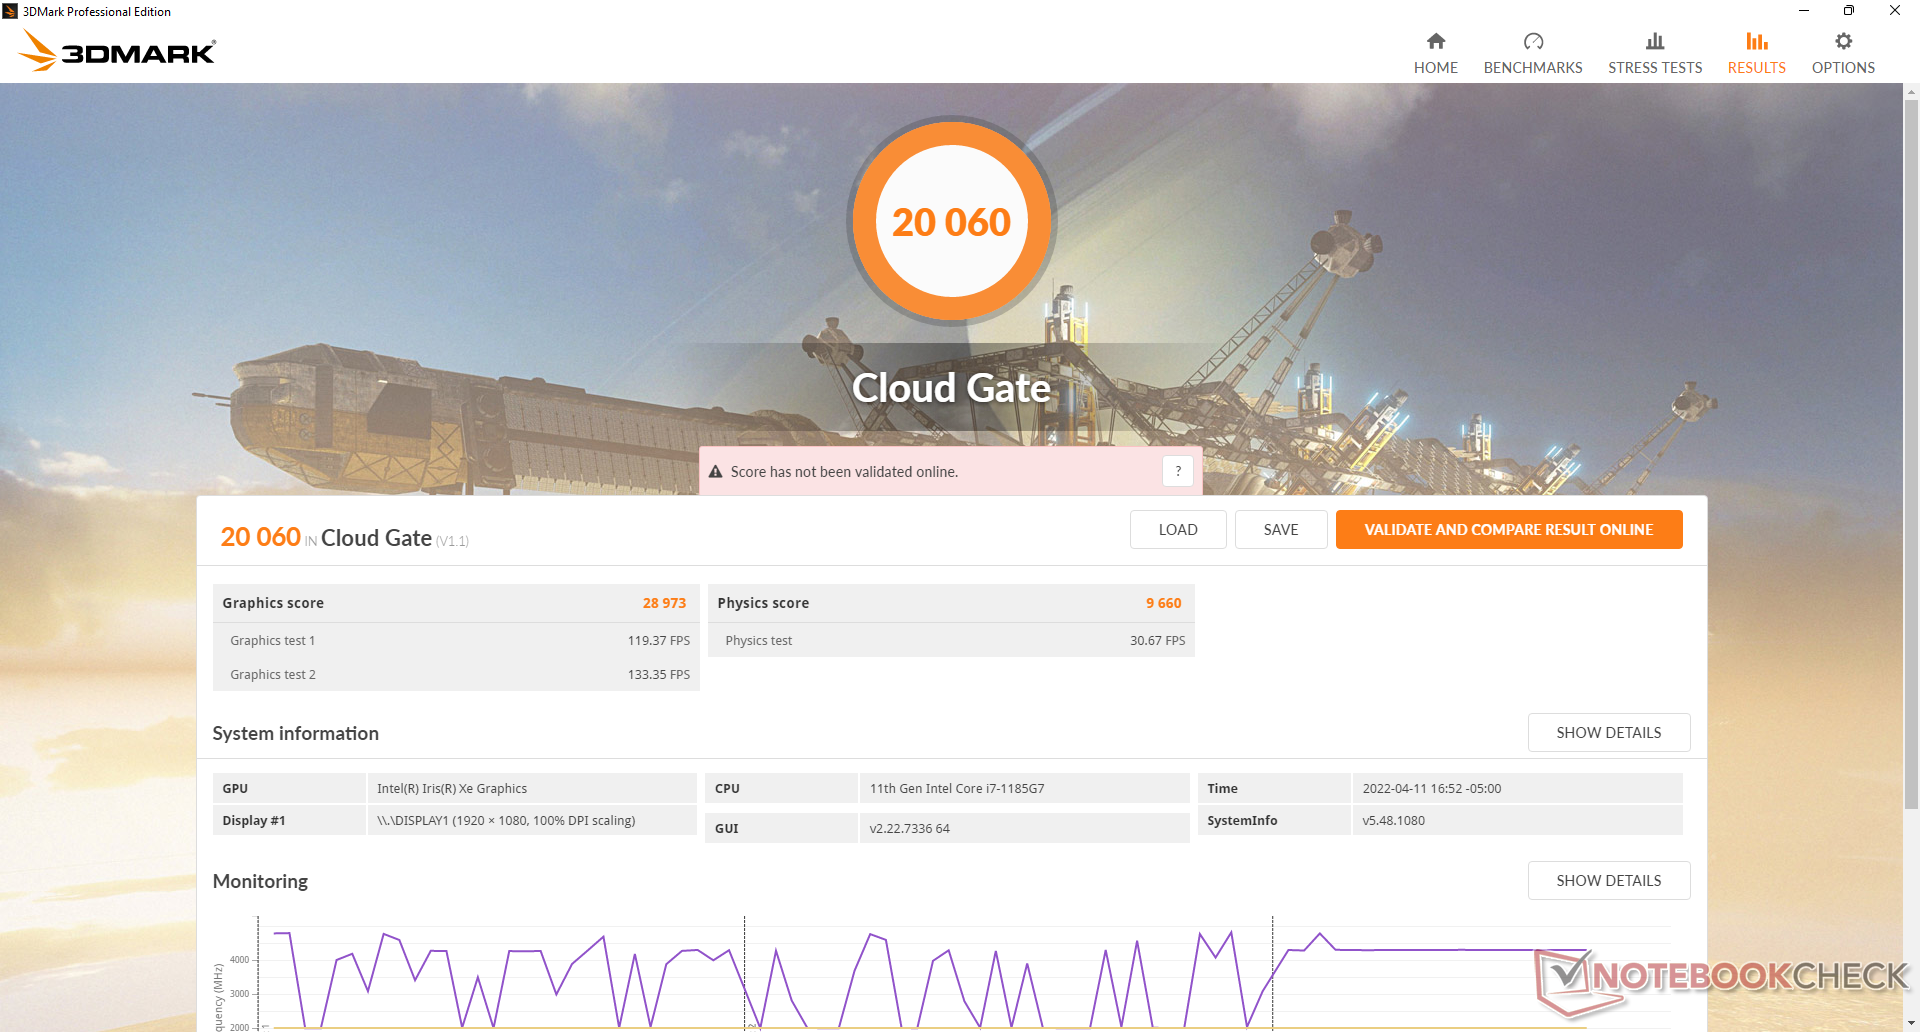
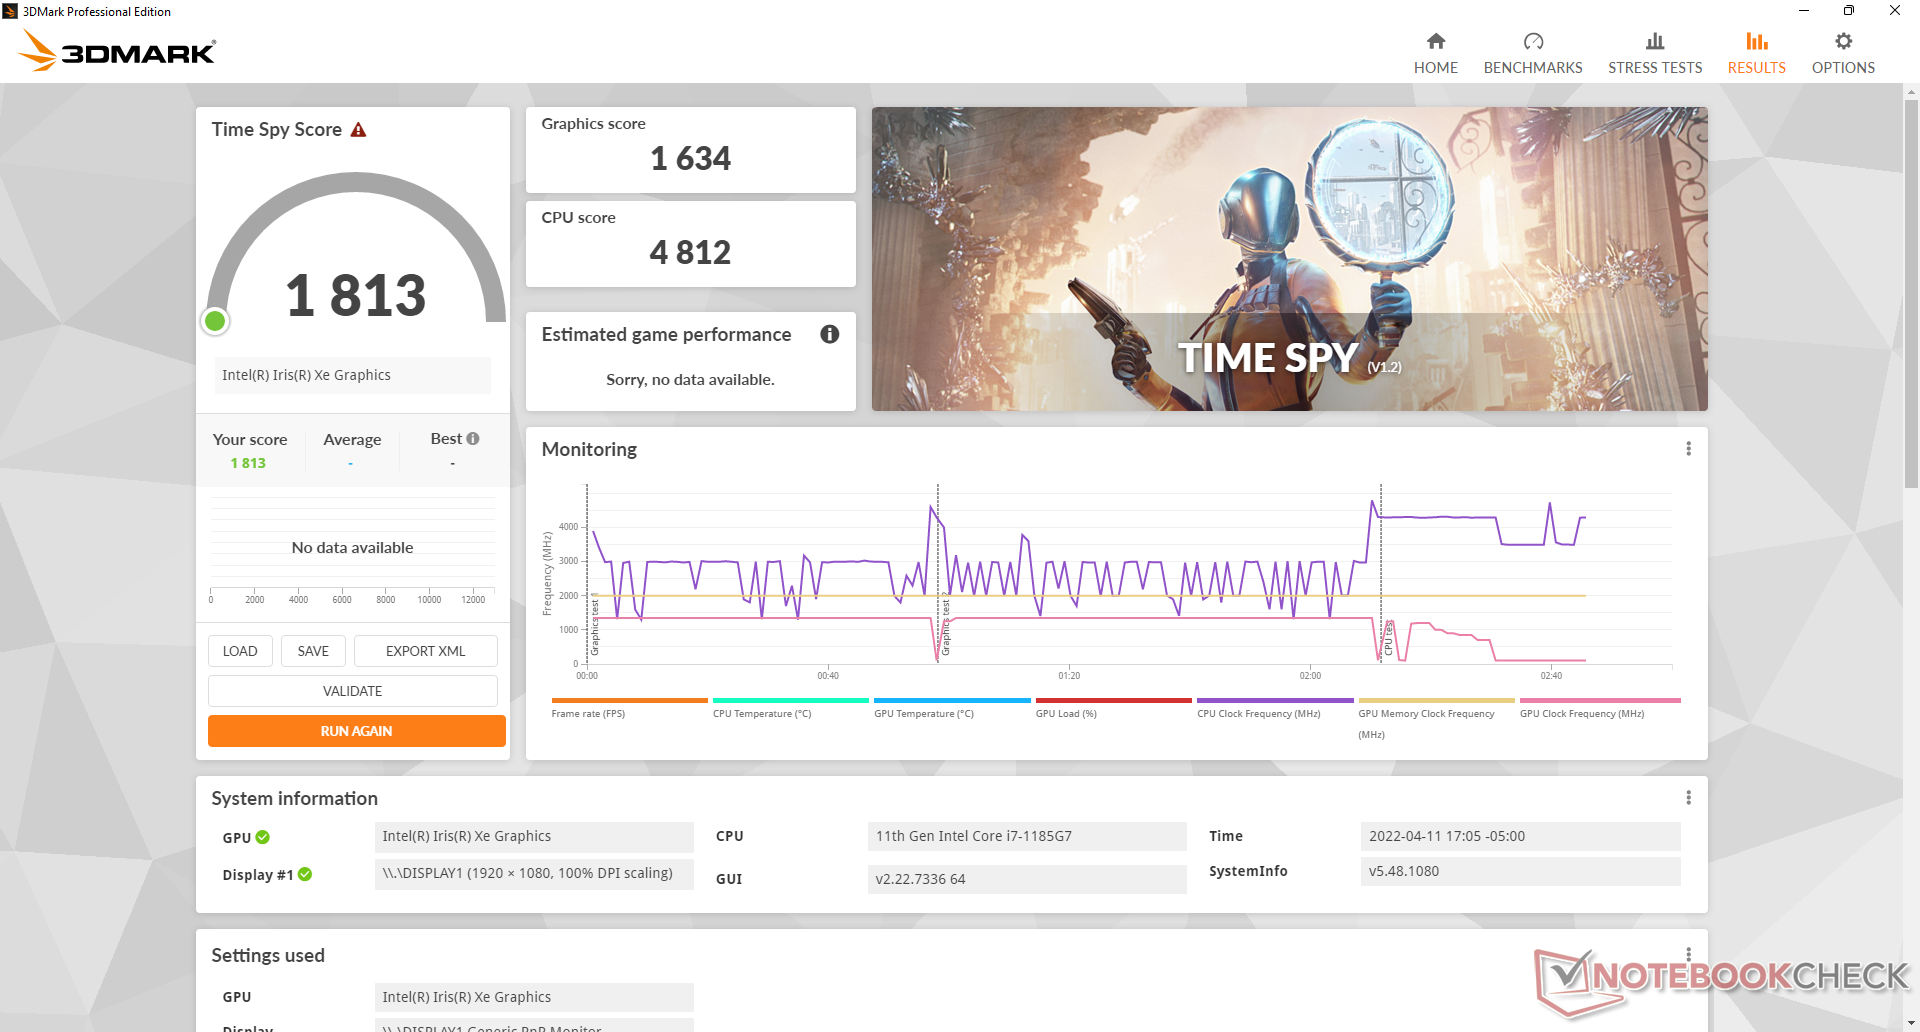
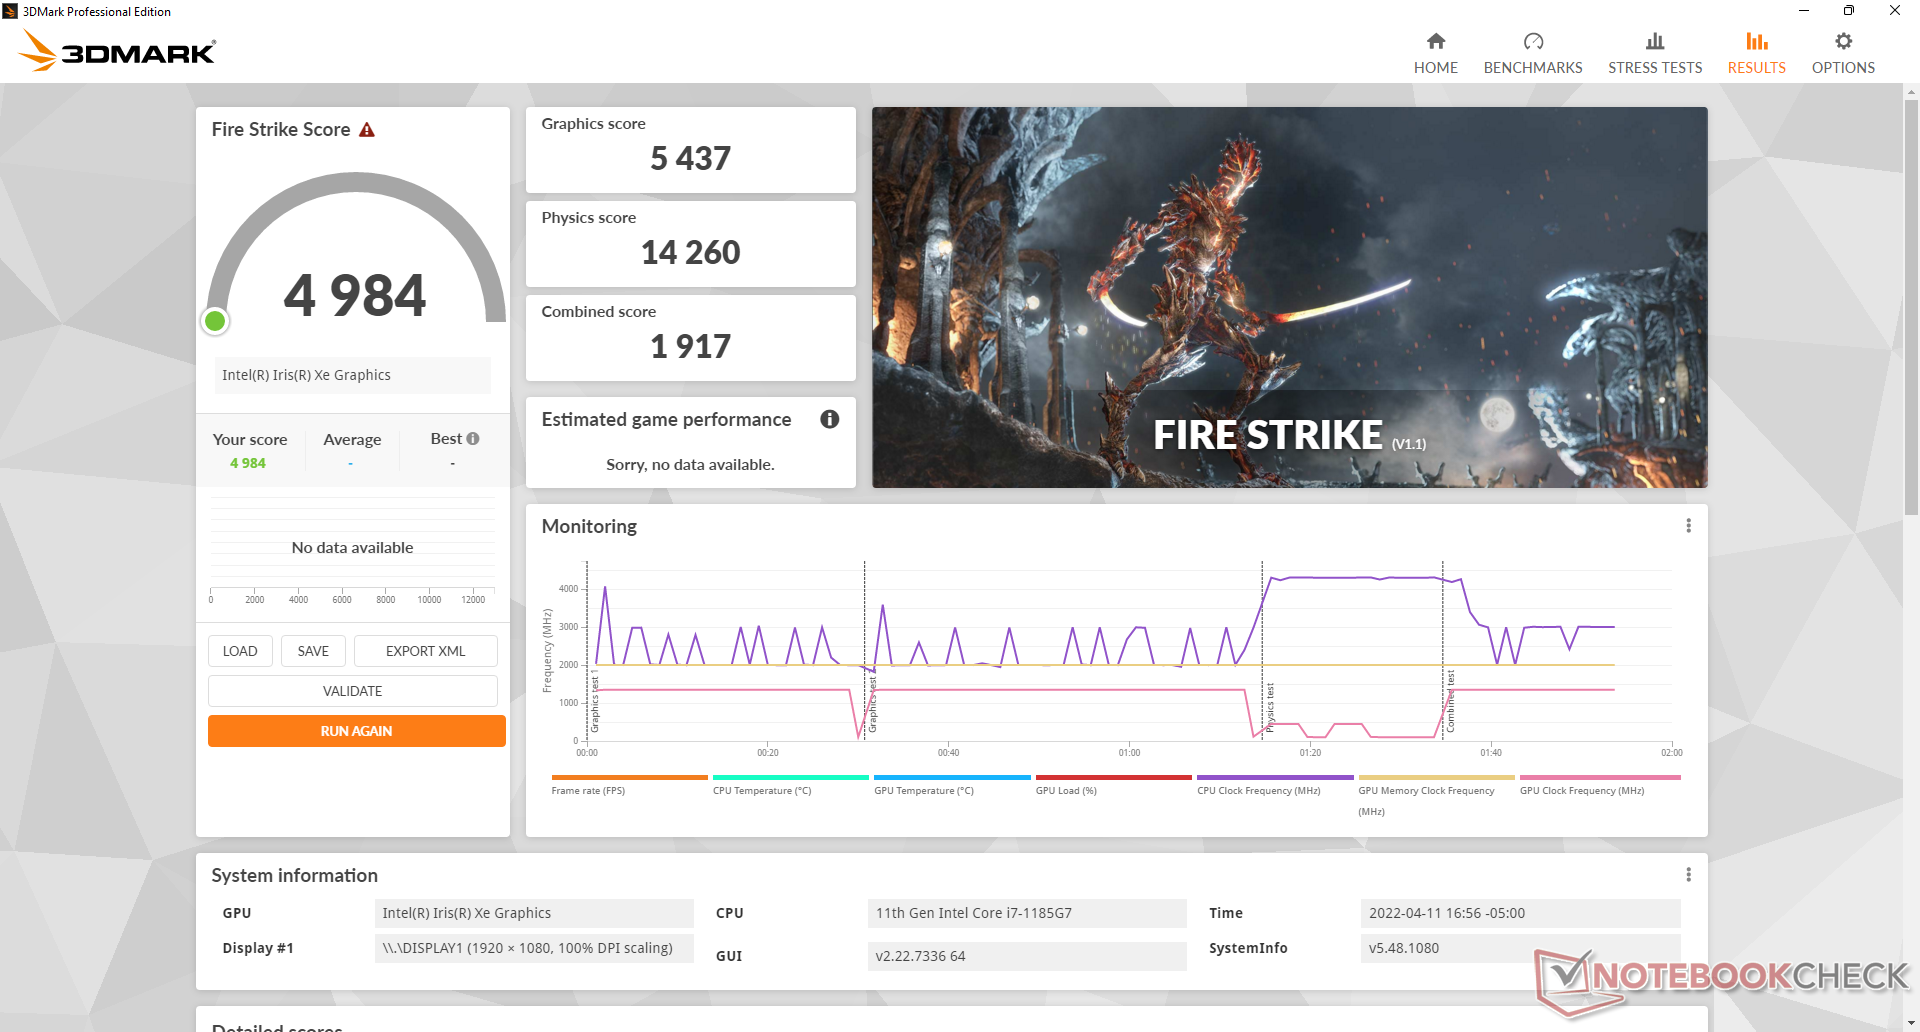
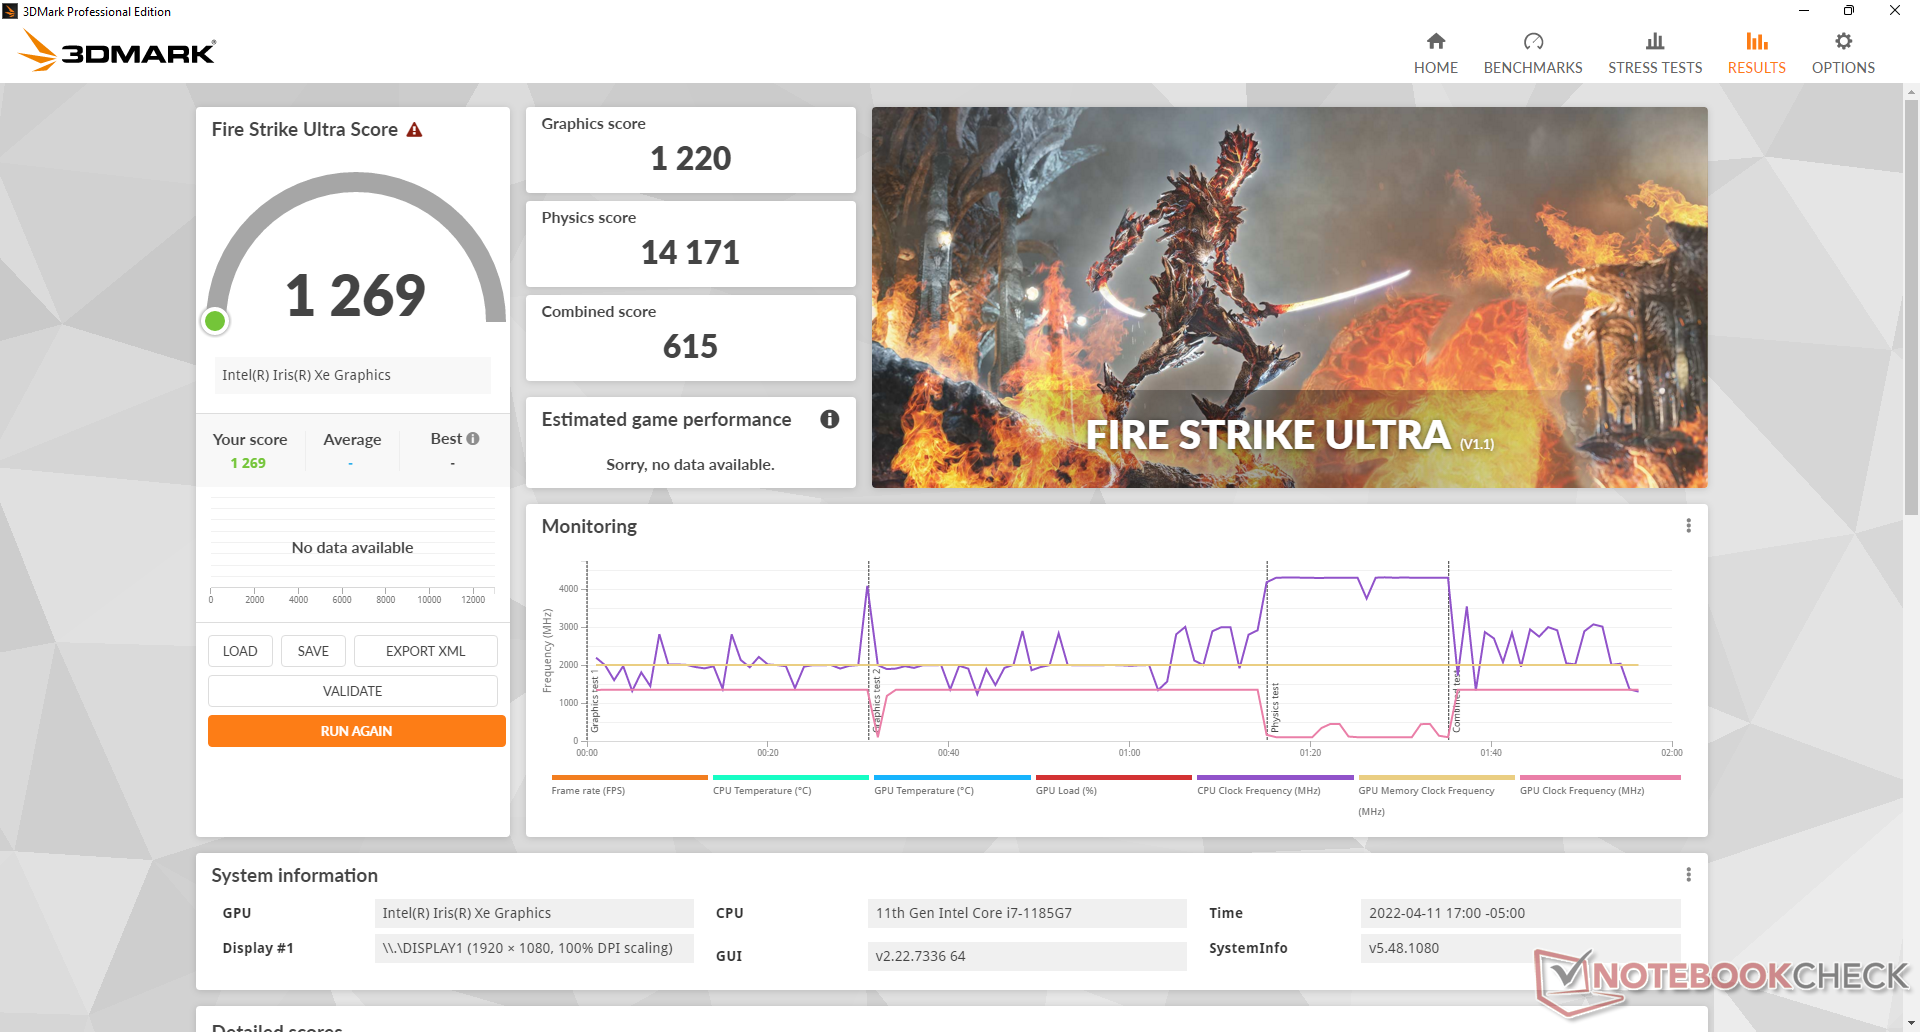
GPU性能
图形性能非常好,比我们数据库中配备同样集成的笔记本电脑快约10%至15%。 Iris Xe 96 EUsGPU。性能甚至一直比一些旧的独立GPU如Radeon RX 540快。
| 3DMark | |
| 1280x720 Cloud Gate Standard Graphics | |
| Dell Latitude 7330 Rugged Extreme | |
| Panasonic Toughbook FZ-55 MK2 | |
| Average Intel Iris Xe Graphics G7 96EUs (13162 - 39880, n=187) | |
| Acer Enduro Urban N3 EUN314 | |
| Dell Latitude 7424 Rugged Extreme | |
| Dell Latitude 5420 Rugged-P85G | |
| Durabook S14I | |
| 1920x1080 Fire Strike Graphics | |
| Dell Latitude 7330 Rugged Extreme | |
| Average Intel Iris Xe Graphics G7 96EUs (2286 - 6624, n=222) | |
| Acer Enduro Urban N3 EUN314 | |
| Panasonic Toughbook FZ-55 MK2 | |
| Dell Latitude 7424 Rugged Extreme | |
| Dell Latitude 5420 Rugged-P85G | |
| Durabook S14I | |
| 2560x1440 Time Spy Graphics | |
| Dell Latitude 7330 Rugged Extreme | |
| Acer Enduro Urban N3 EUN314 | |
| Average Intel Iris Xe Graphics G7 96EUs (707 - 1890, n=218) | |
| Panasonic Toughbook FZ-55 MK2 | |
| Durabook S14I | |
| Dell Latitude 5420 Rugged-P85G | |
| 2560x1440 Time Spy Score | |
| Dell Latitude 7330 Rugged Extreme | |
| Acer Enduro Urban N3 EUN314 | |
| Average Intel Iris Xe Graphics G7 96EUs (789 - 2159, n=215) | |
| Panasonic Toughbook FZ-55 MK2 | |
| Durabook S14I | |
| Dell Latitude 5420 Rugged-P85G | |
| 3DMark 11 - 1280x720 Performance GPU | |
| Acer Enduro Urban N3 EUN314 | |
| Dell Latitude 7330 Rugged Extreme | |
| Panasonic Toughbook FZ-55 MK2 | |
| Average Intel Iris Xe Graphics G7 96EUs (2867 - 7676, n=209) | |
| Durabook S14I | |
| Dell Latitude 5420 Rugged-P85G | |
| Dell Latitude 7424 Rugged Extreme | |
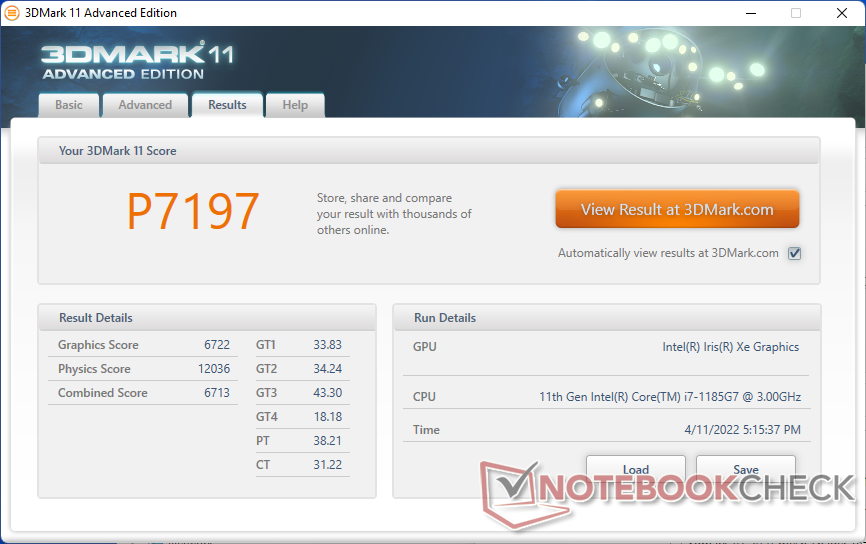
| 3DMark 11 Performance | 7197 points | |
| 3DMark Cloud Gate Standard Score | 20060 points | |
| 3DMark Fire Strike Score | 4984 points | |
| 3DMark Time Spy Score | 1813 points | |
Help | ||
| X-Plane 11.11 | |
| 1280x720 low (fps_test=1) | |
| Lenovo ThinkPad P15s Gen1-20T4000JGE | |
| Average Intel Iris Xe Graphics G7 96EUs (13.4 - 88.4, n=213) | |
| Durabook S14I | |
| Dell Latitude 7330 Rugged Extreme | |
| Panasonic Toughbook FZ-55 MK2 | |
| Acer Enduro Urban N3 EUN314 | |
| Fujitsu LifeBook U7310 | |
| Getac B360 | |
| 1920x1080 med (fps_test=2) | |
| Acer Enduro Urban N3 EUN314 | |
| Average Intel Iris Xe Graphics G7 96EUs (11.6 - 69.5, n=214) | |
| Durabook S14I | |
| Dell Latitude 7330 Rugged Extreme | |
| Panasonic Toughbook FZ-55 MK2 | |
| Lenovo ThinkPad P15s Gen1-20T4000JGE | |
| Getac B360 | |
| Fujitsu LifeBook U7310 | |
| 1920x1080 high (fps_test=3) | |
| Acer Enduro Urban N3 EUN314 | |
| Average Intel Iris Xe Graphics G7 96EUs (11.1 - 59.8, n=213) | |
| Durabook S14I | |
| Panasonic Toughbook FZ-55 MK2 | |
| Dell Latitude 7330 Rugged Extreme | |
| Lenovo ThinkPad P15s Gen1-20T4000JGE | |
| Getac B360 | |
| Fujitsu LifeBook U7310 | |
| Final Fantasy XV Benchmark | |
| 1280x720 Lite Quality | |
| Dell Latitude 7330 Rugged Extreme | |
| Panasonic Toughbook FZ-55 MK2 | |
| Acer Enduro Urban N3 EUN314 | |
| Average Intel Iris Xe Graphics G7 96EUs (14.9 - 56.5, n=189) | |
| Durabook S14I | |
| Getac B360 | |
| Dell Latitude 5420 Rugged-P85G | |
| 1920x1080 Standard Quality | |
| Dell Latitude 7330 Rugged Extreme | |
| Acer Enduro Urban N3 EUN314 | |
| Panasonic Toughbook FZ-55 MK2 | |
| Average Intel Iris Xe Graphics G7 96EUs (10.5 - 31.2, n=185) | |
| Durabook S14I | |
| Getac B360 | |
| Dell Latitude 5420 Rugged-P85G | |
| 1920x1080 High Quality | |
| Dell Latitude 7330 Rugged Extreme | |
| Average Intel Iris Xe Graphics G7 96EUs (8.15 - 27.8, n=178) | |
| Acer Enduro Urban N3 EUN314 | |
| Panasonic Toughbook FZ-55 MK2 | |
| Durabook S14I | |
| Getac B360 | |
| Dell Latitude 5420 Rugged-P85G | |
Witcher 3 FPS Chart
| low | med. | high | ultra | |
|---|---|---|---|---|
| The Witcher 3 (2015) | 99.3 | 65.3 | 34.3 | 15.8 |
| Dota 2 Reborn (2015) | 115.6 | 108.5 | 65 | 57.3 |
| Final Fantasy XV Benchmark (2018) | 46.8 | 26.2 | 26.2 | |
| X-Plane 11.11 (2018) | 27.5 | 25.3 | 22 |
排放
系统噪音
由于该模型使用的是与戴尔XPS 13等更薄的消费类笔记本电脑相同的U系列CPU,所以风扇噪音很低。在运行Prime95时,我们能够记录到最大只有36 dB(A),比许多其他耐用的替代品更安静。
Noise level
| Idle |
| 23.1 / 23.1 / 23.1 dB(A) |
| Load |
| 28 / 36.2 dB(A) |
 | ||
30 dB silent 40 dB(A) audible 50 dB(A) loud |
||
min: | ||
| Dell Latitude 7330 Rugged Extreme Iris Xe G7 96EUs, i7-1185G7 | Dell Latitude 7424 Rugged Extreme Radeon RX 540, i7-8650U, SK Hynix PC401 512GB M.2 (HFS512GD9TNG) | Dell Latitude 5420 Rugged-P85G Radeon RX 540, i7-8650U, SK hynix PC401 NVMe 500 GB | Acer Enduro Urban N3 EUN314 Iris Xe G7 96EUs, i7-1165G7, Samsung PM991 MZVLQ1T0HALB | Panasonic Toughbook FZ-55 MK2 Iris Xe G7 96EUs, i7-1185G7, Toshiba KIOXIA KBG4AZNV512G M.2 2280 OPAL | Durabook S14I Iris Xe G7 96EUs, i7-1165G7, UDinfo M2P M2P80DE512GBAEP | |
|---|---|---|---|---|---|---|
| Noise | -21% | -18% | -5% | -4% | -17% | |
| off / environment * (dB) | 22.9 | 28.6 -25% | 28.3 -24% | 23.8 -4% | 23.8 -4% | 25.2 -10% |
| Idle Minimum * (dB) | 23.1 | 28.6 -24% | 28.3 -23% | 24.1 -4% | 24 -4% | 25.2 -9% |
| Idle Average * (dB) | 23.1 | 28.6 -24% | 28.3 -23% | 24.1 -4% | 24 -4% | 25.2 -9% |
| Idle Maximum * (dB) | 23.1 | 28.6 -24% | 28.3 -23% | 24.1 -4% | 24 -4% | 34.5 -49% |
| Load Average * (dB) | 28 | 32.9 -18% | 29.9 -7% | 27.9 -0% | 26.7 5% | 34.5 -23% |
| Witcher 3 ultra * (dB) | 31.2 | 35.7 -14% | ||||
| Load Maximum * (dB) | 36.2 | 39 -8% | 38 -5% | 38.6 -7% | 41.7 -15% | 36.2 -0% |
* ... smaller is better
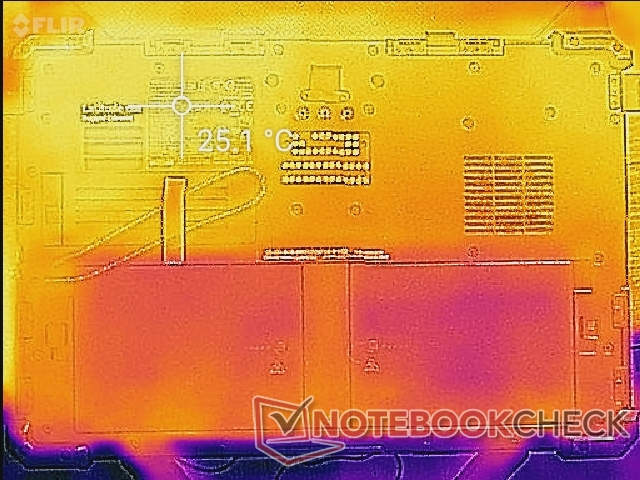
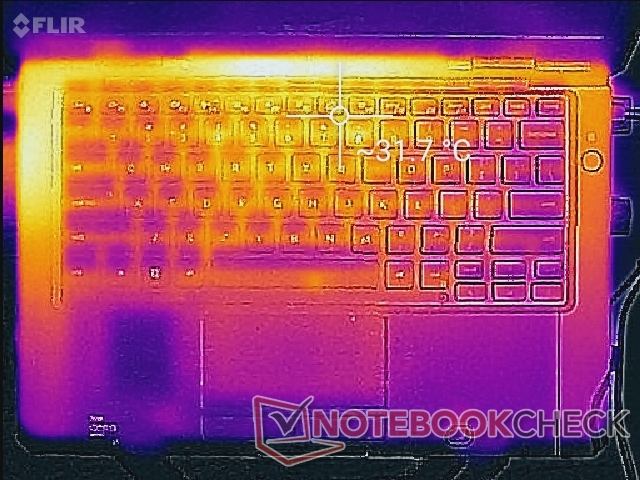
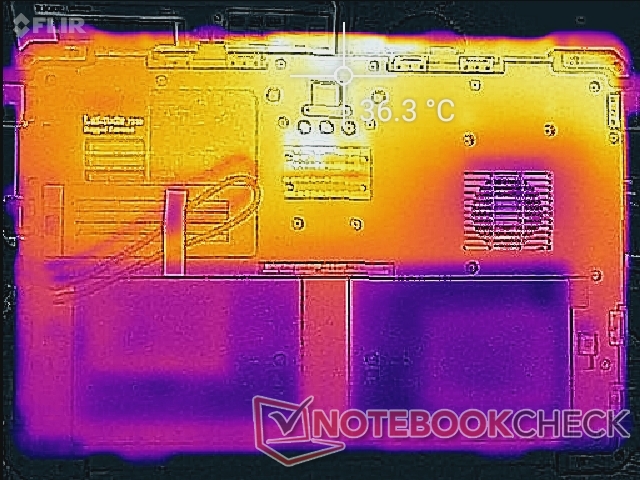
温度
表面温度绝不会令人不舒服,因为你的ULV U系列CPU的机箱比一般的大。我们能够记录到顶部和底部表面的热点分别只有31℃和36℃,而宏碁Enduro Urban N3的热点为37℃和46℃。
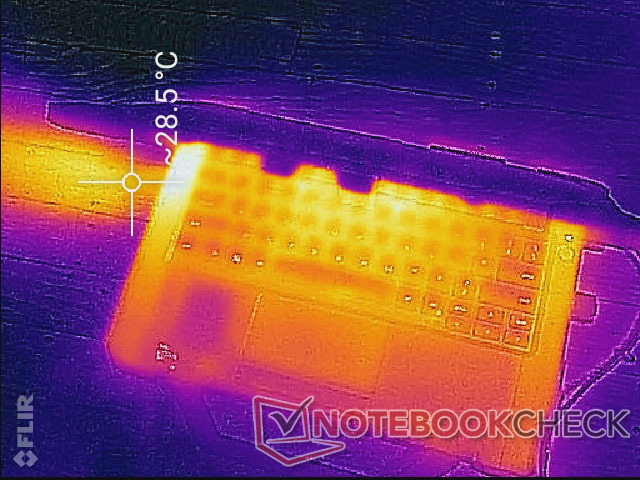
(+) The maximum temperature on the upper side is 34.6 °C / 94 F, compared to the average of 36.9 °C / 98 F, ranging from 24.7 to 57 °C for the class .
(+) The bottom heats up to a maximum of 36.6 °C / 98 F, compared to the average of 38.5 °C / 101 F
(+) In idle usage, the average temperature for the upper side is 24.3 °C / 76 F, compared to the device average of 31.9 °C / 89 F.
(+) The palmrests and touchpad are cooler than skin temperature with a maximum of 26 °C / 78.8 F and are therefore cool to the touch.
(+) The average temperature of the palmrest area of similar devices was 29.6 °C / 85.3 F (+3.6 °C / 6.5 F).
| Dell Latitude 7330 Rugged Extreme Intel Core i7-1185G7, Intel Iris Xe Graphics G7 96EUs | Dell Latitude 7424 Rugged Extreme Intel Core i7-8650U, AMD Radeon RX 540 | Dell Latitude 5420 Rugged-P85G Intel Core i7-8650U, AMD Radeon RX 540 | Acer Enduro Urban N3 EUN314 Intel Core i7-1165G7, Intel Iris Xe Graphics G7 96EUs | Panasonic Toughbook FZ-55 MK2 Intel Core i7-1185G7, Intel Iris Xe Graphics G7 96EUs | Durabook S14I Intel Core i7-1165G7, Intel Iris Xe Graphics G7 96EUs | |
|---|---|---|---|---|---|---|
| Heat | -21% | -23% | -15% | -20% | -19% | |
| Maximum Upper Side * (°C) | 34.6 | 41.6 -20% | 42.2 -22% | 37.8 -9% | 36.2 -5% | 36.4 -5% |
| Maximum Bottom * (°C) | 36.6 | 47.6 -30% | 42 -15% | 45.8 -25% | 42.2 -15% | 38.6 -5% |
| Idle Upper Side * (°C) | 24.8 | 28.6 -15% | 31.6 -27% | 26.4 -6% | 31 -25% | 32.6 -31% |
| Idle Bottom * (°C) | 25.2 | 30.2 -20% | 31.8 -26% | 30.2 -20% | 34 -35% | 33.8 -34% |
* ... smaller is better
压力测试
在Prime95压力下,CPU会在几秒钟内提升到3.7GHz,核心温度为100C。然后时钟频率会迅速下降并稳定在2.8GHz,以保持68C的较低核心温度。
不幸的是,用电池供电运行限制了性能。在电池上进行3DMark 11测试,物理和图形分数分别为8010和3501分,而在主电源上则为12036和6722分。
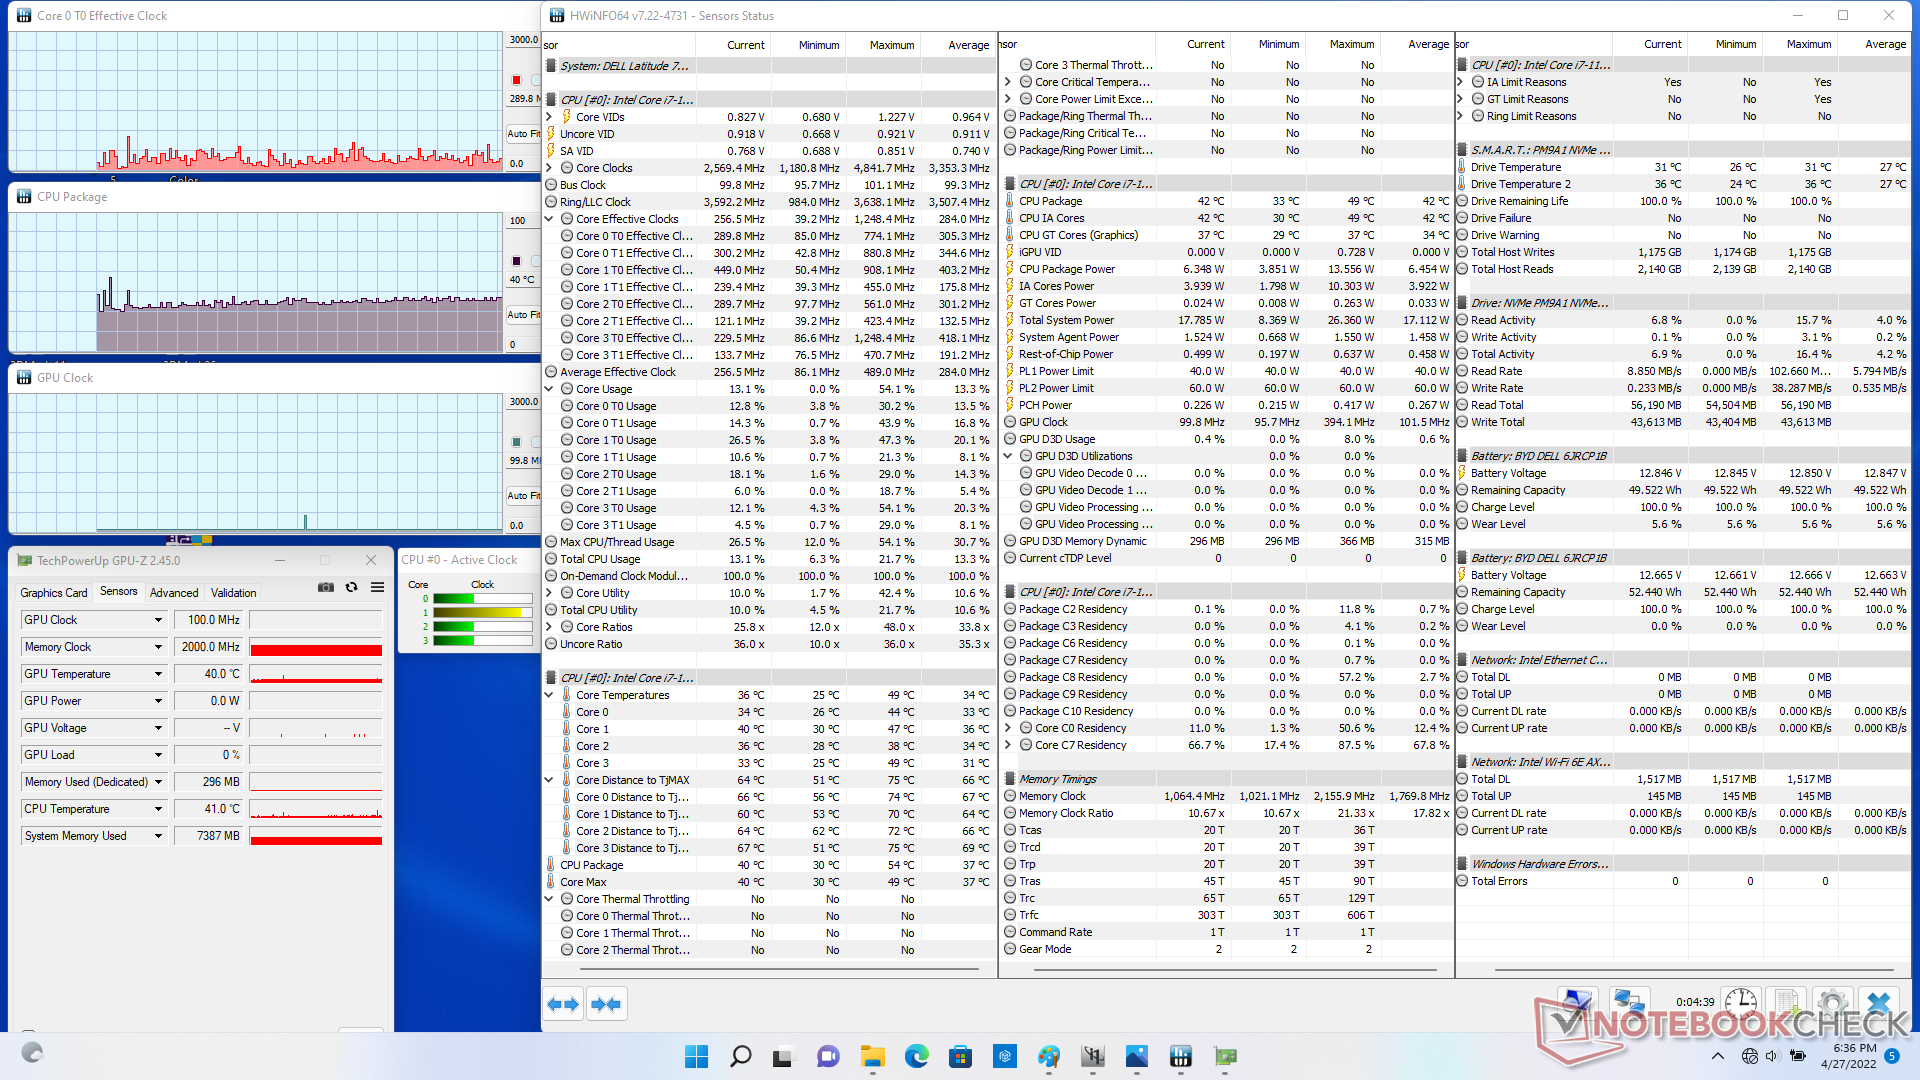
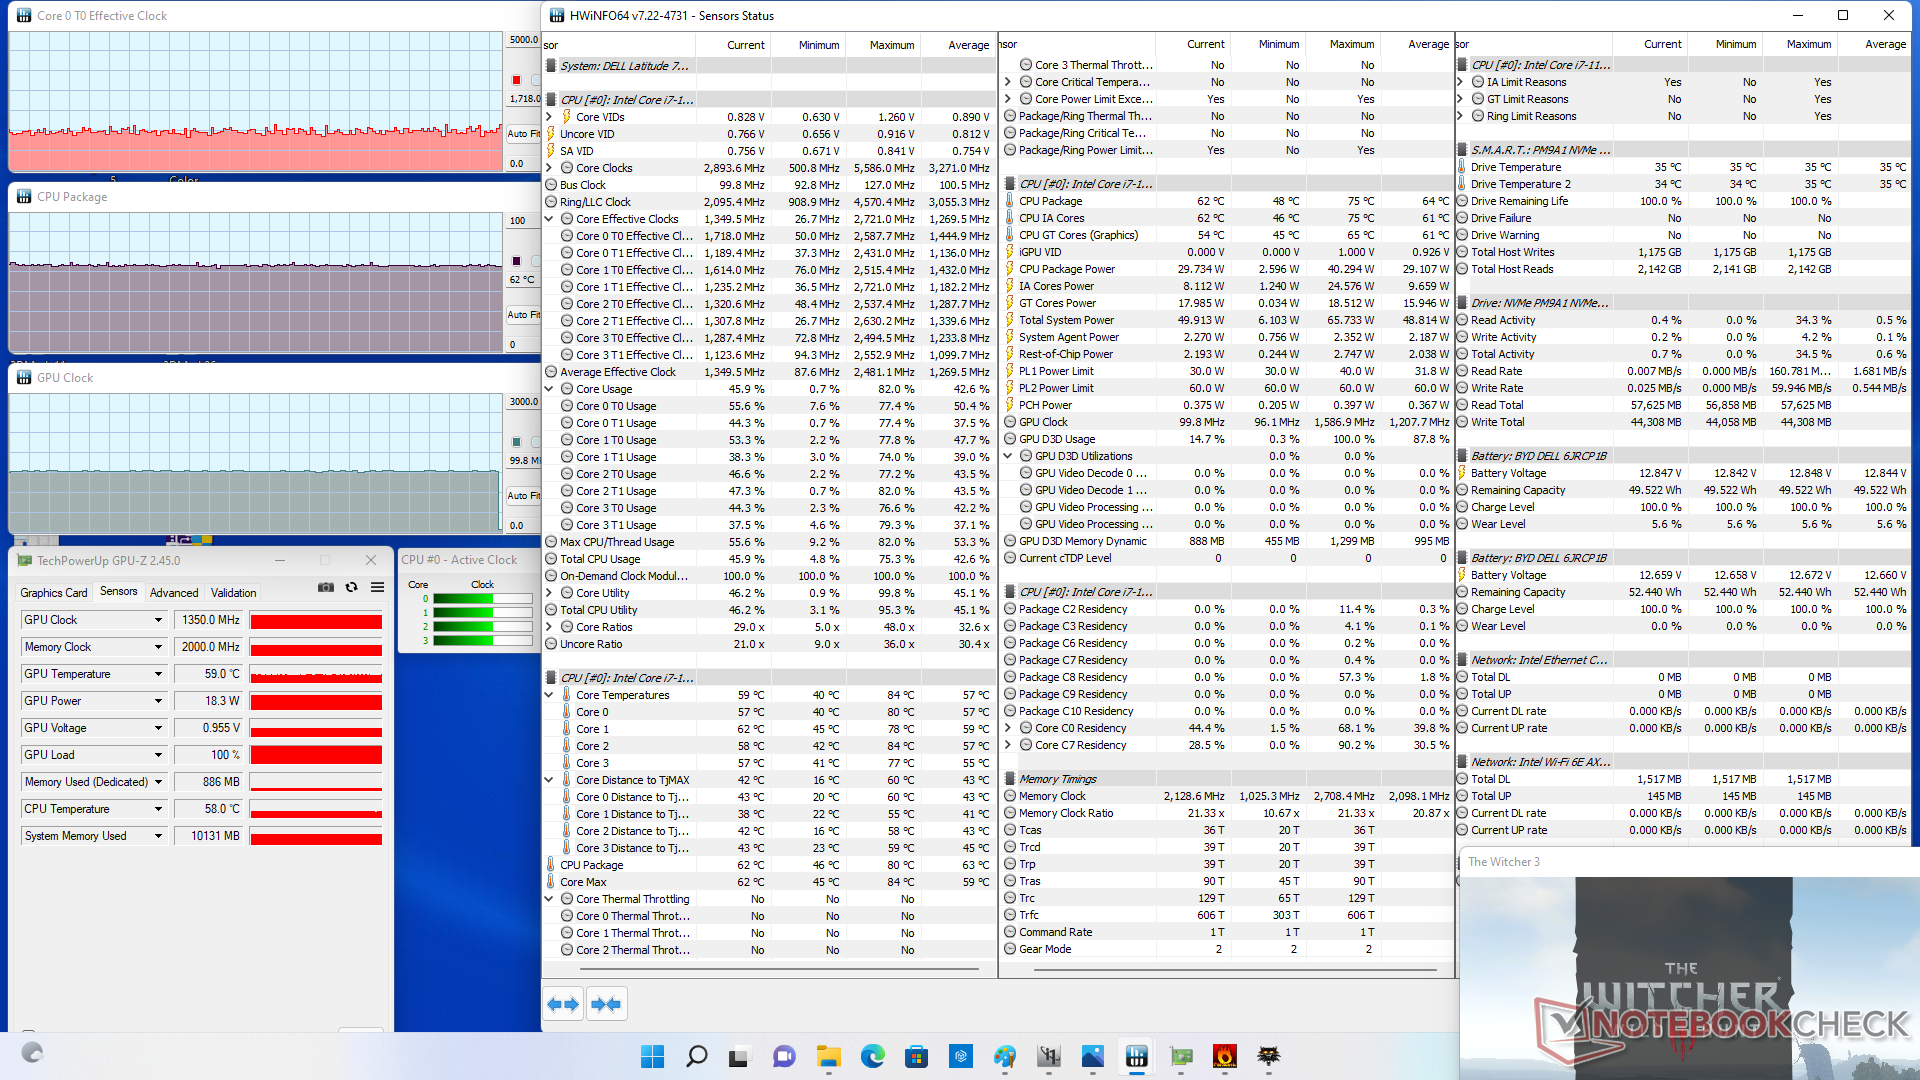
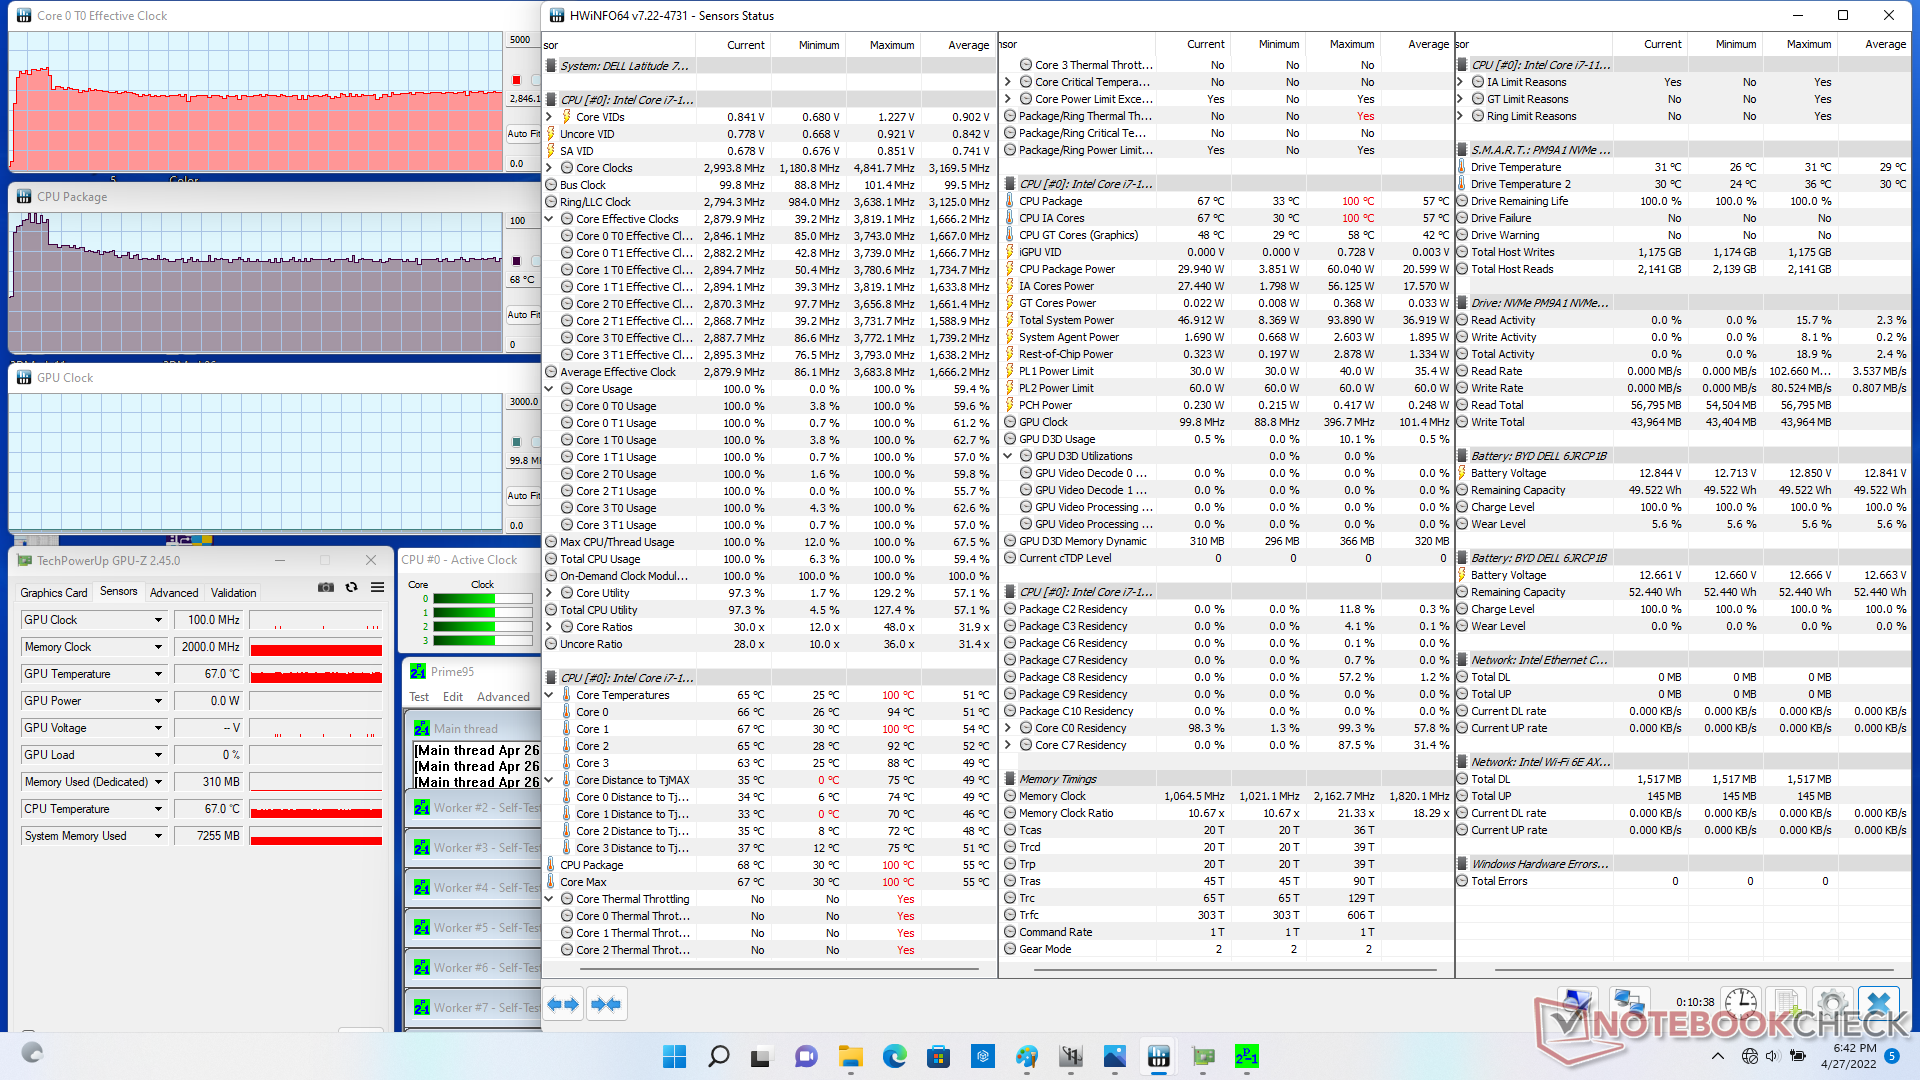
| CPU时钟(GHz) | GPU时钟(MHz) | CPU平均温度(°C) | |
| 系统空闲 | -- | -- | 40 |
| Prime95压力 | 2.8 | -- | 68 |
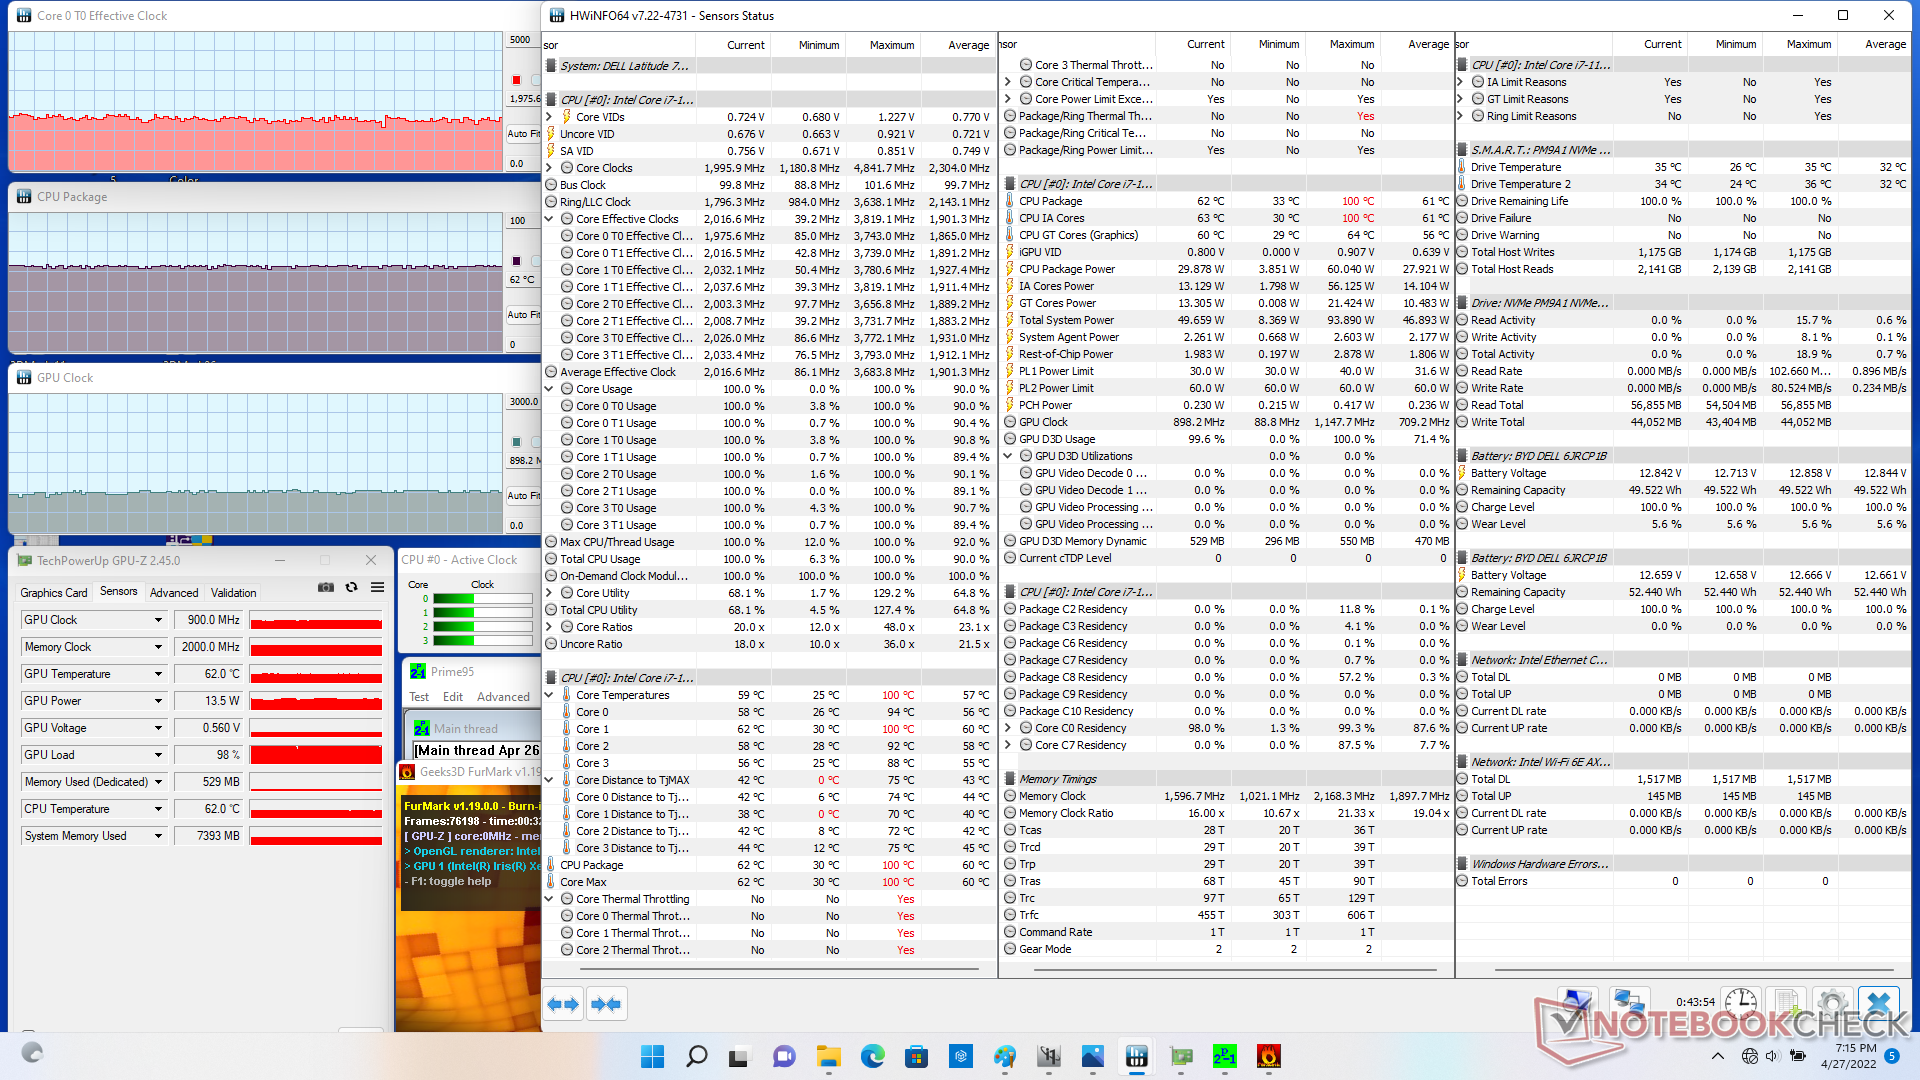
| Prime95 + FurMark 压力 | ~2.0 | 900 | 62 |
| Witcher 3 应力 | ~1.7 | 1350 | 62 |
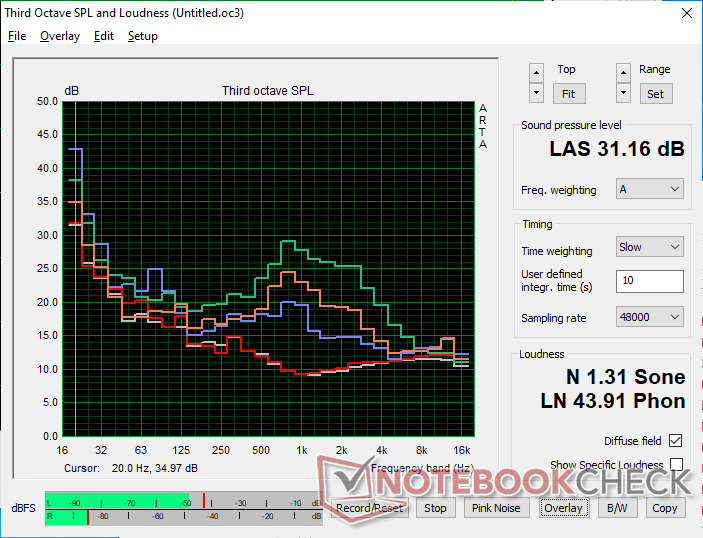
发言人
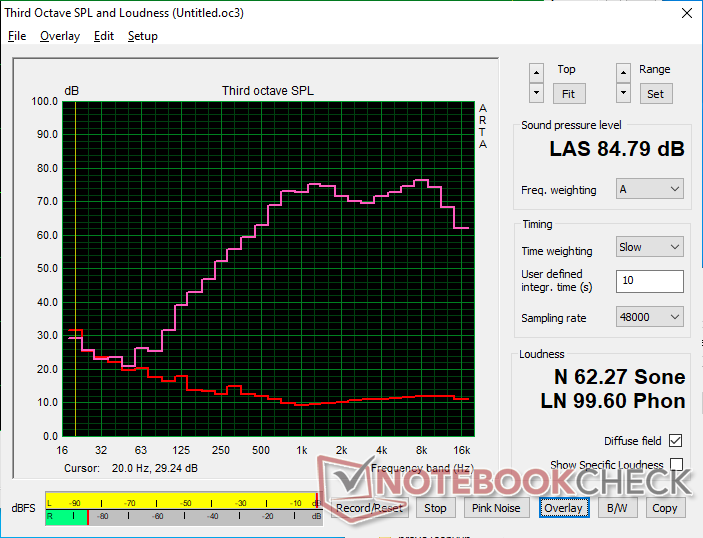
Dell Latitude 7330 Rugged Extreme audio analysis
(+) | speakers can play relatively loud (84.8 dB)
Bass 100 - 315 Hz
(-) | nearly no bass - on average 24.8% lower than median
(±) | linearity of bass is average (8.8% delta to prev. frequency)
Mids 400 - 2000 Hz
(+) | balanced mids - only 4.6% away from median
(+) | mids are linear (5.1% delta to prev. frequency)
Highs 2 - 16 kHz
(+) | balanced highs - only 3.2% away from median
(+) | highs are linear (2.7% delta to prev. frequency)
Overall 100 - 16.000 Hz
(±) | linearity of overall sound is average (16.5% difference to median)
Compared to same class
» 28% of all tested devices in this class were better, 6% similar, 66% worse
» The best had a delta of 4%, average was 24%, worst was 134%
Compared to all devices tested
» 28% of all tested devices were better, 6% similar, 66% worse
» The best had a delta of 4%, average was 24%, worst was 134%
Apple MacBook Pro 16 2021 M1 Pro audio analysis
(+) | speakers can play relatively loud (84.7 dB)
Bass 100 - 315 Hz
(+) | good bass - only 3.8% away from median
(+) | bass is linear (5.2% delta to prev. frequency)
Mids 400 - 2000 Hz
(+) | balanced mids - only 1.3% away from median
(+) | mids are linear (2.1% delta to prev. frequency)
Highs 2 - 16 kHz
(+) | balanced highs - only 1.9% away from median
(+) | highs are linear (2.7% delta to prev. frequency)
Overall 100 - 16.000 Hz
(+) | overall sound is linear (4.6% difference to median)
Compared to same class
» 0% of all tested devices in this class were better, 0% similar, 100% worse
» The best had a delta of 5%, average was 17%, worst was 45%
Compared to all devices tested
» 0% of all tested devices were better, 0% similar, 100% worse
» The best had a delta of 4%, average was 24%, worst was 134%
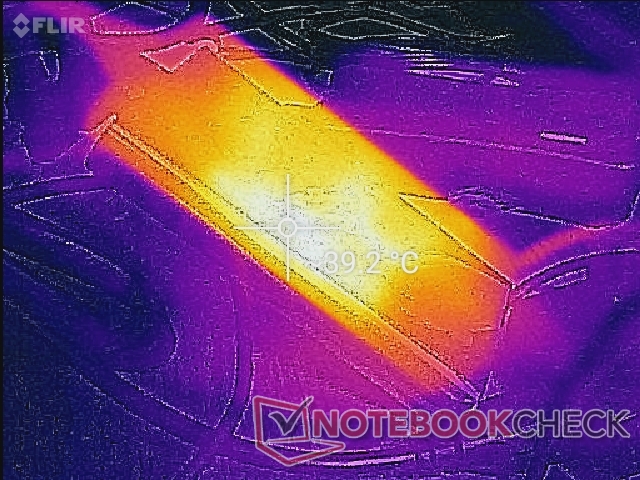
能源管理
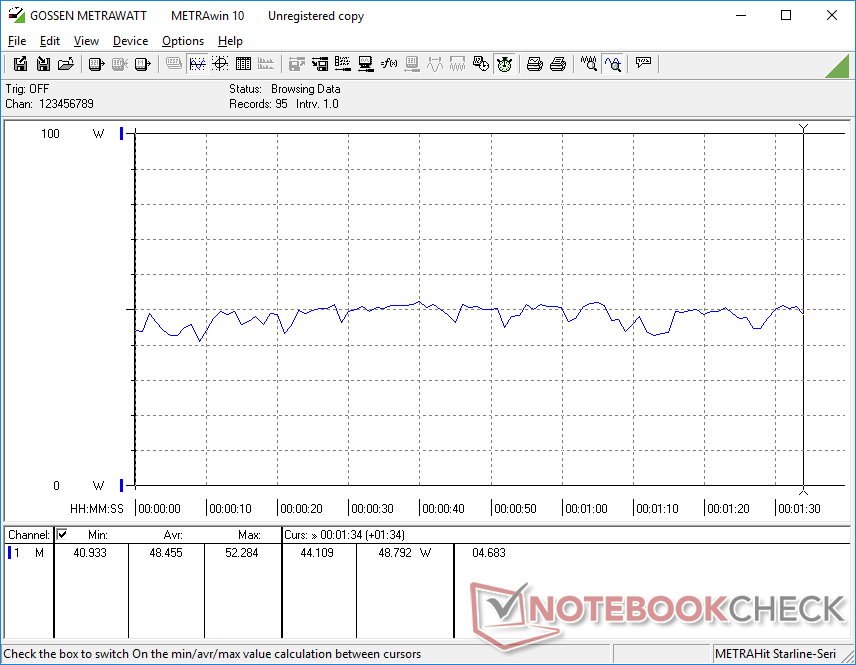
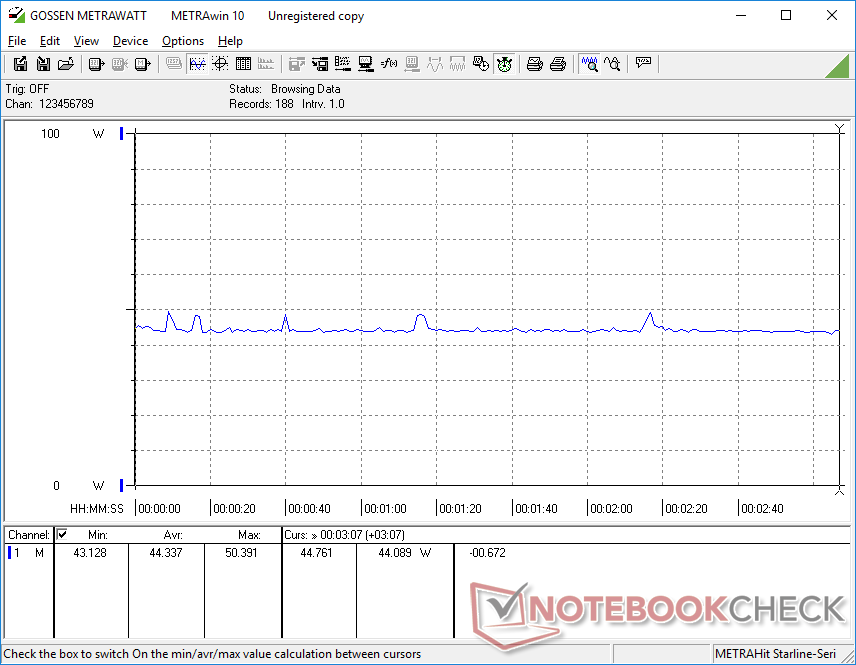
消耗功率
如果在最低亮度设置下,在桌面上空转需要约4瓦,如果亮度设置为最大,则需要高达12瓦。运行更高的负载,相当于游戏,将需要大约45W,仅比大多数其他运行在相同的第11代英特尔U系列CPU的笔记本电脑略高。请注意,功耗明显低于较早的 戴尔Latitude 7424 Rugged Extreme即使我们的Latitude 7330 Rugged Extreme能够提供高达40%的图形速度,由Radeon RX 540 GPU驱动的功耗也明显低。
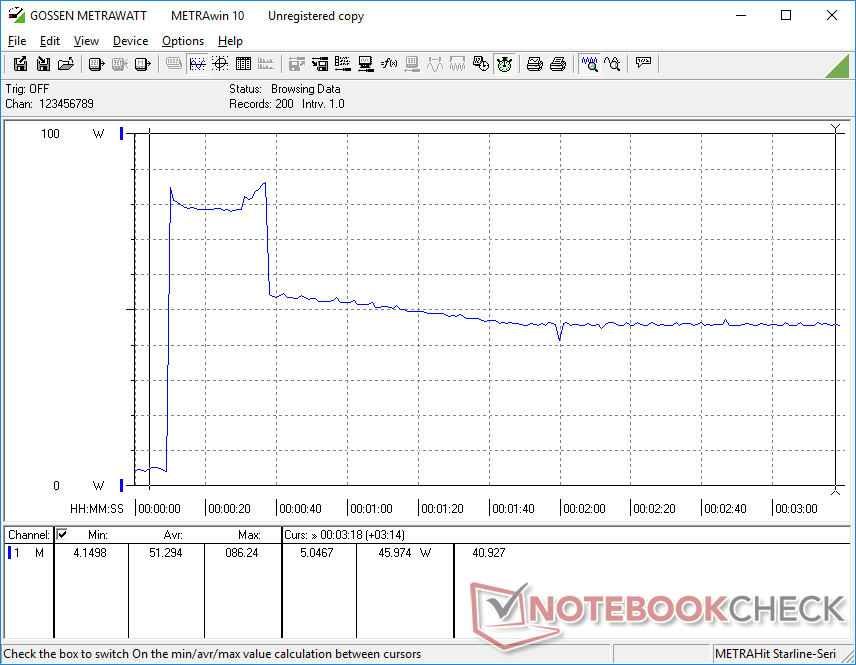
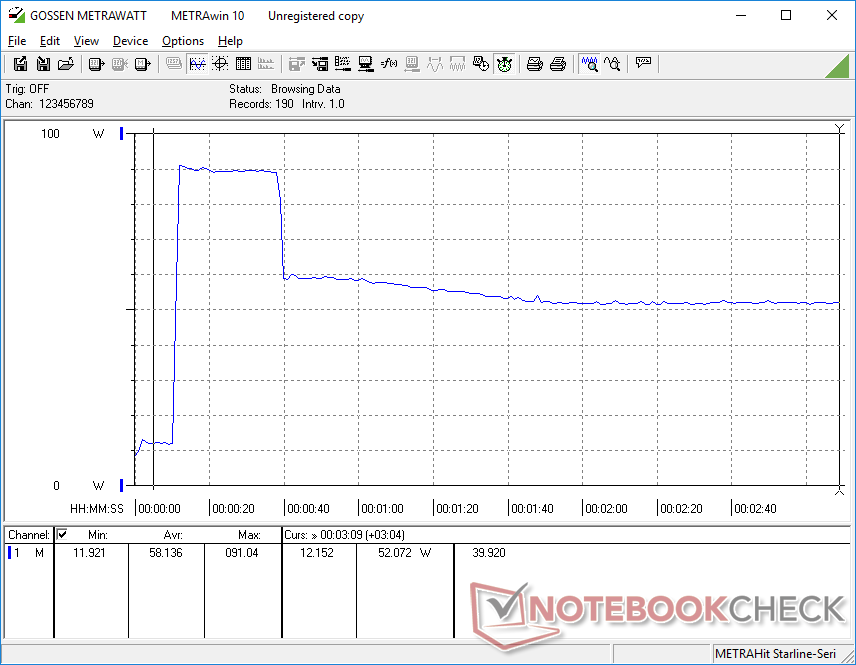
在同时运行Prime95+FurMark时,我们能够从中小型(约13 x 6.5 x 2.3厘米)的90瓦USB-C交流适配器中记录到91瓦的最大功耗。正如我们下面的截图所示,这个速率只是暂时的,可能是由于散热限制。
| Off / Standby | |
| Idle | |
| Load |
|
Key:
min: | |
| Dell Latitude 7330 Rugged Extreme i7-1185G7, Iris Xe G7 96EUs, , IPS, 1920x1080, 13.3" | Dell Latitude 7424 Rugged Extreme i7-8650U, Radeon RX 540, SK Hynix PC401 512GB M.2 (HFS512GD9TNG), IPS, 1920x1080, 14" | Dell Latitude 5420 Rugged-P85G i7-8650U, Radeon RX 540, SK hynix PC401 NVMe 500 GB, IPS, 1920x1080, 14" | Acer Enduro Urban N3 EUN314 i7-1165G7, Iris Xe G7 96EUs, Samsung PM991 MZVLQ1T0HALB, IPS, 1920x1080, 14" | Panasonic Toughbook FZ-55 MK2 i7-1185G7, Iris Xe G7 96EUs, Toshiba KIOXIA KBG4AZNV512G M.2 2280 OPAL, IPS, 1920x1080, 14" | Durabook S14I i7-1165G7, Iris Xe G7 96EUs, UDinfo M2P M2P80DE512GBAEP, TN, 1920x1080, 14" | |
|---|---|---|---|---|---|---|
| Power Consumption | -38% | -25% | 27% | 6% | -22% | |
| Idle Minimum * (Watt) | 4.1 | 6.5 -59% | 4.8 -17% | 3.8 7% | 3.5 15% | 6.8 -66% |
| Idle Average * (Watt) | 11.7 | 15.1 -29% | 13.6 -16% | 8 32% | 10.4 11% | 16.4 -40% |
| Idle Maximum * (Watt) | 11.8 | 16.1 -36% | 13.8 -17% | 8.7 26% | 10.5 11% | 16.9 -43% |
| Load Average * (Watt) | 48.5 | 70.5 -45% | 67.8 -40% | 34.6 29% | 45.4 6% | 39.2 19% |
| Witcher 3 ultra * (Watt) | 44.3 | 68.1 -54% | 69.1 -56% | 35.4 20% | 43 3% | |
| Load Maximum * (Watt) | 91 | 95.2 -5% | 93.5 -3% | 45.4 50% | 99.3 -9% | 73.1 20% |
* ... smaller is better
Power Consumption Witcher 3 / Stresstest
Power Consumption external Monitor
电池寿命
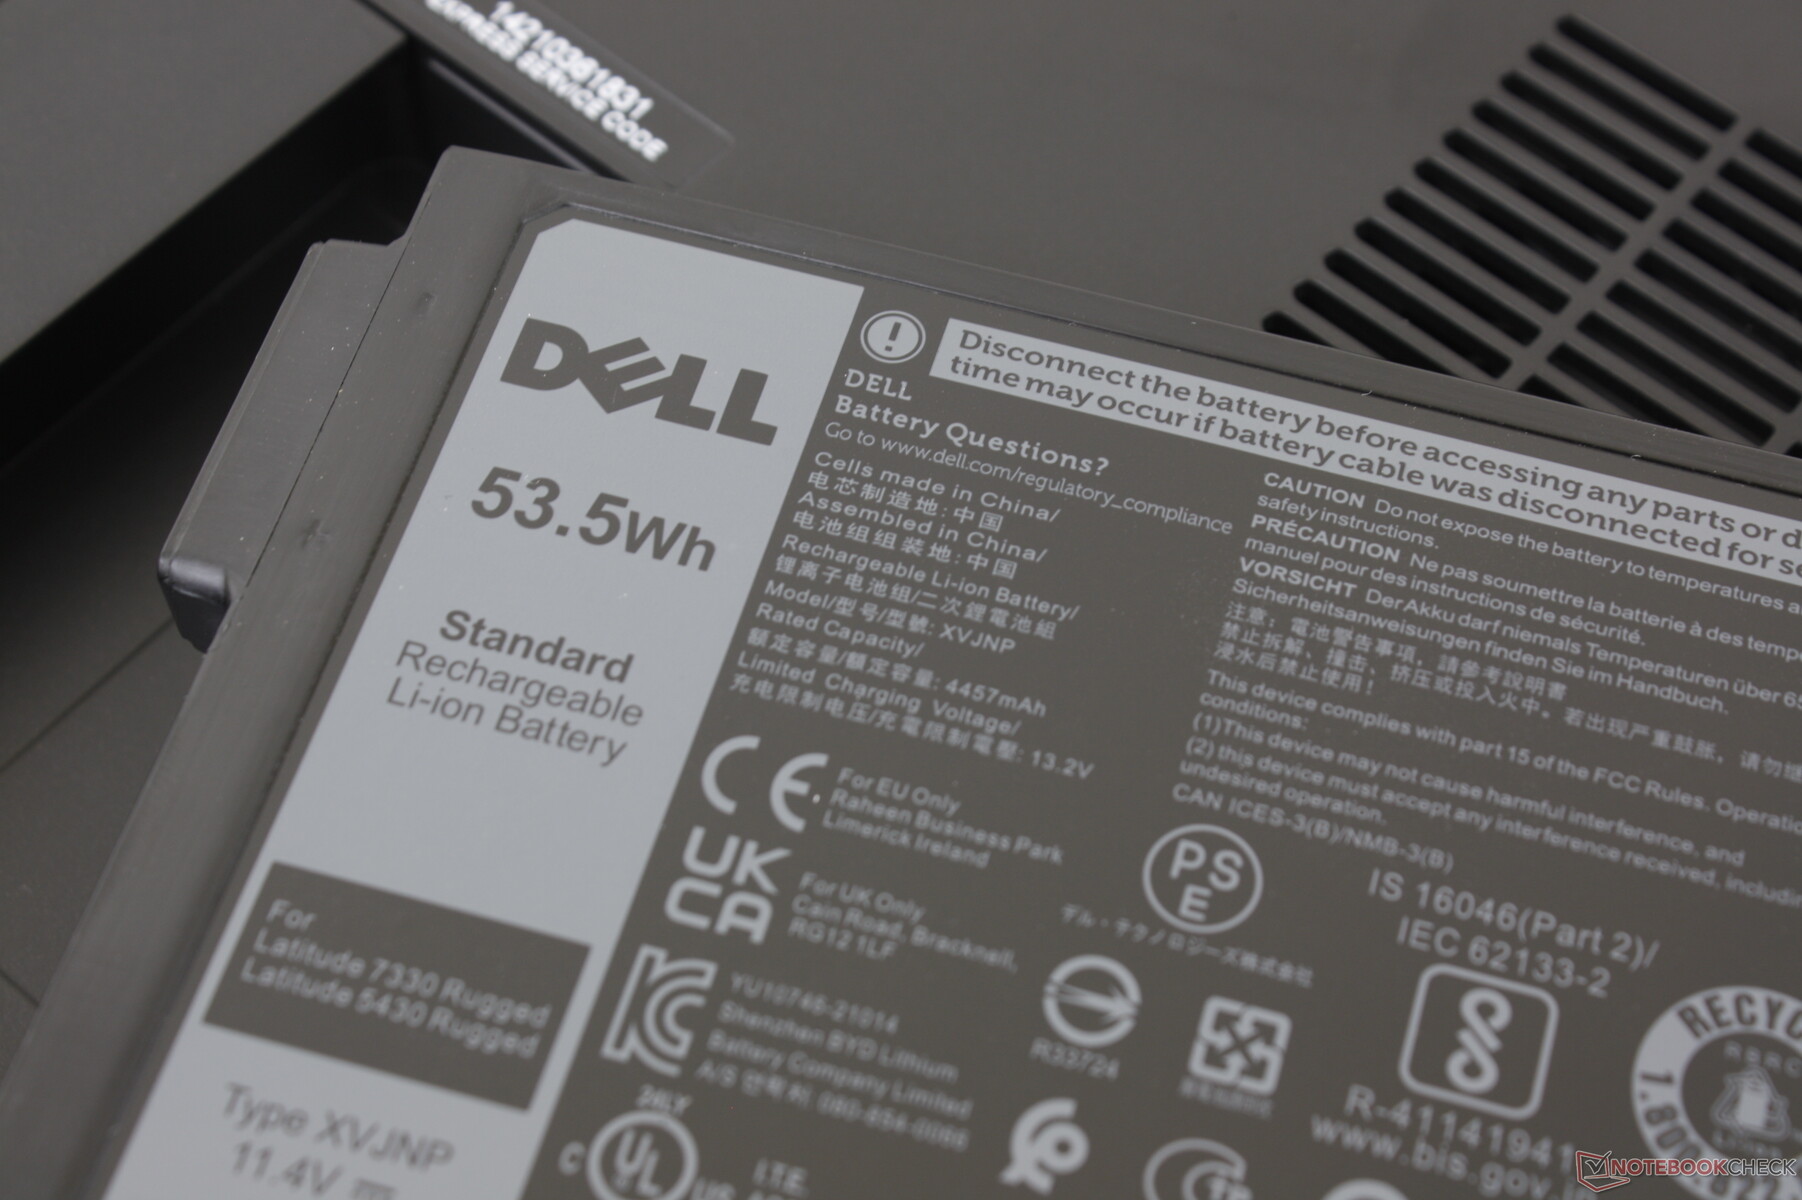
在安装了两块53.5Wh的电池后,预计在150尼特的显示亮度下,实际的无线局域网运行时间将达到18小时。如果需要,用户可以只使用一个电池组来减轻重量。然而,从空电到满电的充电时间相对较慢,超过3小时,而大多数基于消费的超极本的充电时间只有一半。
| Dell Latitude 7330 Rugged Extreme i7-1185G7, Iris Xe G7 96EUs, 107 Wh | Dell Latitude 7424 Rugged Extreme i7-8650U, Radeon RX 540, 102 Wh | Dell Latitude 5420 Rugged-P85G i7-8650U, Radeon RX 540, 102 Wh | Acer Enduro Urban N3 EUN314 i7-1165G7, Iris Xe G7 96EUs, 50.3 Wh | Panasonic Toughbook FZ-55 MK2 i7-1185G7, Iris Xe G7 96EUs, 71 Wh | Durabook S14I i7-1165G7, Iris Xe G7 96EUs, 50 Wh | |
|---|---|---|---|---|---|---|
| Battery runtime | -35% | -10% | -64% | -24% | -69% | |
| WiFi v1.3 (h) | 18 | 11.7 -35% | 16.2 -10% | 6.4 -64% | 13.6 -24% | 5.5 -69% |
| Load (h) | 2.7 | 3.2 | ||||
| Reader / Idle (h) | 31.4 |
Pros
Cons
判决书
Latitude 7330 Rugged Extreme是其他耐用型笔记本电脑应该有的一个标准。CPU性能很高,没有节流,运行时间很长,USB-C交流适配器是通用的,SD读卡器非常快,风扇噪音几乎总是很安静。特别是集成的GPU已经让Radeon RX 540等老式独立GPU过时了。
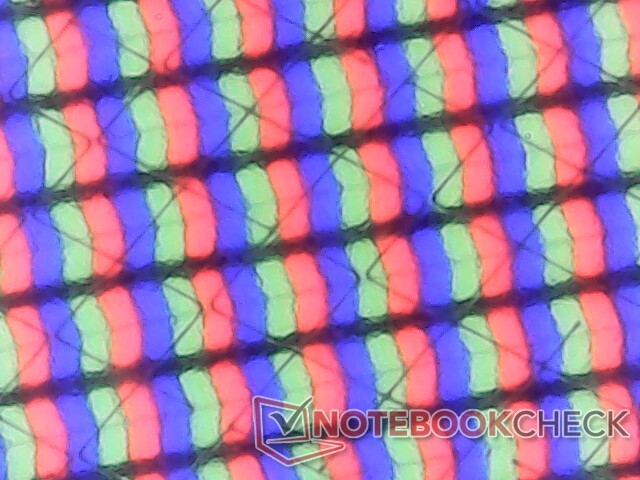
该机型的一个值得注意的特点是其高质量的IPS触摸屏。找到一个坚固耐用的笔记本电脑是不常见的,它具有完整的sRGB覆盖率,几乎没有颗粒度问题,相对较深的对比度,缺乏PWM,以及开箱就能校准的颜色。即使色彩准确度不是一个优先事项,考虑到竞争对手,用户可能仍然会欣赏这款显示器的外观。
缺点大多是小的。MicroSD插槽难以进入,重影普遍存在,键盘背光只有白色,没有其他颜色选择。该机型也比许多14英寸的耐用型笔记本电脑要重,因此用户不应该指望Latitude 7330 Rugged Extreme会更轻,只是因为它的外形尺寸较小。我们希望看到更多的热插拔配件,就像 Getac B360以获得更多的多功能性。
价格和可用性
戴尔 目前正在运送其Latitude 7330 Rugged Extreme型号的所有配置,起始价格为4350美元。
Price comparison

