


申克 Key 17 Pro (M24) 评测--超快双雷电 5 接口和 i9-14900HX 电源
申克 KEY 17 Pro 是首批配备双 Thunderbolt 5 端口的高端台式机替代移动工作站之一。它集成了顶级组件,包括升级版英特尔 i9-14900HX 处理器和 Nvidia RTX 4090,以及最快的 Wi-Fi 7 连接。
Intel Core i9-14900HX, NVIDIA GeForce RTX 4090 Laptop GPU, 17.3", 3.4 kg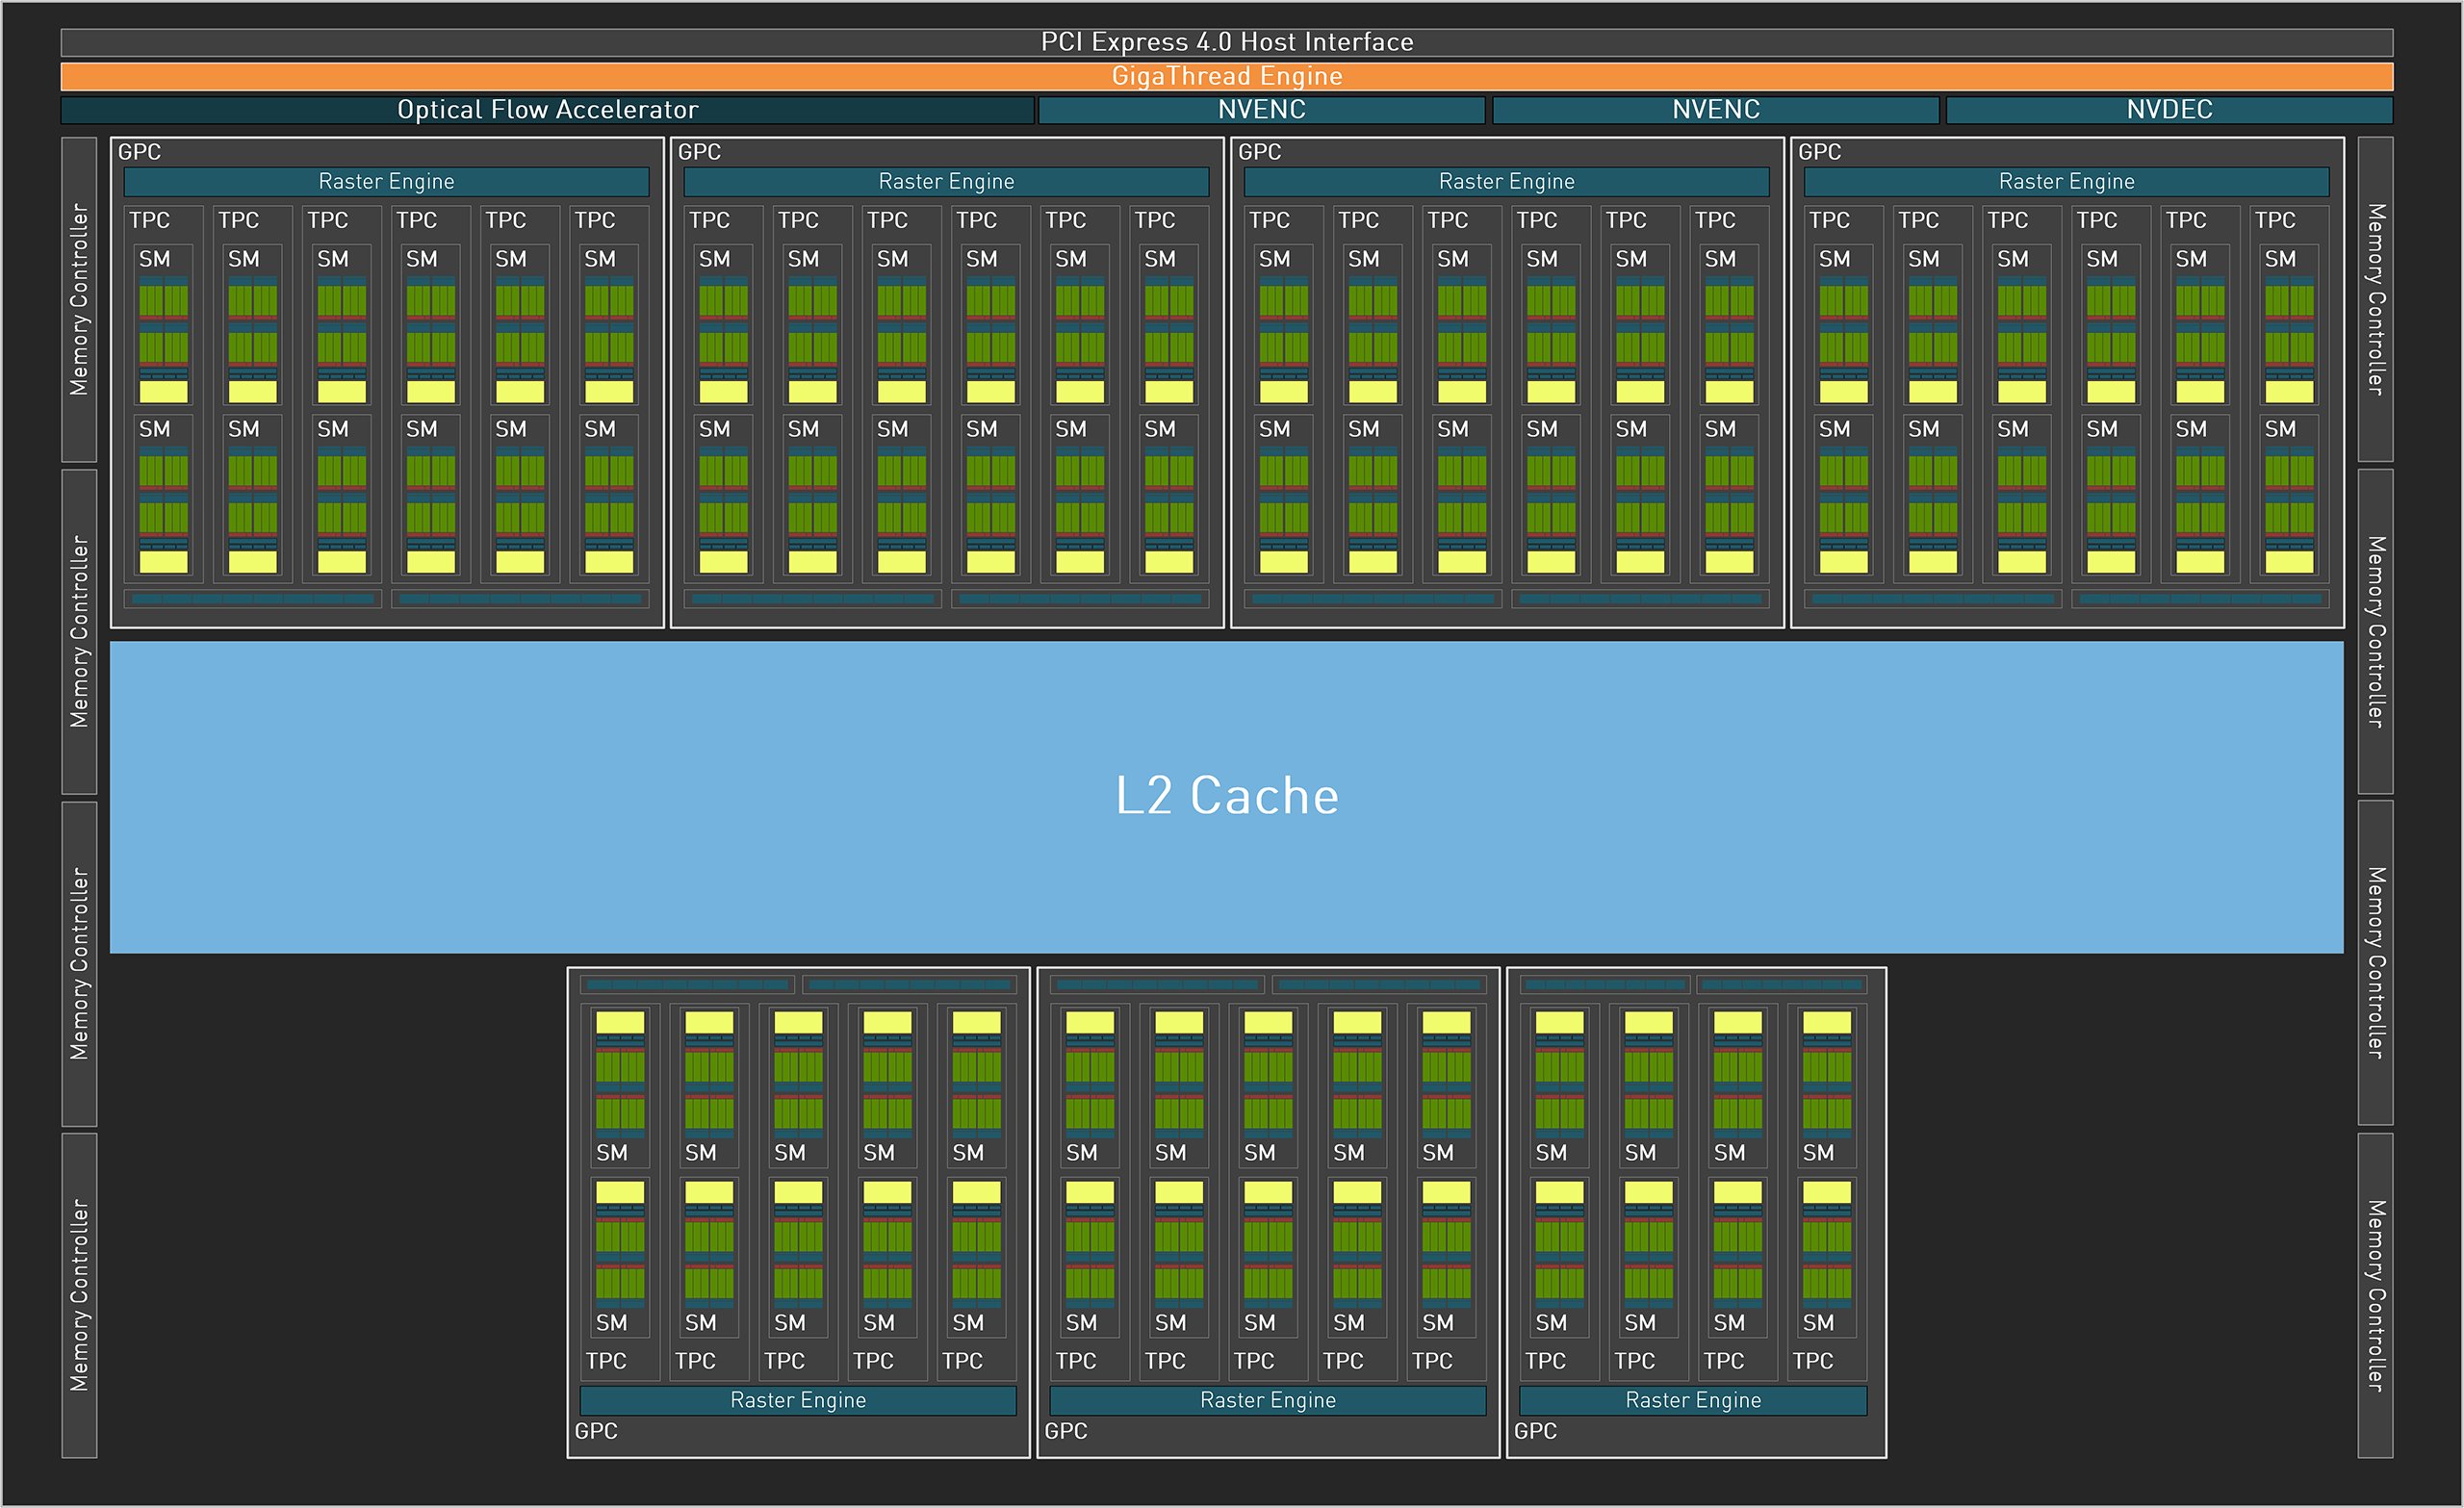
NVIDIA GeForce RTX 4090 笔记本电脑 GPU(代号 GN21-X11)是一款高端笔记本电脑 GPU。它与桌面RTX 4080一样基于AD103芯片,并采用Ada Lovelace架构。 AD103 芯片提供最多 10.752 个着色器,其中仅使用 9728 个(例如,RTX 4080 桌面使用 9.728 个)和 256 位内存总线。 RTX 4090 移动版使用 16 GB GDDR6 专用显卡内存,时钟速度为 20 Gbps(有效)。 TGP(总显卡功率)可配置为 80 至 150 瓦(+ CPU 的 15 瓦动态升压),从而实现不同的性能级别(桌面 RTX 4080 使用 320 瓦进行比较)。
性能取决于定义最大升压时钟的 TGP 设置(80W 为 1455 MHz,150W 高达 2040 MHz)。 150W 的性能应与桌面 RTX 4080 相当,因此最适合 4k60 或 2k、120 fps 的高要求游戏。对于光线追踪,需要较低的分辨率或 DLSS。
在我们的评测中,平均 RTX 4090 显然是最快的移动 GPU,并且轻松超越 RTX 4080 笔记本电脑 GPU 和移动 RTX 3080 Ti。然而,功率限制较低的 4090M GPU 可能会降低高达 20% 的性能。
在游戏中,快速 RTX 4090 型号可以以 4k 分辨率进行游戏并提供最大的细节。添加光线追踪可能会导致帧速率低于 60 fps(例如 F1 23),因此建议使用 DLSS 或减少设置。
RTX 4090 手机的 AD103 芯片由台积电 (4N) 采用改进的 5 nm 工艺制造。
GeForce RTX 4000 Laptop GPU Series
| ||||||||||||||||
| Codename | GN21-X11 | |||||||||||||||
| Architecture | Ada Lovelace | |||||||||||||||
| Pipelines | 9728 - unified | |||||||||||||||
| TMUs | 304 | |||||||||||||||
| ROPs | 112 | |||||||||||||||
| Raytracing Cores | 76 | |||||||||||||||
| Tensor / AI Cores | 304 | |||||||||||||||
| Core Speed | 1335 - 2040 (Boost) MHz | |||||||||||||||
| AI GPU | 686 TOPS INT8 | |||||||||||||||
| Cache | L2: 64 MB | |||||||||||||||
| Memory Speed | 20000 effective = 2250 MHz | |||||||||||||||
| Memory Bus Width | 256 Bit | |||||||||||||||
| Memory Type | GDDR6 | |||||||||||||||
| Max. Amount of Memory | 16 GB | |||||||||||||||
| Shared Memory | no | |||||||||||||||
| Memory Bandwidth | 576 GB/s | |||||||||||||||
| API | DirectX 12 Ultimate, Shader 6.7, OpenGL 4.6, OpenCL 3.0, Vulkan 1.3 | |||||||||||||||
| Power Consumption | 150 Watt (80 - 150 Watt TGP) | |||||||||||||||
| Transistor Count | 76.3 Billion | |||||||||||||||
| Man. Technology | 5 nm | |||||||||||||||
| PCIe | 4 x16/x8 | |||||||||||||||
| Displays | 4 Displays (max.), HDMI 2.1, DisplayPort 1.4a | |||||||||||||||
| Notebook Size | large | |||||||||||||||
| Date of Announcement | 03.01.2023 | |||||||||||||||
| Link to Manufacturer Page | www.nvidia.com | |||||||||||||||
| Predecessor | GeForce RTX 3080 Ti Laptop GPU | |||||||||||||||
The following benchmarks stem from our benchmarks of review laptops. The performance depends on the used graphics memory, clock rate, processor, system settings, drivers, and operating systems. So the results don't have to be representative for all laptops with this GPU. For detailed information on the benchmark results, click on the fps number.


| low | med. | high | ultra | QHD | 4K | |
|---|---|---|---|---|---|---|
| 007 First Light | 75.8 | 67.3 | 35.7 | |||
| Forza Horizon 6 | 94 | 61 | 50 | 31 | ||
| War Thunder | 123 | 85 | 50 | |||
| Pragmata | 110.7 | 85.5 | 58.6 | |||
| Death Stranding 2 | 88.5 | 68.1 | 42.4 | |||
| Crimson Desert | 73.3 | 57.3 | 43.1 | |||
| Resident Evil Requiem | 72.4 | 55.6 | 28.3 | |||
| Call of Duty Black Ops 7 | 76 | 52 | 27 | |||
| Anno 117: Pax Romana | 96.4 | 59.9 | 44.4 | 25.9 | ||
| ARC Raiders | 226 | 205 | 196.7 | 116.5 | 87.7 | 50 |
| The Outer Worlds 2 | 77.2 | 51.5 | 27.2 | |||
| Battlefield 6 | 126.8 | 89.9 | 50.9 | |||
| Borderlands 4 | 83.2 | 70 | 54.8 | 37.9 | ||
| F1 25 | 227 | 216 | 203 | 53.8 | 32.4 | 15 |
| Doom: The Dark Ages | 123.4 | 115 | 105.5 | 95.2 | 73.1 | 39.7 |
| The Elder Scrolls IV Oblivion Remastered | 56.8 | 43.1 | 26.4 | |||
| Assassin's Creed Shadows | 100 | 90 | 77 | 59 | 50 | 34 |
| Civilization 7 | 161.3 | 154.9 | ||||
| Monster Hunter Wilds | 89.2 | 84.7 | 78 | 67 | 42 | |
| Kingdom Come Deliverance 2 | 112.5 | 86.7 | 48.4 | |||
| Indiana Jones and the Great Circle | 157.6 | 135.6 | 124 | 97 | 59 | |
| Marvel Rivals | 146 | 122 | 101 | 90 | 71 | |
| Stalker 2 | 64.2 | 58.6 | 38.9 | |||
| Call of Duty Black Ops 6 | 191 | 181 | 155 | 140 | 107 | 73 |
| Until Dawn | 125.6 | 120.1 | 104.4 | 90 | 64.3 | 34.9 |
| EA Sports FC 25 | 247 | 158.7 | 158.4 | 145.6 | 126.9 | |
| God of War Ragnarök | 225 | 201 | 177.7 | 163.3 | 125 | 78 |
| Final Fantasy XVI | 129.7 | 123.4 | 109.4 | 98.5 | 70 | 40.1 |
| Space Marine 2 | 80.5 | 75.9 | 73.5 | 71.8 | 69.7 | 51.6 |
| Star Wars Outlaws | 90.5 | 88.7 | 83 | 76.2 | 60.6 | 32.6 |
| Black Myth: Wukong | 153 | 117 | 80 | 49 | 40 | 24 |
| Once Human | 230 | 196.9 | 170.6 | 123 | 67.3 | |
| The First Descendant | 182.8 | 152.7 | 130.6 | 89.4 | 47.9 | |
| F1 24 | 288 | 327 | 288 | 119 | 78 | 40 |
| Senua's Saga Hellblade 2 | 122 | 101 | 76 | 55 | 28.9 | |
| Ghost of Tsushima | 127.1 | 115.7 | 105.5 | 87.3 | 53.4 | |
| Horizon Forbidden West | 141 | 132 | 104 | 100 | 80 | 45 |
| Alone in the Dark | 220 | 210 | 206 | 165 | 116 | 37 |
| Dragon's Dogma 2 | 76.8 | 70.7 | 70.4 | 51 | ||
| Last Epoch | 198.3 | 196 | 188 | 146 | 71.1 | |
| Skull & Bones | 164 | 132 | 135 | 110 | 90 | 60 |
| Helldivers 2 | 142 | 140 | 140 | 136 | 114 | 66.9 |
| Enshrouded | 143 | 122 | 104 | 89 | 69 | 37.5 |
| Palworld | 211 | 176 | 145 | 145 | 115 | 66.5 |
| Prince of Persia The Lost Crown | 356 | 357 | 356 | 356 | 315 | |
| Ready or Not | 289 | 192 | 183 | 179 | 143 | 65.2 |
| The Finals | 228 | 205 | 195 | 193 | 142 | 67 |
| Avatar Frontiers of Pandora | 162 | 140 | 123 | 98 | 67 | 34 |
| Call of Duty Modern Warfare 3 2023 | 236 | 222 | 184 | 175 | 139 | 90 |
| EA Sports WRC | 124.4 | 126 | 110 | 100 | 67.9 | |
| Alan Wake 2 | 129 | 128 | 118 | 83 | 44 | |
| Lords of the Fallen | 144.7 | 97 | 70 | 47 | 29.1 | |
| Total War Pharaoh | 317 | 228 | 178 | 165 | 96.1 | |
| Assassin's Creed Mirage | 230 | 209 | 199 | 144 | 124 | 78 |
| EA Sports FC 24 | 219 | 179.3 | 171.3 | 167.6 | 153.2 | |
| Counter-Strike 2 | 240 | 227 | 201 | 173 | 113.5 | |
| Cyberpunk 2077 | 151 | 142 | 132 | 122 | 89 | 41 |
| Baldur's Gate 3 | 227 | 202 | 186 | 178 | 133 | 72 |
| Lies of P | 270 | 229 | 209 | 155 | 91.2 | |
| The Crew Motorfest | 60 | 60 | 60 | 60 | 60 | |
| Starfield | 112.7 | 103 | 87 | 79 | 67 | 46.5 |
| Armored Core 6 | 116.3 | 113 | 109 | 103 | 92 | |
| Immortals of Aveum | 119.3 | 109 | 98 | 70 | 36.6 | |
| Atlas Fallen | 195.3 | 188 | 176 | 150 | 96.4 | |
| Ratchet & Clank Rift Apart | 163.4 | 159 | 136 | 113 | 103 | 67.6 |
| F1 23 | 265 | 275 | 273 | 120 | 84 | 43 |
| Diablo 4 | 379 | 374 | 361 | 334 | 232 | 123.5 |
| Star Wars Jedi Survivor | 152 | 136 | 119 | 117 | 88 | 45 |
| Dead Island 2 | 226 | 219 | 199 | 194 | 188 | 98 |
| The Last of Us | 113.7 | 110.8 | 106 | 99 | 79 | 41 |
| Resident Evil 4 Remake | 218 | 192 | 180 | 140 | 111 | 64 |
| Company of Heroes 3 | 297 | 272 | 237 | 225 | 186 | 117.4 |
| Sons of the Forest | 100 | 94 | 91 | 90 | 87 | 72.5 |
| Atomic Heart | 211 | 174 | 161 | 144 | 112 | 62.7 |
| Returnal | 173 | 172 | 166 | 147 | 116 | 70 |
| Hogwarts Legacy | 179 | 152 | 102 | 93 | 78 | 38 |
| Dead Space Remake | 150 | 146 | 136 | 135 | 103 | 55 |
| The Witcher 3 v4 | 230 | 172 | 177 | 149 | 105 | 54 |
| High On Life | 277 | 246 | 211 | 183 | 123 | 54 |
| The Callisto Protocol | 194 | 177 | 151 | 131 | 105 | 64 |
| Need for Speed Unbound | 124.2 | 111.8 | 84.3 | |||
| Spider-Man Miles Morales | 134 | 131 | 118 | 110 | 107 | 78 |
| Call of Duty Modern Warfare 2 2022 | 204 | 192 | 174 | 168 | 127 | 79 |
| Uncharted Legacy of Thieves Collection | 108.2 | 103.1 | 62.9 | |||
| A Plague Tale Requiem | 87.1 | 87 | 69 | 39 | ||
| FIFA 23 | 183.7 | 182.6 | 162.4 | |||
| The Quarry | 278 | 211 | 177.3 | 146.1 | 100.2 | |
| F1 22 | 308 | 296 | 271 | 125 | 86 | 44 |
| Vampire Bloodhunt | 290 | 242 | 138.3 | |||
| Ghostwire Tokyo | 237 | 236 | 234 | 231 | 201 | 99 |
| Tiny Tina's Wonderlands | 326 | 272 | 210 | 174 | 126 | 68 |
| Cyberpunk 2077 1.6 | 151 | 138 | 135 | 124 | 95 | 48 |
| Elex 2 | 118.2 | 117.1 | 116.2 | 116.2 | 116.7 | |
| GRID Legends | 241 | 220 | 200 | 191 | 184 | 130 |
| Elden Ring | 60 | 60 | 60 | 60 | 60 | 60 |
| Dying Light 2 | 232 | 201 | 162 | 115 | 59 | |
| Rainbow Six Extraction | 378 | 347 | 346 | 314 | 219 | 112 |
| God of War | 189 | 188 | 173 | 128 | 108 | 76 |
| Halo Infinite | 128.9 | 77 | 57.3 | |||
| Battlefield 2042 | 172.6 | 138.9 | 85.4 | |||
| Forza Horizon 5 | 220 | 181 | 174 | 124 | 113 | 95 |
| Riders Republic | 209 | 200 | 185 | 179 | 146 | |
| Guardians of the Galaxy | 163 | 160 | 158 | 152 | 141 | |
| Back 4 Blood | 403 | 309 | 309 | 327 | ||
| Far Cry 6 | 175.7 | 161 | 137 | 125 | 117 | 80 |
| F1 2021 | 512 | 444 | 358 | 199 | 172 | 106 |
| Yakuza Like a Dragon | 179.7 | 167.7 | 166.6 | 152.3 | 138.1 | |
| Assassin´s Creed Valhalla | 175 | 153 | 124 | 75 | ||
| Watch Dogs Legion | 152 | 144 | 131 | 116 | 104 | 66 |
| Mafia Definitive Edition | 219 | 189 | 183 | 165 | 92 | |
| Flight Simulator 2020 | 74 | 74 | 51.2 | |||
| Horizon Zero Dawn | 197 | 189 | 174 | 159 | 150 | 94 |
| Death Stranding | 179 | 171.4 | 166.6 | 163 | 162.1 | |
| F1 2020 | 413 | 354 | 344 | 305 | 253 | 148.7 |
| Valorant | 485 | |||||
| Doom Eternal | 441 | 362 | 200 | |||
| Hunt Showdown | 367 | 285 | 262 | 168 | ||
| Borderlands 3 | 231 | 209 | 188 | 163 | 126 | 72 |
| Control | 240 | 232 | 185 | 122 | 63 | |
| Far Cry New Dawn | 170 | 148 | 145 | 131 | 128 | 102 |
| Metro Exodus | 211 | 184 | 154 | 131 | 115 | 79 |
| Shadow of the Tomb Raider | 246 | 223 | 212 | 197 | 167 | 97 |
| Strange Brigade | 498 | 401 | 378 | 357 | 288 | 156 |
| Far Cry 5 | 194 | 176 | 166 | 153 | 149 | 103 |
| X-Plane 11.11 | 192 | 168 | 131 | 112 | ||
| Final Fantasy XV Benchmark | 220 | 205 | 173 | 147 | 89 | |
| Deus Ex Mankind Divided | 169 | |||||
| Dota 2 Reborn | 223 | 199 | 190 | 176 | 168 | |
| The Witcher 3 | 575 | 498 | 380 | 198 | 162 | 144 |
| GTA V | 187 | 186 | 182 | 139 | 134 | 158 |
| Counter-Strike: GO | 516 | 314 | ||||
| low | med. | high | ultra | QHD | 4K | < 30 fps < 60 fps < 120 fps ≥ 120 fps | 12 76 | 15 84 | 1 30 77 | 6 41 71 | 13 63 51 | 9 43 52 14 |
For more games that might be playable and a list of all games and graphics cards visit our Gaming List


Alienware m18 R2: Intel Core i9-14900HX, 18.00", 4 kg
Review » Alienware m18 R2 笔记本电脑评测:从酷睿 i9-13980HX 跃升至 i9-14900HX
Eurocom Raptor X17 Core i9-14900HX: Intel Core i9-14900HX, 17.30", 3.4 kg
Review » Eurocom Raptor X17 酷睿 i9-14900HX 笔记本电脑评测:175 瓦 GPU 实现最高性能
Acer Predator Helios 18 PH18-72-98MW: Intel Core i9-14900HX, 18.00", 3.3 kg
Review » 宏碁掠夺者 Helios 18 2024 笔记本电脑评测:18 英寸游戏玩家的新硬件
Medion Erazer Beast X40 2024: Intel Core i9-14900HX, 17.00", 2.9 kg
Review » Medion Erazer Beast X40 (2024) 评测:配备 RTX 4090 和机械键盘的高端游戏笔记本电脑
Razer Blade 16 2024, RTX 4090: Intel Core i9-14900HX, 16.00", 2.5 kg
Review » Razer Blade 16 (2024) 笔记本电脑评测:配备超高速三星 OLED 显示屏
Asus ROG Strix Scar 18 G834JYR (2024): Intel Core i9-14900HX, 18.00", 3.1 kg
Review » 华硕 ROG Strix Scar 18 (2024) 评测:配备 RTX 4090 和迷你 LED 面板的游戏笔记本电脑
MSI Titan 18 HX A14VIG: Intel Core i9-14900HX, 18.00", 3.6 kg
Review » 微星 Titan 18 HX A14VIG 笔记本电脑评测:龙年
Schenker XMG Neo 17 2024 Engineering Sample: Intel Core i9-14900HX
Review » 英特尔 Raptor Lake-HX 更新分析 - 单核性能更强的酷睿 i9-14900HX
Lenovo Legion 9 16IRX8: Intel Core i9-13980HX, 16.00", 2.6 kg
Review » Legion 9i Gen 8 16IRX8 评测:联想最具雄心的游戏笔记本电脑
Asus ROG Strix Scar 17 G733PYV-LL053X: AMD Ryzen 9 7945HX3D, 17.30", 2.9 kg
Review » 华硕 ROG Strix SCAR 17 X3D 评测--全球最快的游戏笔记本电脑
Review » AMD Ryzen 9 7945HX3D Zen4 分析 - 3D V-Cache 带来最快的移动游戏处理器
Lenovo Legion Pro 7 RTX4090: Intel Core i9-13900HX, 16.00", 2.7 kg
Review » 联想Legion Pro 7 16笔记本电脑回顾:得益于RTX 4090的全面游戏能力
Schenker Key 17 Pro (Early 23): Intel Core i9-13900HX, 17.30", 3.4 kg
Review » 斯堪的纳维亚钥匙17 Pro(早期23)回顾:配备Core i9和RTX 4090的4k游戏笔记本
Eurocom Raptor X17: Intel Core i9-13900HX, 17.30", 3.5 kg
Review » Eurocom Raptor X17笔记本电脑评测:微星和华硕ROG的替代品
Asus ROG Zephyrus G14 GA402XY: AMD Ryzen 9 7940HS, 14.00", 1.7 kg
Review » 华硕ROG Zephyrus G14评测--配备AMD Zen4 Phoenix和RTX 4090的紧凑型游戏笔记本电脑
Aorus 17X AZF: Intel Core i9-13900HX, 17.30", 2.9 kg
Review » Aorus 17X AZF回顾:带有i9-13900HX和RTX 4090的高端游戏笔记本电脑在一个薄薄的盒子里
Eluktronics Mech-17 GP2 Liquid Propulsion Package G2: Intel Core i9-13900HX
Review » 水冷一个GeForce RTX 4090笔记本电脑:Eluktronics液体推进包G2回顾
Asus ROG Strix Scar 17 G733PY-XS96: AMD Ryzen 9 7945HX, 17.30", 2.9 kg
Review » 华硕ROG Strix Scar 17 G733PY笔记本电脑评测:英特尔不再是国王
Alienware m18 R1: Intel Core i9-13980HX, 18.00", 3.9 kg
Review » Alienware m18 R1笔记本电脑评测:比微星泰坦GT77更大、更重
Asus Zephyrus Duo 16 GX650PY-NM006W: AMD Ryzen 9 7945HX, 16.00", 2.7 kg
Review » AMD Ryzen 9 7945HX分析--Zen4龙系列比英特尔猛禽湖-HX更快、更高效
Medion Erazer Beast X40: Intel Core i9-13900HX, 17.00", 2.9 kg
Review » Medion Erazer Beast X40回顾:配备RTX 4090的游戏笔记本
Asus ROG Zephyrus M16 GU604VY-NM042X: Intel Core i9-13900H, 16.00", 2.3 kg
Review » 华硕ROG Zephyrus M16(2023)笔记本电脑评测:RTX 4090与超亮的Mini-LED显示屏
Razer Blade 16 Early 2023 RTX 4090: Intel Core i9-13950HX, 16.00", 2.5 kg
Review » Razer Blade 16 Early 2023 RTX 4090评论:酷睿i9-13950HX巨兽,全球首款双模迷你LED UHD+显示屏
Asus Zephyrus Duo 16 GX650PY-NM006W: AMD Ryzen 9 7945HX, 16.00", 2.7 kg
Review » 华硕ROG Zephyrus Duo 16笔记本回顾。带有AMD Zen4、RTX 4090和Mini-LED的多任务怪物
Eluktronics Mech-17 GP2: Intel Core i9-13900HX, 17.00", 2.9 kg
Review » Eluktronics Mech-17 GP2笔记本电脑评测。微星GT77泰坦的性能,没有大小之分
Asus ROG Strix Scar 18 2023 G834JY-N6005W: Intel Core i9-13980HX, 18.00", 3.1 kg
Review » 华硕ROG Strix Scar 18 2023 G834JY评测--配备RTX 4090的游戏笔记本
MSI Titan GT77 HX 13VI: Intel Core i9-13950HX, 17.30", 3.5 kg
Review » Nvidia Ada RTX 40笔记本GPU分析:175W RTX 4090笔记本GPU在性能和功率效率方面超过了350W RTX 3090
Schenker XMG Neo 16 Raptor Lake: Intel Core i9-13900HX, 16.00"
Review » Nvidia Ada RTX 40笔记本GPU分析:175W RTX 4090笔记本GPU在性能和功率效率方面超过了350W RTX 3090
MSI Titan GT77 HX 13VI: Intel Core i9-13950HX, 17.30", 3.5 kg
Review » 微星Titan GT77 HX 13V评测--带RTX 4090和Core i9-13950HX的终极游戏笔记本电脑
Origin PC EON17-X 2024: Intel Core i9-14900HX, 17.30", 3.4 kg
External Review » Origin PC EON17-X 2024
MSI Raider GE78 HX 14VIG: Intel Core i9-14900HX, 17.00", 3.1 kg
External Review » MSI Raider GE78 HX 14VIG
MSI Stealth 16 AI Studio A1VIG: Intel Core Ultra 9 185H, 16.00", 2 kg
External Review » MSI Stealth 16 AI Studio A1VIG
Origin PC Eon16-X: Intel Core i9-14900HX, 16.00", 2.5 kg
External Review » Origin PC Eon16-X
Lenovo Legion Pro 7 16ARX8H: AMD Ryzen 9 7945HX, 16.00", 2.8 kg
External Review » Lenovo Legion Pro 7 16ARX8H
MSI Creator 16 AI Studio A1VIG: Intel Core Ultra 9 185H, 16.00", 2 kg
External Review » MSI Creator 16 AI Studio A1VIG
Lenovo Legion Pro 7 16IRX9H, RTX 4090: Intel Core i9-14900HX, 16.00", 2.6 kg
External Review » Lenovo Legion Pro 7 16IRX9H, RTX 4090
Schenker XMG Neo 16 (Early 24): Intel Core i9-14900HX, 16.00", 2.5 kg
External Review » SCHENKER XMG Neo 16 (Early 24)
MSI Stealth 18 AI Studio A1VIG: Intel Core Ultra 9 185H, 18.00", 2.9 kg
External Review » MSI Stealth 18 AI Studio A1VIG
Razer Blade 18 2024 RZ09-0509: Intel Core i9-14900HX, 18.00", 3.1 kg
External Review » Razer Blade 18 2024 RZ09-0509
Aorus 17X AZG: Intel Core i9-14900HX, 17.30", 2.8 kg
External Review » Aorus 17X AZG
MSI Raider GE68 HX 14VIG: Intel Core i9-14900HX, 16.00", 2.8 kg
External Review » MSI Raider GE68 HX 14VIG
Lenovo Legion 9 16IRX9: Intel Core i9-14900HX, 16.00", 2.6 kg
External Review » Lenovo Legion 9 16IRX9
Asus ROG Zephyrus G16 GU605MY: Intel Core Ultra 9 185H, 16.00", 1.9 kg
External Review » Asus ROG Zephyrus G16 GU605MY
Alienware m18 R2: Intel Core i9-14900HX, 18.00", 4 kg
External Review » Alienware m18 R2
Asus ROG Strix Scar 16 G634JYR: Intel Core i9-14900HX, 16.00", 2.7 kg
External Review » Asus ROG Strix Scar 16 G634JYR
Razer Blade 16 2024, RTX 4090: Intel Core i9-14900HX, 16.00", 2.5 kg
External Review » Razer Blade 16 2024, RTX 4090
Asus ROG Strix Scar 18 G834JYR (2024): Intel Core i9-14900HX, 18.00", 3.1 kg
External Review » Asus ROG Strix Scar 18 G834JYR (2024)
MSI Titan 18 HX A14VIG: Intel Core i9-14900HX, 18.00", 3.6 kg
External Review » MSI Titan 18 HX A14VIG
Acer Predator Helios 18 PH18-72-98MW: Intel Core i9-14900HX, 18.00", 3.3 kg
External Review » Acer Predator Helios 18 PH18-72-98MW
Medion Erazer Beast X40 2024: Intel Core i9-14900HX, 17.00", 2.9 kg
External Review » Medion Erazer Beast X40 2024
MSI Vector GP78 HX 13VI: Intel Core i9-13980HX, 17.30", 3 kg
External Review » MSI Vector GP78 HX 13VI
Alienware m18 R1, RTX 4090: Intel Core i9-13900HX, 18.00", 4.2 kg
External Review » Alienware m18 R1, RTX 4090
Schenker XMG Neo 17 E23: Intel Core i9-13900HX, 17.30", 2.8 kg
External Review » SCHENKER XMG Neo 17 E23
Lenovo Legion 9 16IRX8: Intel Core i9-13980HX, 16.00", 2.6 kg
External Review » Lenovo Legion 9 16IRX8
MSI Stealth 17 Studio A13VI, i9-13900H: Intel Core i9-13900H, 17.30", 2.8 kg
External Review » MSI Stealth 17 Studio A13VI, i9-13900H
Origin PC EON17-X 2023: Intel Core i9-13900HX, 17.30", 3.3 kg
External Review » Origin PC EON17-X 2023
MSI Raider GE78 HX 13VI: Intel Core i9-13980HX, 17.00", 3.1 kg
External Review » MSI Raider GE78 HX 13VI
Lenovo Legion Pro 7 16IRX8H, i9-13900HX RTX 4090: Intel Core i9-13900HX, 16.00", 2.8 kg
External Review » Lenovo Legion Pro 7 16IRX8H, i9-13900HX RTX 4090
Asus ROG Zephyrus M16 GU604VY-NM001W: Intel Core i9-13900H, 16.00", 2.3 kg
External Review » Asus ROG Zephyrus M16 GU604VY-NM001W
Acer Predator Triton 17X PTX17-71-99W5: Intel Core i9-13900HX, 17.00", 3 kg
External Review » Acer Predator Triton 17X PTX17-71-99W5
MSI Stealth 17 Studio A13VI: Intel Core i7-13700HX, 17.30", 2.8 kg
External Review » MSI Stealth 17 Studio A13VI
Asus ROG Strix Scar 17 G733PY-XS96: AMD Ryzen 9 7945HX, 17.30", 2.9 kg
External Review » Asus ROG Strix Scar 17 G733PY-XS96
Aorus 17X AZF: Intel Core i9-13900HX, 17.30", 2.9 kg
External Review » Aorus 17X AZF
Asus ROG Strix Scar 17 G733PY-LL002W: AMD Ryzen 9 7945HX, 17.30", 3 kg
External Review » Asus ROG Strix Scar 17 G733PY-LL002W
Asus Zephyrus Duo 16 GX650PY-NM006W: AMD Ryzen 9 7945HX, 16.00", 2.7 kg
External Review » Asus Zephyrus Duo 16 GX650PY-NM006W
Asus ROG Zephyrus G14 GA402XY: AMD Ryzen 9 7940HS, 14.00", 1.7 kg
External Review » Asus ROG Zephyrus G14 GA402XY
Razer Blade 18 2023, RTX 4090: Intel Core i9-13950HX, 18.00", 3.2 kg
External Review » Razer Blade 18 2023, RTX 4090
Alienware m18 R1: Intel Core i9-13980HX, 18.00", 3.9 kg
External Review » Alienware m18 R1
Asus ROG Strix Scar 16 G634JY-NM001W: Intel Core i9-13980HX, 16.00", 2.5 kg
External Review » Asus ROG Strix Scar 16 2023 G634JY-NM001W
Schenker XMG Neo 16 E23: Intel Core i9-13900HX, 16.00", 2.5 kg
External Review » Schenker XMG Neo 16 E23
Medion Erazer Beast X40: Intel Core i9-13900HX, 17.00", 2.9 kg
External Review » Medion Erazer Beast X40
MSI Titan GT77 HX 13VI: Intel Core i9-13950HX, 17.30", 3.5 kg
External Review » MSI Titan GT77 HX 13VI
MSI Titan GT77 HX 13VI-044: Intel Core i9-13980HX, 17.30", 3.3 kg
External Review » MSI Titan GT77 HX 13VI-044
Razer Blade 16 Early 2023 RTX 4090: Intel Core i9-13950HX, 16.00", 2.5 kg
External Review » Razer Blade 16 Early 2023 RTX 4090
Asus ROG Strix Scar 18 2023 G834JY-N6005W: Intel Core i9-13980HX, 18.00", 3.1 kg
External Review » Asus ROG Strix Scar 18 2023 G834JY-N6005W
Asus ROG Zephyrus M16 GU604VY-NM042X: Intel Core i9-13900H, 16.00", 2.3 kg
External Review » Asus ROG Zephyrus M16 GU604VY-NM042X
Schenker Key 17 Pro (M24): Intel Core i9-14900HX, 17.30", 3.4 kg
» Schenker Key 17 Pro M24 工作站:兼具高端游戏笔记本电脑和双通道 Thunderbolt 5 功能
Asus Zephyrus Duo 16 GX650PY-NM006W: AMD Ryzen 9 7945HX, 16.00", 2.7 kg
» 华硕为ROG Zephyrus Duo 16配备了AMD的Ryzen 9 7945HX,这是目前最快的移动处理器。
» Comparison of GPUs
Detailed list of all laptop GPUs sorted by class and performance.
» Benchmark List
Sort and restrict laptop GPUs based on performance in synthetic benchmarks.
» Notebook Gaming List
Playable games for each graphics card and their average FPS results.
* Approximate position of the graphics adapter
» Notebookcheck多媒体笔记本电脑Top 10排名
» Notebookcheck游戏笔记本电脑Top 10排名
» Notebookcheck低价办公/商务笔记本电脑Top 10排名
» Notebookcheck高端办公/商务笔记本电脑Top 10排名
» Notebookcheck工作站笔记本电脑Top 10排名
» Notebookcheck亚笔记本电脑Top 10排名
» Notebookcheck超级本产品Top 10排名
» Notebookcheck变形本产品Top 10排名
» Notebookcheck平板电脑Top 10排名
» Notebookcheck智能手机Top 10排名
» Notebookcheck评测过最出色的笔记本电脑屏幕
» Notebookcheck售价500欧元以下笔记本电脑Top 10排名
» Notebookcheck售价300欧元以下笔记本电脑Top 10排名