华为MateBook 14s i7笔记本评测--强大的副笔记本与3:2触摸屏
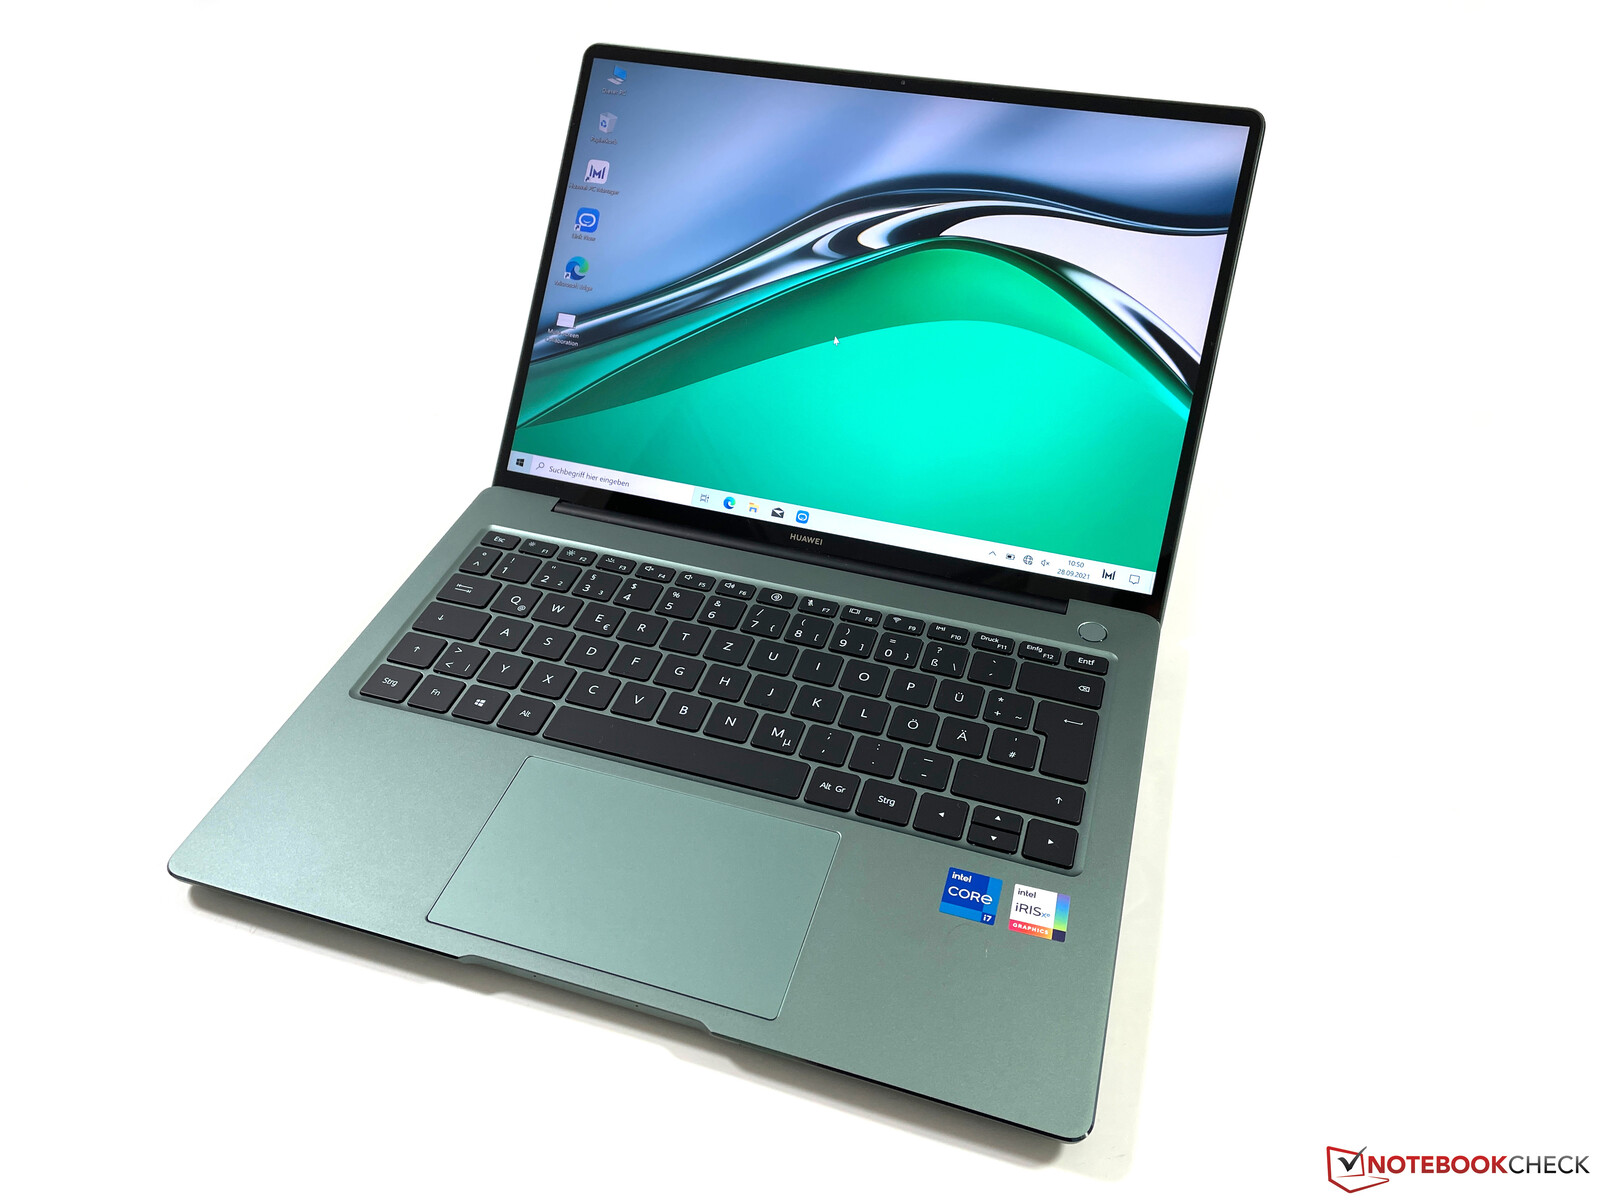
华为通过新的MateBook 14s扩大了其MateBook系列,这是一款高质量的子笔记本,拥有新的14.2英寸高分辨率触摸屏以及强大的英特尔处理器,TDP为45W。这意味着MateBook 14s是华为自己的一个大竞争对手MateBook X Pro,它目前配备的是较慢的Tiger Lake-U CPU。
华为在发布会上提供了两种配置,只在存储容量方面有所不同。1299欧元的入门级机型配备了512GB固态硬盘存储,而1499欧元的机型则配备了1TB PCI-SSD。除此以外,这两个型号的产品拥有相同的组件。酷睿i7-11370H与Iris Xe Graphics G7 (96 EUs)16GB内存,以及2.5K触摸屏。更多华为MateBook评论。
potential competitors in comparison
Rating | Date | Model | Weight | Height | Size | Resolution | Price |
|---|---|---|---|---|---|---|---|
| 88.6 % v7 (old) | 10 / 2021 | Huawei MateBook 14s i7 i7-11370H, Iris Xe G7 96EUs | 1.4 kg | 16.7 mm | 14.20" | 2520x1680 | |
| 87.8 % v7 (old) | 03 / 2021 | Huawei MateBook X Pro 2021 i7-1165G7, Iris Xe G7 96EUs | 1.3 kg | 14.6 mm | 13.90" | 3000x2000 | |
| 86.3 % v7 (old) | 12 / 2020 | Huawei MateBook 14 2020 Intel i7-10510U, GeForce MX350 | 1.5 kg | 15.9 mm | 14.00" | 2160x1440 | |
| 86 % v7 (old) | 08 / 2021 | Lenovo Yoga Slim 7 Pro 14ACH5 R9 5900HX, Vega 8 | 1.3 kg | 16.9 mm | 14.00" | 2880x1800 | |
| 89.1 % v7 (old) | Schenker Vision 14 i7-1165G7, Iris Xe G7 96EUs | 1 kg | 15.6 mm | 14.00" | 2880x1800 | ||
| 87.4 % v7 (old) | 12 / 2021 | Dell XPS 13 9310 Core i7 4K i7-1185G7, Iris Xe G7 96EUs | 1.3 kg | 14.8 mm | 13.40" | 3840x2400 | |
| 91.1 % v7 (old) | 12 / 2020 | Apple MacBook Air 2020 M1 Entry M1, M1 7-Core GPU | 1.3 kg | 16.1 mm | 13.30" | 2560x1600 |
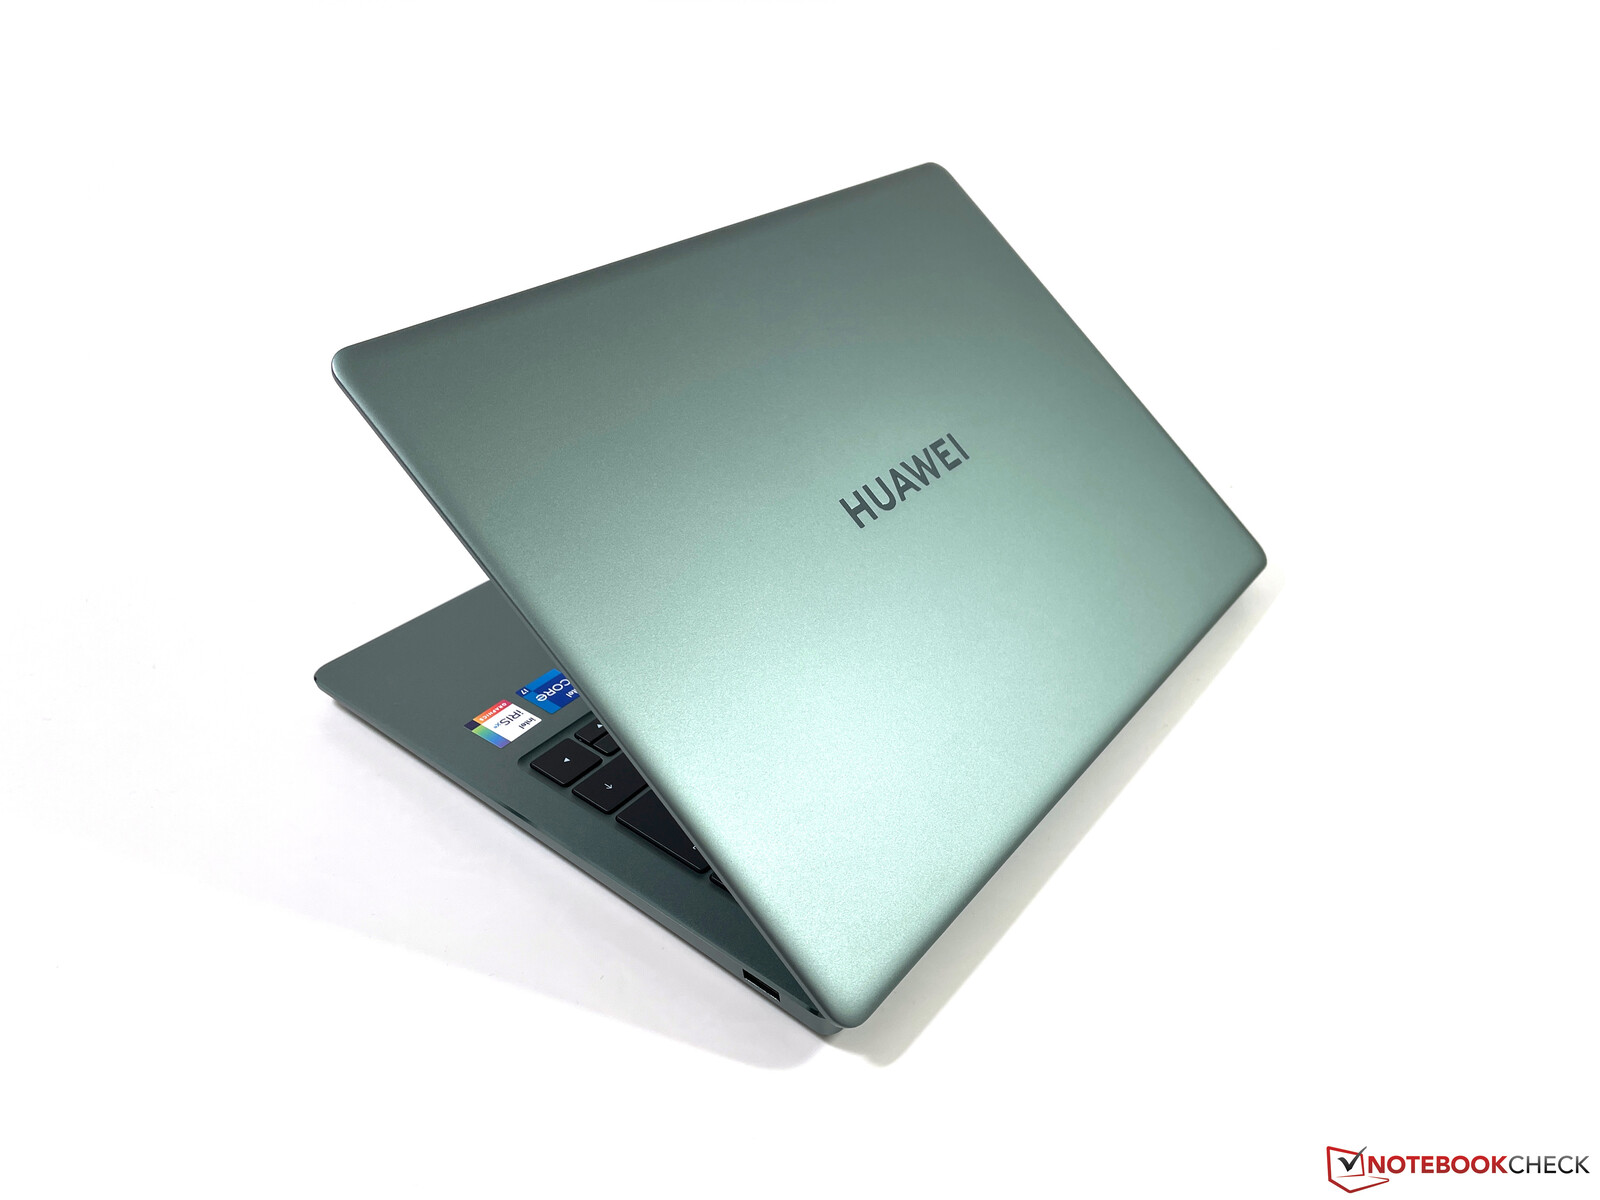
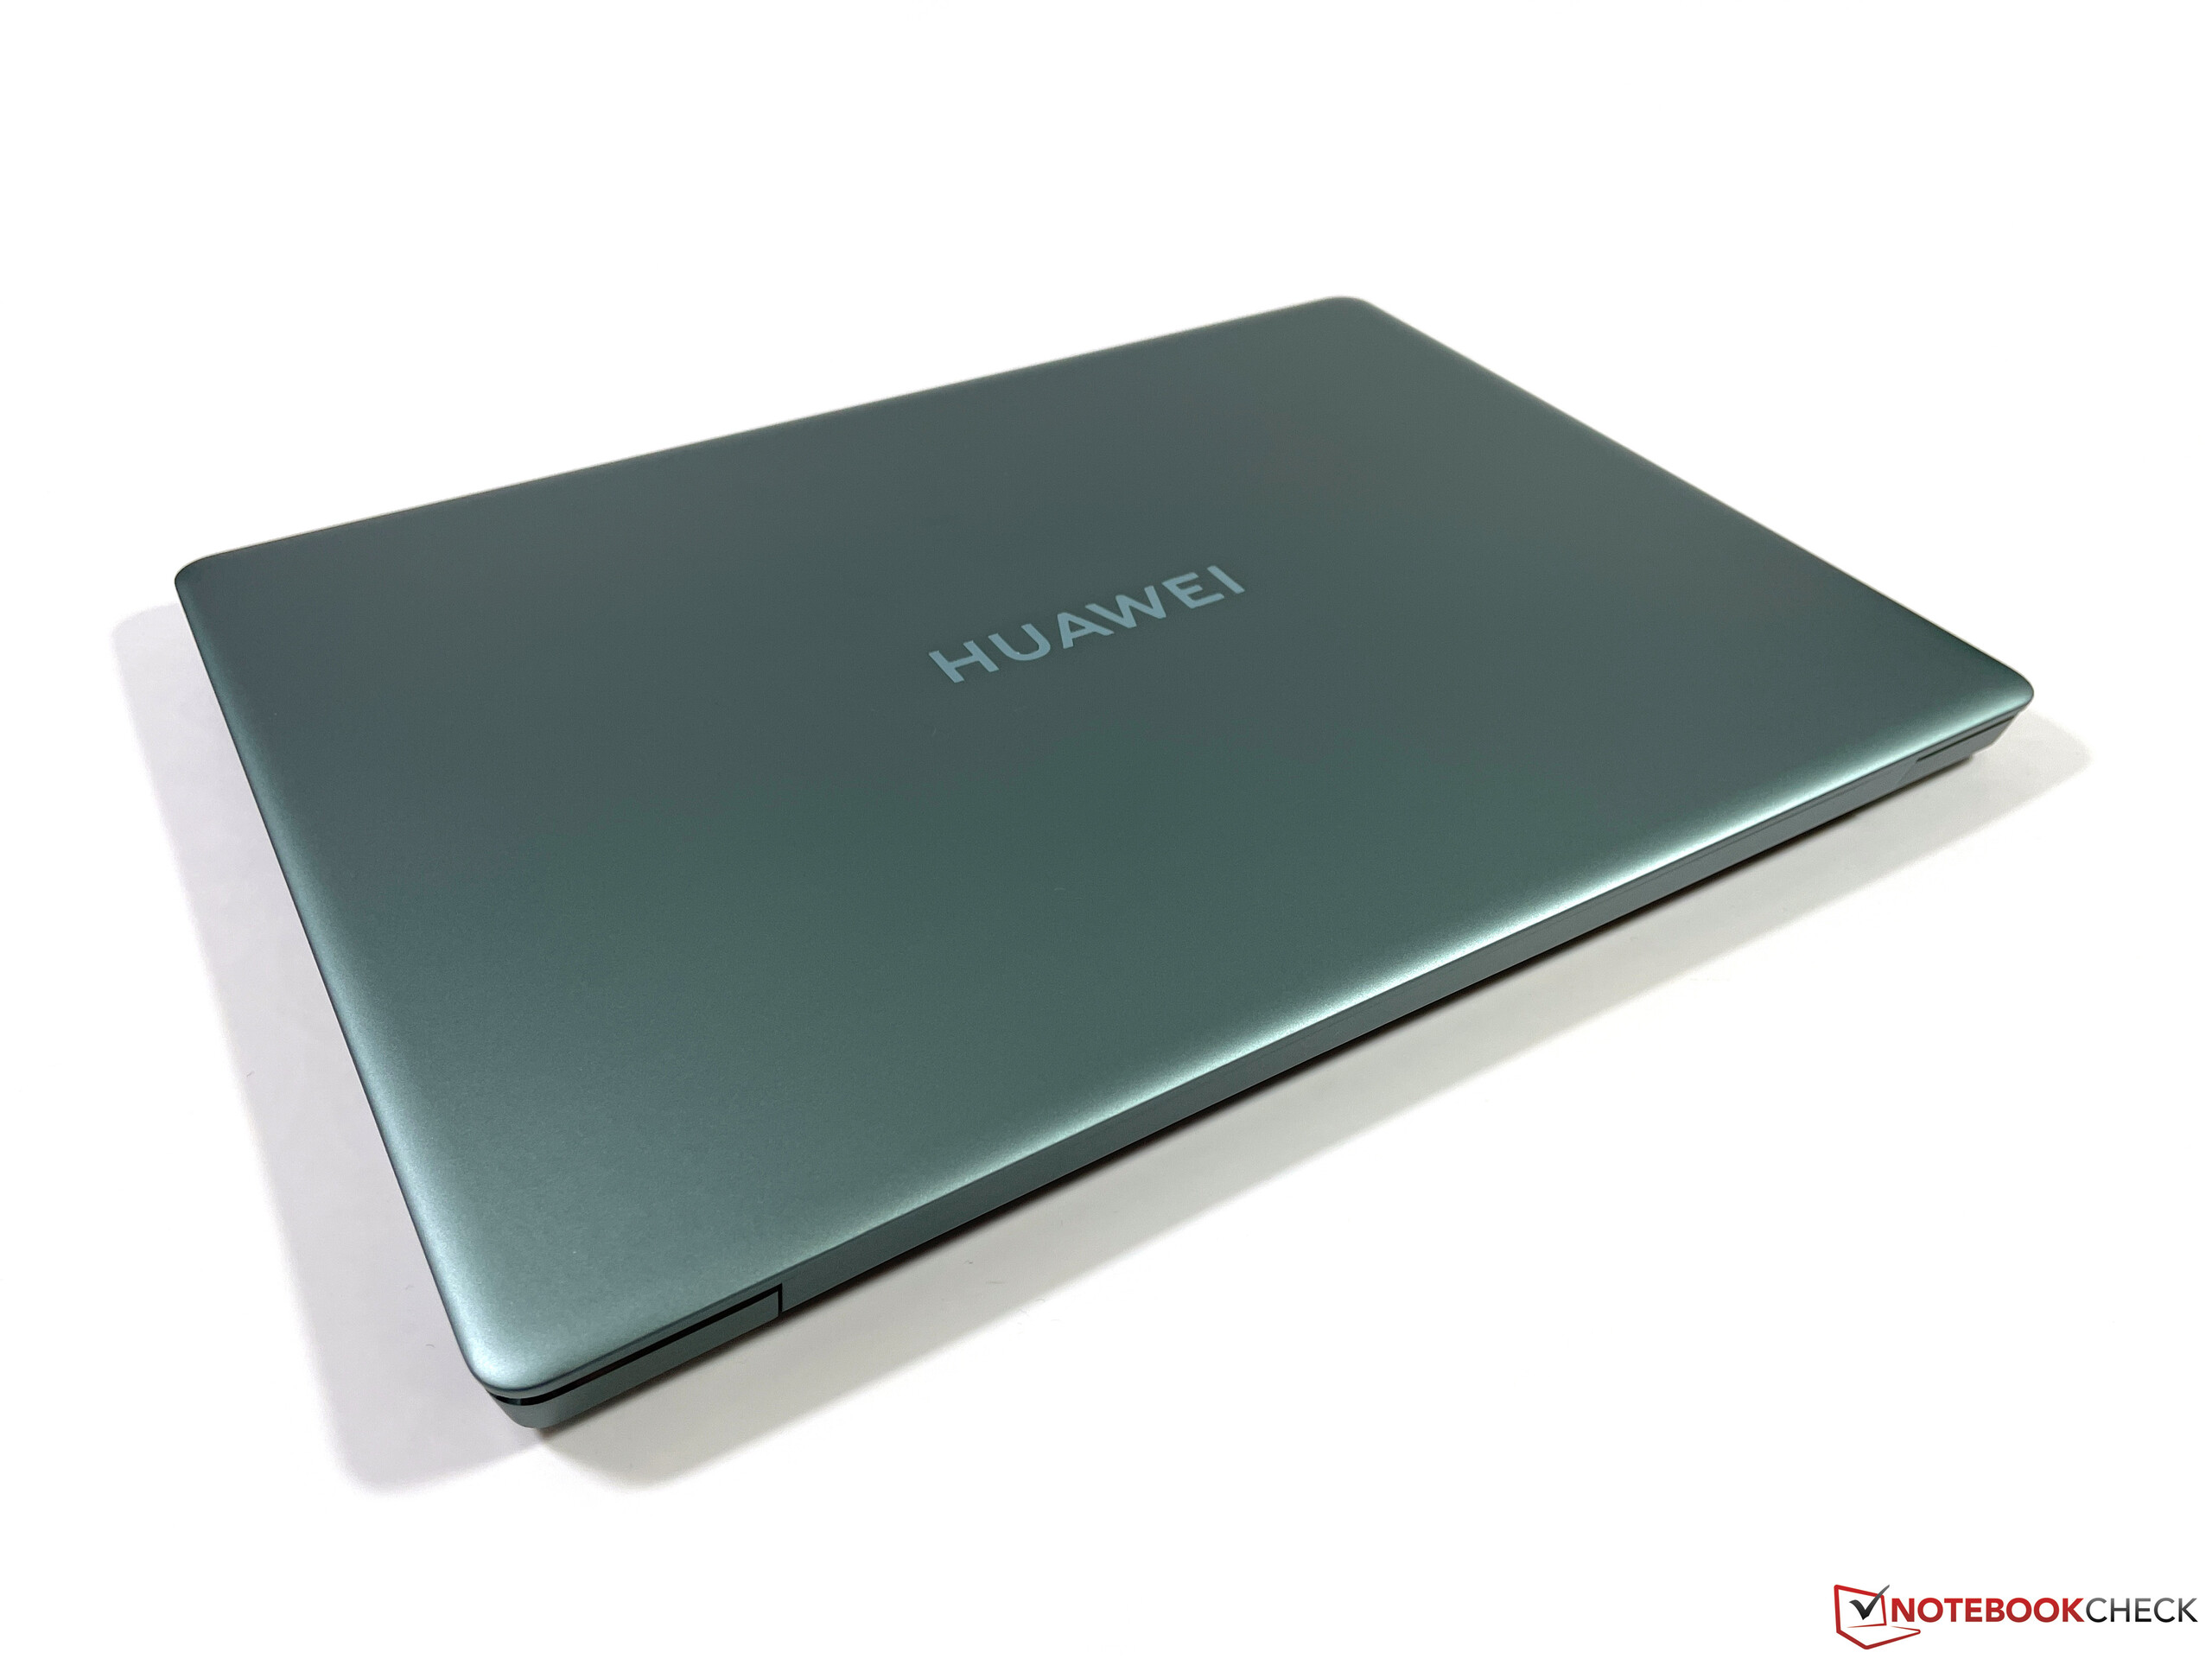
外壳 - MateBook,有大量的铝材
新款MateBook 14s的外壳设计非常类似于MateBook X Pro以及标准的MateBook 14.典型的元素,如基本单元周围的抛光边缘,圆角,以及前面的轻微压痕和键盘上方的电源按钮,很容易识别这个设备是华为的笔记本电脑。由于边框非常窄(4.4毫米),这款笔记本看起来非常现代。除了标准的太空灰颜色,你可以再次得到MateBook的绿色,但与MateBook X Pro(翡翠绿)相反,现在是独家颜色云杉绿,在直接比较中看起来更内敛,没有那么丰富。
华为几乎完全使用金属(铝)进行数控加工的机箱,只有铰链的盖子是由塑料制成的。笔记本电脑的构造完美,稳定性也很好。扭曲的尝试对底座单元来说没有问题,也没有恼人的吱嘎声。当你用很大的力气打字的时候,你只能稍微凹陷一下底座单元。指纹对哑光表面来说不是什么大问题。
盖子得益于额外的玻璃层,扭动的尝试再次没有挑战;即使是集中的压力也不会导致图片失真。你可以用一只手打开盖子,铰链调整得很好,但当你调整盖子的开启角度时,它们不能完全防止一些反弹。最大的开启角度是~145度。
新款MateBook 14s是我们对比组中最大的设备,但它也有14.2英寸的大屏幕。当涉及到机箱的高度时,所有的对手都基本处于同一水平线上。
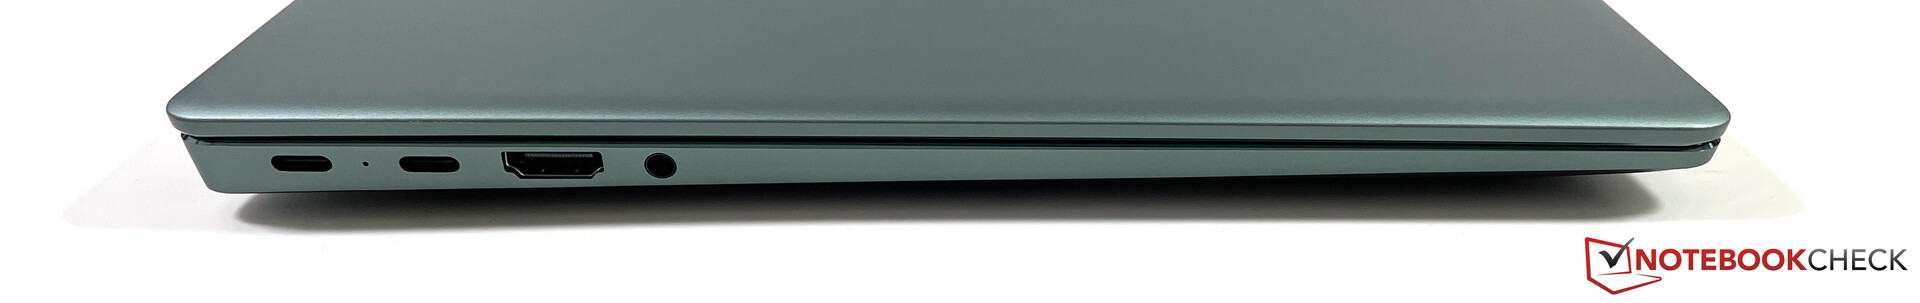
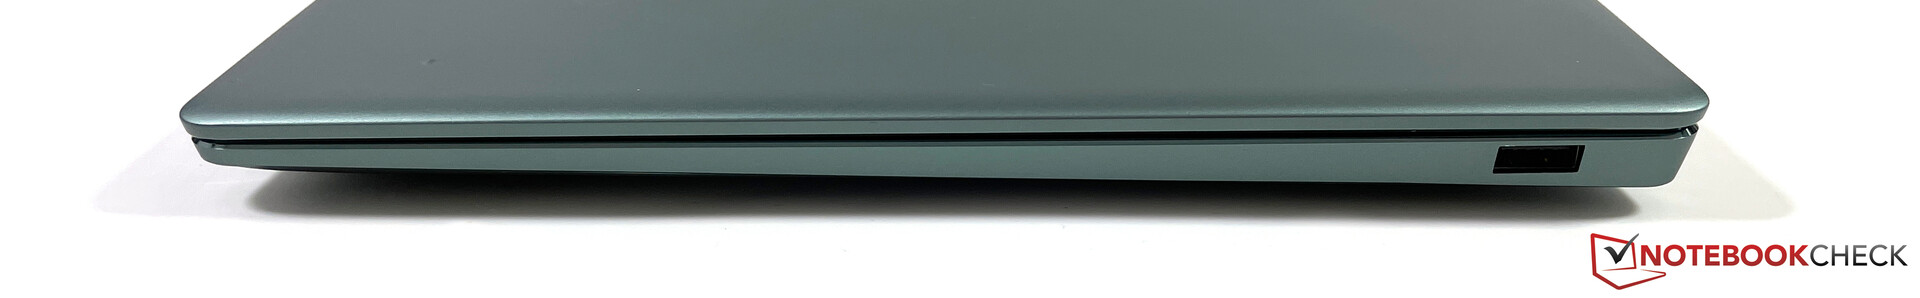
连接性 - 华为不包括Thunderbolt
华为为MateBook 14s配备了两个USB-C接口和一个普通USB-A接口。类似于华为MateBook X Pro华为MateBook 14s没有官方的Thunderbolt认证,也没有给我们关于这两个端口规格的任何确切信息。它们支持DisplayPort-ALT模式以及Power Delivery,所以我们相信它们支持10Gbps的USB 3.2 Gen.2。最后,有一个全尺寸的HDMI输出,以及3.5毫米立体声插孔。
沟通
无线模块是目前的英特尔AX201卡,它支持现代Wi-Fi 6标准(802.11ax,2x2)以及蓝牙5.1。我们与路由器Netgear Nighthawk RAX120的标准化测试确定了非常高的传输速率,在我们的审查期间,我们也没有发现Netgear路由器或Fritz!Box 7590(Wi-Fi 5)有任何限制。
网络摄像头
华为设法在显示屏上方的 "正常 "位置安装了网络摄像头,这意味着隐藏在键盘内的网络摄像头的时代似乎已经结束。另一方面,质量仍然相当平庸;720p的传感器完成了它的工作,但即使在光线良好的情况下,它也不能拍出像样的照片。


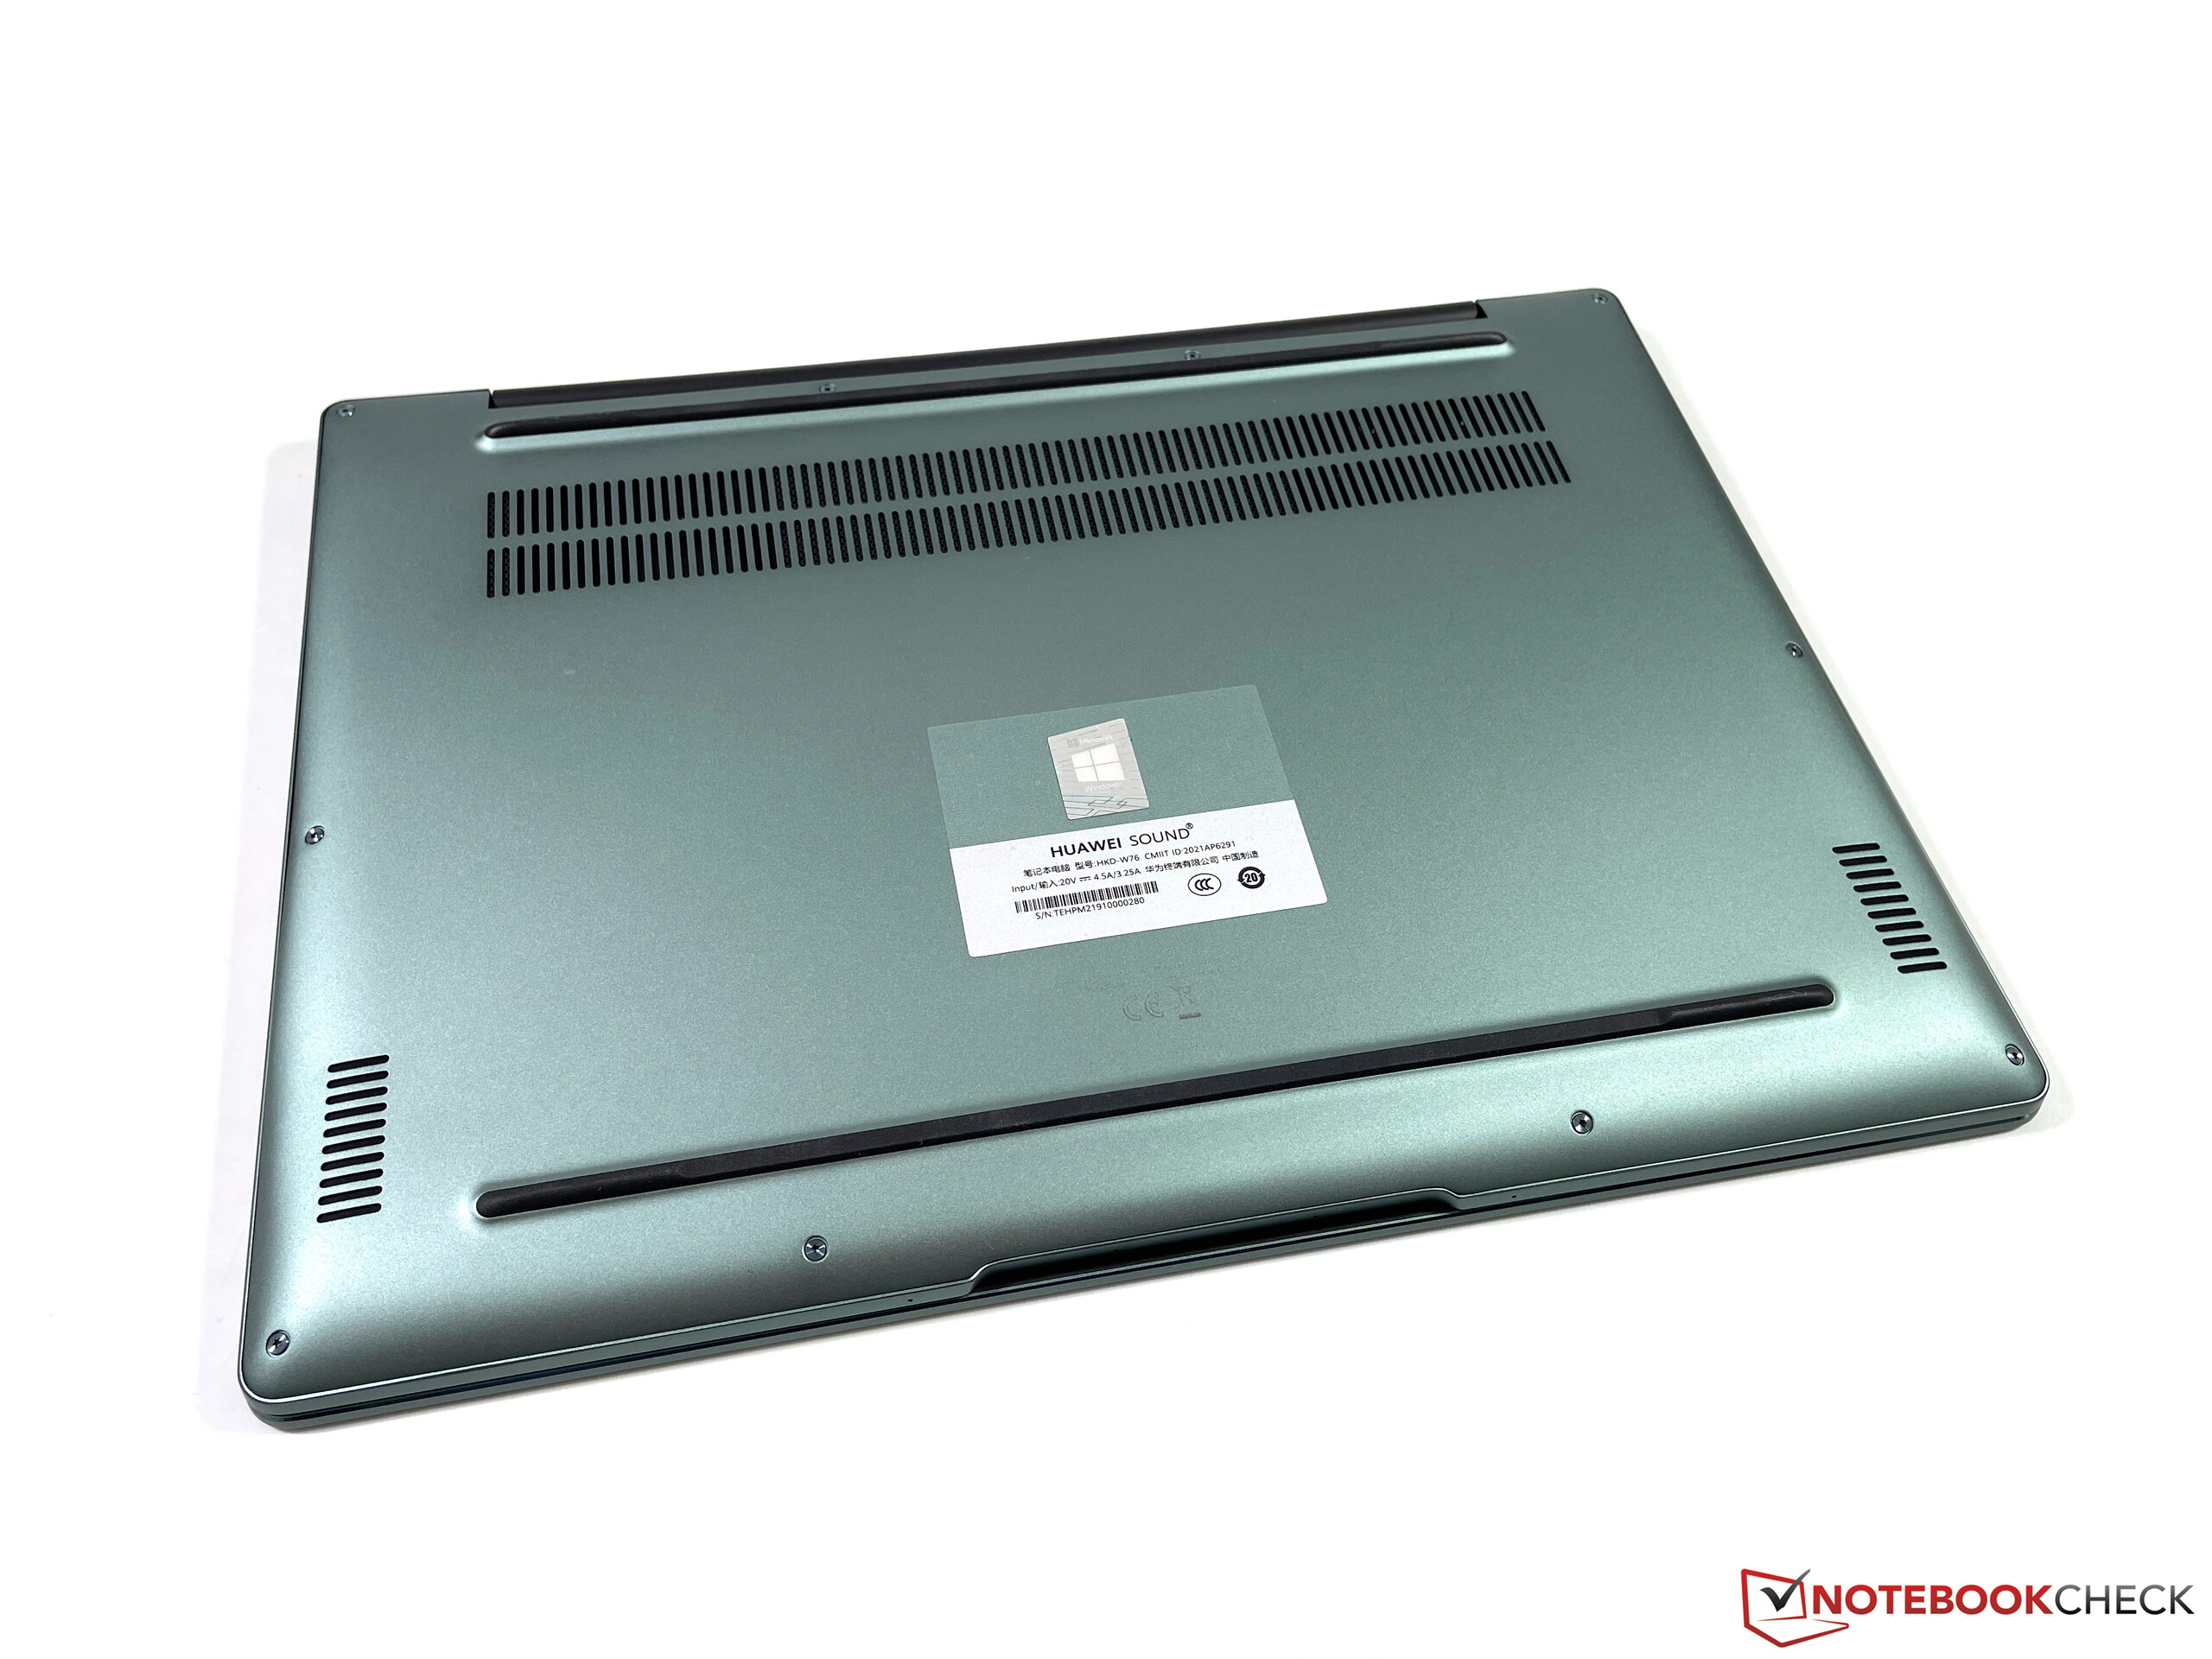
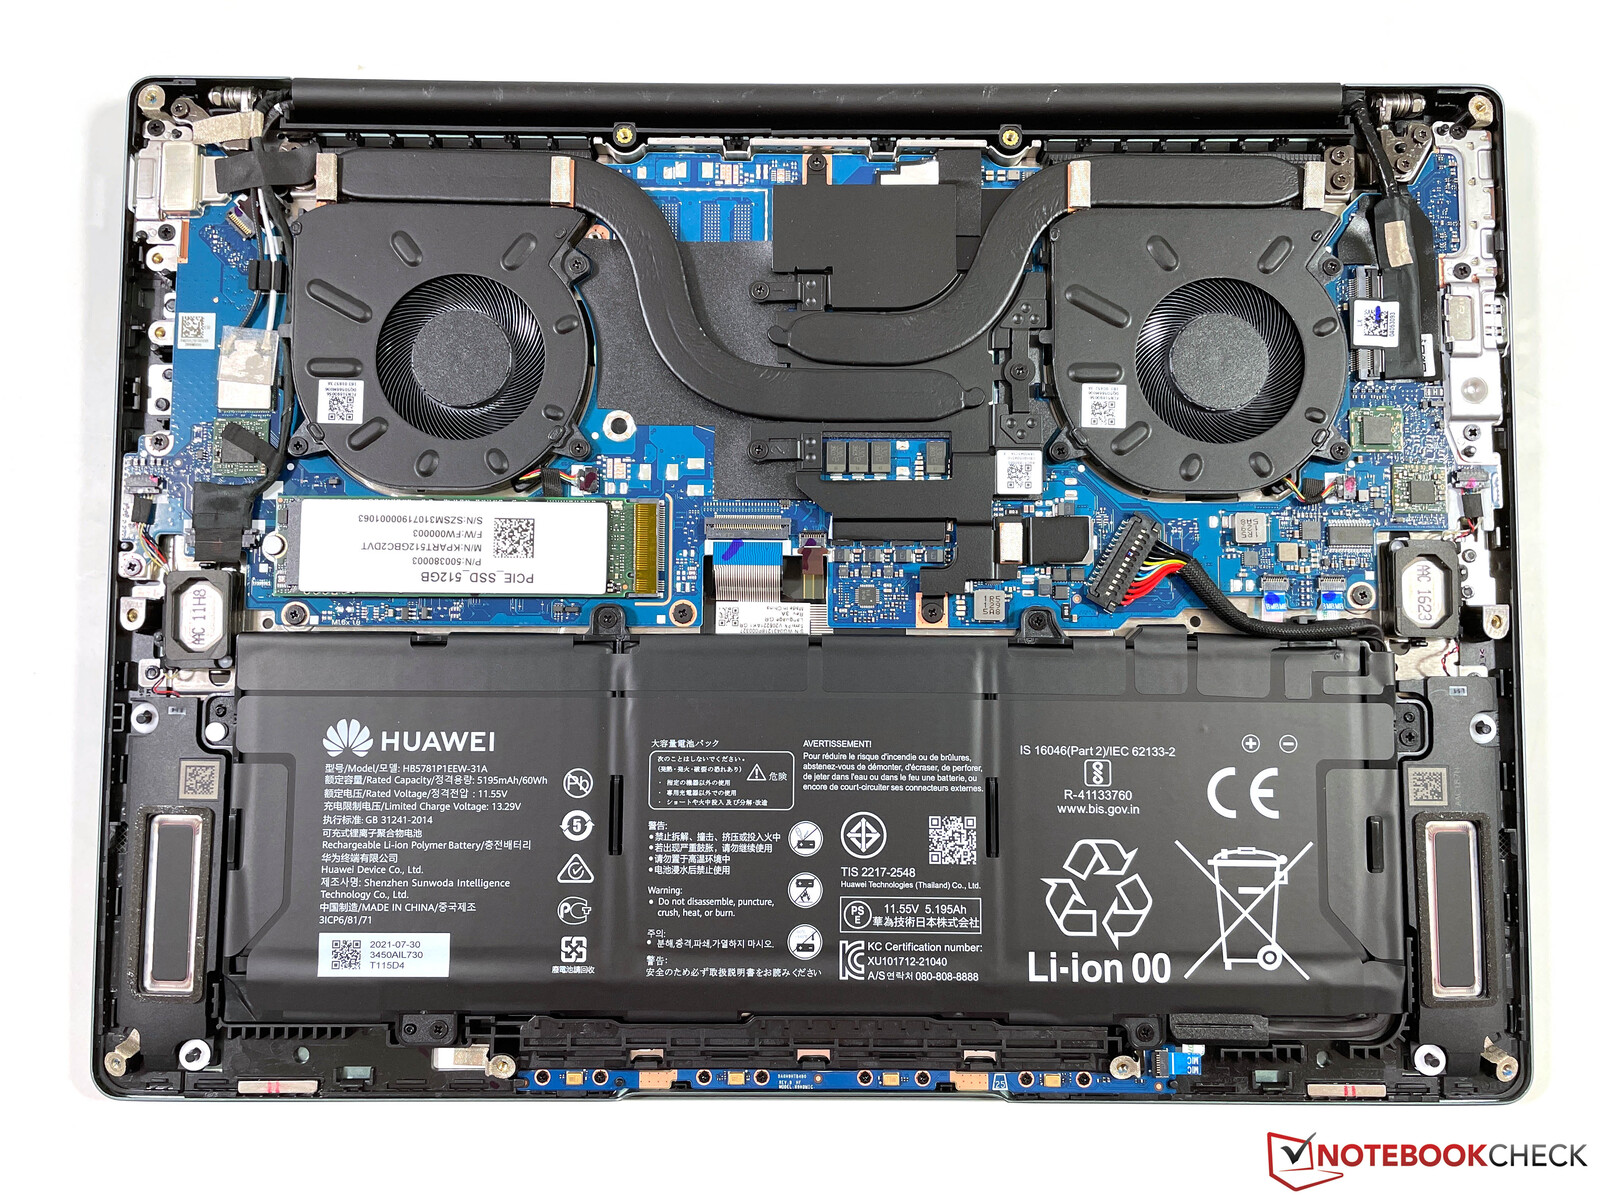
维护
MateBook 14s的底板由几个Torx螺丝(T5)固定,很容易拆卸。不过,除了清洗风扇,你只能更换M.2-2280固态硬盘。所有其他组件,包括内存和Wi-Fi模块都焊接在主板上。
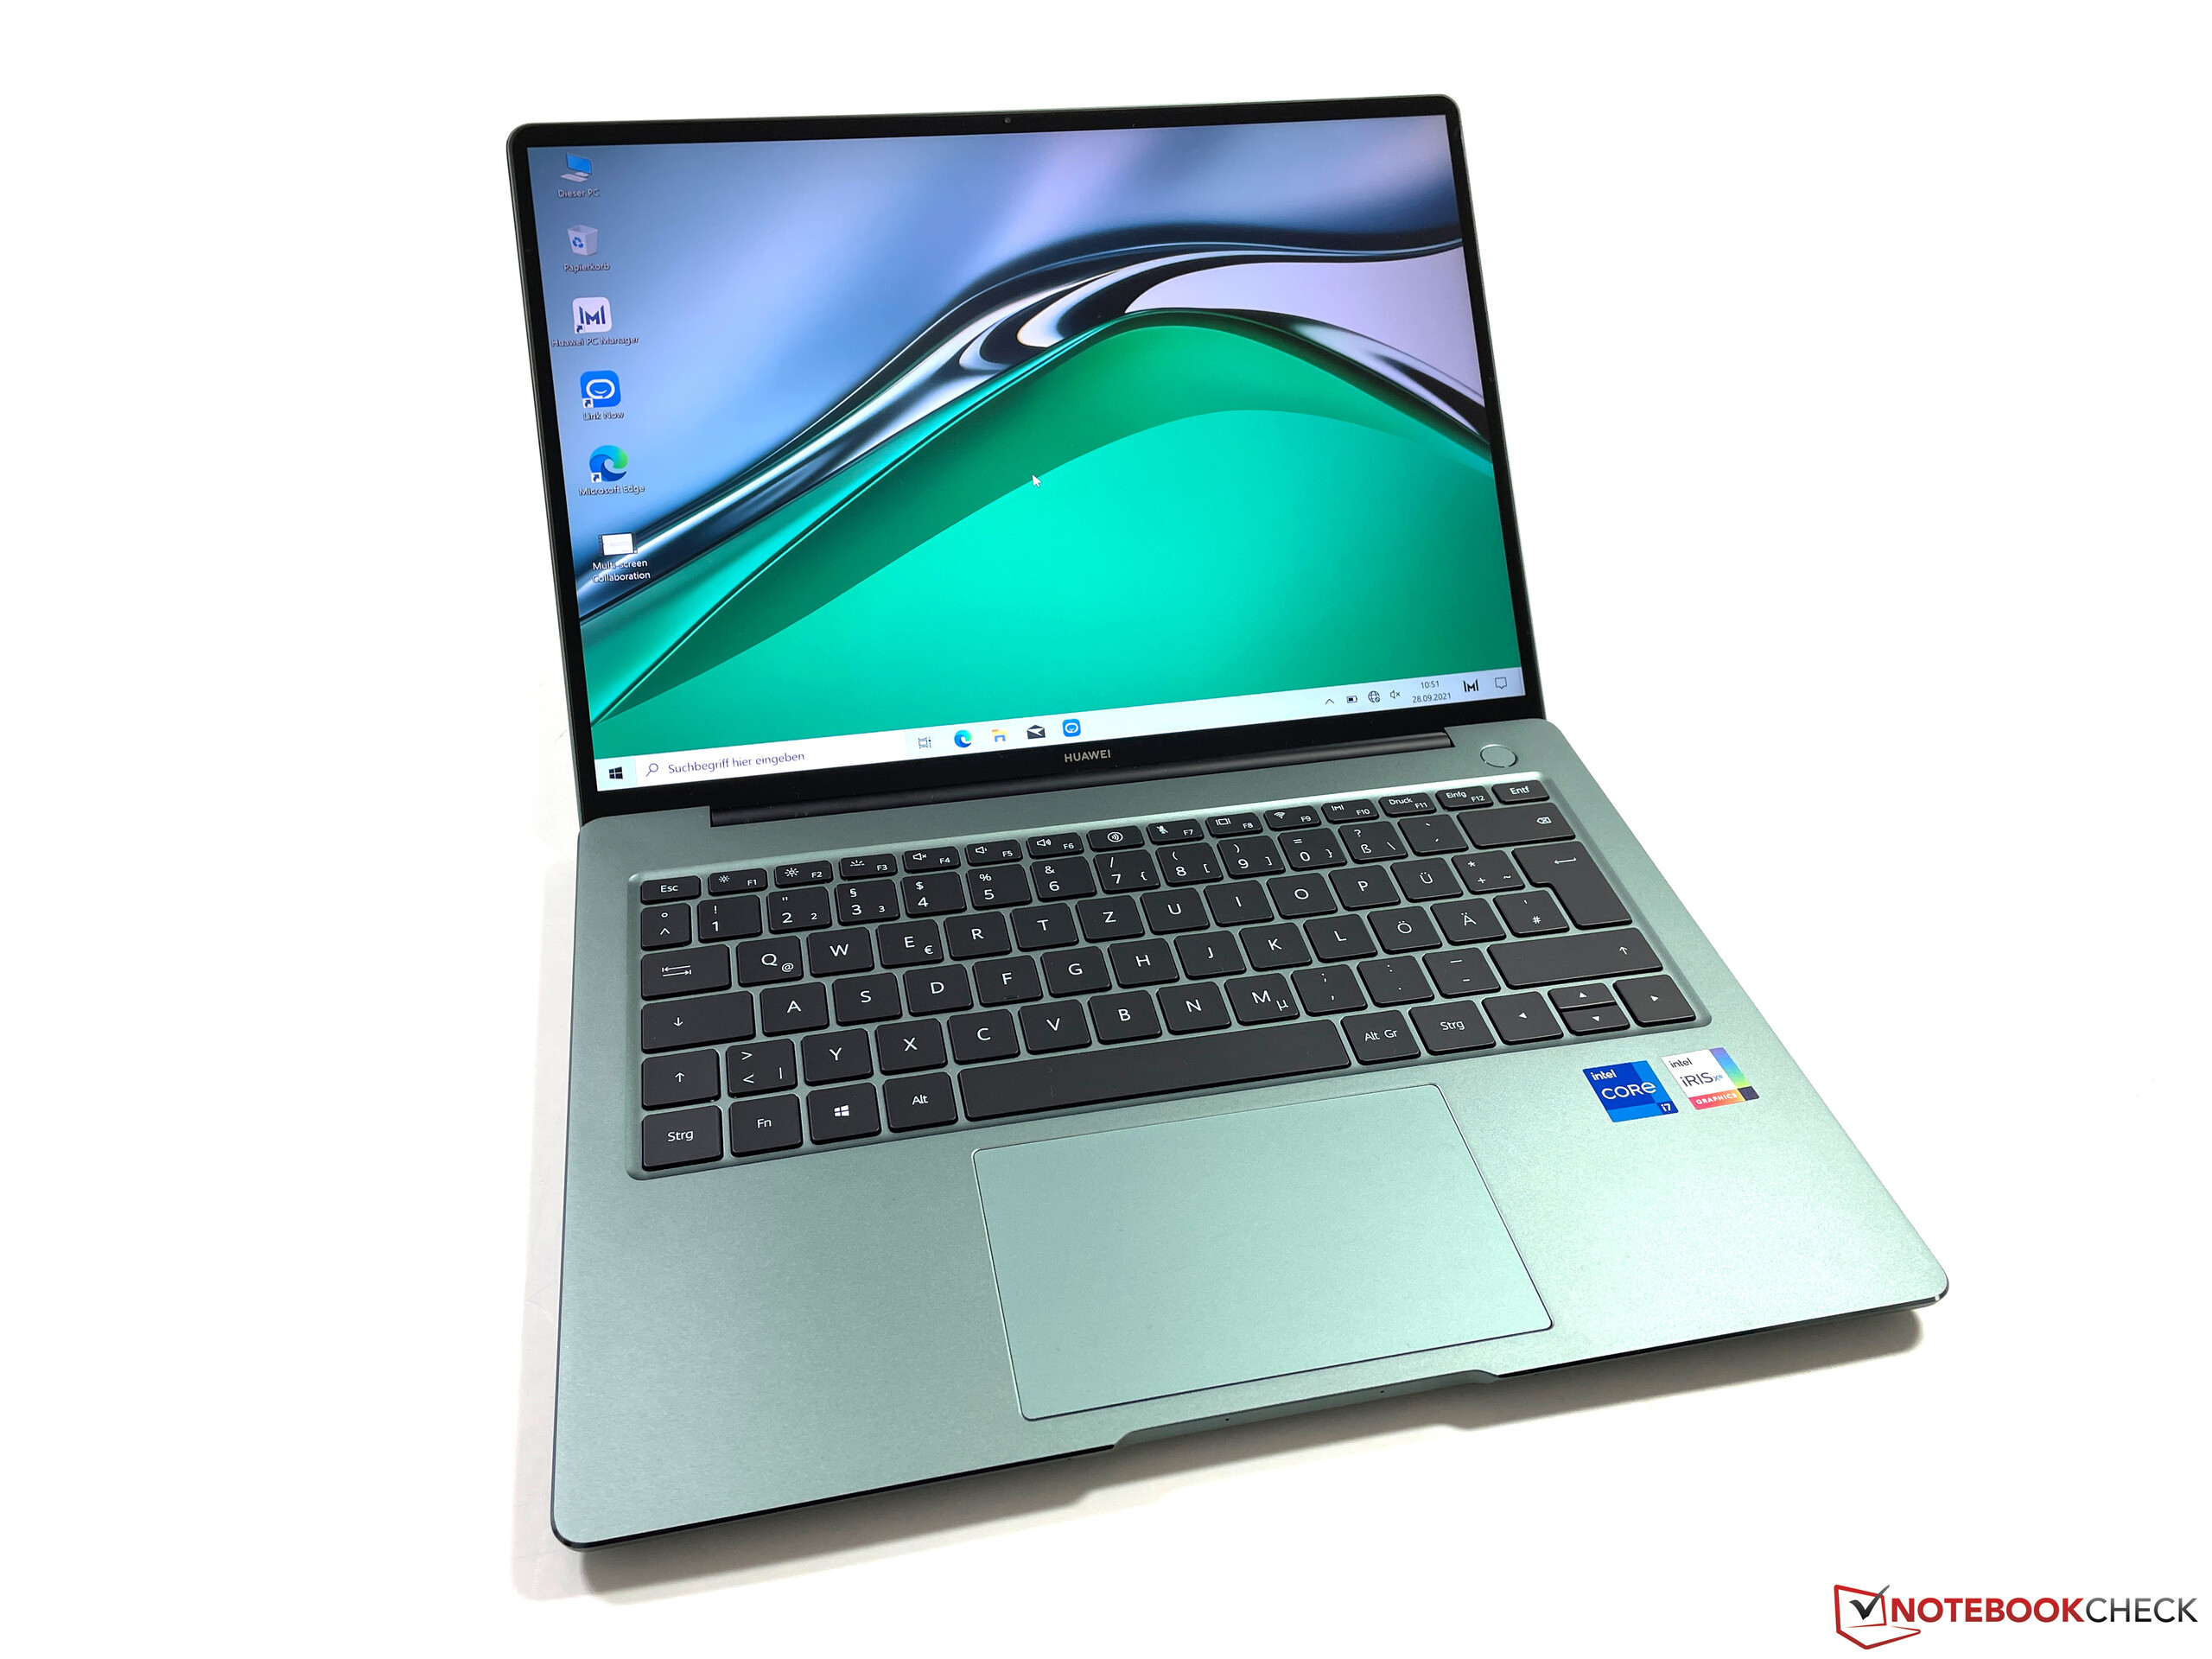
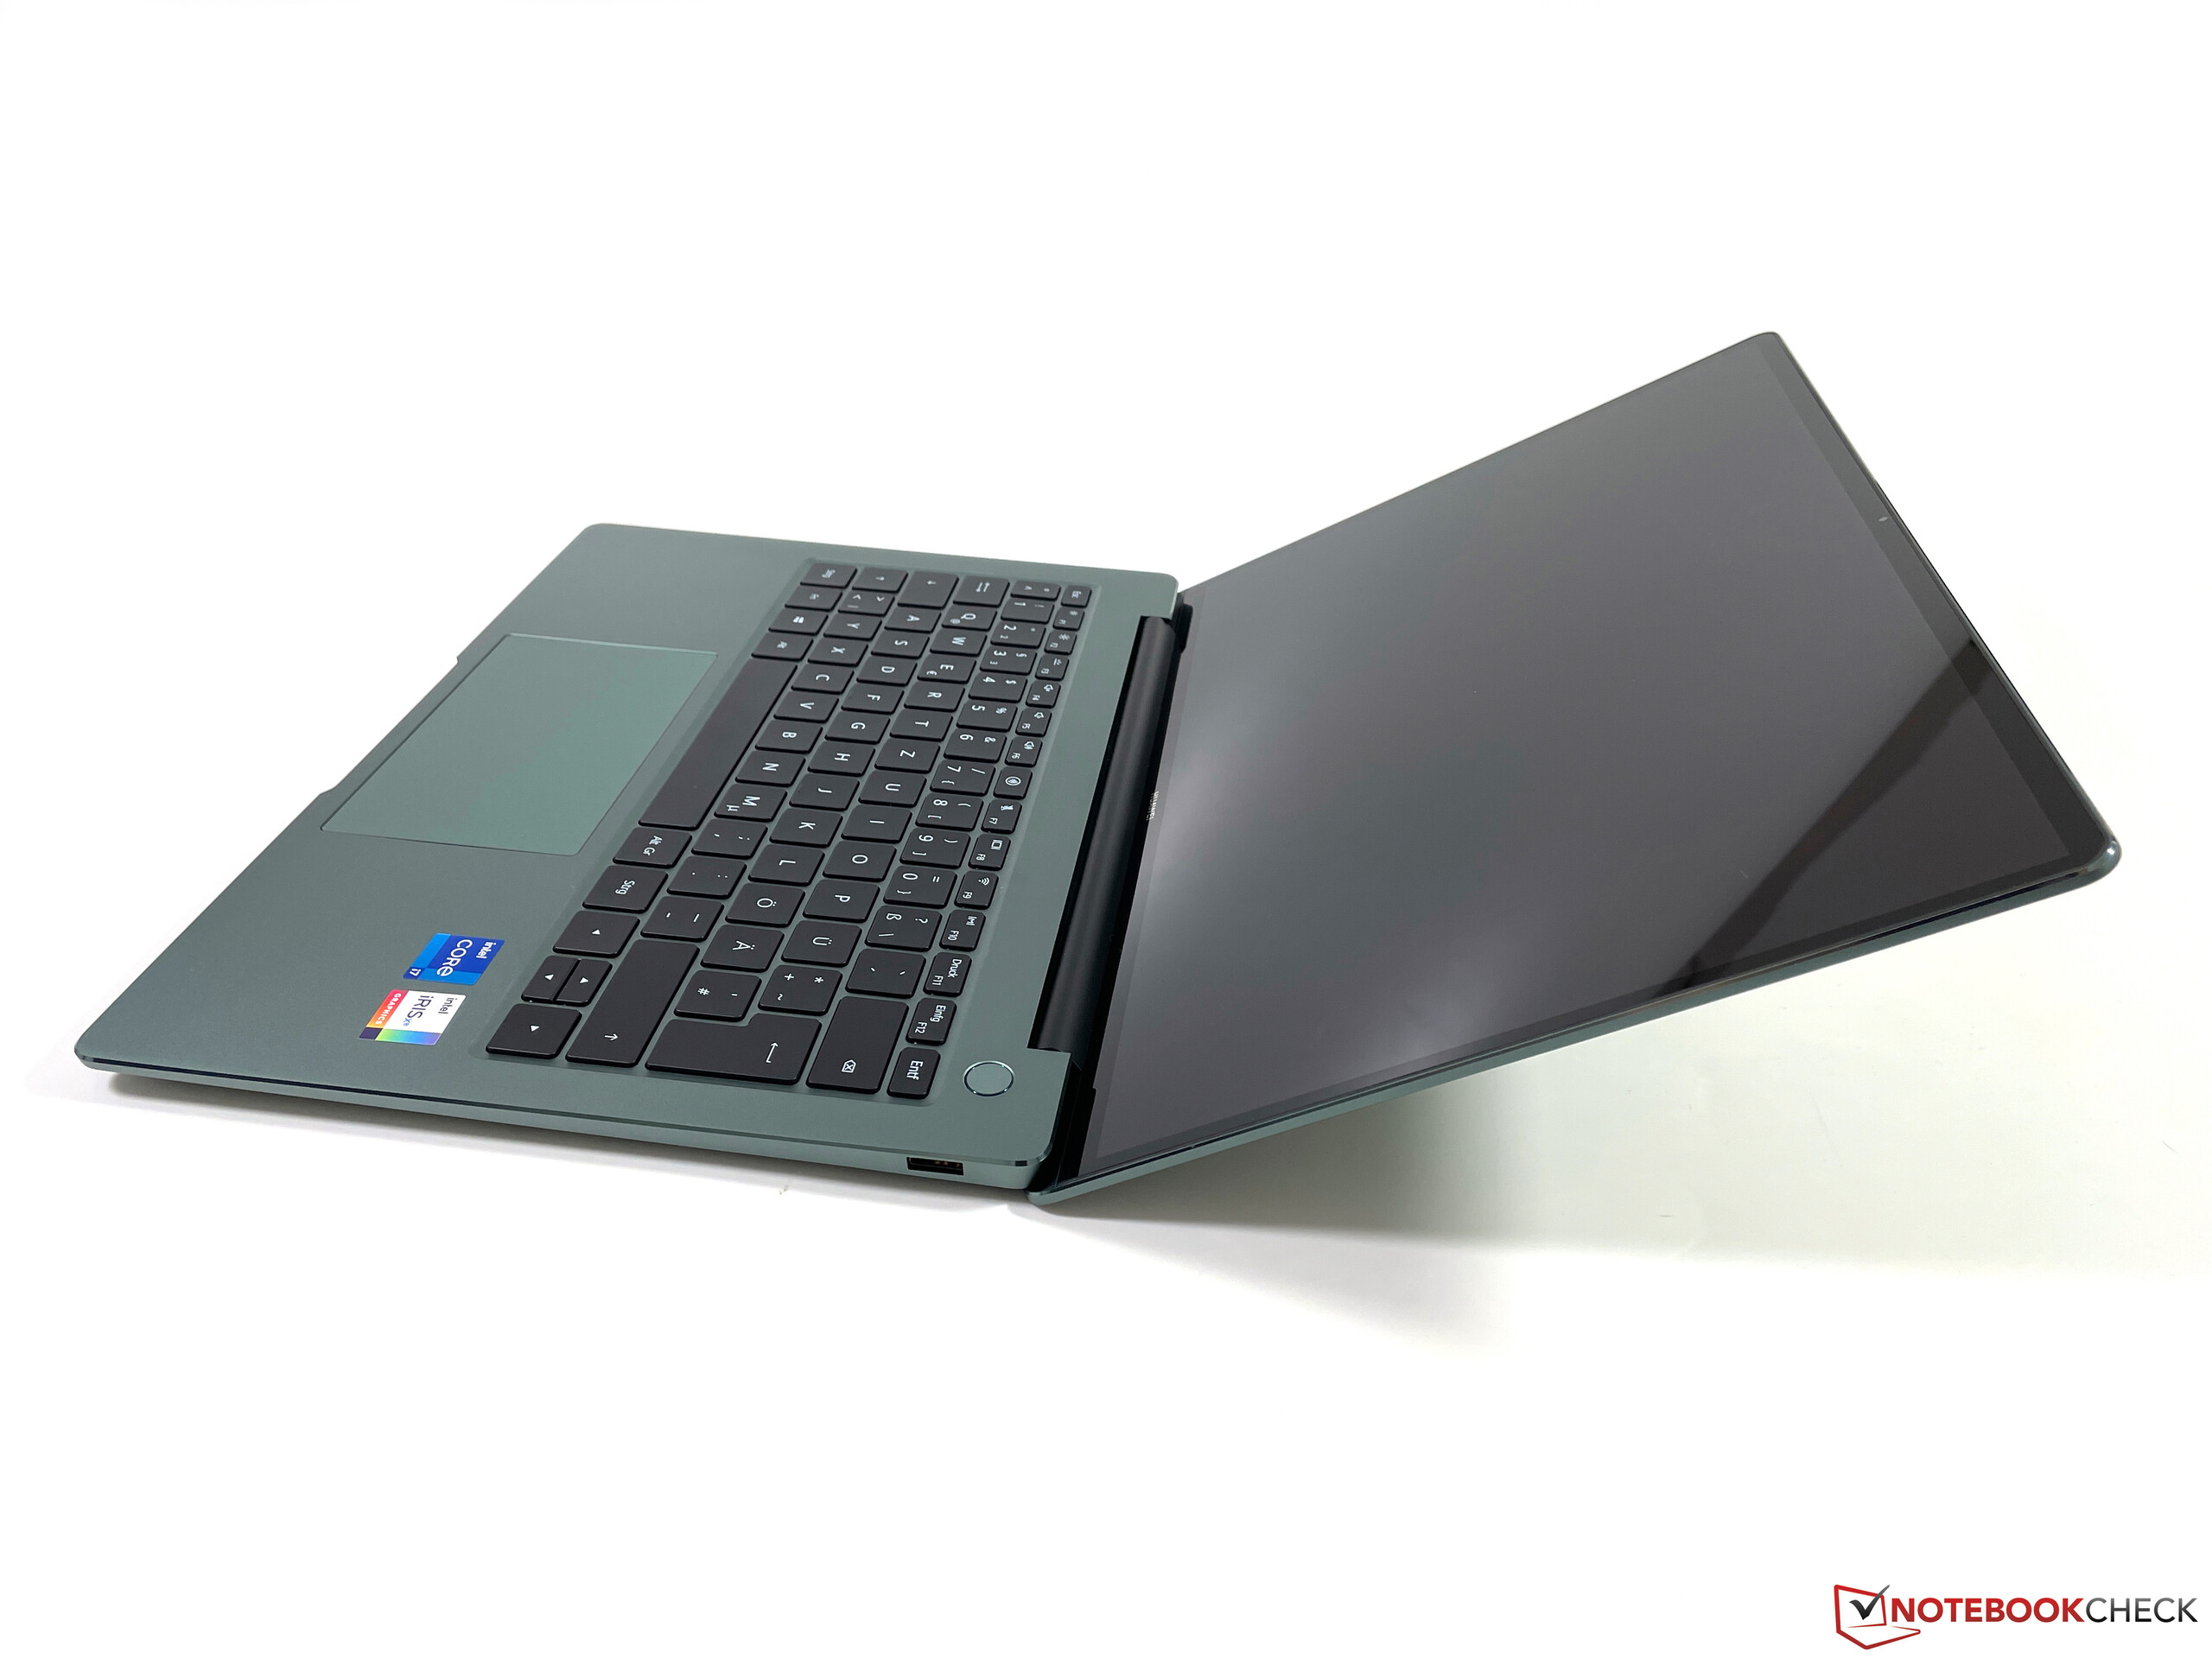
输入设备 - MateBook 14s,键程1.5毫米
键盘
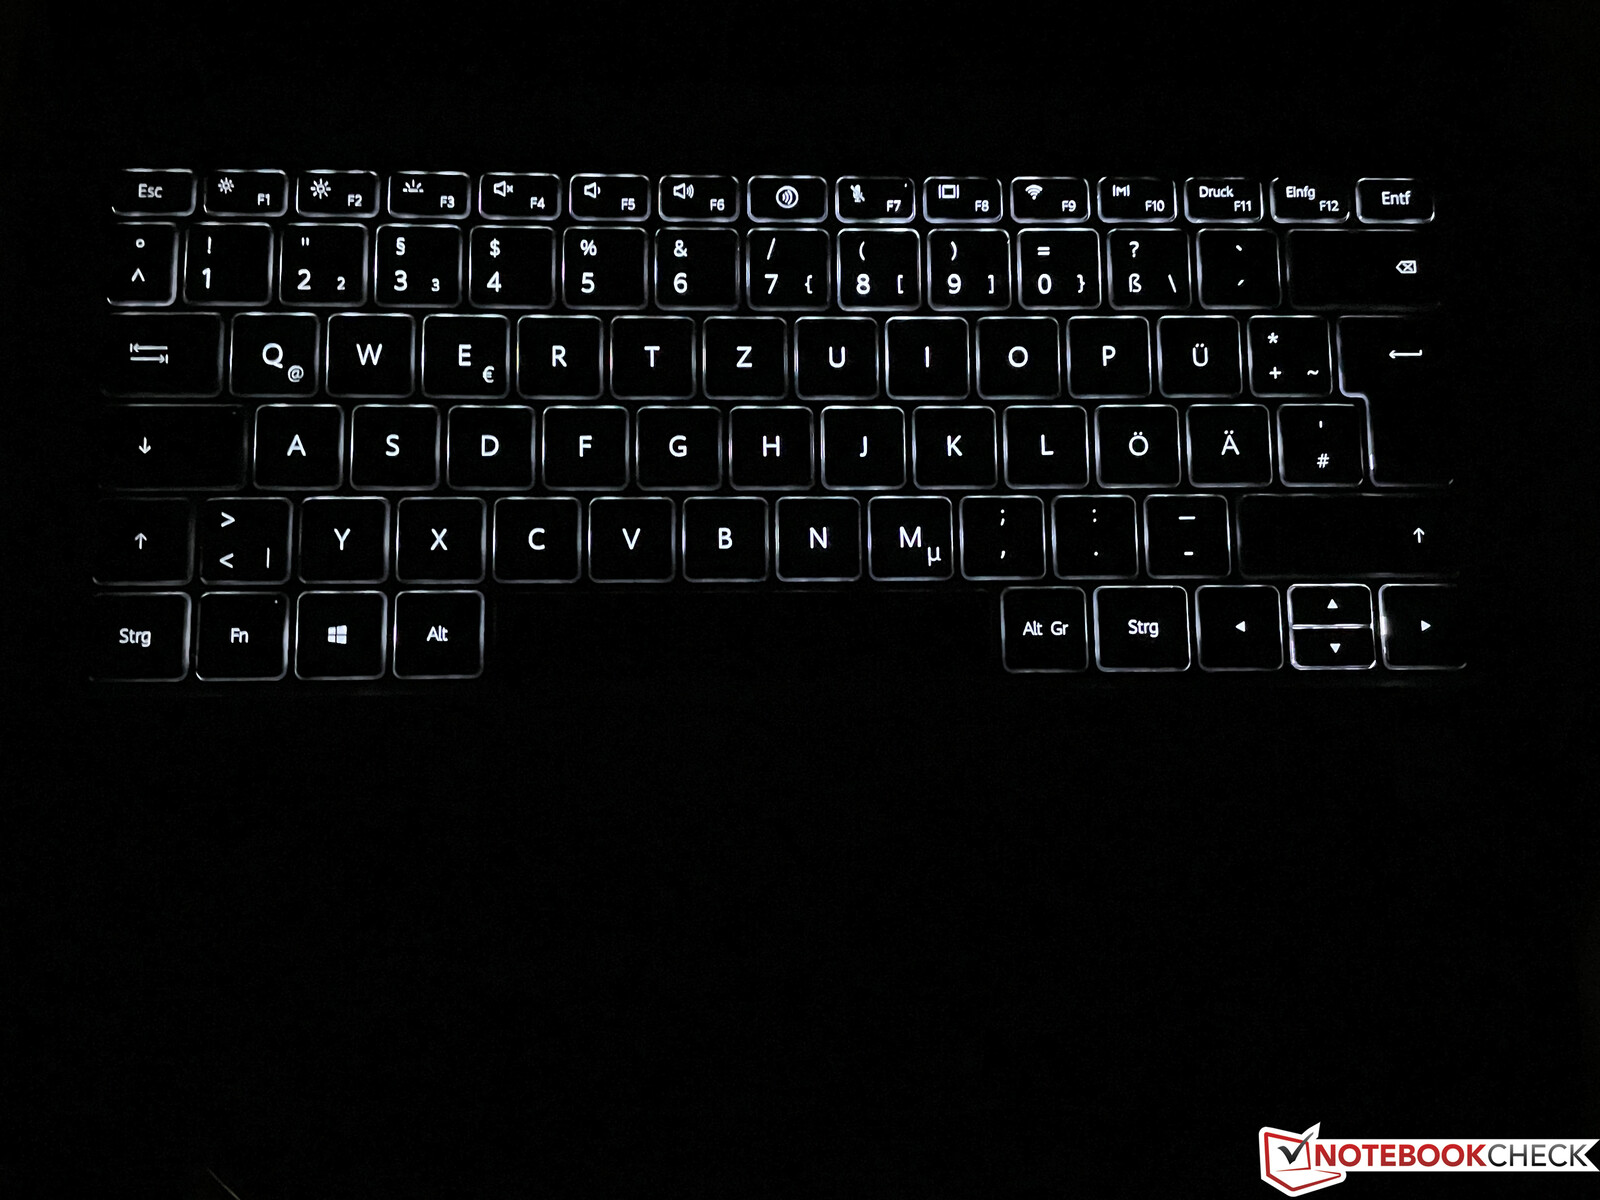
与目前的趋势相反,MateBook 14s的键盘更薄,键程更小,但它的键程为1.5毫米,与其他机型相比,你会注意到它(如MateBook 13)打字时,你会注意到。较长的文本是绝对没有问题的。键盘布局与MateBooks相同,包括小型垂直方向键。我们非常喜欢键盘上方的独立电源键,所以它不碍事,而且它包括一个可靠的指纹扫描仪。有一个两阶段的白色背景照明,适合较暗的环境。
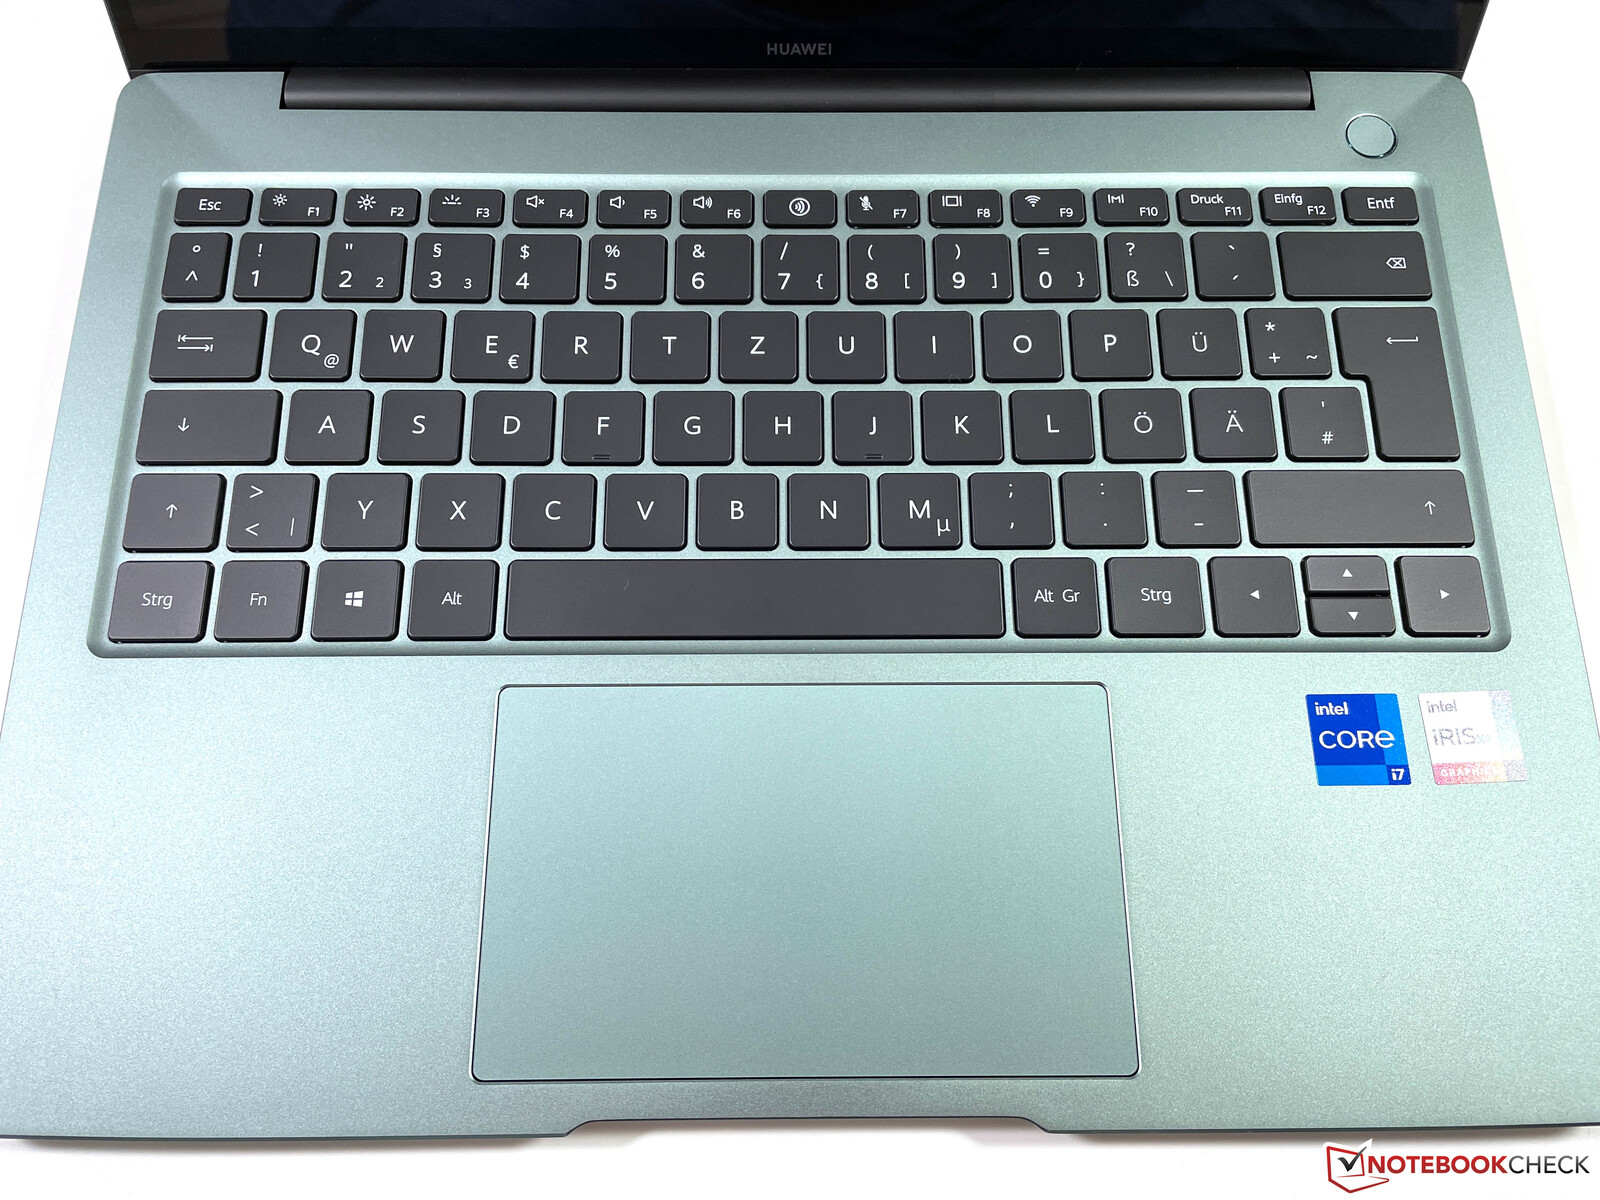
触摸板和触摸屏
大尺寸的点击板(12 x 7.4厘米),其光滑的表面支持微软Precision 标准,在实践中运行良好。它可以识别多达四个手指的手势。唯一的问题是点击机制,这对我们的口味来说有点太响了,这显得有点廉价。我们建议用点击输入来代替,这样就不会有恼人的声音。
还有用于输入的电容式触摸屏。它可以同时识别多达10个输入,并且像你期望的那样,在现代触摸屏上运行良好。
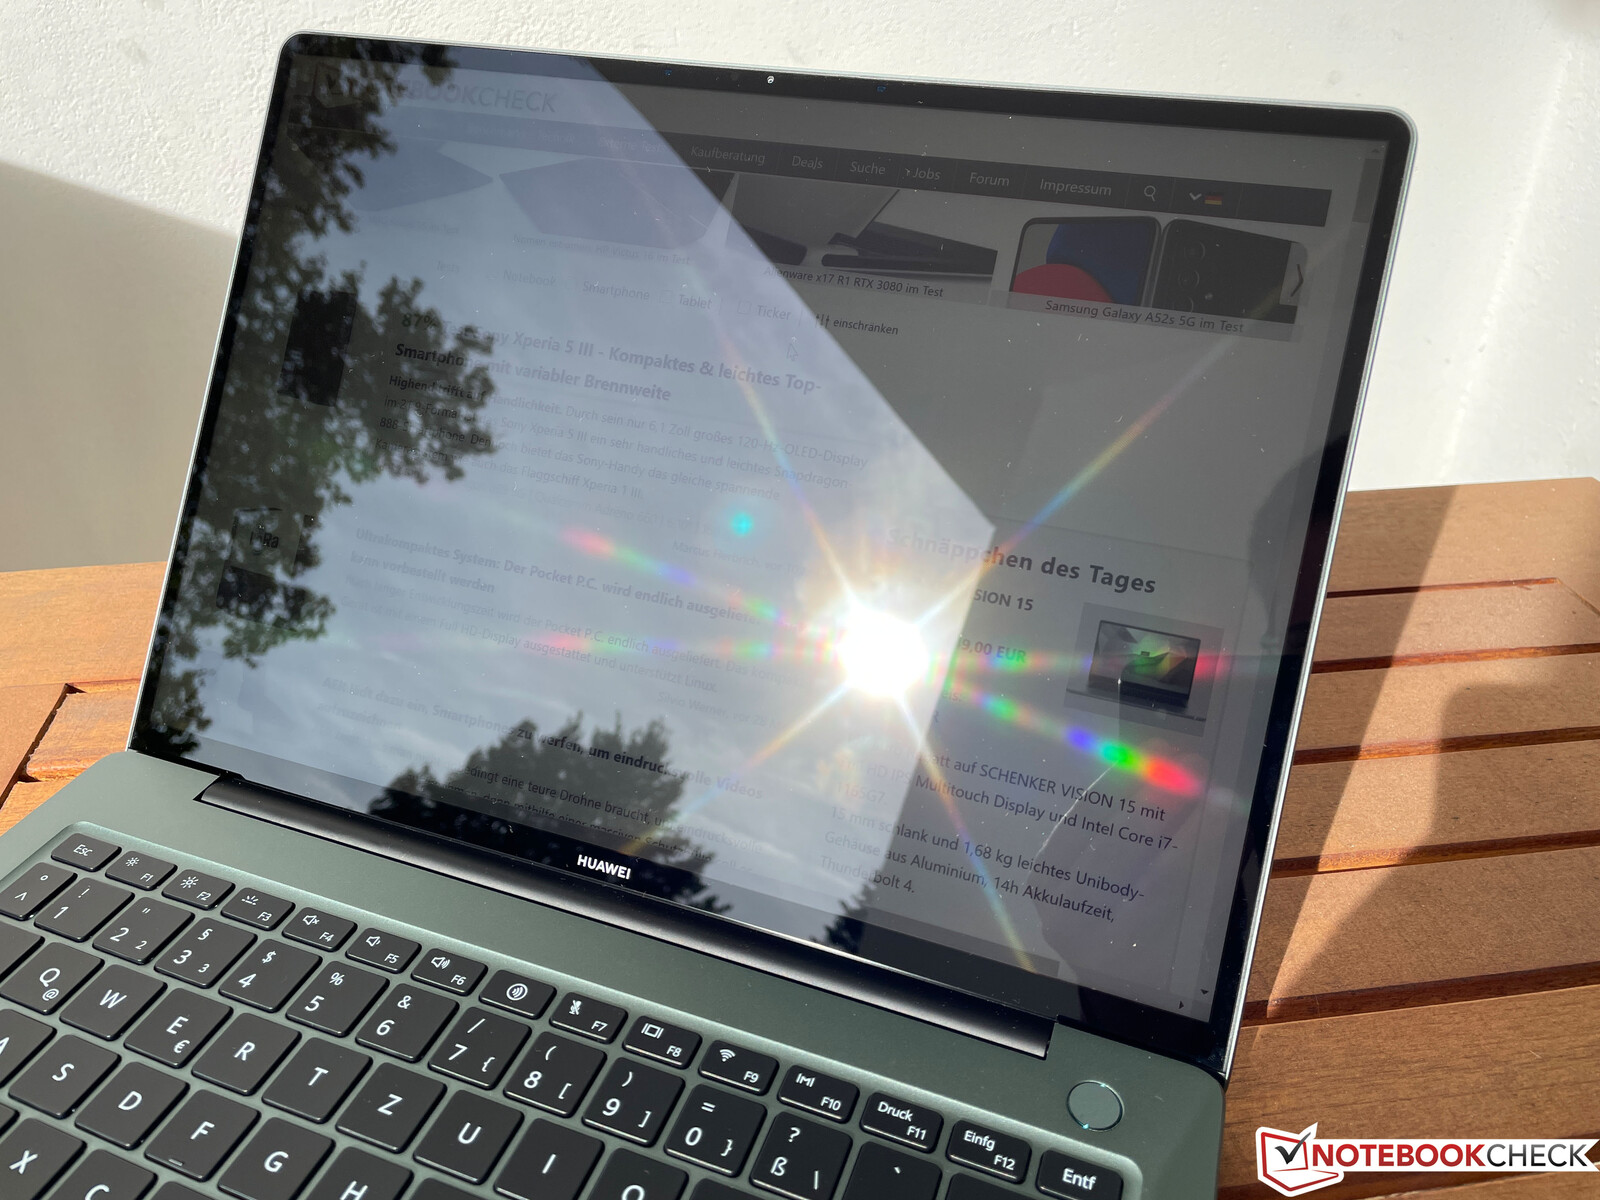
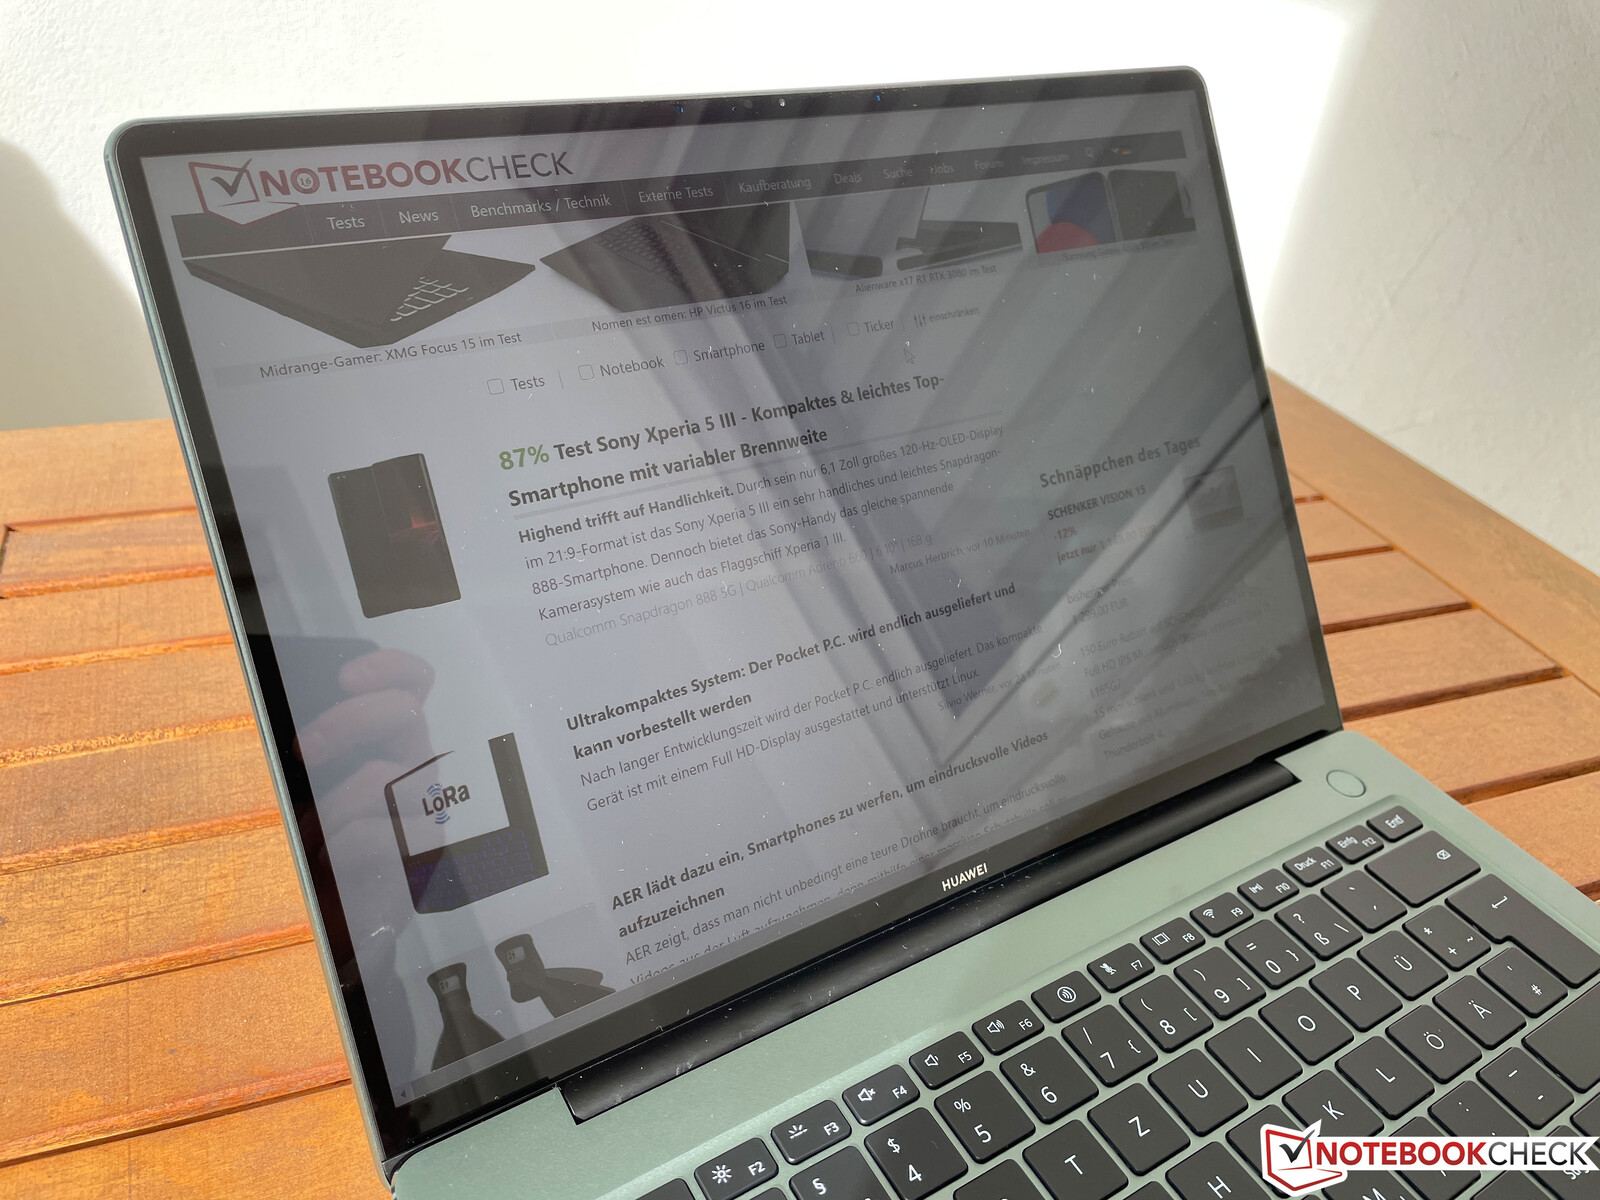
显示屏 - 3:2触摸屏,90 Hz模式
笔记本笔记本电脑已经配备了14英寸3:2触摸屏,但新的MateBook 14s有一个更大的14.2英寸屏幕,分辨率从2160 x 1140像素提高到1520 x 1680像素(2.5K)。这导致像素密度达到213 ppi,画面清晰。光面LTPS屏幕的主观画质非常好,以清晰和丰富的图像令人信服。得益于集成的光线传感器,亮度可以根据环境光线自动调整。
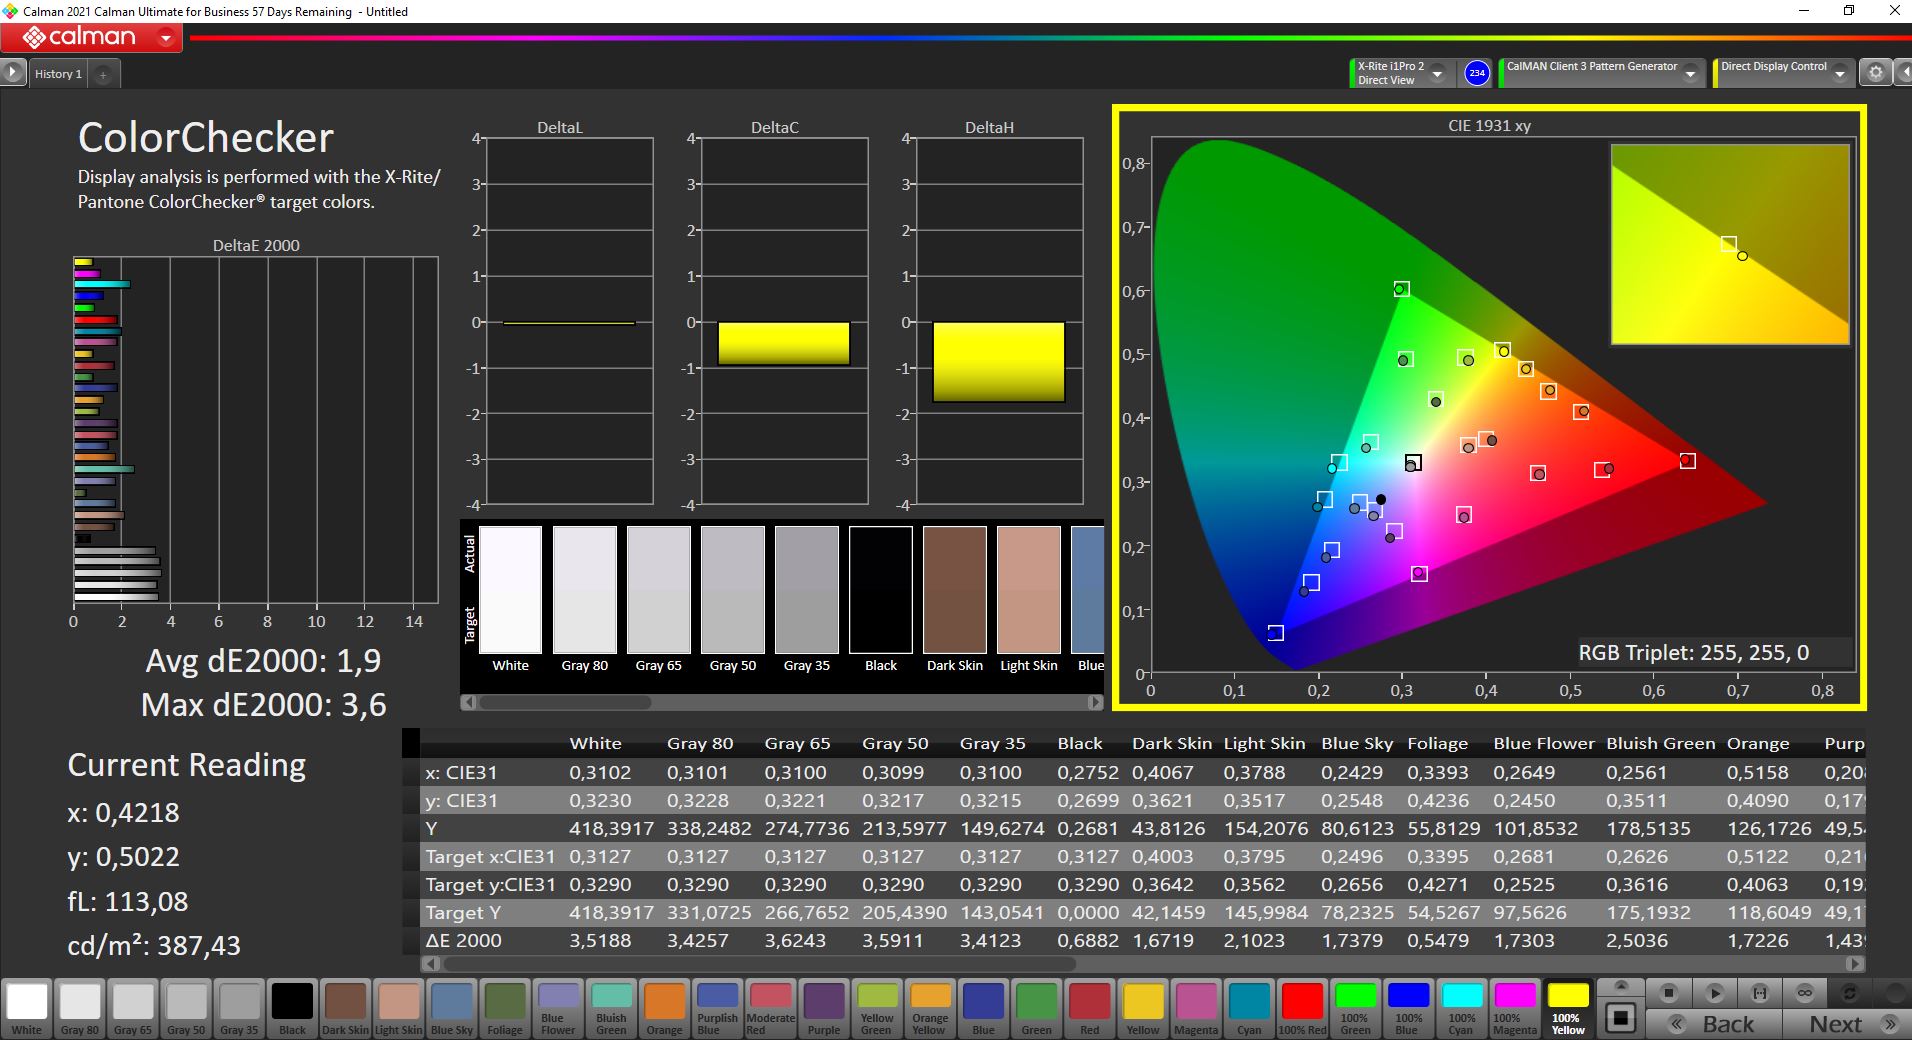
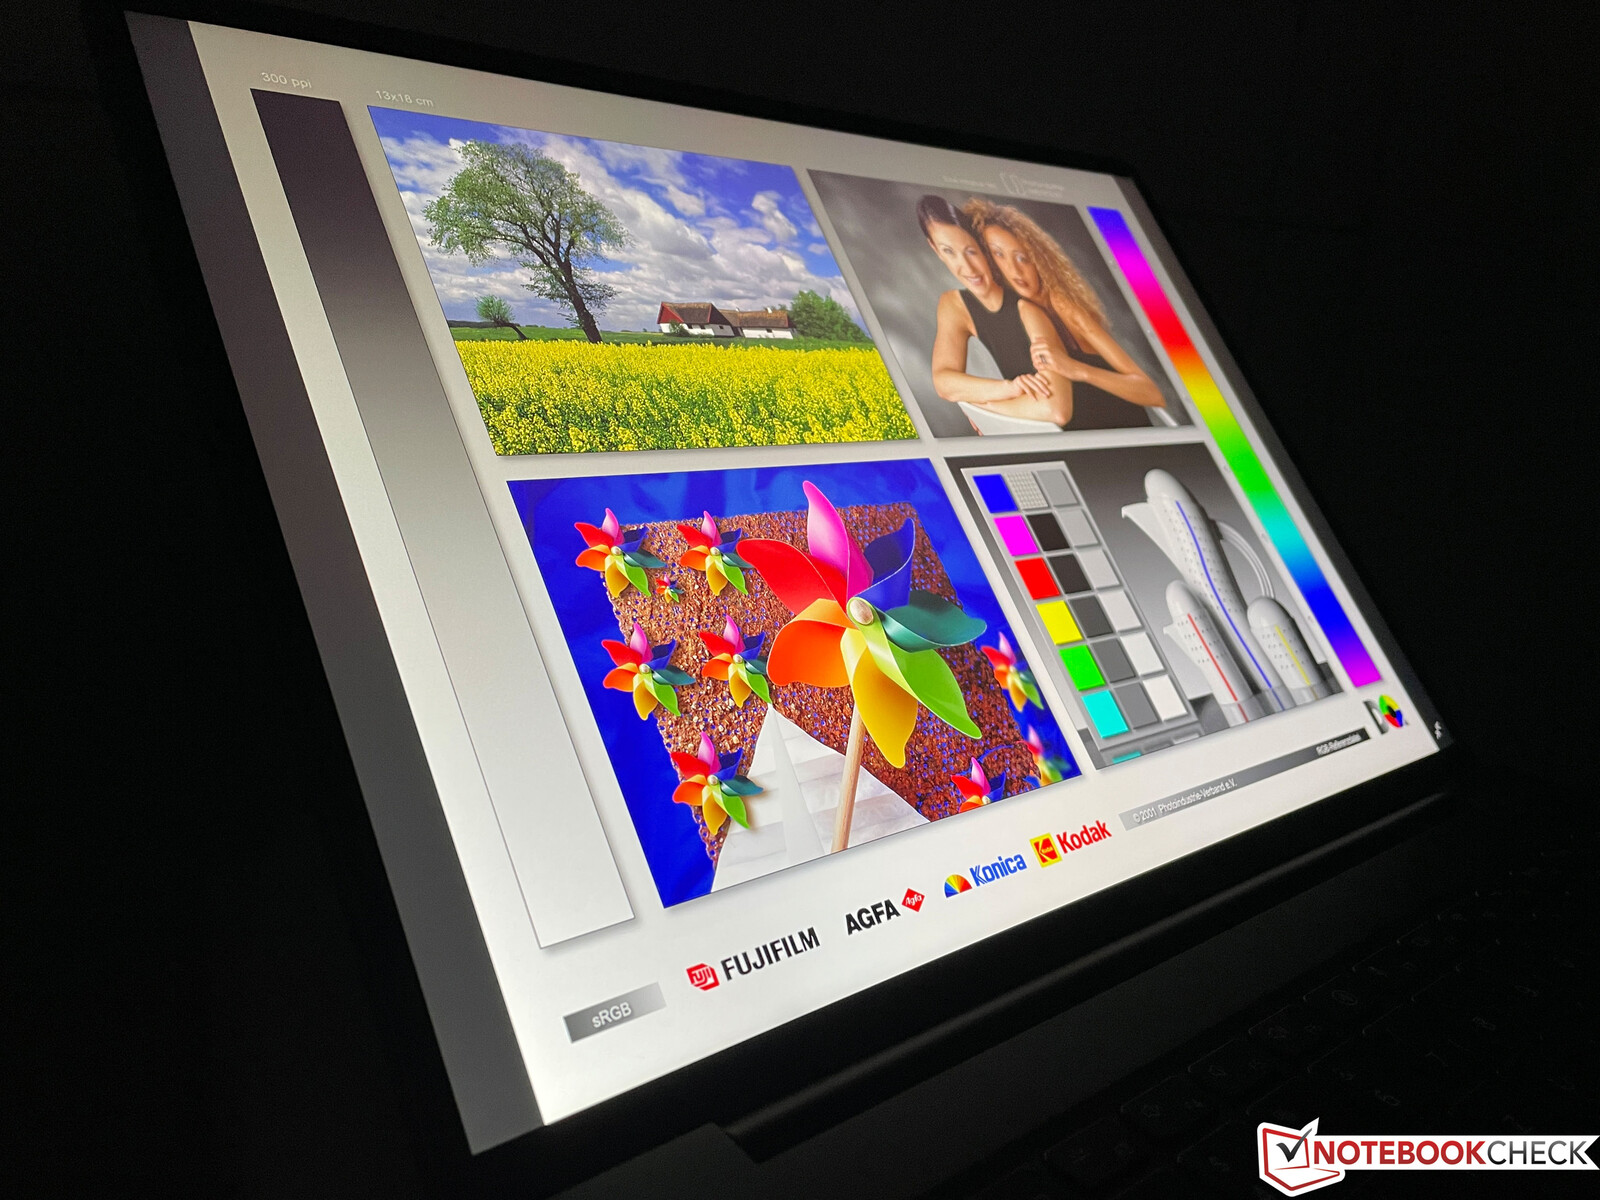
华为宣传的亮度为400cd/m²,对比度为1500:1,我们可以确认这些数值。我们用X-Rite i1 Pro 2和专业的CalMAN软件进行测量,确定平均亮度为407cd/m²,对比度超过1800:1(黑值0.23)。这些都是非常好的结果,但竞争对手如MateBook X Pro,以及MateBook 14以及戴尔XPS 13在亮度方面有优势。
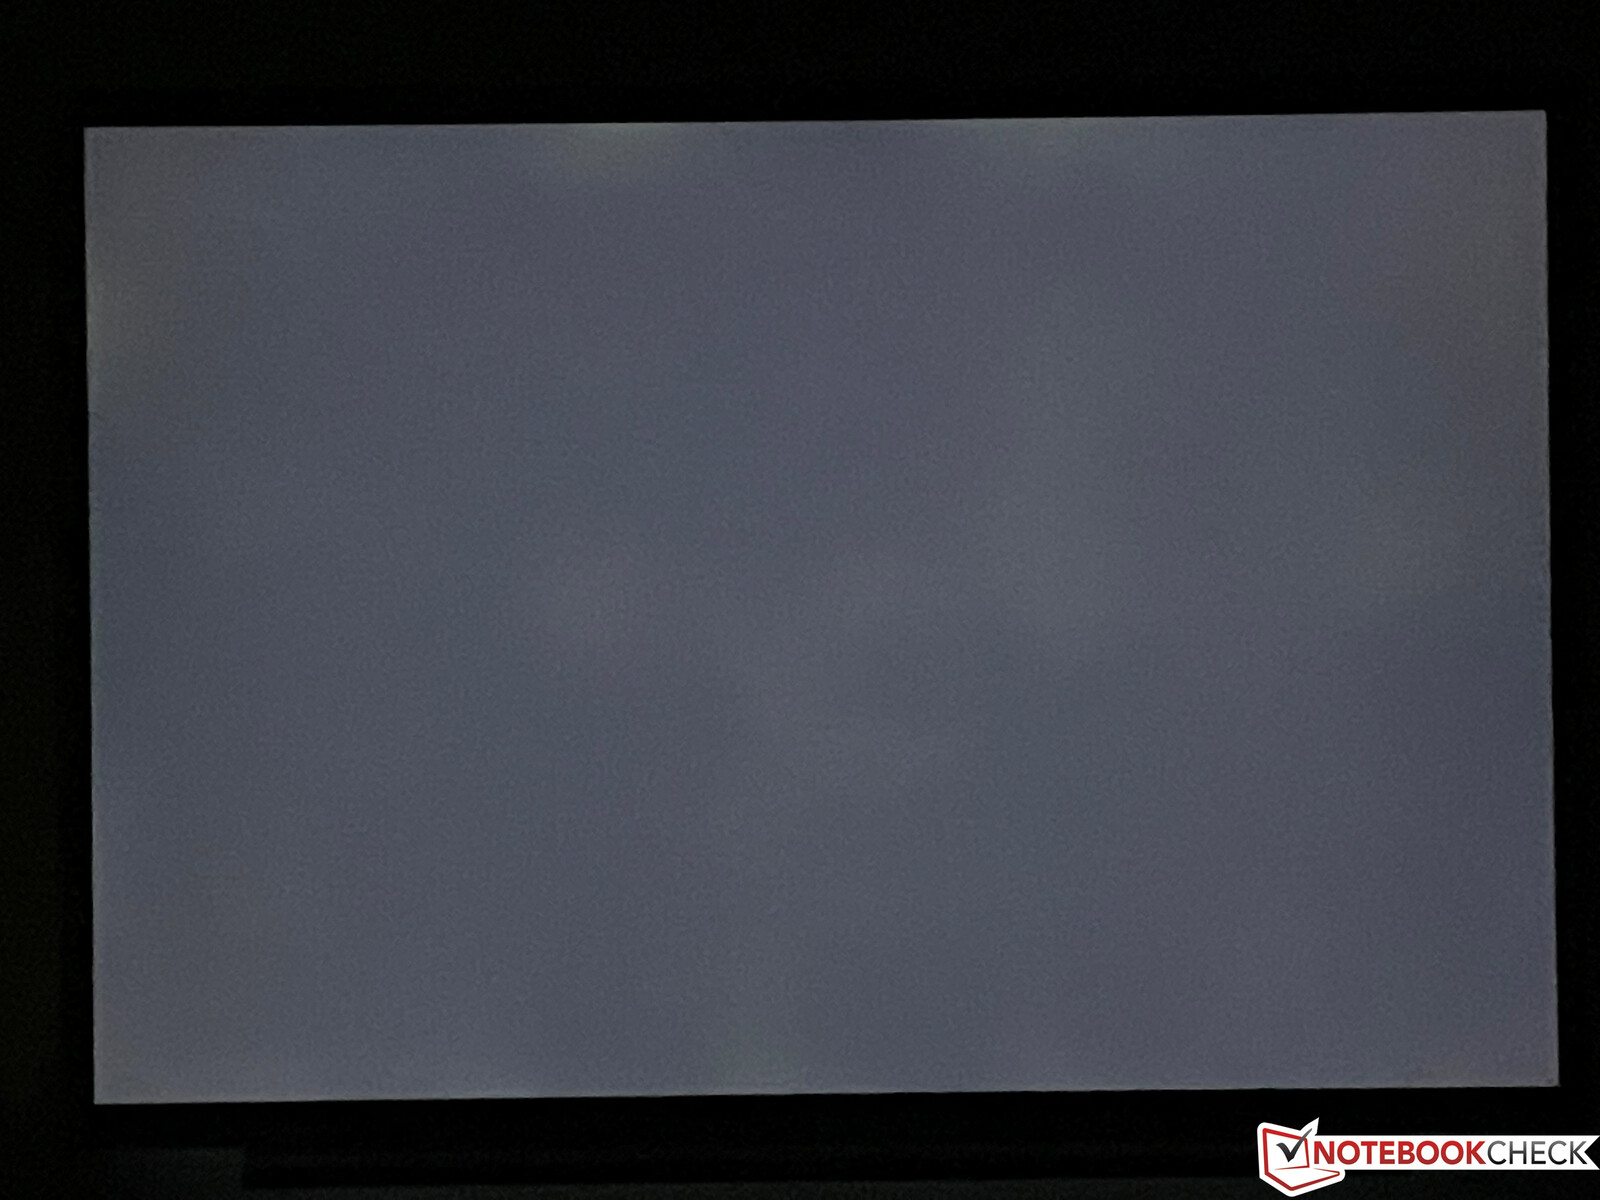
即使在最大亮度的情况下,在黑暗的图片上也只有轻微的背光渗漏,但在日常工作中并不明显。当亮度下降到40%或更低时,我们可以检测到27千赫兹的显示闪烁,但这个频率非常高,不应该造成任何限制。
按Fn+R键,你可以在60赫兹和90赫兹之间切换刷新率,在切换过程中显示器会关闭一秒钟。当你滚动或移动窗口时,画面在90赫兹下明显更流畅。然而,对于视频播放来说没有任何优势,所以它更像是一个噱头。
| |||||||||||||||||||||||||
Brightness Distribution: 93 %
Center on Battery: 420 cd/m²
Contrast: 1822:1 (Black: 0.23 cd/m²)
ΔE ColorChecker Calman: 1.9 | ∀{0.5-29.43 Ø4.73}
calibrated: 0.9
ΔE Greyscale Calman: 2.9 | ∀{0.09-98 Ø4.97}
70.1% AdobeRGB 1998 (Argyll 3D)
98.3% sRGB (Argyll 3D)
67.8% Display P3 (Argyll 3D)
Gamma: 2.14
CCT: 6733 K
| Huawei MateBook 14s i7 CSOTT3 U17B MNE208ZA1-3, LTPS, 2520x1680, 14.2" | Huawei MateBook X Pro 2021 TIANMA XM, IPS, 3000x2000, 13.9" | Lenovo Yoga Slim 7 Pro 14ACH5 Lenovo LEN8A90, IPS, 2880x1800, 14" | Schenker Vision 14 CSOT T3_MNE007ZA1_1, IPS, 2880x1800, 14" | Dell XPS 13 9310 Core i7 4K Sharp LQ134R1, IPS, 3840x2400, 13.4" | Apple MacBook Air 2020 M1 Entry IPS, 2560x1600, 13.3" | Huawei MateBook 14 2020 Intel TV140WTM-NH0, IPS LED, 2160x1440, 14" | |
|---|---|---|---|---|---|---|---|
| Display | -4% | 7% | 7% | 11% | 23% | -1% | |
| Display P3 Coverage (%) | 67.8 | 64.9 -4% | 76 12% | 75.4 11% | 80.2 18% | 98.6 45% | 67.1 -1% |
| sRGB Coverage (%) | 98.3 | 94.4 -4% | 100 2% | 99 1% | 100 2% | 100 2% | 99.1 1% |
| AdobeRGB 1998 Coverage (%) | 70.1 | 66.3 -5% | 75.6 8% | 76.4 9% | 78.9 13% | 85.9 23% | 69 -2% |
| Response Times | -11% | 17% | 10% | -72% | -2% | -2% | |
| Response Time Grey 50% / Grey 80% * (ms) | 37.6 ? | 37.6 ? -0% | 37 ? 2% | 32.8 ? 13% | 59.2 ? -57% | 31 ? 18% | 37.6 ? -0% |
| Response Time Black / White * (ms) | 21.6 ? | 26.4 ? -22% | 15 ? 31% | 20.4 ? 6% | 40.4 ? -87% | 26.1 ? -21% | 22.4 ? -4% |
| PWM Frequency (Hz) | 27780 ? | 300 ? | 2137 ? | 118000 ? | 59520 ? | ||
| Screen | 1% | -67% | -28% | -24% | 1% | -35% | |
| Brightness middle (cd/m²) | 419 | 502 20% | 392 -6% | 390 -7% | 508.7 21% | 417 0% | 458 9% |
| Brightness (cd/m²) | 407 | 474 16% | 390 -4% | 387 -5% | 479 18% | 395 -3% | 448 10% |
| Brightness Distribution (%) | 93 | 89 -4% | 80 -14% | 94 1% | 84 -10% | 91 -2% | 89 -4% |
| Black Level * (cd/m²) | 0.23 | 0.33 -43% | 0.29 -26% | 0.29 -26% | 0.3 -30% | 0.39 -70% | 0.25 -9% |
| Contrast (:1) | 1822 | 1521 -17% | 1352 -26% | 1345 -26% | 1696 -7% | 1069 -41% | 1832 1% |
| Colorchecker dE 2000 * | 1.9 | 1.35 29% | 3.4 -79% | 2.8 -47% | 2.72 -43% | 1.12 41% | 3.4 -79% |
| Colorchecker dE 2000 max. * | 3.6 | 3.67 -2% | 6.41 -78% | 4.4 -22% | 4.7 -31% | 2.71 25% | 6.7 -86% |
| Colorchecker dE 2000 calibrated * | 0.9 | 1.2 -33% | 3.44 -282% | 1.8 -100% | 1.92 -113% | 0.77 14% | 1.7 -89% |
| Greyscale dE 2000 * | 2.9 | 1.7 41% | 5.44 -88% | 3.5 -21% | 3.4 -17% | 1.7 41% | 4.9 -69% |
| Gamma | 2.14 103% | 2.24 98% | 2.44 90% | 2.24 98% | 2.11 104% | 2207 0% | 2.16 102% |
| CCT | 6733 97% | 6440 101% | 6013 108% | 6174 105% | 6245 104% | 6870 95% | 7704 84% |
| Color Space (Percent of AdobeRGB 1998) (%) | 61.1 | 69.1 | 76.4 | 70.7 | 63.5 | ||
| Color Space (Percent of sRGB) (%) | 94.3 | 100 | 99 | 100 | 99.1 | ||
| Total Average (Program / Settings) | -5% /
-2% | -14% /
-39% | -4% /
-15% | -28% /
-23% | 7% /
5% | -13% /
-23% |
* ... smaller is better
画面开箱后已经非常好,与sRGB参考值相比,DeltaE-2000的平均偏差较小3,但灰度显示出轻微的偏蓝。然而,这只是在你直接将屏幕与经过校准的屏幕进行比较时,用肉眼就可以发现。
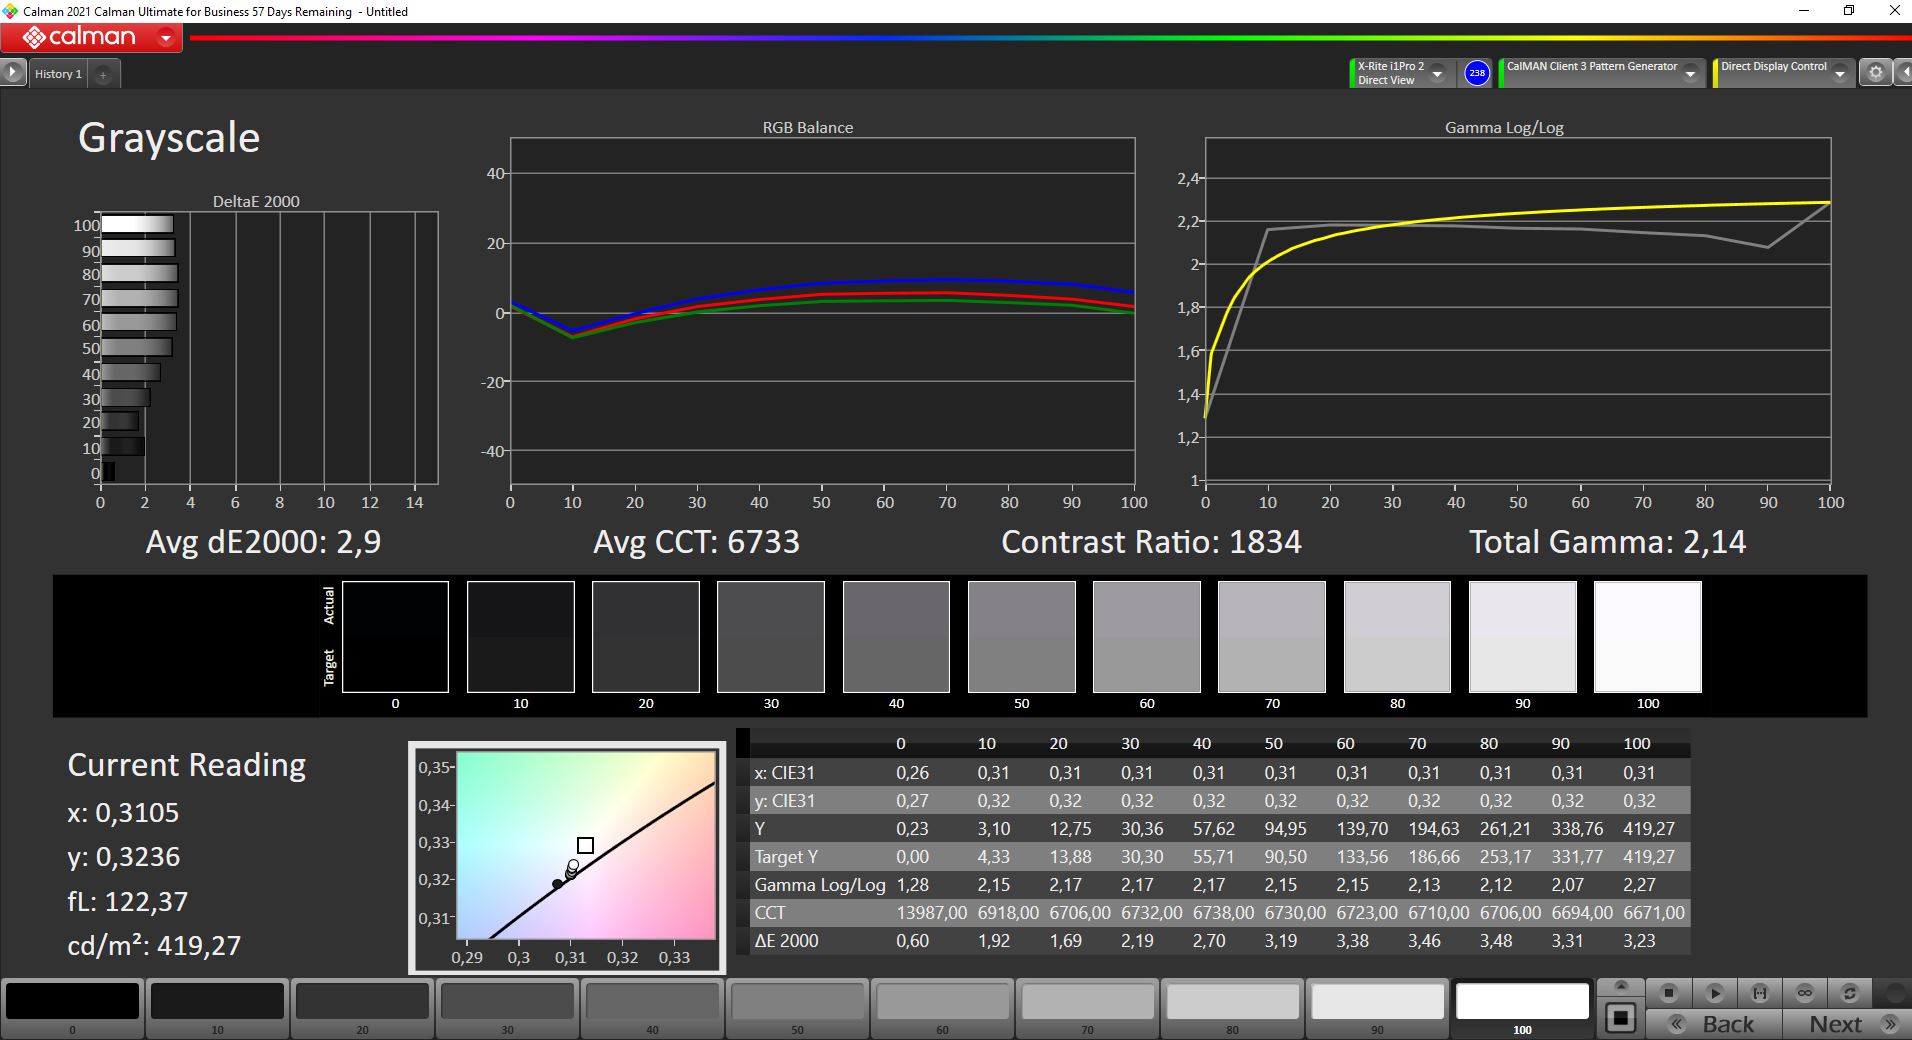
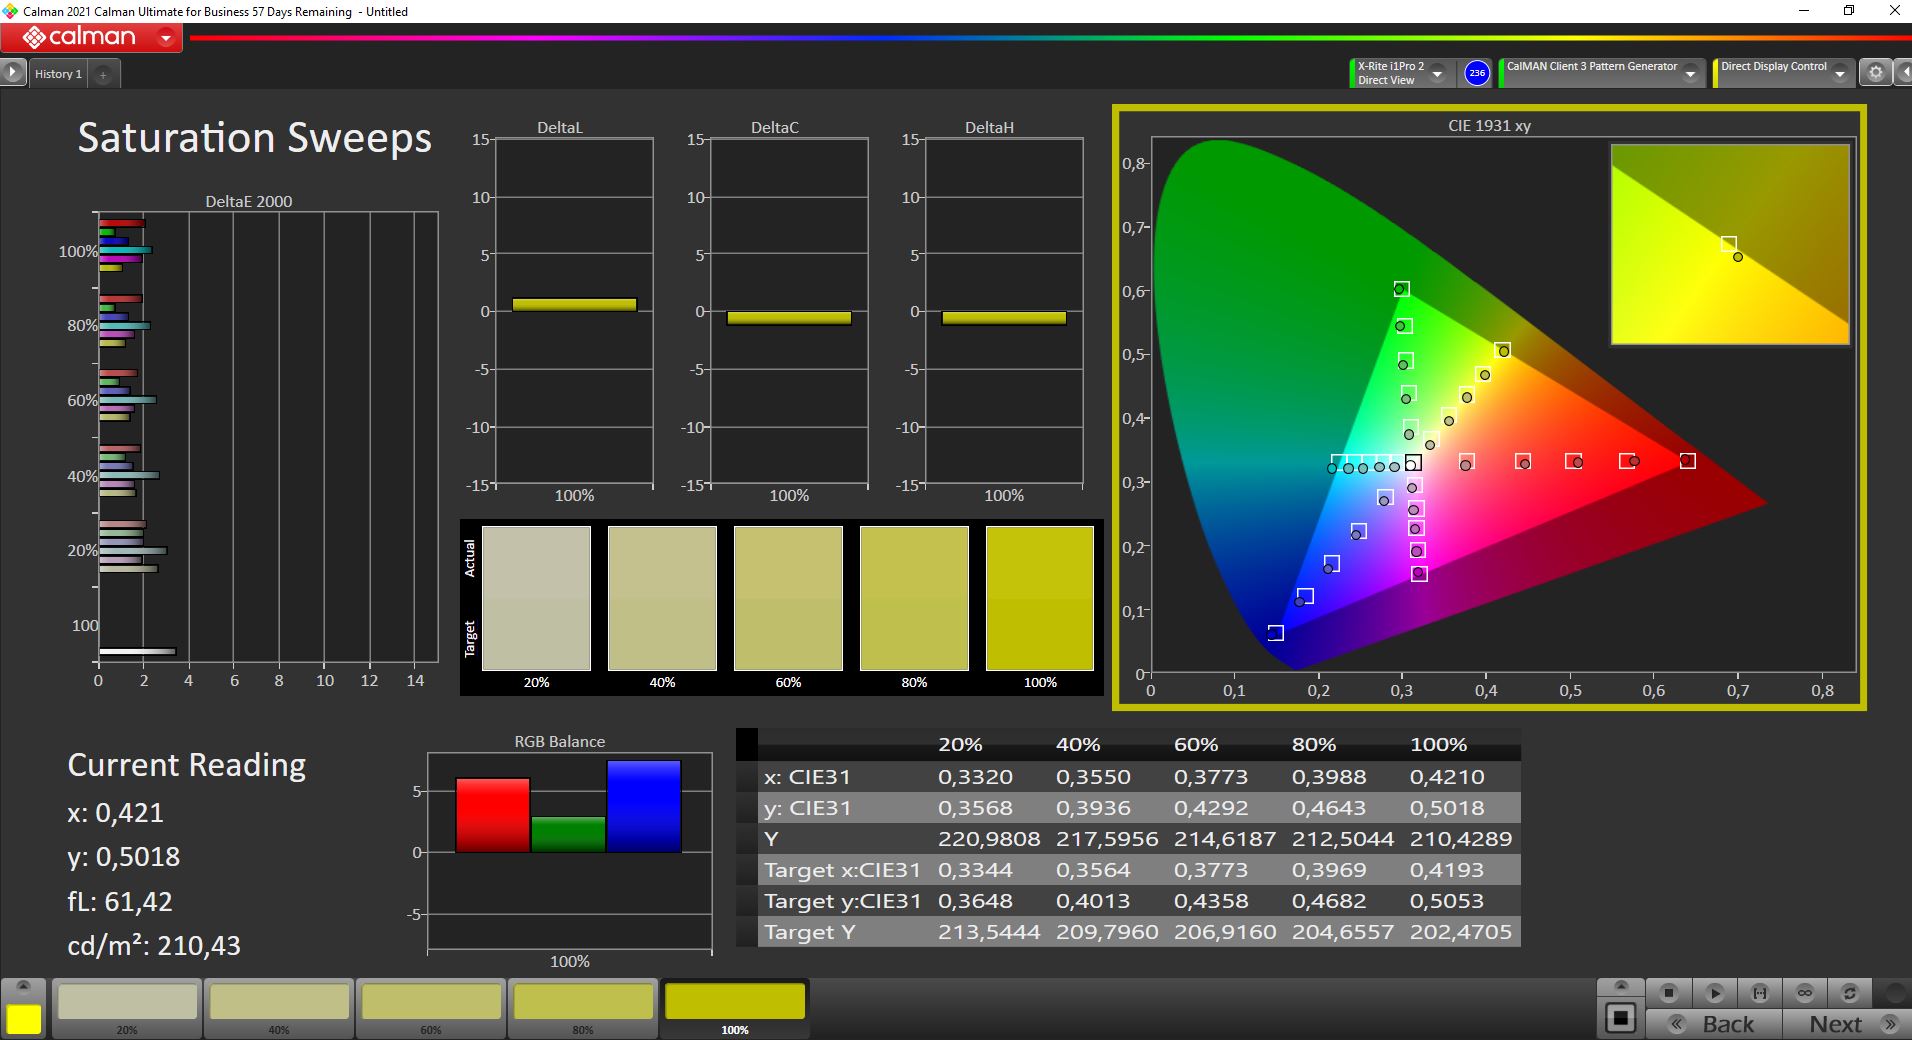
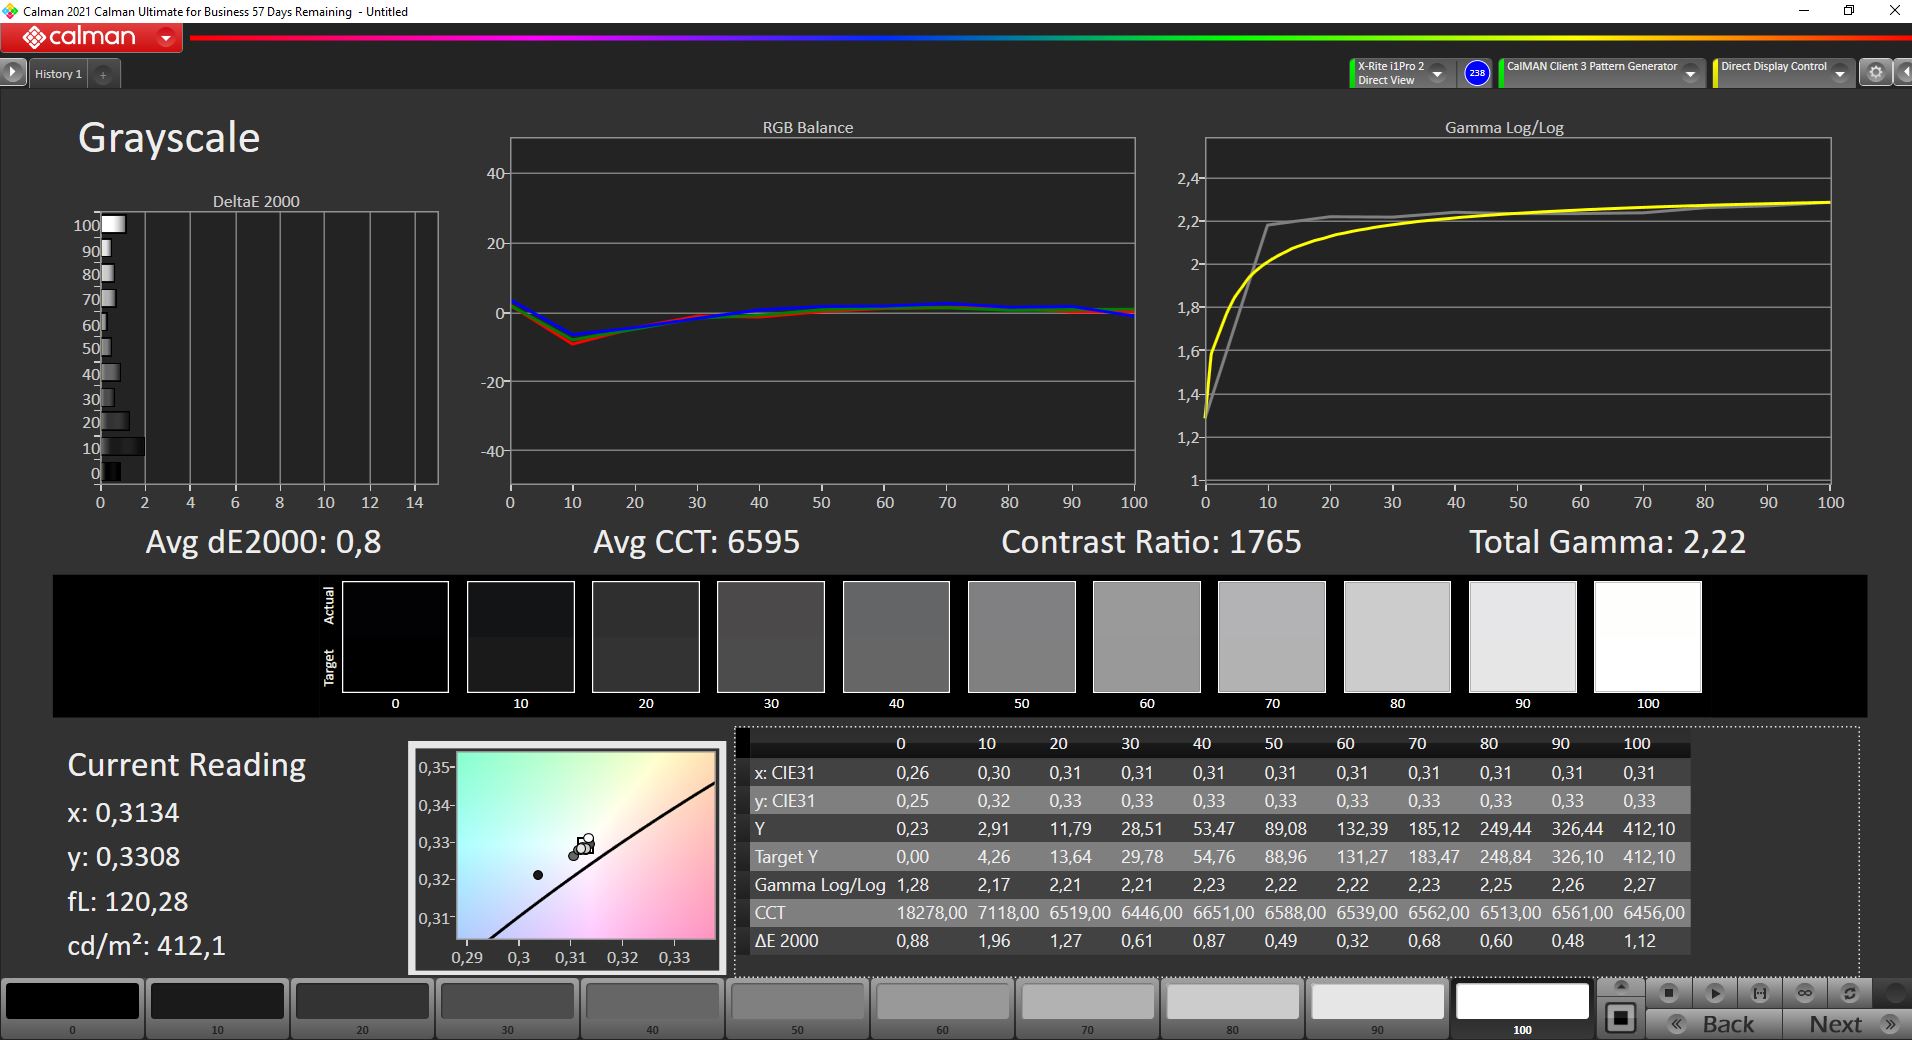
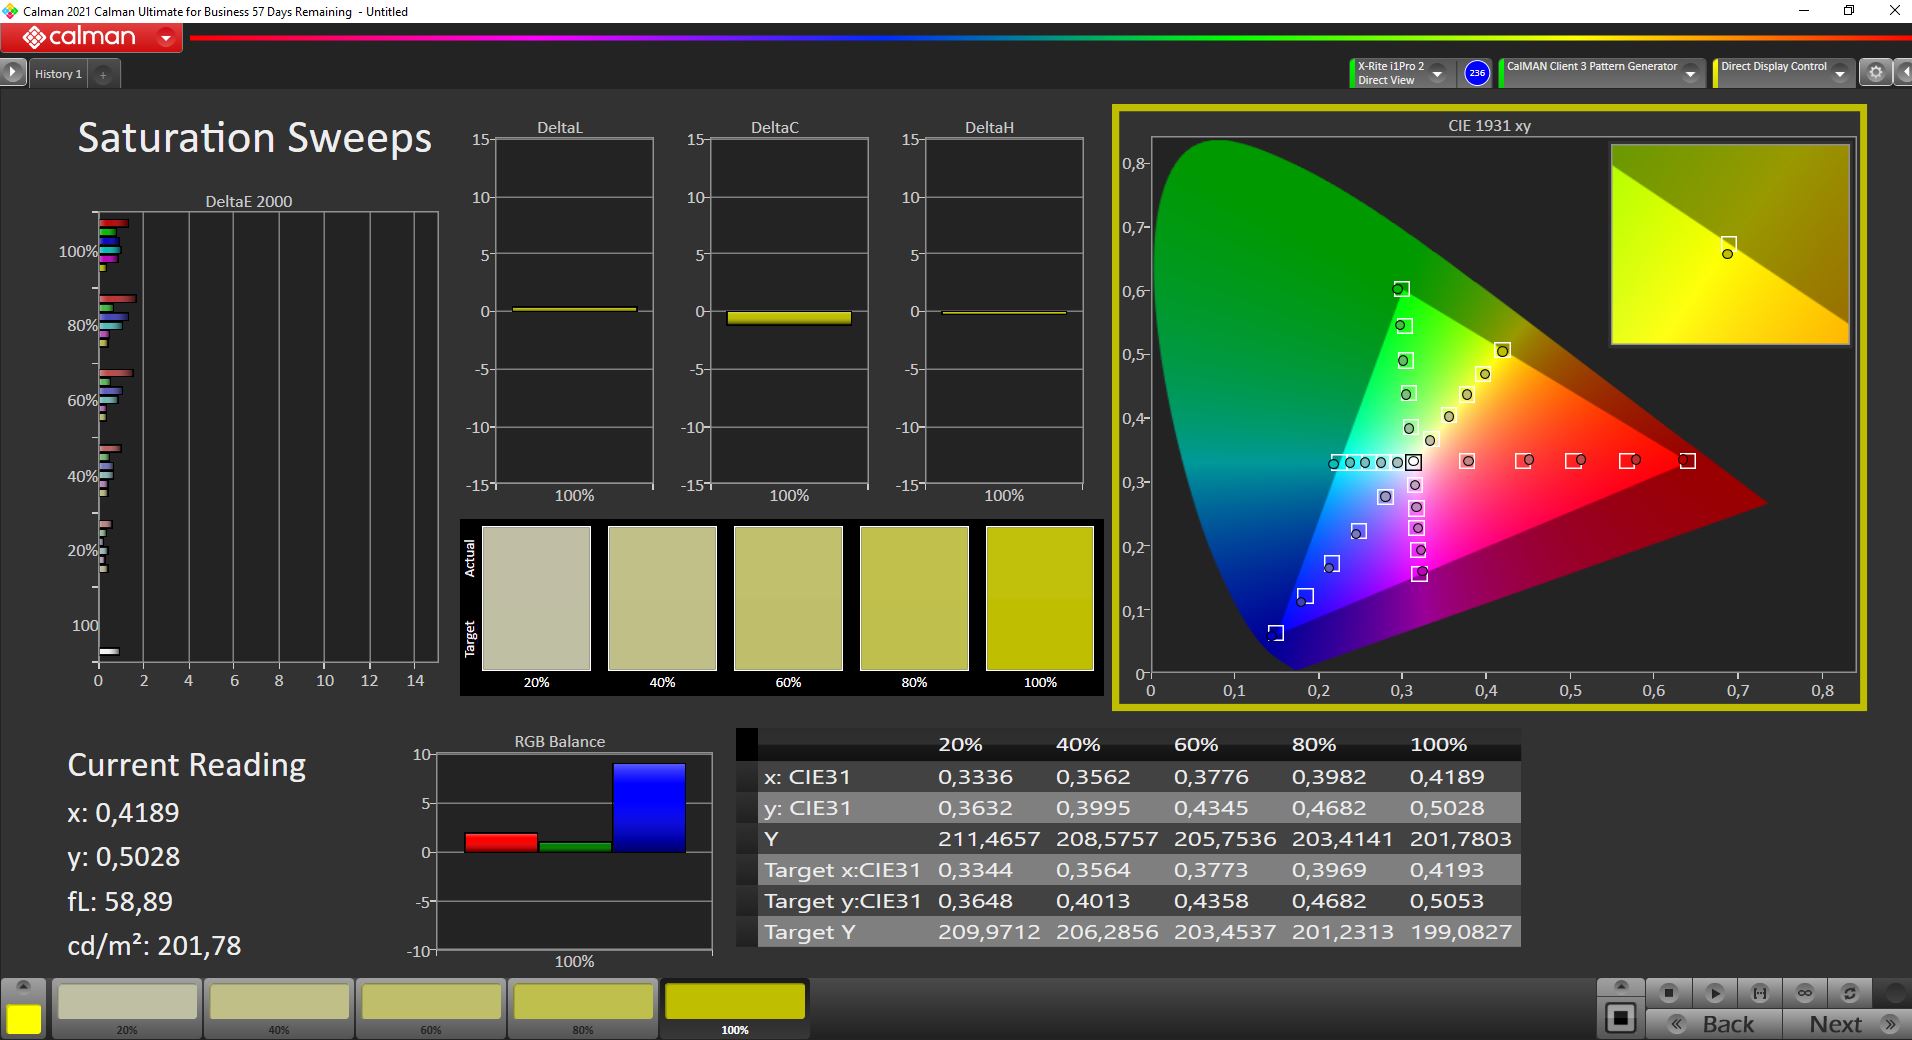
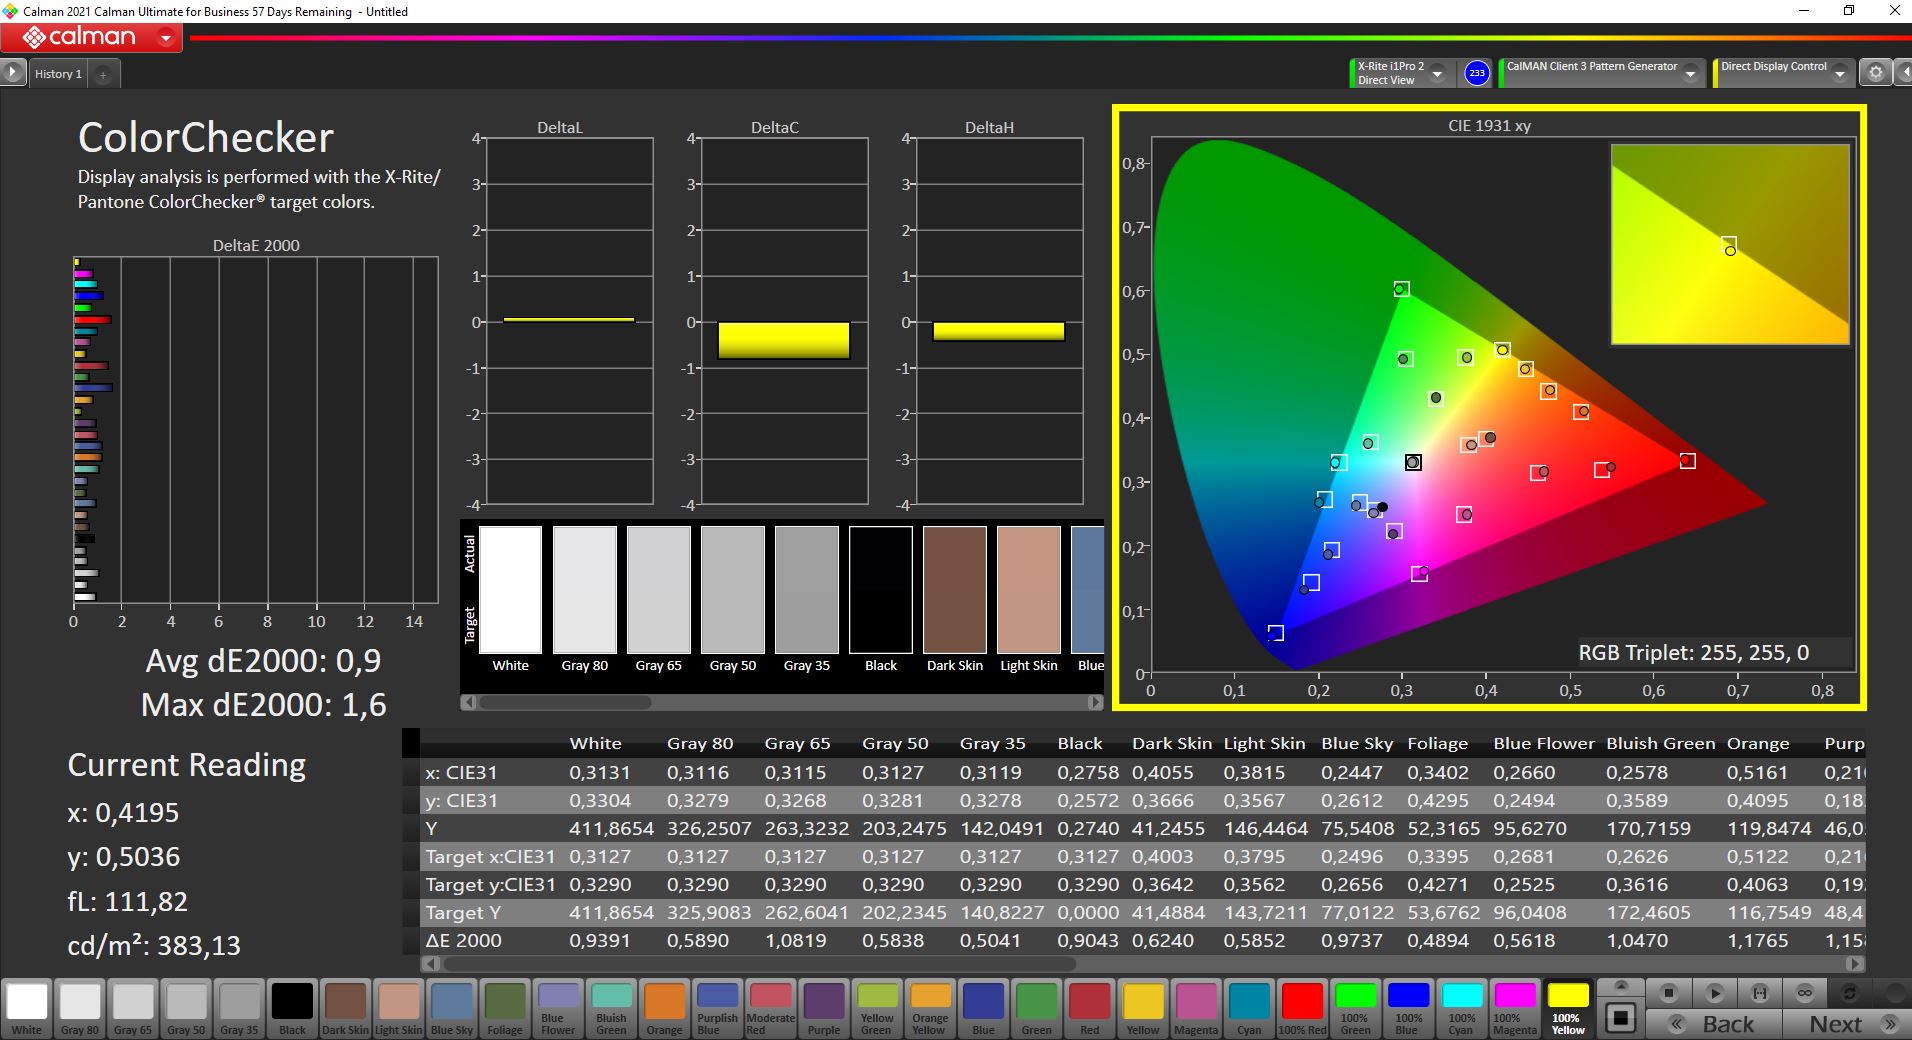
我们的校准(配置文件可在上面的方框中免费下载)可以改善画面,也可以消除偏蓝。校准后,最大亮度只略有下降。面板几乎完全覆盖了小的sRGB参考值,再加上准确的色彩,MateBook 14s的面板适合图片/视频编辑)。)
Display Response Times
| ↔ Response Time Black to White | ||
|---|---|---|
| 21.6 ms ... rise ↗ and fall ↘ combined | ↗ 10.8 ms rise | 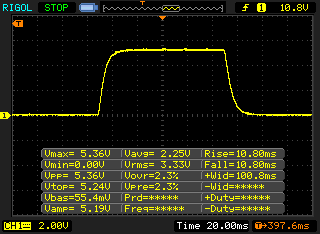 |
| ↘ 10.8 ms fall | ||
| The screen shows good response rates in our tests, but may be too slow for competitive gamers. In comparison, all tested devices range from 0.1 (minimum) to 240 (maximum) ms. » 48 % of all devices are better. This means that the measured response time is similar to the average of all tested devices (19.9 ms). | ||
| ↔ Response Time 50% Grey to 80% Grey | ||
| 37.6 ms ... rise ↗ and fall ↘ combined | ↗ 18.8 ms rise | 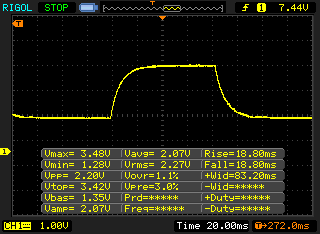 |
| ↘ 18.8 ms fall | ||
| The screen shows slow response rates in our tests and will be unsatisfactory for gamers. In comparison, all tested devices range from 0.165 (minimum) to 636 (maximum) ms. » 54 % of all devices are better. This means that the measured response time is worse than the average of all tested devices (31.1 ms). | ||
Screen Flickering / PWM (Pulse-Width Modulation)
| Screen flickering / PWM detected | 27780 Hz | ≤ 40 % brightness setting | 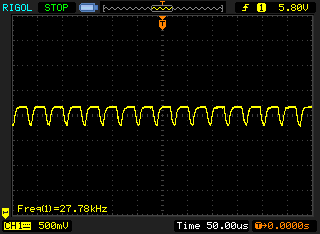 |
The display backlight flickers at 27780 Hz (worst case, e.g., utilizing PWM) Flickering detected at a brightness setting of 40 % and below. There should be no flickering or PWM above this brightness setting. The frequency of 27780 Hz is quite high, so most users sensitive to PWM should not notice any flickering. In comparison: 52 % of all tested devices do not use PWM to dim the display. If PWM was detected, an average of 7794 (minimum: 5 - maximum: 343500) Hz was measured. | |||
我们希望在户外看到更高的亮度,以弥补光面屏幕的反射。MateBook 14s只有在阴凉处使用才真正舒适。对于LTPS屏幕的视角稳定性,没有任何批评意见。
性能 - 华为使用Tiger Lake-H35
华为实现了两种电源模式(平衡和性能),它们独立于常规的Windows性能设置,可以通过组合键(Fn+P)舒适地进行切换。我们用性能模式进行了以下基准测试和测量,但在大多数情况下你不会注意到很大的差异。只有在CPU和iGPU合并工作负载的情况下,性能模式才有明显优势。在电池供电时,你只能使用平衡模式。
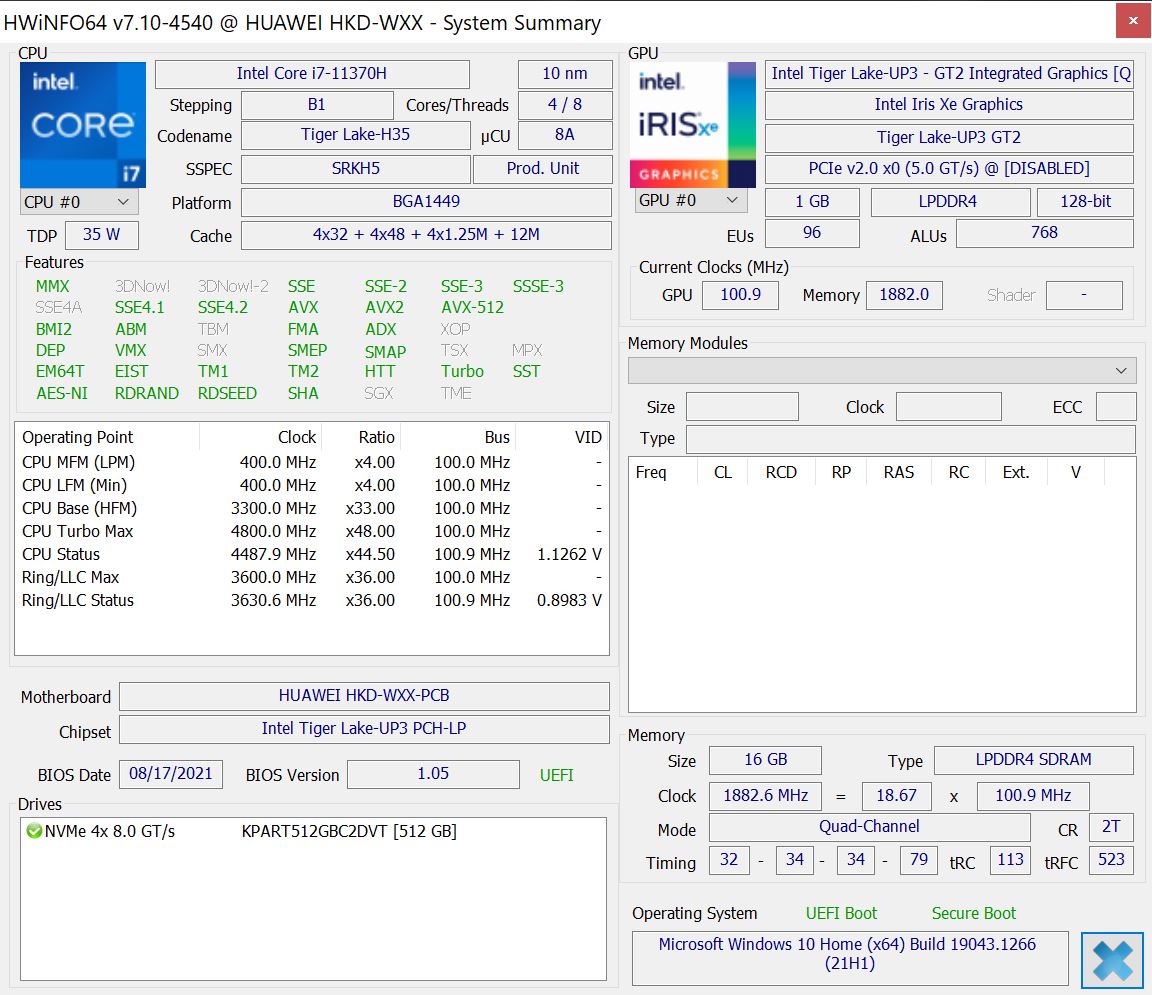
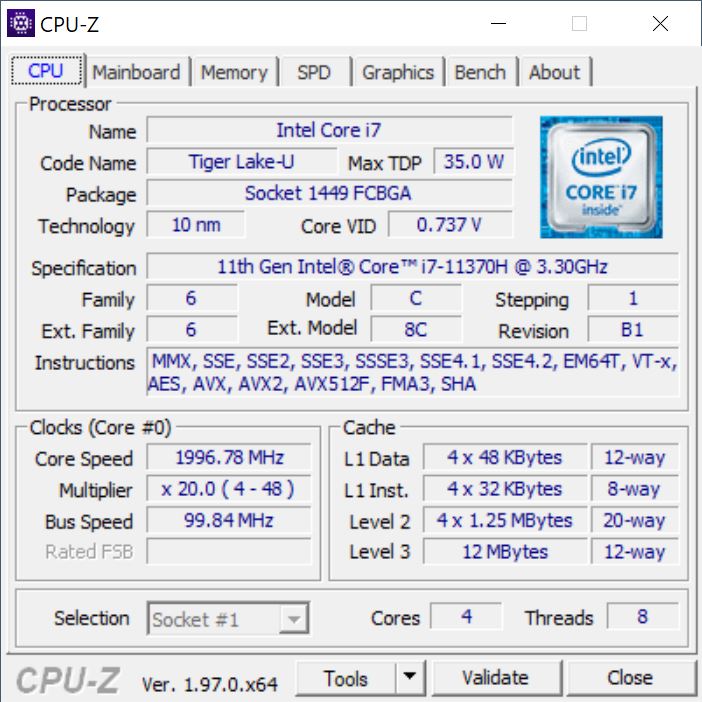
处理器 - 酷睿i7-11370H
华为使用新的酷睿i7-11370H来自Tiger Lake 代。它的TDP指定在35-45瓦之间,但与其他H系列CPU相比,它只有四个核心(8个线程)和更快的iGPU(Iris Xe Graphics G7)作为回报。它基本上只是一个加强版的U系列处理器,性能与H系列处理器没有什么区别。酷睿i7-1185G7或酷睿i7-1165G7至少,如果它们以相同的TDP水平运行的话。
不过,MateBook 14s的性能利用率还是不错的,因为处理器确实可以消耗45瓦特,而且在持续工作负荷下可以保持这个水平。然而,四核的结果总体上是相当令人清醒的。由于高涡轮增压,单核性能非常好,但在多核测试中,与普通U系列芯片相比,优势相当小。AMD目前的Ryzen处理器(包括U系列和H系列)提供的多核性能也要好得多。
当你使用平衡电源模式时,TDP下降到35瓦,在CB R15多循环的结果下降了10%左右。在电池电源上没有性能下降(与平衡模式相比)。更多的CPU基准测试可在 这里.
Cinebench R15 Multi Dauertest
Cinebench R20: CPU (Multi Core) | CPU (Single Core)
Cinebench R15: CPU Multi 64Bit | CPU Single 64Bit
Blender: v2.79 BMW27 CPU
7-Zip 18.03: 7z b 4 | 7z b 4 -mmt1
Geekbench 5.5: Multi-Core | Single-Core
HWBOT x265 Benchmark v2.2: 4k Preset
LibreOffice : 20 Documents To PDF
R Benchmark 2.5: Overall mean
| Cinebench R23 / Multi Core | |
| Lenovo Yoga Slim 7 Pro 14ACH5 | |
| Average of class Subnotebook (1555 - 21812, n=60, last 2 years) | |
| Apple MacBook Air 2020 M1 Entry | |
| Huawei MateBook 14s i7 | |
| Schenker Vision 14 | |
| MSI Modern 14 B11SB-085 | |
| Average Intel Core i7-11370H (3696 - 6646, n=12) | |
| Dell XPS 13 9310 Core i7 4K | |
| Huawei MateBook X Pro 2021 | |
| Cinebench R23 / Single Core | |
| Average of class Subnotebook (358 - 2213, n=61, last 2 years) | |
| Huawei MateBook 14s i7 | |
| Schenker Vision 14 | |
| MSI Modern 14 B11SB-085 | |
| Lenovo Yoga Slim 7 Pro 14ACH5 | |
| Apple MacBook Air 2020 M1 Entry | |
| Average Intel Core i7-11370H (1081 - 1556, n=11) | |
| Dell XPS 13 9310 Core i7 4K | |
| Huawei MateBook X Pro 2021 | |
| Cinebench R20 / CPU (Multi Core) | |
| Lenovo Yoga Slim 7 Pro 14ACH5 | |
| Average of class Subnotebook (579 - 8541, n=57, last 2 years) | |
| Huawei MateBook 14s i7 | |
| Schenker Vision 14 | |
| Average Intel Core i7-11370H (1438 - 2578, n=11) | |
| MSI Modern 14 B11SB-085 | |
| Dell XPS 13 9310 Core i7 4K | |
| Apple MacBook Air 2020 M1 Entry | |
| Huawei MateBook X Pro 2021 | |
| Cinebench R20 / CPU (Single Core) | |
| Average of class Subnotebook (128 - 832, n=57, last 2 years) | |
| Huawei MateBook 14s i7 | |
| Lenovo Yoga Slim 7 Pro 14ACH5 | |
| MSI Modern 14 B11SB-085 | |
| Schenker Vision 14 | |
| Dell XPS 13 9310 Core i7 4K | |
| Average Intel Core i7-11370H (475 - 601, n=11) | |
| Huawei MateBook X Pro 2021 | |
| Apple MacBook Air 2020 M1 Entry | |
| Cinebench R15 / CPU Multi 64Bit | |
| Average of class Subnotebook (327 - 3345, n=57, last 2 years) | |
| Lenovo Yoga Slim 7 Pro 14ACH5 | |
| Huawei MateBook 14s i7 | |
| Apple MacBook Air 2020 M1 Entry | |
| Average Intel Core i7-11370H (606 - 1086, n=17) | |
| Schenker Vision 14 | |
| MSI Modern 14 B11SB-085 | |
| Dell XPS 13 9310 Core i7 4K | |
| Huawei MateBook X Pro 2021 | |
| Cinebench R15 / CPU Single 64Bit | |
| Average of class Subnotebook (72.4 - 322, n=57, last 2 years) | |
| Lenovo Yoga Slim 7 Pro 14ACH5 | |
| Huawei MateBook 14s i7 | |
| Schenker Vision 14 | |
| Average Intel Core i7-11370H (162.9 - 233, n=15) | |
| Dell XPS 13 9310 Core i7 4K | |
| Huawei MateBook X Pro 2021 | |
| Apple MacBook Air 2020 M1 Entry | |
| MSI Modern 14 B11SB-085 | |
| Blender / v2.79 BMW27 CPU | |
| Huawei MateBook X Pro 2021 | |
| Apple MacBook Air 2020 M1 Entry | |
| Dell XPS 13 9310 Core i7 4K | |
| MSI Modern 14 B11SB-085 | |
| Average Intel Core i7-11370H (432 - 762, n=11) | |
| Schenker Vision 14 | |
| Huawei MateBook 14s i7 | |
| Average of class Subnotebook (159 - 2271, n=58, last 2 years) | |
| Lenovo Yoga Slim 7 Pro 14ACH5 | |
| 7-Zip 18.03 / 7z b 4 | |
| Lenovo Yoga Slim 7 Pro 14ACH5 | |
| Average of class Subnotebook (11668 - 77867, n=57, last 2 years) | |
| Apple MacBook Air 2020 M1 Entry | |
| Huawei MateBook 14s i7 | |
| Schenker Vision 14 | |
| Average Intel Core i7-11370H (18961 - 28520, n=11) | |
| MSI Modern 14 B11SB-085 | |
| Dell XPS 13 9310 Core i7 4K | |
| Huawei MateBook X Pro 2021 | |
| 7-Zip 18.03 / 7z b 4 -mmt1 | |
| Lenovo Yoga Slim 7 Pro 14ACH5 | |
| Average of class Subnotebook (2643 - 6699, n=59, last 2 years) | |
| Apple MacBook Air 2020 M1 Entry | |
| Schenker Vision 14 | |
| Huawei MateBook 14s i7 | |
| Average Intel Core i7-11370H (5074 - 5550, n=11) | |
| MSI Modern 14 B11SB-085 | |
| Huawei MateBook X Pro 2021 | |
| Dell XPS 13 9310 Core i7 4K | |
| Geekbench 5.5 / Multi-Core | |
| Average of class Subnotebook (2557 - 17218, n=48, last 2 years) | |
| Apple MacBook Air 2020 M1 Entry | |
| Lenovo Yoga Slim 7 Pro 14ACH5 | |
| Huawei MateBook 14s i7 | |
| Dell XPS 13 9310 Core i7 4K | |
| Schenker Vision 14 | |
| Average Intel Core i7-11370H (3828 - 6115, n=10) | |
| Huawei MateBook X Pro 2021 | |
| MSI Modern 14 B11SB-085 | |
| Geekbench 5.5 / Single-Core | |
| Average of class Subnotebook (726 - 2224, n=48, last 2 years) | |
| Apple MacBook Air 2020 M1 Entry | |
| Huawei MateBook 14s i7 | |
| Schenker Vision 14 | |
| Dell XPS 13 9310 Core i7 4K | |
| Average Intel Core i7-11370H (1376 - 1607, n=10) | |
| Lenovo Yoga Slim 7 Pro 14ACH5 | |
| MSI Modern 14 B11SB-085 | |
| Huawei MateBook X Pro 2021 | |
| HWBOT x265 Benchmark v2.2 / 4k Preset | |
| Lenovo Yoga Slim 7 Pro 14ACH5 | |
| Average of class Subnotebook (0.97 - 25.1, n=57, last 2 years) | |
| Huawei MateBook 14s i7 | |
| Schenker Vision 14 | |
| Average Intel Core i7-11370H (4.98 - 8.82, n=11) | |
| MSI Modern 14 B11SB-085 | |
| Dell XPS 13 9310 Core i7 4K | |
| Huawei MateBook X Pro 2021 | |
| LibreOffice / 20 Documents To PDF | |
| Average of class Subnotebook (39.9 - 220, n=56, last 2 years) | |
| MSI Modern 14 B11SB-085 | |
| Lenovo Yoga Slim 7 Pro 14ACH5 | |
| Dell XPS 13 9310 Core i7 4K | |
| Average Intel Core i7-11370H (23.6 - 56.5, n=11) | |
| Schenker Vision 14 | |
| Huawei MateBook X Pro 2021 | |
| Huawei MateBook 14s i7 | |
| Apple MacBook Air 2020 M1 Entry | |
| R Benchmark 2.5 / Overall mean | |
| Apple MacBook Air 2020 M1 Entry | |
| Dell XPS 13 9310 Core i7 4K | |
| Huawei MateBook X Pro 2021 | |
| MSI Modern 14 B11SB-085 | |
| Schenker Vision 14 | |
| Average Intel Core i7-11370H (0.544 - 0.596, n=11) | |
| Huawei MateBook 14s i7 | |
| Average of class Subnotebook (0.4024 - 1.456, n=58, last 2 years) | |
| Lenovo Yoga Slim 7 Pro 14ACH5 | |
* ... smaller is better
系统性能
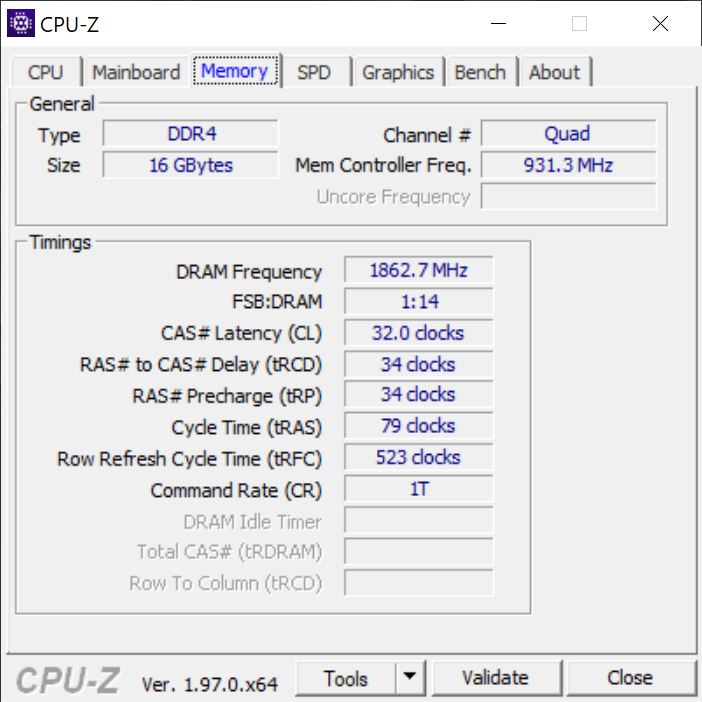
系统性能很好,硬件方面有体面的处理器、16GB LPDDR4x-RAM(3733 MHz)和快速的PCI-SSD。输入被迅速执行,在合成PCMark 10基准中的高分支持良好的主观印象。
| PCMark 10 / Score | |
| Average of class Subnotebook (4920 - 9939, n=44, last 2 years) | |
| Lenovo Yoga Slim 7 Pro 14ACH5 | |
| Huawei MateBook 14s i7 | |
| Average Intel Core i7-11370H, Intel Iris Xe Graphics G7 96EUs (5199 - 5459, n=6) | |
| Schenker Vision 14 | |
| Dell XPS 13 9310 Core i7 4K | |
| Huawei MateBook X Pro 2021 | |
| PCMark 10 / Essentials | |
| Lenovo Yoga Slim 7 Pro 14ACH5 | |
| Huawei MateBook 14s i7 | |
| Average of class Subnotebook (8552 - 11646, n=44, last 2 years) | |
| Average Intel Core i7-11370H, Intel Iris Xe Graphics G7 96EUs (9996 - 10650, n=6) | |
| Schenker Vision 14 | |
| Huawei MateBook X Pro 2021 | |
| Dell XPS 13 9310 Core i7 4K | |
| PCMark 10 / Productivity | |
| Lenovo Yoga Slim 7 Pro 14ACH5 | |
| Average of class Subnotebook (5435 - 16606, n=44, last 2 years) | |
| Huawei MateBook 14s i7 | |
| Average Intel Core i7-11370H, Intel Iris Xe Graphics G7 96EUs (6911 - 7388, n=6) | |
| Schenker Vision 14 | |
| Huawei MateBook X Pro 2021 | |
| Dell XPS 13 9310 Core i7 4K | |
| PCMark 10 / Digital Content Creation | |
| Average of class Subnotebook (5722 - 13779, n=44, last 2 years) | |
| Lenovo Yoga Slim 7 Pro 14ACH5 | |
| Huawei MateBook 14s i7 | |
| Average Intel Core i7-11370H, Intel Iris Xe Graphics G7 96EUs (5483 - 5838, n=6) | |
| Schenker Vision 14 | |
| Dell XPS 13 9310 Core i7 4K | |
| Huawei MateBook X Pro 2021 | |
| PCMark 10 Score | 5419 points | |
Help | ||
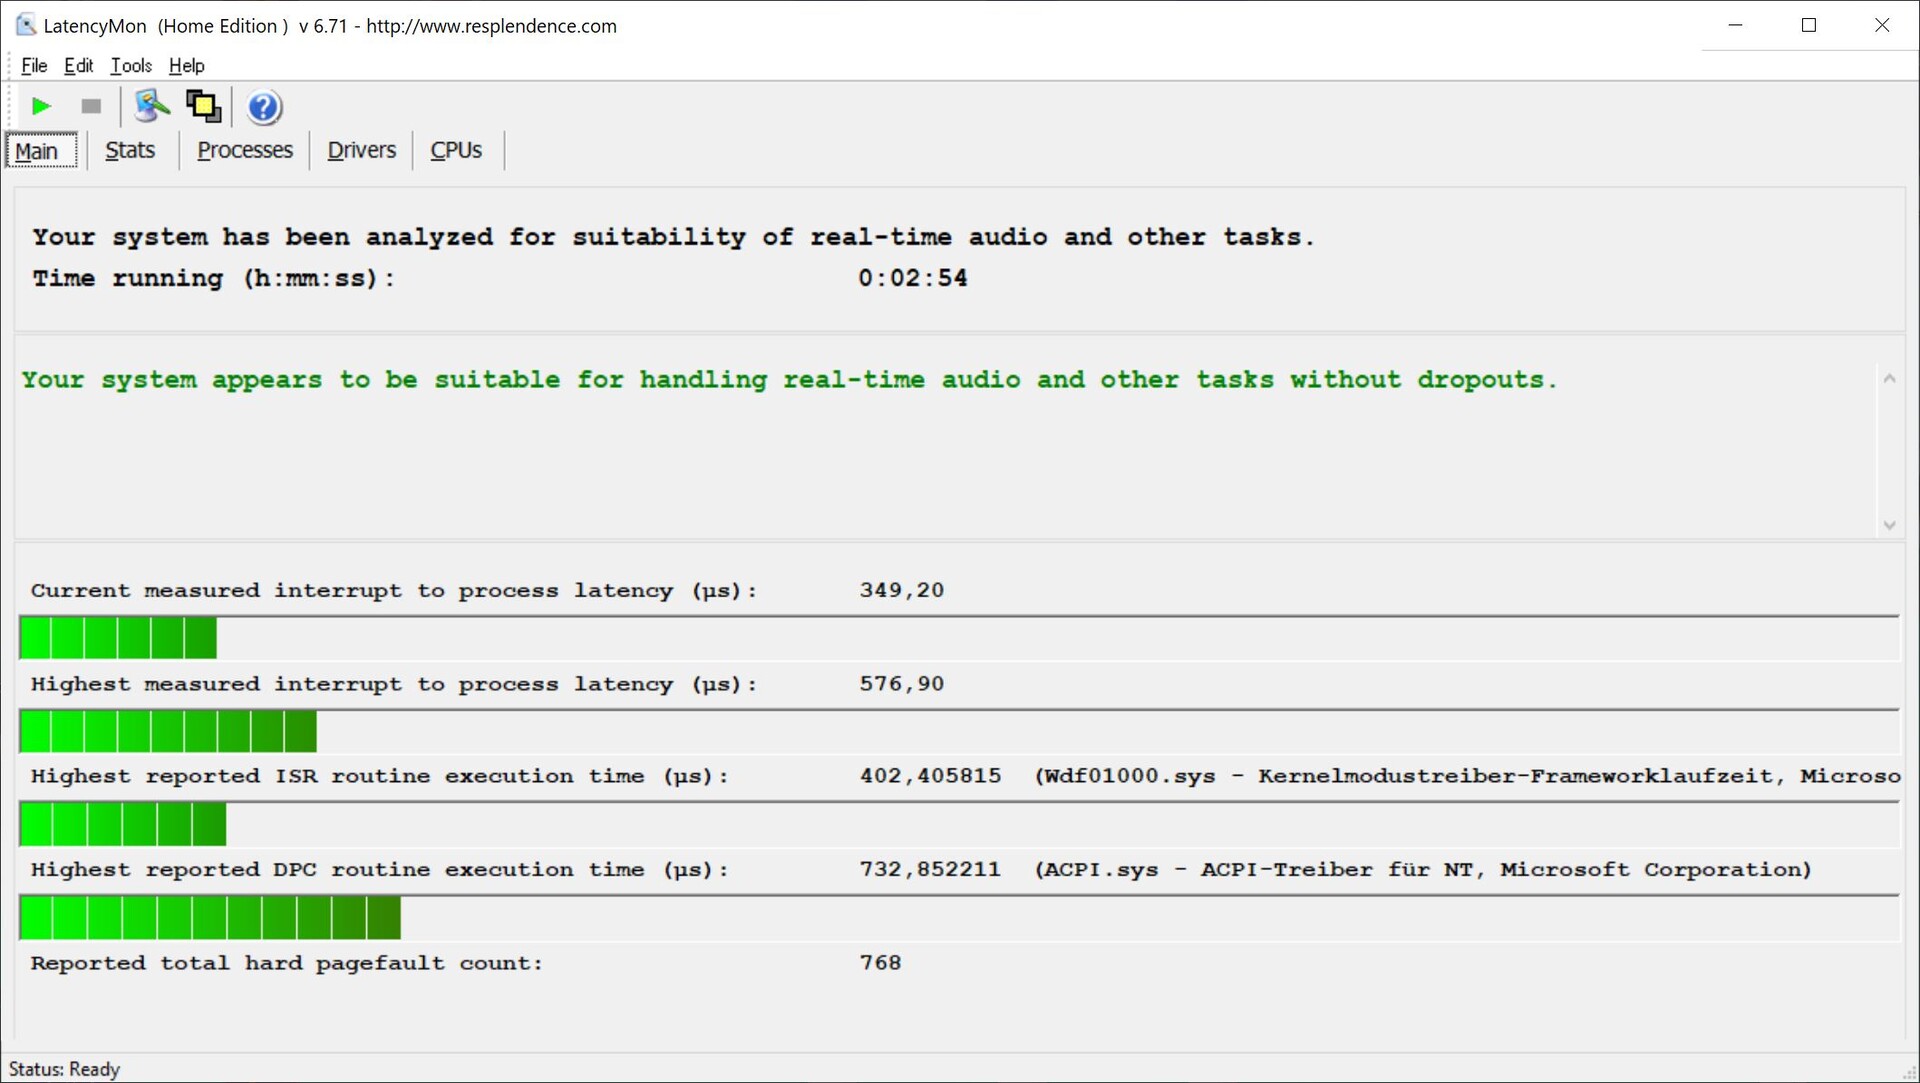
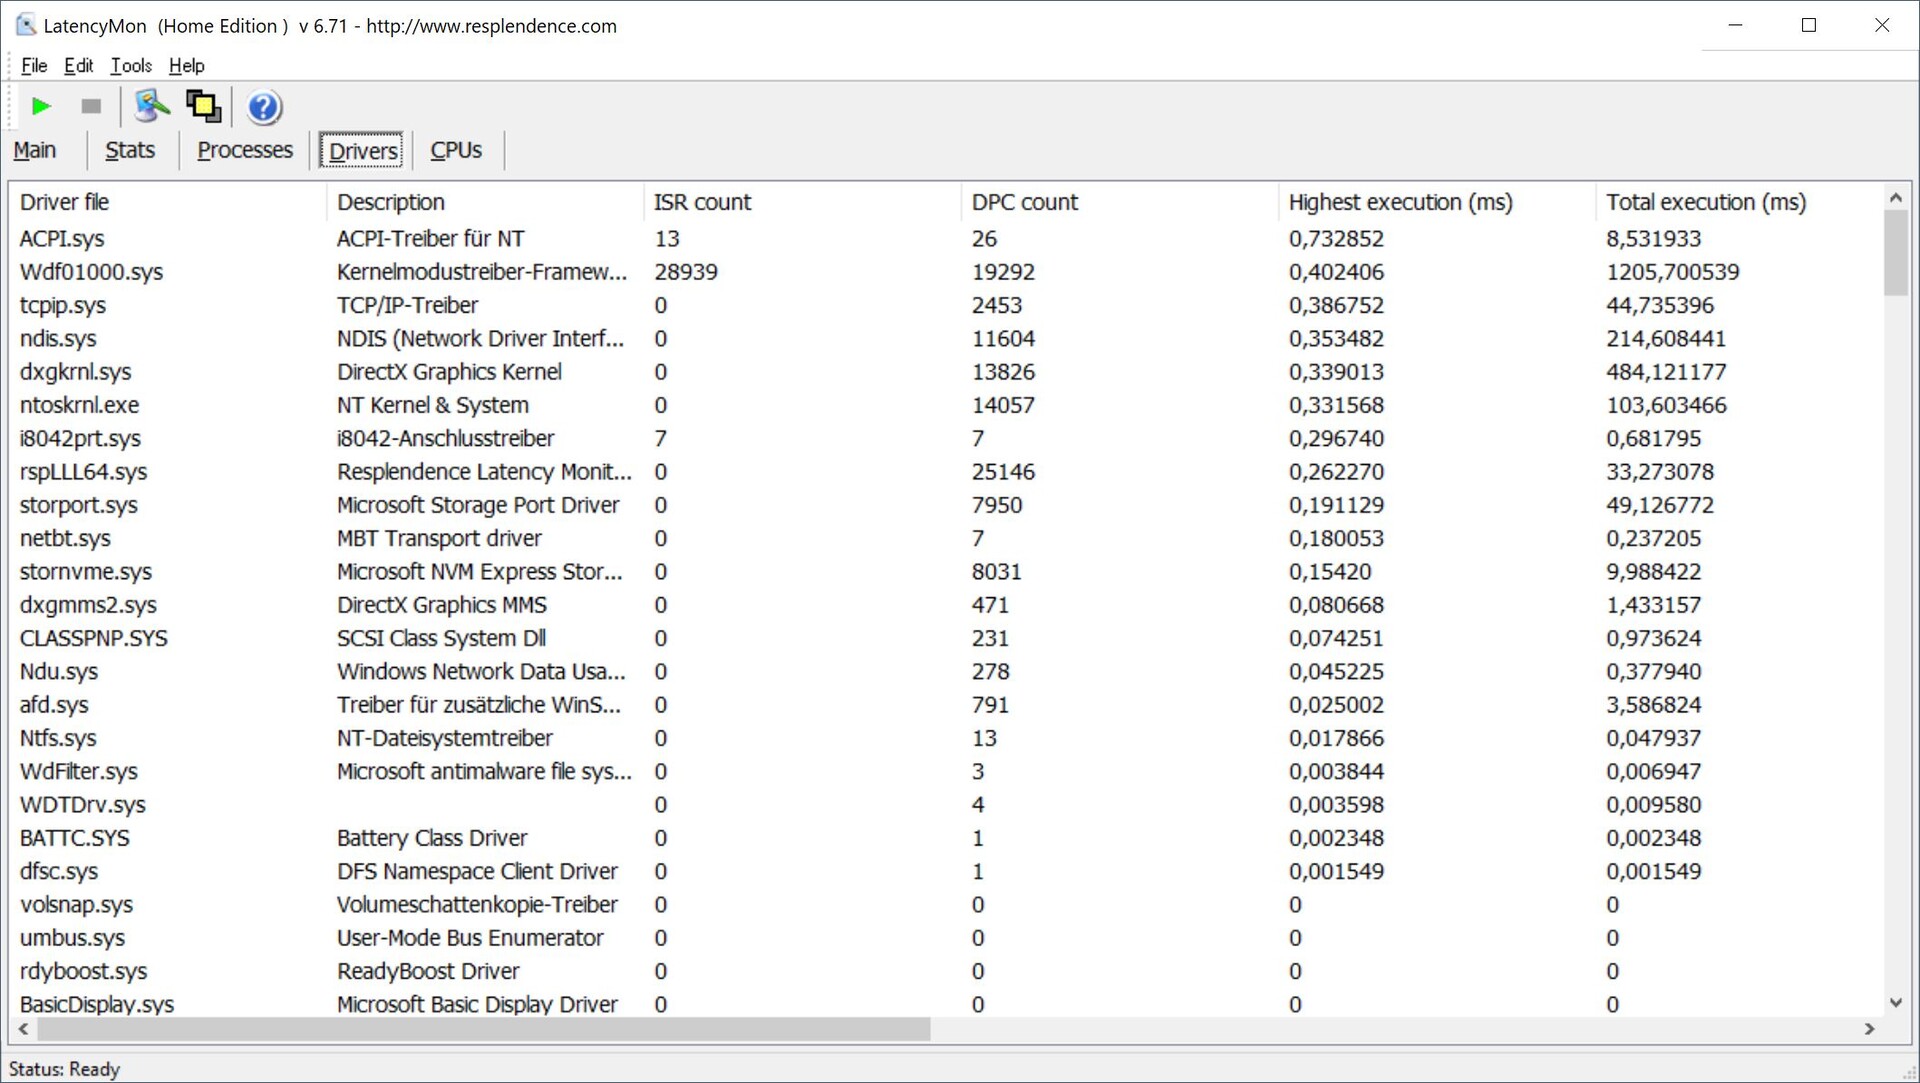
DPC延时
我们的标准化延迟测试(网页浏览、YouTube 4K播放、CPU负载)没有显示出MateBook 14s的任何限制,所以它适合使用实时音频应用程序。
| DPC Latencies / LatencyMon - interrupt to process latency (max), Web, Youtube, Prime95 | |
| Dell XPS 13 9310 Core i7 4K | |
| Huawei MateBook X Pro 2021 | |
| Schenker Vision 14 | |
| Huawei MateBook 14s i7 | |
| Lenovo Yoga Slim 7 Pro 14ACH5 | |
* ... smaller is better
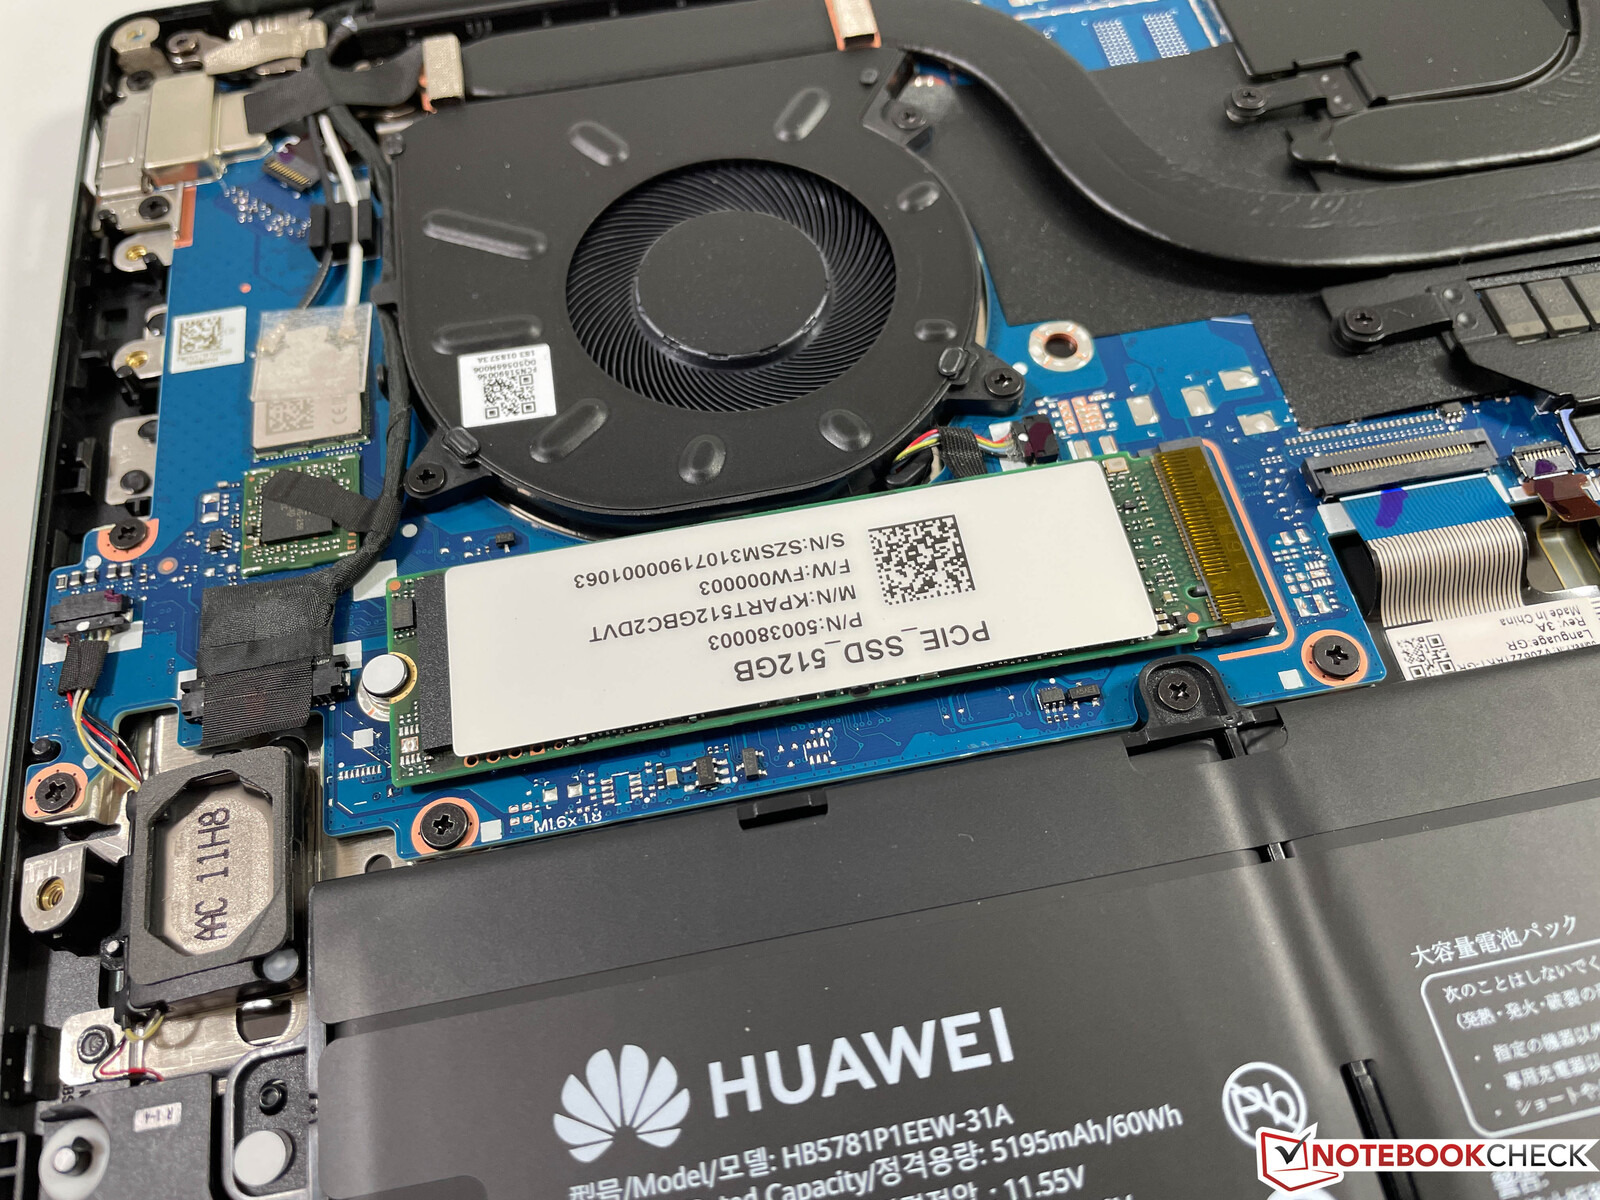
存储设备
华为使用PCIe-3.0-x4固态硬盘,代号为KPART512,存储容量为512GB,这与东芝XG6相同。传输速率还不错,但与之前的MateBooks类似,该驱动器被分为两个分区,系统驱动器在初始设置后只有71GB的可用存储空间,这不是很慷慨。当你在应用安装或下载时不注意,这可能很快导致硬盘满了。华为应该在即将推出的设备中摆脱这些分区。现代PCIe 4.0标准还不被支持。更多的SSD基准测试可以在我们的 技术部分.
| Huawei MateBook 14s i7 Toshiba XG6 KXG60ZNV512G | Huawei MateBook X Pro 2021 Samsung PM981a MZVLB1T0HBLR | Lenovo Yoga Slim 7 Pro 14ACH5 SK Hynix PC711 1TB HFS001TDE9X084N | Schenker Vision 14 Samsung SSD 980 Pro 1TB MZ-V8P1T0BW | Dell XPS 13 9310 Core i7 4K Micron 2300 512GB MTFDHBA512TDV | Average Toshiba XG6 KXG60ZNV512G | |
|---|---|---|---|---|---|---|
| CrystalDiskMark 5.2 / 6 | 2% | -4% | 50% | -25% | -27% | |
| Write 4K (MB/s) | 209.4 | 197.5 -6% | 154 -26% | 240 15% | 86 -59% | 112.8 ? -46% |
| Read 4K (MB/s) | 56.8 | 52.9 -7% | 65.3 15% | 90.9 60% | 40.11 -29% | 42.7 ? -25% |
| Write Seq (MB/s) | 2174 | 2288 | 4236 | 1738 | 1489 ? | |
| Read Seq (MB/s) | 2156 | 2154 | 4101 | 1553 | 1771 ? | |
| Write 4K Q32T1 (MB/s) | 606 | 632 4% | 459.9 -24% | 662 9% | 454.9 -25% | 345 ? -43% |
| Read 4K Q32T1 (MB/s) | 792 | 694 -12% | 556 -30% | 720 -9% | 385.4 -51% | 359 ? -55% |
| Write Seq Q32T1 (MB/s) | 2322 | 3017 30% | 3277 41% | 5222 125% | 2784 20% | 2257 ? -3% |
| Read Seq Q32T1 (MB/s) | 3511 | 3561 1% | 3520 0% | 7102 102% | 3217 -8% | 2926 ? -17% |
| Write 4K Q8T8 (MB/s) | 1573 | 1080 ? -31% | ||||
| Read 4K Q8T8 (MB/s) | 1202 | 1232 ? 2% | ||||
| AS SSD | 11% | 17% | 71% | -68% | -29% | |
| Seq Read (MB/s) | 2961 | 2794 -6% | 2965 0% | 4899 65% | 2144 -28% | 2456 ? -17% |
| Seq Write (MB/s) | 2098 | 2385 14% | 2697 29% | 3952 88% | 1389 -34% | 1493 ? -29% |
| 4K Read (MB/s) | 53 | 60.7 15% | 55.6 5% | 83.8 58% | 49.77 -6% | 44.1 ? -17% |
| 4K Write (MB/s) | 186.9 | 180.8 -3% | 144.4 -23% | 205 10% | 105 -44% | 119.3 ? -36% |
| 4K-64 Read (MB/s) | 1131 | 1768 56% | 1589 40% | 2938 160% | 855 -24% | 980 ? -13% |
| 4K-64 Write (MB/s) | 1502 | 1800 20% | 1733 15% | 2077 38% | 1660 11% | 1180 ? -21% |
| Access Time Read * (ms) | 0.029 | 0.037 -28% | 0.032 -10% | 0.025 14% | 0.058 -100% | 0.08057 ? -178% |
| Access Time Write * (ms) | 0.026 | 0.073 -181% | 0.026 -0% | 0.02 23% | 0.272 -946% | 0.055 ? -112% |
| Score Read (Points) | 1480 | 2108 42% | 1941 31% | 3512 137% | 1119 -24% | 1269 ? -14% |
| Score Write (Points) | 1899 | 2219 17% | 2147 13% | 2677 41% | 1904 0% | 1449 ? -24% |
| Score Total (Points) | 4102 | 5392 31% | 5073 24% | 7939 94% | 3570 -13% | 3326 ? -19% |
| Copy ISO MB/s (MB/s) | 1512 | 2065 37% | 2218 47% | 2100 39% | 1929 28% | 1894 ? 25% |
| Copy Program MB/s (MB/s) | 376.3 | 734 95% | 577 53% | 994 164% | 1012 169% | 552 ? 47% |
| Copy Game MB/s (MB/s) | 1115 | 1629 46% | 1324 19% | 1859 67% | 1737 56% | 1187 ? 6% |
| Total Average (Program / Settings) | 7% /
8% | 7% /
11% | 61% /
65% | -47% /
-55% | -28% /
-28% |
* ... smaller is better

Disk Throttling: DiskSpd Read Loop, Queue Depth 8
GPU性能
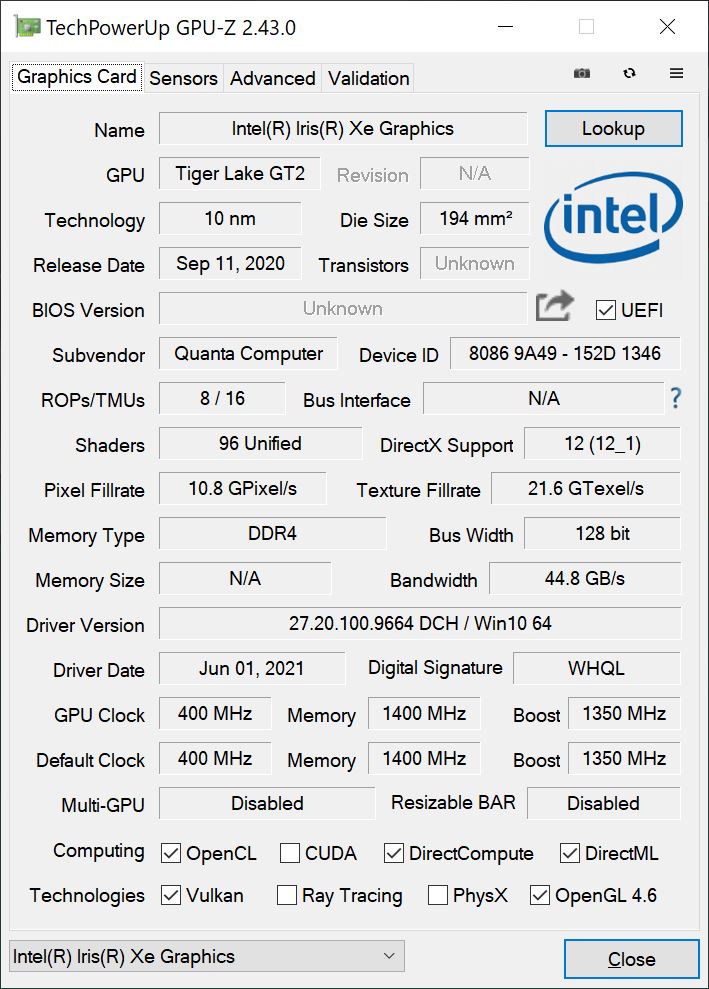
显卡是我们熟悉的Iris Xe Graphics G7 (96 EUs)来自酷睿i7 U系列CPU,MateBook 14s在基准测试中介于采用普通U系列芯片的设备之间。Xe Graphics的最大优势是多媒体应用,包括高分辨率视频的播放。与目前AMD的iGPU相比,英特尔iGPU的性能也稍好。性能模式对图形性能没有影响。
MateBook 14s在游戏方面并不完美;只有老的或要求不高的游戏能在低或中等细节下顺利运行,但图形性能至少是稳定的,而且很容易通过苛刻的Time Spy 压力测试(99.7%)。在电池电量方面的表现也是类似的。
| 3DMark 11 Performance | 7483 points | |
| 3DMark Cloud Gate Standard Score | 19734 points | |
| 3DMark Fire Strike Score | 4898 points | |
| 3DMark Time Spy Score | 1886 points | |
Help | ||
Witcher 3 FPS Chart
| low | med. | high | ultra | |
|---|---|---|---|---|
| GTA V (2015) | 111 | 95.8 | 28.5 | 11.2 |
| The Witcher 3 (2015) | 101 | 65 | 35 | 14.5 |
| Dota 2 Reborn (2015) | 128 | 90.6 | 65.5 | 58 |
| Final Fantasy XV Benchmark (2018) | 46.1 | 25.9 | 25.9 | |
| X-Plane 11.11 (2018) | 47.6 | 39.1 | 34.9 | |
| Far Cry 5 (2018) | 58 | 30 | 28 | 26 |
| Strange Brigade (2018) | 93 | 41 | 33 | 27 |
| F1 2020 (2020) | 80 | 47 | 37 | 21 |
排放 - MateBook通常很安静
系统噪音
华为使用两个风扇与两个热管,MateBook 14s在实践中通常是一个非常安静的设备。即使是游戏,也经常可以达到约32 dB(A)(在两种电源模式下),只有高的CPU负载才会导致风扇的声音更大。虽然两种电源模式之间没有大的差别,平衡模式为~44 dB(A),性能模式为~47 dB(A)。在我们的测试设备上,我们没有注意到任何其他电子声音或线圈啸叫。
Noise level
| Idle |
| 24.3 / 24.3 / 28.4 dB(A) |
| Load |
| 31.7 / 46.8 dB(A) |
 | ||
30 dB silent 40 dB(A) audible 50 dB(A) loud |
||
min: | ||
| Huawei MateBook 14s i7 Iris Xe G7 96EUs, i7-11370H, Toshiba XG6 KXG60ZNV512G | Huawei MateBook X Pro 2021 Iris Xe G7 96EUs, i7-1165G7, Samsung PM981a MZVLB1T0HBLR | Lenovo Yoga Slim 7 Pro 14ACH5 Vega 8, R9 5900HX, SK Hynix PC711 1TB HFS001TDE9X084N | Schenker Vision 14 Iris Xe G7 96EUs, i7-1165G7, Samsung SSD 980 Pro 1TB MZ-V8P1T0BW | Dell XPS 13 9310 Core i7 4K Iris Xe G7 96EUs, i7-1185G7, Micron 2300 512GB MTFDHBA512TDV | |
|---|---|---|---|---|---|
| Noise | 3% | -1% | -6% | -1% | |
| off / environment * (dB) | 24.3 | 25.4 -5% | 26 -7% | 25 -3% | 27.7 -14% |
| Idle Minimum * (dB) | 24.3 | 25.6 -5% | 26 -7% | 25 -3% | 27.8 -14% |
| Idle Average * (dB) | 24.3 | 25.6 -5% | 26.5 -9% | 25 -3% | 27.8 -14% |
| Idle Maximum * (dB) | 28.4 | 25.6 10% | 27.4 4% | 26.9 5% | 27.8 2% |
| Load Average * (dB) | 31.7 | 28.7 9% | 35 -10% | 38.6 -22% | 27.9 12% |
| Witcher 3 ultra * (dB) | 31.7 | 32 -1% | 41.2 -30% | 32.8 -3% | |
| Load Maximum * (dB) | 46.8 | 38.2 18% | 34.6 26% | 41.2 12% | 37 21% |
* ... smaller is better
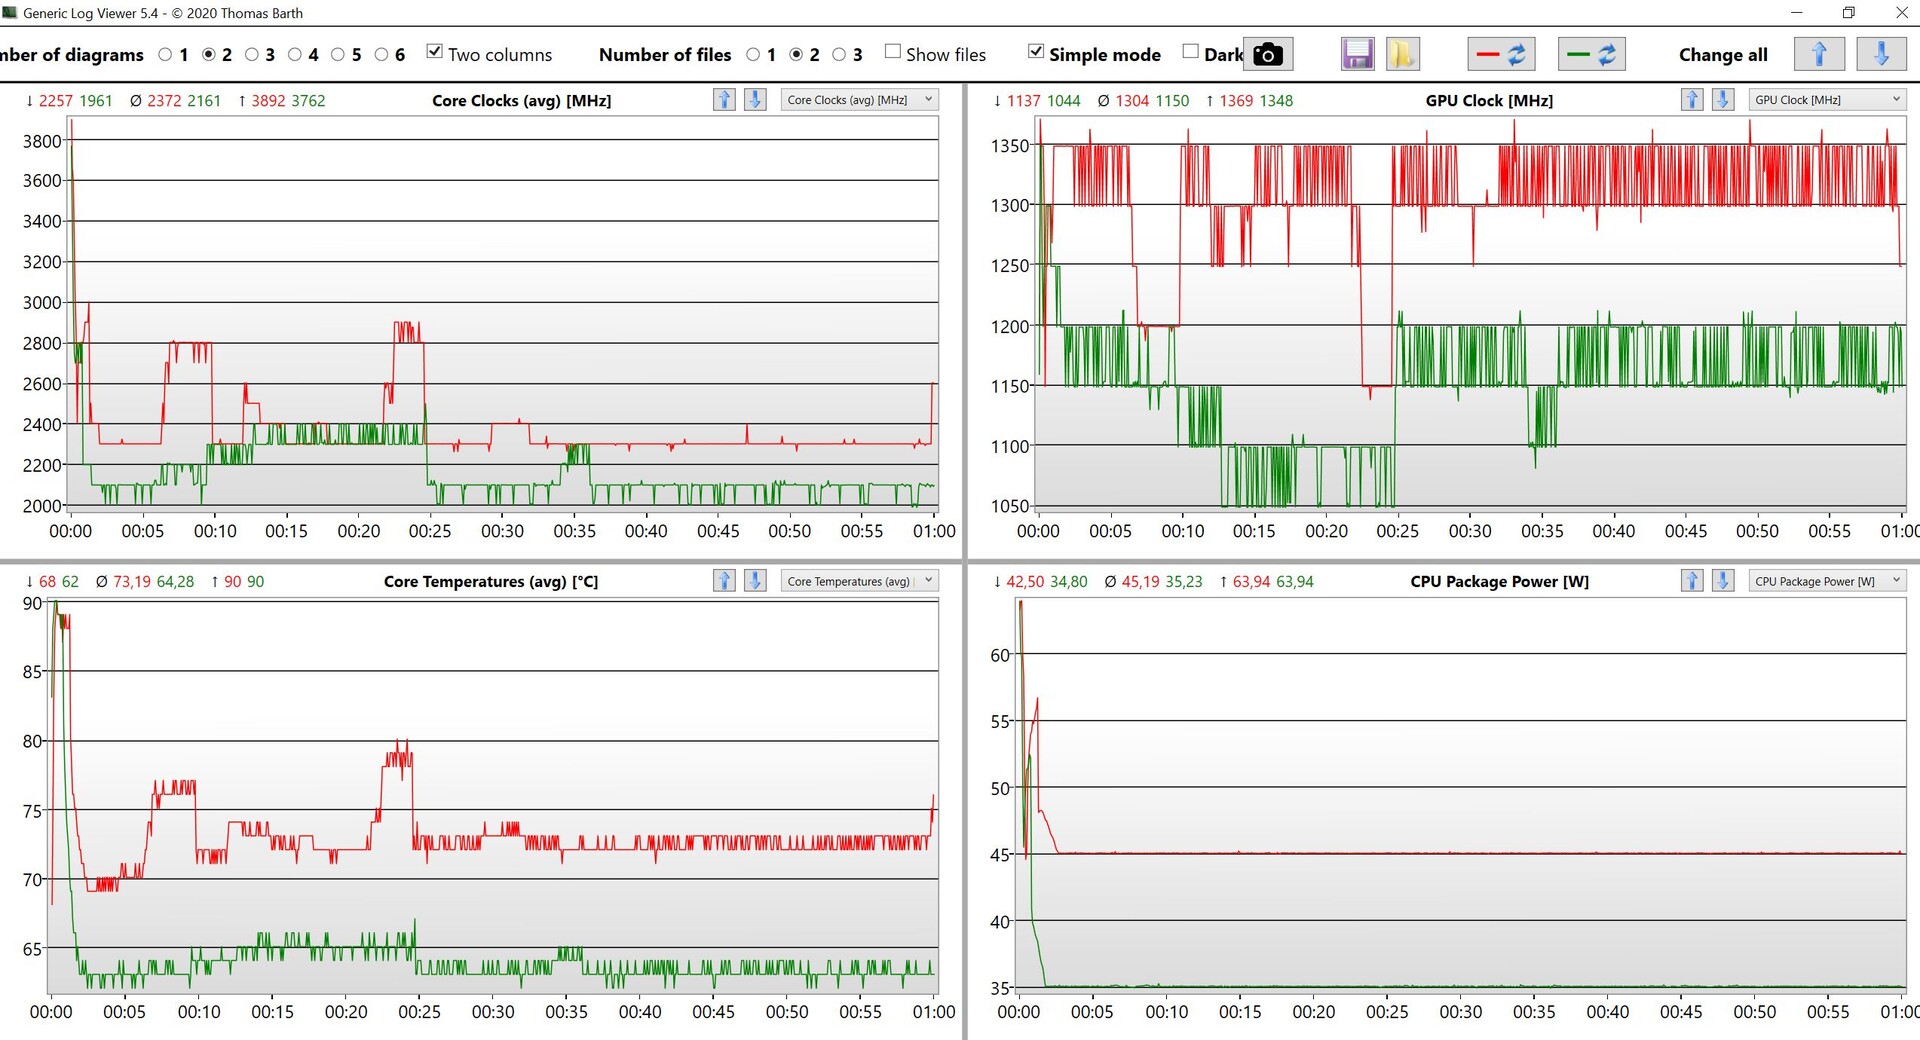
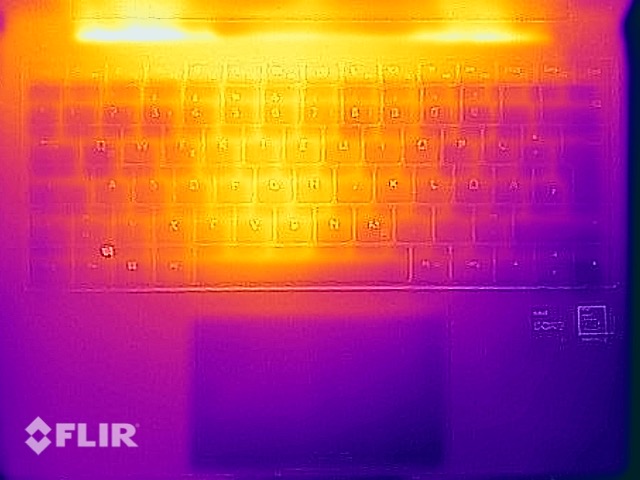
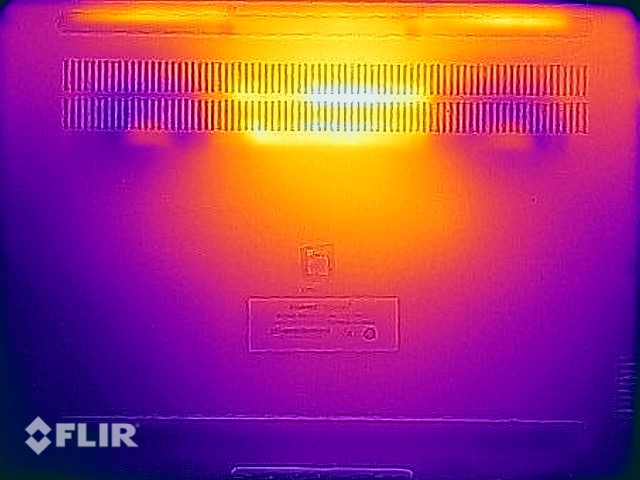
温度
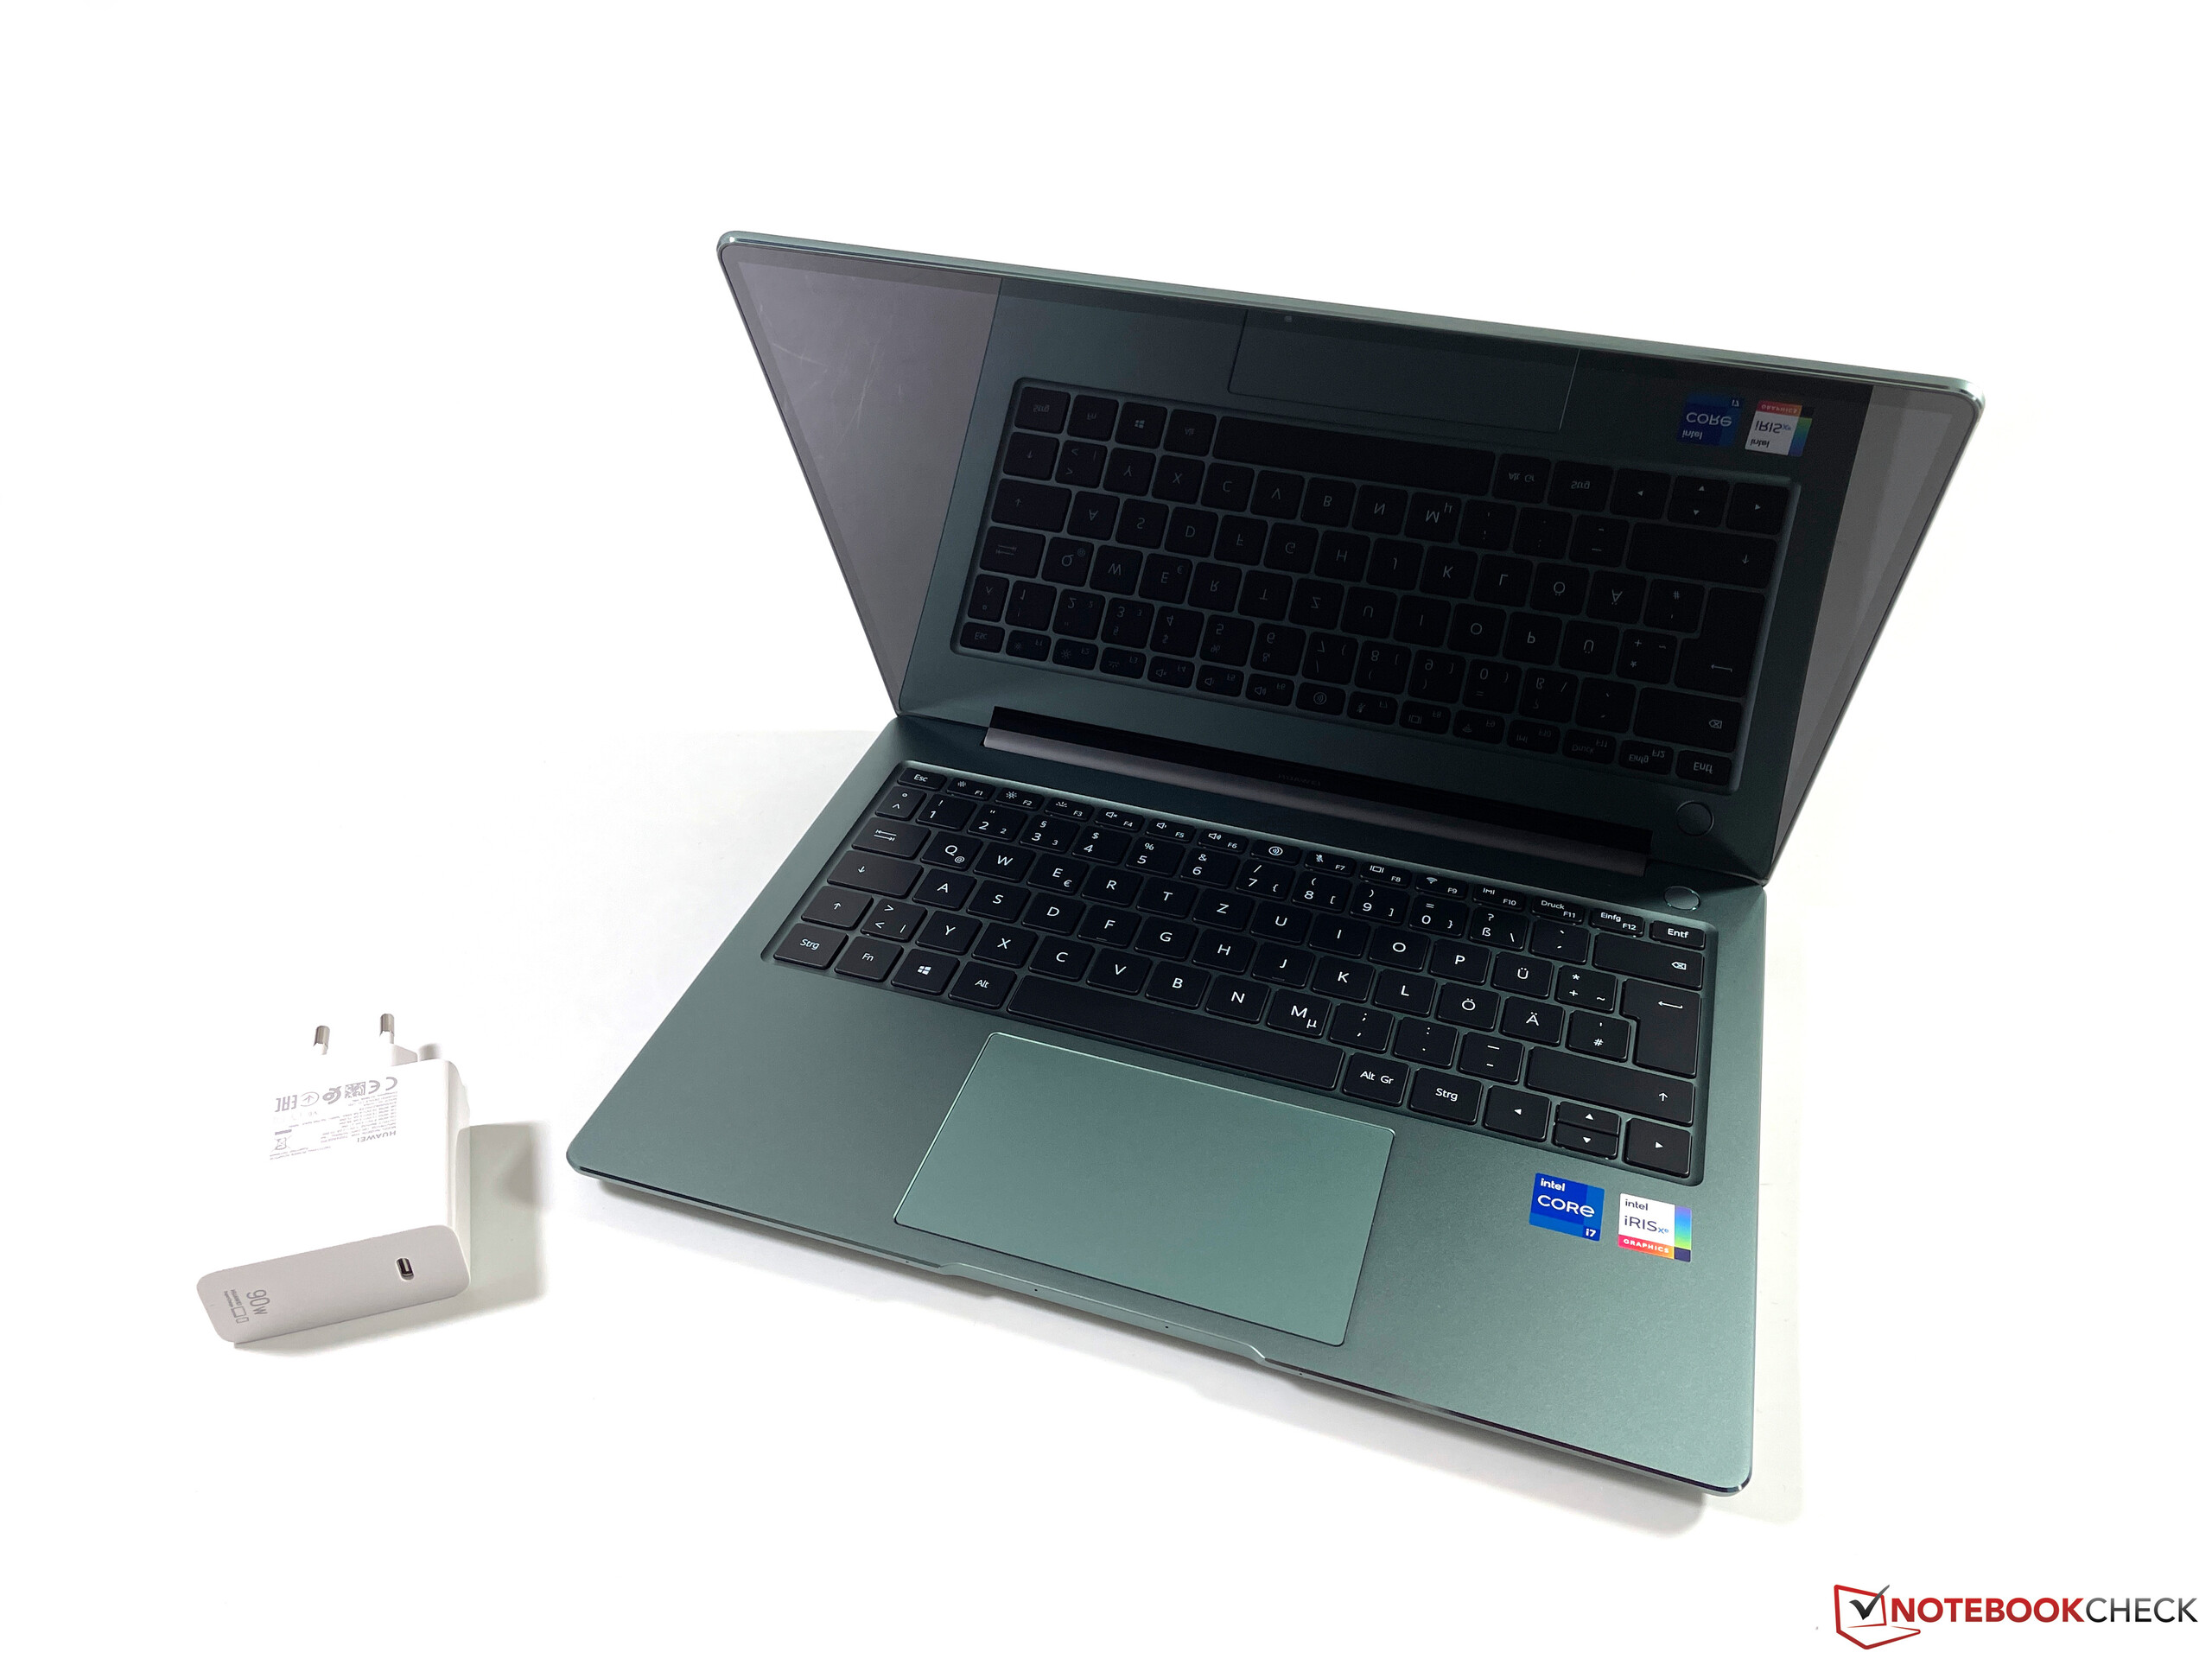
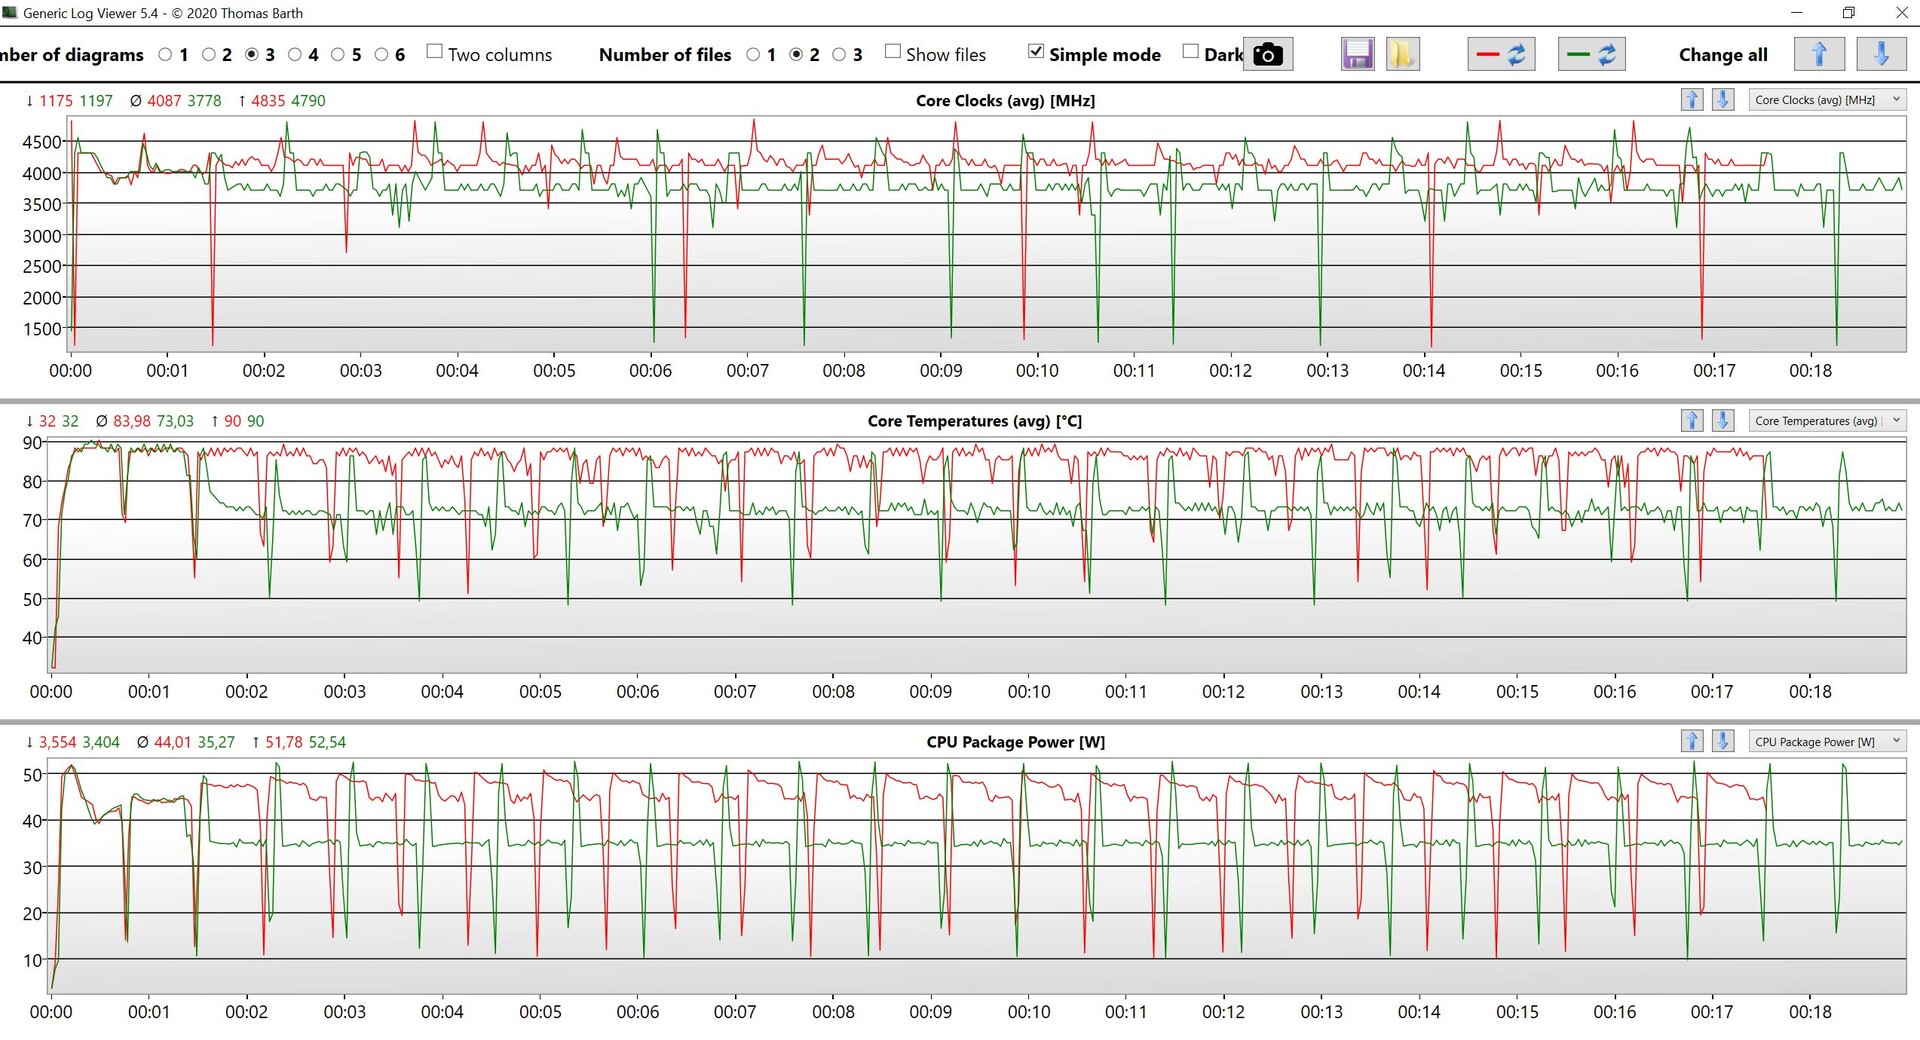
冷却解决方案做得很好,即使在压力测试中也只有少数地方达到40℃以上。这意味着在负载下绝对没有任何限制,你仍然可以舒适地在你的腿上使用该设备。只有紧凑的电源适配器(90W)在压力测试和为电池充电时变得相当热,超过60℃,所以你绝对不应该用毯子/垫子盖住它。
在压力测试中,MateBook 14s的性能很稳定。根据不同的电源模式,TDP稳定在35或45瓦,这对一个紧凑的设备来说是个好结果。
(±) The maximum temperature on the upper side is 41.1 °C / 106 F, compared to the average of 35.9 °C / 97 F, ranging from 21.4 to 59 °C for the class Subnotebook.
(-) The bottom heats up to a maximum of 45.4 °C / 114 F, compared to the average of 39.2 °C / 103 F
(+) In idle usage, the average temperature for the upper side is 24.8 °C / 77 F, compared to the device average of 30.8 °C / 87 F.
(±) Playing The Witcher 3, the average temperature for the upper side is 33.6 °C / 92 F, compared to the device average of 30.8 °C / 87 F.
(+) The palmrests and touchpad are cooler than skin temperature with a maximum of 28.6 °C / 83.5 F and are therefore cool to the touch.
(±) The average temperature of the palmrest area of similar devices was 28.2 °C / 82.8 F (-0.4 °C / -0.7 F).
发言人
MateBook 14s配备了四个扬声器,它们位于底座的前下部。声音非常好,在高音量下几乎没有任何失真。音乐或视频播放是相当令人愉快的,但扬声器缺乏一些冲击力。四个麦克风负责语音录制,在我们的测试中,声音非常清晰。
Huawei MateBook 14s i7 audio analysis
(+) | speakers can play relatively loud (84.1 dB)
Bass 100 - 315 Hz
(±) | reduced bass - on average 7.7% lower than median
(±) | linearity of bass is average (7.5% delta to prev. frequency)
Mids 400 - 2000 Hz
(+) | balanced mids - only 4.2% away from median
(+) | mids are linear (5.2% delta to prev. frequency)
Highs 2 - 16 kHz
(+) | balanced highs - only 2% away from median
(+) | highs are linear (4.1% delta to prev. frequency)
Overall 100 - 16.000 Hz
(+) | overall sound is linear (9.5% difference to median)
Compared to same class
» 5% of all tested devices in this class were better, 2% similar, 93% worse
» The best had a delta of 5%, average was 18%, worst was 53%
Compared to all devices tested
» 4% of all tested devices were better, 1% similar, 95% worse
» The best had a delta of 4%, average was 24%, worst was 134%
Dell XPS 13 9310 Core i7 4K audio analysis
(+) | speakers can play relatively loud (84.6 dB)
Bass 100 - 315 Hz
(±) | reduced bass - on average 13.1% lower than median
(±) | linearity of bass is average (11.1% delta to prev. frequency)
Mids 400 - 2000 Hz
(+) | balanced mids - only 4.3% away from median
(+) | mids are linear (4.2% delta to prev. frequency)
Highs 2 - 16 kHz
(+) | balanced highs - only 1.5% away from median
(+) | highs are linear (3.8% delta to prev. frequency)
Overall 100 - 16.000 Hz
(+) | overall sound is linear (10.9% difference to median)
Compared to same class
» 9% of all tested devices in this class were better, 3% similar, 88% worse
» The best had a delta of 5%, average was 18%, worst was 53%
Compared to all devices tested
» 6% of all tested devices were better, 2% similar, 92% worse
» The best had a delta of 4%, average was 24%, worst was 134%
Apple MacBook Air 2020 M1 Entry audio analysis
(±) | speaker loudness is average but good (79.6 dB)
Bass 100 - 315 Hz
(±) | reduced bass - on average 7.1% lower than median
(±) | linearity of bass is average (9.5% delta to prev. frequency)
Mids 400 - 2000 Hz
(+) | balanced mids - only 2.2% away from median
(+) | mids are linear (5.3% delta to prev. frequency)
Highs 2 - 16 kHz
(+) | balanced highs - only 2.3% away from median
(+) | highs are linear (4% delta to prev. frequency)
Overall 100 - 16.000 Hz
(+) | overall sound is linear (8.7% difference to median)
Compared to same class
» 3% of all tested devices in this class were better, 1% similar, 96% worse
» The best had a delta of 5%, average was 18%, worst was 53%
Compared to all devices tested
» 3% of all tested devices were better, 1% similar, 97% worse
» The best had a delta of 4%, average was 24%, worst was 134%
能源管理--尽管有2.5k显示屏,但运行时间长
消耗功率
与MateBook 14 相比,华为设法将空闲消耗保持在同一水平,尽管显示屏稍大,分辨率更高。这是LTPS技术的结果,但也是最大亮度略低的原因。90赫兹模式在空闲测量中只有很小的影响(+0.6W)。你可以注意到负载下的高TDP,因为我们在压力测试期间测量到88W,几分钟后会平息在70W左右。因此,附带的90W电源适配器是足够的。
| Off / Standby | |
| Idle | |
| Load |
|
Key:
min: | |
| Huawei MateBook 14s i7 i7-11370H, Iris Xe G7 96EUs, Toshiba XG6 KXG60ZNV512G, LTPS, 2520x1680, 14.2" | Huawei MateBook X Pro 2021 i7-1165G7, Iris Xe G7 96EUs, Samsung PM981a MZVLB1T0HBLR, IPS, 3000x2000, 13.9" | Lenovo Yoga Slim 7 Pro 14ACH5 R9 5900HX, Vega 8, SK Hynix PC711 1TB HFS001TDE9X084N, IPS, 2880x1800, 14" | Schenker Vision 14 i7-1165G7, Iris Xe G7 96EUs, Samsung SSD 980 Pro 1TB MZ-V8P1T0BW, IPS, 2880x1800, 14" | Dell XPS 13 9310 Core i7 4K i7-1185G7, Iris Xe G7 96EUs, Micron 2300 512GB MTFDHBA512TDV, IPS, 3840x2400, 13.4" | Apple MacBook Air 2020 M1 Entry M1, M1 7-Core GPU, Apple SSD AP0256Q, IPS, 2560x1600, 13.3" | Huawei MateBook 14 2020 Intel i7-10510U, GeForce MX350, Lite-On CA5-8D512, IPS LED, 2160x1440, 14" | Average Intel Iris Xe Graphics G7 96EUs | Average of class Subnotebook | |
|---|---|---|---|---|---|---|---|---|---|
| Power Consumption | -1% | 0% | -31% | 10% | 44% | -4% | -3% | 18% | |
| Idle Minimum * (Watt) | 4.4 | 6.7 -52% | 4.6 -5% | 9.8 -123% | 4.3 2% | 1.9 57% | 3 32% | 5.51 ? -25% | 3.82 ? 13% |
| Idle Average * (Watt) | 8.7 | 10 -15% | 7.7 11% | 12.5 -44% | 8.3 5% | 6.4 26% | 9 -3% | 8.66 ? -0% | 6.61 ? 24% |
| Idle Maximum * (Watt) | 9.6 | 10.3 -7% | 10.3 -7% | 13.7 -43% | 8.8 8% | 7 27% | 11 -15% | 10.9 ? -14% | 7.99 ? 17% |
| Load Average * (Watt) | 46 | 35.7 22% | 54 -17% | 39.3 15% | 46.2 -0% | 25 46% | 60.8 -32% | 45.6 ? 1% | 41.9 ? 9% |
| Witcher 3 ultra * (Watt) | 42.2 | 32.7 23% | 54.4 -29% | 44.8 -6% | 42.2 -0% | 56 -33% | |||
| Load Maximum * (Watt) | 87.6 | 67.6 23% | 44.5 49% | 72.8 17% | 47.3 46% | 30.3 65% | 65.6 25% | 67.8 ? 23% | 64.1 ? 27% |
* ... smaller is better
Energieaufnahme Witcher 3 / Stresstest
电池运行时间
60Wh的电池管理着良好的电池运行时间,我们可以再次看到LTPS显示屏的影响,因为尽管分辨率很高,在调整亮度为150cd/M²(最大亮度的51%)的情况下,我们仍然记录了超过10(Wi-Fi测试)或11.5小时(视频测试)的实际运行时间。当你使用90赫兹模式时,Wi-Fi运行时间会缩短一小时左右,而当你使用最大亮度(60赫兹)时,电池会在7小时左右耗尽。
90瓦的电源适配器支持所谓的超级充电技术。当设备开启时,完全充电需要78分钟,但50%的容量只需28分钟就可以完成。
| Huawei MateBook 14s i7 i7-11370H, Iris Xe G7 96EUs, 60 Wh | Huawei MateBook X Pro 2021 i7-1165G7, Iris Xe G7 96EUs, 56 Wh | Lenovo Yoga Slim 7 Pro 14ACH5 R9 5900HX, Vega 8, 61 Wh | Schenker Vision 14 i7-1165G7, Iris Xe G7 96EUs, 53 Wh | Dell XPS 13 9310 Core i7 4K i7-1185G7, Iris Xe G7 96EUs, 52 Wh | Apple MacBook Air 2020 M1 Entry M1, M1 7-Core GPU, 49.9 Wh | Average of class Subnotebook | |
|---|---|---|---|---|---|---|---|
| Battery runtime | 45% | -10% | -42% | -30% | 55% | 31% | |
| H.264 (h) | 11.6 | 10.4 -10% | 6.7 -42% | 15.6 ? 34% | |||
| WiFi v1.3 (h) | 10.3 | 10.5 2% | 9 -13% | 6.1 -41% | 7.2 -30% | 16 55% | 14 ? 36% |
| Load (h) | 1.6 | 3 88% | 1.5 -6% | 1.946 ? 22% | |||
| Reader / Idle (h) | 19.5 | 21.7 | 28.6 ? |
Pros
Cons
结论 - 更好的MateBook X Pro
新的MateBook 14s在我们的审查中留下了良好的印象,它更接近于指定的旗舰机MateBook X Pro比MateBook 14.有一些小的改进,如屏幕上方的新摄像头位置,更高的面板分辨率,额外的HDMI输出以及改进的扬声器。铝制机身处于同样高的水平,我们喜欢可选颜色云杉绿。
英特尔的酷睿i7处理器并不真正令人信服。它基本上是一个标准的U系列处理器(如i7-1165G7或i7-1185G7),有四个核心,只是在35或45瓦的较高功率限制下运行。这几乎没有创新,但MateBook 14s的性能利用率至少是相当不错的。虽然华为没有包括现代技术,如Thunderbolt或PCIe 4.0,可能是出于成本原因。
新的MateBook 14s是一款非常好的次笔记本,也比之前的旗舰设备MateBook X Pro获得更好的评价。我们可以推荐MateBook 14s,因为它在许多方面都令人信服,只有少数缺点。
新的高分辨率,包括可选的90赫兹模式,可以创造出色彩准确的清晰图片,但在户外使用时,它可以更亮一点。3:2的长宽比对生产任务来说是很好的,但如果你经常看电影或流媒体视频,你可能最好选择16:10的设备,如戴尔XPS 9310或瑜伽超薄7 Pro(它还提供更多的CPU功率)。然而,如果你正在寻找一个更轻、更紧凑的设备,我们推荐申克公司的Vision 14或MacBook Air M1.
Huawei MateBook 14s i7
- 10/05/2021 v7 (old)
Andreas Osthoff
Price comparison

