


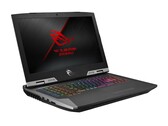
华硕ROG G703GXR笔记本电脑评测:高端老派游戏本
华硕ROG G703GXR是一款典型的台式机替代品游戏笔记本电脑,专注于性能和功能。 请继续阅读,以了解这17.3英寸的笔记本如何与更紧凑的竞争对手抗衡。
Intel Core i7-9750H, NVIDIA GeForce RTX 2080 Mobile, 17.3", 4.7 kg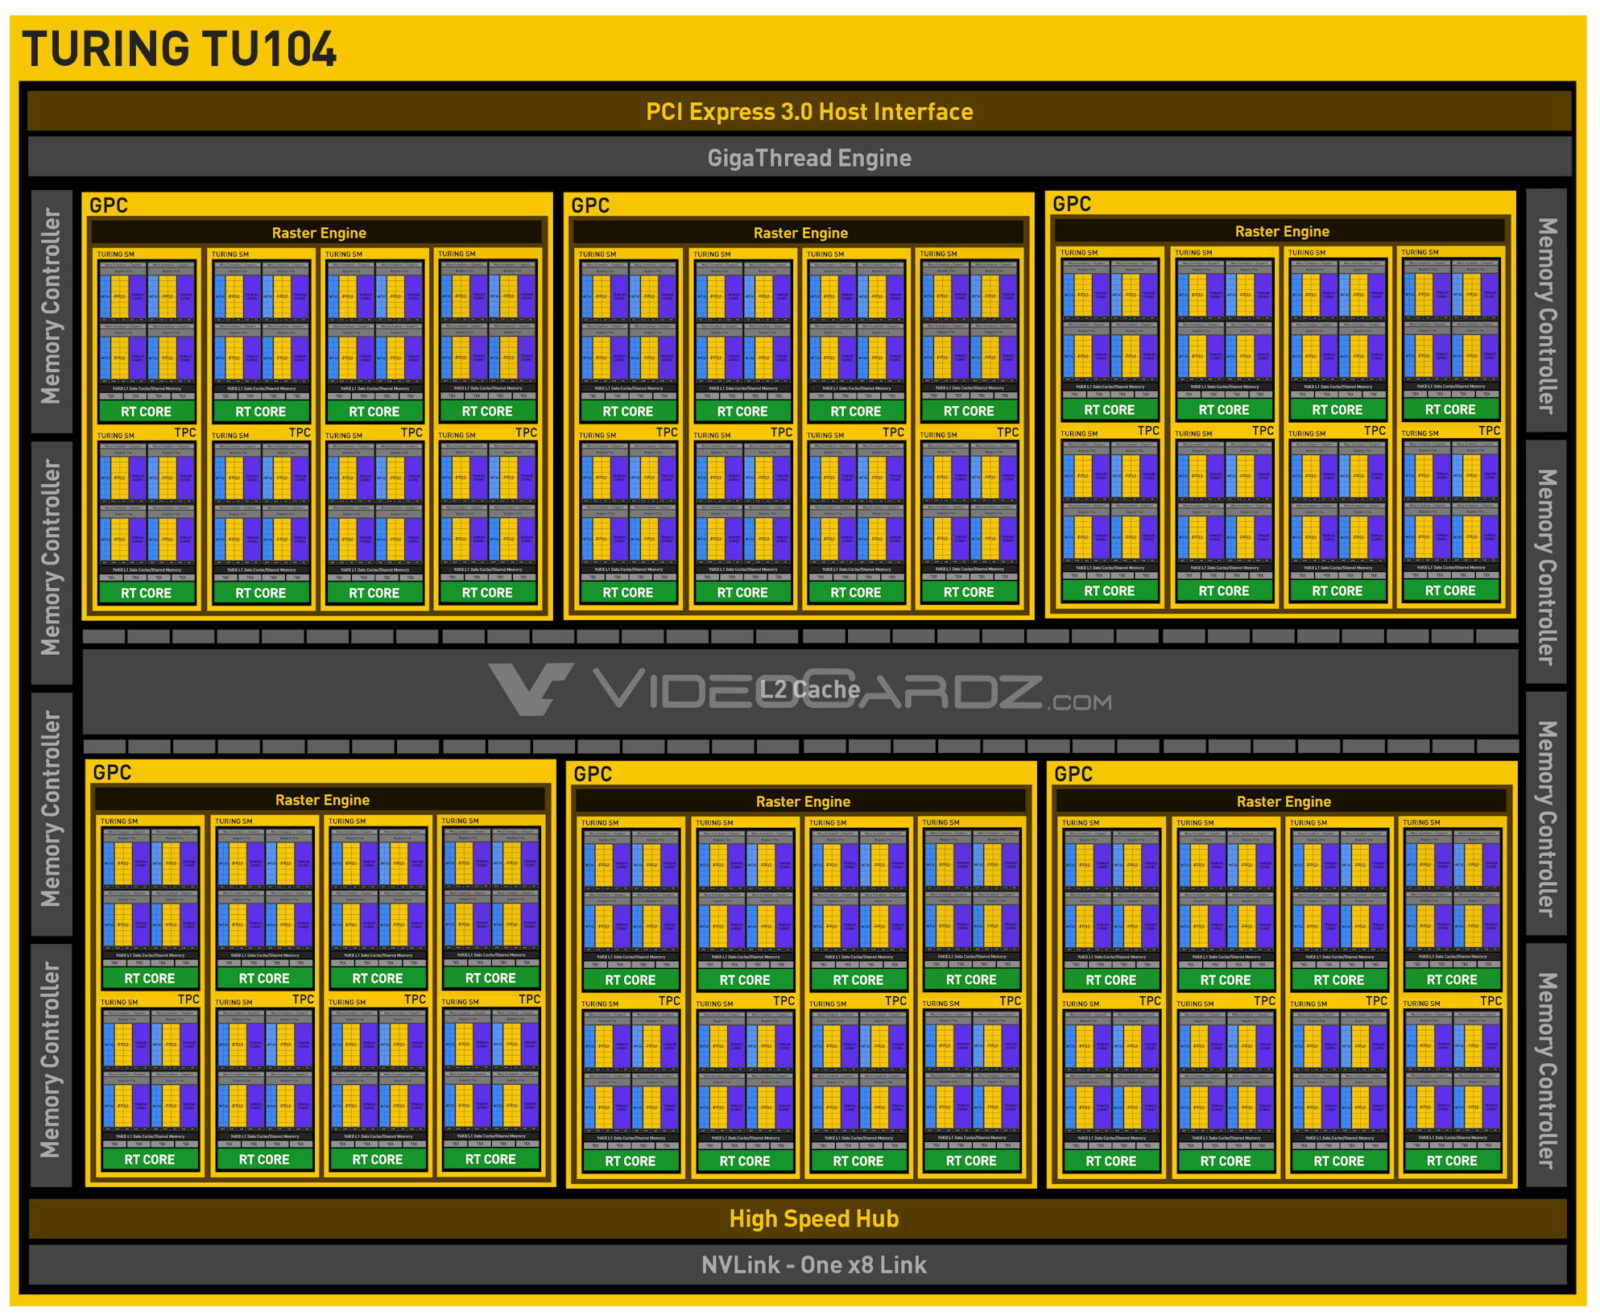
用于笔记本电脑的NVIDIA GeForce RTX 2080是2019年初用于笔记本电脑的最强移动图形卡。它基于台式机的RTX 2080,但核心频率降低(-7%Boost,-9%Base)。内存的频率和大小似乎相似。因此,RTX2080提供了2944个着色器和8 GB GDDR6内存,这些内存通过256带宽(14 GHz,448 GB / s)连接。
还计划推出更省电的“Max-Q”版本,并进一步降低频率。
特征
TU104芯片以12 nm FinFET工艺制造,并包括深度学习超级采样(DLSS)和实时光线追踪(RTRT)等功能,与基于Pascal架构的旧GPU相比,它们应结合起来可创造出更逼真的照光照效果(如果游戏支持)。 RTX 2080还支持DisplayPort 1.4,同时还支持HDMI 2.0b,HDR,同时多投影(SMP)和H.265视频编码/解码(PlayReady 3.0)。
性能
移动RTX 2080的性能应比台式机RTX 2080差一些,因此绝对要快于旧的GTX 1080。它应该能够以高特效在4k画质下运行所有硬件要求高的游戏。但是,光线追踪功能可能会大大降低帧率。
该卡的功耗从台式机RTX 2080的215瓦降低到150瓦。但是,它仍然仅适用于厚重的游戏笔记本电脑。对于更薄更轻的设计,RTX 2080的Max-Q版本更为适合,毕竟功率仅为80或90瓦(频率也更低)。
GeForce RTX 2000 Series
| ||||||||||||||||||||||||||||||||||||||||||||||||||||||||||
| Codename | N18E-G3 TU104 | |||||||||||||||||||||||||||||||||||||||||||||||||||||||||
| Architecture | Turing | |||||||||||||||||||||||||||||||||||||||||||||||||||||||||
| Pipelines | 2944 - unified | |||||||||||||||||||||||||||||||||||||||||||||||||||||||||
| Core Speed | 1380 - 1590 (Boost) MHz | |||||||||||||||||||||||||||||||||||||||||||||||||||||||||
| Memory Speed | 14000 MHz | |||||||||||||||||||||||||||||||||||||||||||||||||||||||||
| Memory Bus Width | 256 Bit | |||||||||||||||||||||||||||||||||||||||||||||||||||||||||
| Memory Type | GDDR6 | |||||||||||||||||||||||||||||||||||||||||||||||||||||||||
| Max. Amount of Memory | 8 GB | |||||||||||||||||||||||||||||||||||||||||||||||||||||||||
| Shared Memory | no | |||||||||||||||||||||||||||||||||||||||||||||||||||||||||
| API | DirectX 12_1, OpenGL 4.6 | |||||||||||||||||||||||||||||||||||||||||||||||||||||||||
| Power Consumption | 150 Watt | |||||||||||||||||||||||||||||||||||||||||||||||||||||||||
| Transistor Count | 13.6 Billion | |||||||||||||||||||||||||||||||||||||||||||||||||||||||||
| Man. Technology | 12 nm | |||||||||||||||||||||||||||||||||||||||||||||||||||||||||
| Features | NVLink, DLSS, Raytraycing, VR Ready, G-SYNC, Vulkan, Multi Monitor, 650 Watt system power recommended | |||||||||||||||||||||||||||||||||||||||||||||||||||||||||
| Notebook Size | large | |||||||||||||||||||||||||||||||||||||||||||||||||||||||||
| Date of Announcement | 06.01.2019 | |||||||||||||||||||||||||||||||||||||||||||||||||||||||||
The following benchmarks stem from our benchmarks of review laptops. The performance depends on the used graphics memory, clock rate, processor, system settings, drivers, and operating systems. So the results don't have to be representative for all laptops with this GPU. For detailed information on the benchmark results, click on the fps number.


| low | med. | high | ultra | QHD | 4K | |
|---|---|---|---|---|---|---|
| F1 2021 | 201 | 160 | 101 | 79 | 45 | |
| Days Gone | 148 | 131 | 100 | 75.2 | 44.3 | |
| Mass Effect Legendary Edition | 125 | 111 | 109 | 81.7 | ||
| Resident Evil Village | 163 | 159 | 145 | |||
| Outriders | 142 | 130 | 113 | 80.2 | 45.7 | |
| Hitman 3 | 183 | 165 | 153 | 103 | 58.8 | |
| Cyberpunk 2077 1.0 | 94.2 | 77.3 | 67.1 | 45.1 | 21.9 | |
| Immortals Fenyx Rising | 106 | 88 | 82 | 61 | 42 | |
| Yakuza Like a Dragon | 126 | 122 | 102 | 72 | 38.8 | |
| Call of Duty Black Ops Cold War | 125 | 106 | 94.4 | 69.2 | 38.3 | |
| Assassin´s Creed Valhalla | 87 | 74 | 66 | 52 | 34 | |
| Dirt 5 | 112 | 90.4 | 55.9 | 48.1 | 35.8 | |
| Watch Dogs Legion | 114 | 101 | 70.7 | 53 | 30.8 | |
| FIFA 21 | 284 | 279 | 274 | 271 | 264 | 224 |
| Star Wars Squadrons | 395 | 288 | 249 | 232 | 164 | 101 |
| Mafia Definitive Edition | 156 | 122 | 110 | 79.1 | 42.4 | |
| Serious Sam 4 | 145 | 107 | 105 | 89.4 | 78.6 | |
| Crysis Remastered | 160 | 89.3 | 61.1 | 42.7 | 26.9 | |
| Flight Simulator 2020 | 92.3 | 79 | 62.6 | 46.3 | 36.4 | 22.6 |
| Horizon Zero Dawn | 162 | 121 | 103 | 84 | 65 | 38 |
| Death Stranding | 181 | 155 | 141 | 138 | 103 | 56.4 |
| F1 2020 | 288 | 205 | 174 | 139 | 117 | 67 |
| Valorant | 282 | 276 | 266 | 260 | 240 | |
| Gears Tactics | 316 | 240 | 156 | 119 | 76.7 | 42.9 |
| Doom Eternal | 328 | 237 | 209 | 205 | 142 | 75.2 |
| Hunt Showdown | 264 | 155 | 135 | 85.7 | 41.5 | |
| Escape from Tarkov | 121 | 121 | 121 | 121 | 88.6 | 49.3 |
| Red Dead Redemption 2 | 140 | 119 | 86 | 56 | 44.3 | 29.7 |
| Star Wars Jedi Fallen Order | 122 | 114 | 112 | 97.9 | 52 | |
| Need for Speed Heat | 125 | 118 | 104 | 95 | 78.9 | 47.9 |
| Call of Duty Modern Warfare 2019 | 248 | 171 | 164 | 139 | 102 | 58.8 |
| GRID 2019 | 241 | 184 | 136 | 100 | 82.5 | 54.8 |
| Ghost Recon Breakpoint | 161 | 118 | 110 | 82 | 61 | 36 |
| FIFA 20 | 323 | 302 | 256 | 253 | 281 | 234 |
| Borderlands 3 | 139 | 125 | 98 | 84 | 60 | 33 |
| Control | 239 | 123 | 93 | 62.8 | 31.6 | |
| F1 2019 | 256 | 241 | 141 | 131 | 112 | 76 |
| Rage 2 | 144 | 119 | 117 | 78.1 | 39.1 | |
| Anno 1800 | 115 | 79 | 46 | 47.8 | 34.9 | |
| The Division 2 | 169 | 128 | 100 | 72 | 40 | |
| Dirt Rally 2.0 | 216 | 186 | 163 | 102 | 79.2 | |
| Anthem | 130 | 107 | 101 | 83.7 | 48.6 | |
| Far Cry New Dawn | 113 | 108 | 104 | 93 | 89 | 56 |
| Metro Exodus | 157 | 114 | 87 | 72 | 55 | 35 |
| Apex Legends | 144 | 144 | 144 | 127 | 75 | |
| Just Cause 4 | 181 | 159 | 118 | 110 | 80.8 | 47.6 |
| Darksiders III | 183 | 132 | 124 | 119 | 99.7 | 51.2 |
| Battlefield V | 151 | 142 | 132 | 125 | 115 | 68.1 |
| Farming Simulator 19 | 194 | 156 | 142 | 131 | ||
| Hitman 2 | 95 | 82 | 79 | 83 | 52.2 | |
| Call of Duty Black Ops 4 | 143.8 | 155 | 149 | 143 | 108 | 54.8 |
| Assassin´s Creed Odyssey | 86 | 90 | 83 | 67 | 55 | 38 |
| Forza Horizon 4 | 169 | 147 | 145 | 139 | 122 | 82 |
| FIFA 19 | 386 | 298 | 274 | 280 | 229 | |
| Shadow of the Tomb Raider | 138 | 114 | 110 | 103 | 71 | 42 |
| F1 2018 | 210 | 166 | 121 | 105 | 66 | |
| Monster Hunter World | 151 | 136 | 109 | 69.5 | 34.1 | |
| The Crew 2 | 60 | 60 | 60 | 60 | 48.2 | |
| Far Cry 5 | 123 | 102 | 101 | 95 | 82 | 52 |
| X-Plane 11.11 | 105 | 92 | 78 | 73 | ||
| Kingdom Come: Deliverance | 144 | 116 | 84 | 67.4 | 35.1 | |
| Final Fantasy XV Benchmark | 150 | 123 | 99 | 67.7 | 41 | |
| Fortnite | 206 | 169 | 155 | 124 | 61.4 | |
| Star Wars Battlefront 2 | 193 | 169 | 134 | 96.5 | 51.3 | |
| Need for Speed Payback | 173 | 165 | 161 | 113 | 63.4 | |
| ELEX | 120 | 119 | 118 | 79.5 | 41.6 | |
| Middle-earth: Shadow of War | 183 | 146 | 118 | 51 | ||
| Playerunknown's Battlegrounds (PUBG) | 243 | 214 | 174 | 61.3 | ||
| Dirt 4 | 246 | 202 | 135 | |||
| Rocket League | 249 | 248 | 144 | |||
| Prey | 142 | 140 | 139 | 83.2 | ||
| Ghost Recon Wildlands | 124 | 116 | 67.9 | 49.3 | ||
| For Honor | 203 | 195 | 153 | 66.9 | ||
| Resident Evil 7 | 428 | 252 | 207 | 75 | ||
| Dishonored 2 | 119 | 116 | 73 | |||
| Deus Ex Mankind Divided | 128 | 74.7 | 48.2 | |||
| Mirror's Edge Catalyst | 159 | 146 | 59.4 | |||
| Overwatch | 299 | 238 | 130 | |||
| Doom | 176.8 | 171.2 | 169 | 166 | 93 | |
| The Division | 148 | 117 | 61 | |||
| Rise of the Tomb Raider | 280 | 204 | 170 | 147 | 64.4 | |
| Rainbow Six Siege | 275 | 259 | 122 | |||
| Dota 2 Reborn | 144 | 135 | 127 | 121 | 119 | |
| The Witcher 3 | 322 | 247 | 171 | 96 | 63 | |
| GTA V | 164 | 159.6 | 126.4 | 75 | ||
| BioShock Infinite | 385 | 328 | 305 | 192 | ||
| low | med. | high | ultra | QHD | 4K | < 30 fps < 60 fps < 120 fps ≥ 120 fps | 4 38 | 19 60 | 34 51 | 4 42 33 | 10 44 10 | 4 46 22 7 |
For more games that might be playable and a list of all games and graphics cards visit our Gaming List


Gigabyte Aero 17 HDR: Intel Core i9-9980HK, 17.30", 2.5 kg
External Review » Gigabyte Aero 17 HDR
HP Omen 15-dh0008ns: Intel Core i9-9880H, 15.60", 2.6 kg
External Review » HP Omen 15-dh0008ns
HP Omen X 15-dg0370ng: Intel Core i9-9980HK, 15.60", 2.5 kg
External Review » HP Omen X 15-dg0370ng
HP Omen X 2S 15-dg0830no: Intel Core i7-9750H, 15.60", 2.5 kg
External Review » HP Omen X 2S 15-dg0830no
Acer Predator Helios 700 PH717-71-785M: Intel Core i7-9750H, 17.30", 4.8 kg
External Review » Acer Predator Helios 700 PH717-71-785M
Asus ROG Mothership GZ700GX: Intel Core i9-9980HK, 17.30", 4.8 kg
External Review » Asus ROG Mothership GZ700GX
Alienware m17 R2-WNm17R240s: Intel Core i7-9750H, 15.60", 2.6 kg
External Review » Alienware m17 R2-WNm17R240s
Alienware m15 R2, i9-9980HK, RTX 2080: Intel Core i9-9980HK, 15.60", 2.2 kg
External Review » Alienware m15 R2, i9-9980HK, RTX 2080
MSI GS75 Stealth-479: Intel Core i9-9880H, 17.30", 2.3 kg
External Review » MSI GS75 Stealth-479
HP Omen 17-CB0006UR: Intel Core i7-9750H, 17.30", 3.3 kg
External Review » HP Omen 17-CB0006UR
Acer ConceptD 7 CN715-71-73A9: Intel Core i7-9750H, 15.60", 2.1 kg
External Review » Acer ConceptD 7 CN715-71-73A9
Aorus 17-YA-9DE2452SH: Intel Core i9-9980HK, 17.30", 3.8 kg
External Review » Aorus 17-YA-9DE2452SH
Acer Predator Helios 700 PH717-71-92A7: Intel Core i9-9980HK, 17.30", 4.5 kg
External Review » Acer Predator Helios 700 PH717-71-92A7
MSI GT75 Titan 8SG-051: Intel Core i9-8950HK, 17.30", 4.6 kg
External Review » MSI GT75 Titan 8SG-051
Asus ROG Mothership GZ700GX-AD032R: Intel Core i9-9980HK, 17.30", 4.7 kg
External Review » Asus ROG Mothership GZ700GX-AD032R
Acer Predator Triton 900 PT917-71-969C: Intel Core i9-9980HK, 17.30", 4.4 kg
External Review » Acer Predator Triton 900 PT917-71-969C
Asus ROG Chimera G703GXR-EV003T: Intel Core i7-9750H, 17.30", 4.7 kg
External Review » Asus ROG Chimera G703GXR-EV003T
Acer Predator Triton 900 PT917-71-93MW: Intel Core i7-9750H, 17.30", 4.5 kg
External Review » Acer Predator Triton 900 PT917-71-93MW
MSI GE75 9SG: Intel Core i9-9880H, 17.30", 2.7 kg
External Review » MSI GE75 9SG
HP Omen X 2S 15: Intel Core i7-9750H, 15.60", 2.4 kg
External Review » HP Omen X 2S 15
Origin PC Eon17-X 2019: Intel Core i9-9900K, 17.30", 3.9 kg
External Review » Origin PC Eon17-X 2019
Acer Predator Triton 900 PT917-71-71C: Intel Core i7-9750H, 17.30", 4.4 kg
External Review » Acer Predator Triton 900 PT917-71-71C
Acer Predator Triton 900 PT917-71-79PF: Intel Core i7-9750H, 17.30", 4.1 kg
External Review » Acer Predator Triton 900 PT917-71-79PF
Acer Predator Helios 700 PH717-71-95Q9: Intel Core i9-9980HK, 17.30", 4.5 kg
External Review » Acer Predator Helios 700 PH717-71-95Q9
MSI GE75 Raider 9SG-417: Intel Core i7-9750H, 17.30", 2.6 kg
External Review » MSI GE75 Raider 9SG-417
Asus ROG GRIFFIN GZ755GX-E5028T: Intel Core i9-8950HK, 17.30", 4.7 kg
External Review » Asus ROG GRIFFIN GZ755GX-E5028T
Asus G703GX-XB96K: Intel Core i9-9980HK, 17.30", 4.7 kg
External Review » Asus G703GX-XB96K
MSI GT76 Titan DT 9SG: Intel Core i9-9900K, 17.30", 4.2 kg
External Review » MSI GT76 Titan DT 9SG
Schenker XMG Ultra 17 Turing: Intel Core i9-9900K, 17.30", 4.3 kg
External Review » Schenker XMG Ultra 17 Turing
Acer Predator Triton 900 PT917-71-76VT: Intel Core i7-9750H, 17.30", 4.4 kg
External Review » Acer Predator Triton 900 PT917-71-76VT
Acer ConceptD 9: Intel Core i9-9980HK, 17.30", 4.1 kg
External Review » Acer ConceptD 9
Acer Predator Helios 700 (i9-9980HK, RTX 2080): Intel Core i9-9980HK, 17.30", 4.5 kg
External Review » Acer Predator Helios 700 (i9-9980HK, RTX 2080)
Asus ROG Chimera G703GX-E5006T: Intel Core i9-8950HK, 17.30", 4.7 kg
External Review » Asus ROG Chimera G703GX-E5006T
MSI GS75 Stealth 8SG-054NE: Intel Core i7-8750H, 17.30", 2.3 kg
External Review » MSI GS75 Stealth 8SG-054NE
Acer Predator Triton 500 PT515-51-73UX: Intel Core i7-8750H, 15.60", 2 kg
External Review » Acer Predator Triton 500 PT515-51-73UX
MSI GE75 8SG-042 Raider: Intel Core i7-8750H, 17.30", 2.7 kg
External Review » MSI GE75 8SG-042 Raider
MSI GS75 8SG-064ES: Intel Core i7-8750H, 17.30", 2.3 kg
External Review » MSI GS75 8SG-064ES
MSI GT75 8SG-035: Intel Core i9-8950HK, 17.30", 4.6 kg
External Review » MSI GT75 8SG-035
Asus ROG G703GX: Intel Core i7-8750H, 17.30", 4.7 kg
External Review » Asus ROG G703GX
Alienware Area-51m i9-9900K RTX 2080: Intel Core i9-9900K, 17.30", 3.9 kg
External Review » Alienware Area-51m, i9-9900K, RTX 2080
» Comparison of GPUs
Detailed list of all laptop GPUs sorted by class and performance.
» Benchmark List
Sort and restrict laptop GPUs based on performance in synthetic benchmarks.
» Notebook Gaming List
Playable games for each graphics card and their average FPS results.
* Approximate position of the graphics adapter
» Notebookcheck多媒体笔记本电脑Top 10排名
» Notebookcheck游戏笔记本电脑Top 10排名
» Notebookcheck低价办公/商务笔记本电脑Top 10排名
» Notebookcheck高端办公/商务笔记本电脑Top 10排名
» Notebookcheck工作站笔记本电脑Top 10排名
» Notebookcheck亚笔记本电脑Top 10排名
» Notebookcheck超级本产品Top 10排名
» Notebookcheck变形本产品Top 10排名
» Notebookcheck平板电脑Top 10排名
» Notebookcheck智能手机Top 10排名
» Notebookcheck评测过最出色的笔记本电脑屏幕
» Notebookcheck售价500欧元以下笔记本电脑Top 10排名
» Notebookcheck售价300欧元以下笔记本电脑Top 10排名