Notebookcheck Logo

AMD Radeon 890M

AMD Radeon 890M

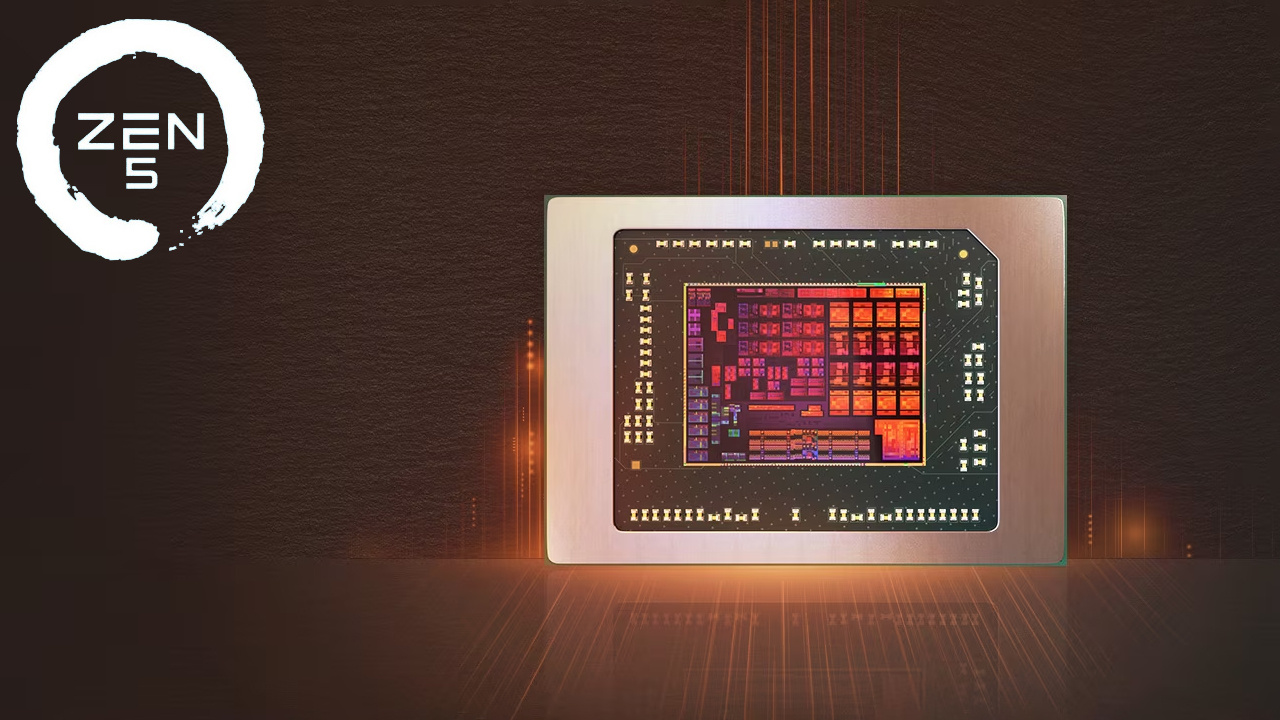
AMD Radeon 890M是一款功能强大的 RDNA 3+ 架构 iGPU,于 2024 年 6 月首次亮相。它配备 16 个计算单元(1024 个统一着色器),运行频率高达 2,900 MHz;与 700 系列 Radeon iGPU 一样,它支持多达 4 台显示器,分辨率高达 SUHD 4320p60。它的游戏性能足以应付任何 2023 或 2024 年的游戏,只要 1080p 分辨率和低细节即可。

AMD Radeon 800M Series

Radeon 890M 1024 @ 2.9 GHz? Bit @ 7500 MHz
Radeon 880M 768 @ 2.9 GHz? Bit @ 7500 MHz
Radeon 860M 512 @ 2.9 GHz? Bit @ 7500 MHz
Radeon 840M 256 @ 2.9 GHz? Bit @ 7500 MHz
Radeon 820M 128 @ 2.9 GHz? Bit @ 7500 MHz
CodenameStrix Point
ArchitectureRDNA 3+
iGPUIntegrated Graphics
Pipelines1024 - unified
Core Speed2900 (Boost) MHz
Memory Speed7500 MHz
Shared Memoryyes
APIDirectX 12_2
Man. Technology4 nm
PCIe4
Displays4 Displays (max.), HDMI 2.1, DisplayPort 2.1
FeaturesFreeSync, Miracast, SUHD 4320p60 resolution support, AVC/HEVC/VP9/AV1 encoding and decoding
Notebook Sizemedium sized
Date of Announcement02.06.2024
CPU in Radeon 890MGPU Base SpeedGPU Boost / Turbo
AMD Ryzen AI 9 HX 47512 x 2000 MHz, 54 W? MHz3100 MHz
AMD Ryzen AI 9 HX PRO 47512 x 2000 MHz, 54 W? MHz3100 MHz
AMD Ryzen AI 9 HX 47012 x 2000 MHz, 54 W? MHz3100 MHz
min. - max.? MHz? - 3100 MHz

Benchmarks

Performance Rating - 3DMark 11 + Fire Strike + Time Spy
3.4 pt (10%)
AMD Radeon HD 8180
0.05426 -98%
...
2.97 -12%
2.99 -12%
3.16 -7%
3.17 -6%
3.17 -6%
3.19 -6%
Intel Arc Graphics 140T
3.24 -4%
3.27 -3%
3.35 -1%
AMD Radeon 890M
3.38
NVIDIA Quadro M5000M
3.45 2%
3.46 2%
3.49 3%
3.51 4%
3.62 7%
3.67 9%
3.72 10%
NVIDIA GeForce GTX 780M SLI
3.78 12%
3.82 13%
...
19 462%
max:
NVIDIA GeForce RTX 5090
33.3 885%
0%
100%
Restrict / Search: Model: Max. age: years
3DMark - 3DMark Speed Way Score
min: 182     avg: 429.2     median: 482 (3%)     max: 575 Points
3DMark - 3DMark Steel Nomad
min: 298     avg: 543     median: 571 (4%)     max: 710 Points
3DMark - 3DMark Steel Nomad Light
min: 3198     avg: 3319     median: 3294 (8%)     max: 3511 Points
3DMark - 3DMark Wild Life Unlimited
min: 12236     avg: 19143     median: 21033 (11%)     max: 22270 Points
3DMark - 3DMark Wild Life Extreme Unlimited
min: 6855     avg: 7239     median: 7239 (8%)     max: 7623 Points
3DMark - 3DMark Solar Bay
min: 8842     avg: 14320     median: 14813 (7%)     max: 16167 Points
3DMark - 3DMark Fire Strike Standard Score
min: 4800     avg: 8268     median: 8431.5 (13%)     max: 9188 Points
3DMark - 3DMark Fire Strike Standard Graphics
min: 5173     avg: 8932     median: 9040.5 (8%)     max: 10037 Points
3DMark - 3DMark Ice Storm Graphics
min: 188288     avg: 289885     median: 301713 (33%)     max: 408901 Points
3DMark - 3DMark Time Spy Score
min: 2203     avg: 3660     median: 3683.5 (10%)     max: 4073 Points
3DMark - 3DMark Time Spy Graphics
min: 1950     avg: 3308     median: 3331 (7%)     max: 3676 Points
Intel UHD Graphics 600
107.5 -97%
...
2998 -9%
NVIDIA Quadro T2000 Max-Q
3094 -6%
3123 -6%
3139 -5%
3155 -5%
3193 -3%
3223 -3%
3269 -1%
3306 0%
AMD Radeon 890M
3308
3324 0%
3364 2%
3399 3%
3430 4%
3492 6%
AMD Radeon RX 580 (Laptop)
3505 6%
AMD Radeon RX 5300M
3567 8%
3601 9%
3650 10%
...
NVIDIA RTX PRO 5000 Blackwell Generation Laptop
23277 604%
max:
NVIDIA GeForce RTX 5090
44789 1254%
0%
100%
Restrict / Search: Model: Max. age: years
3DMark - 3DMark Ice Storm Unlimited Graphics
min: 290963     avg: 435187     median: 472994 (48%)     max: 513829 Points
3DMark - 3DMark Ice Storm Extreme Graphics
min: 132276     avg: 209627     median: 222120 (26%)     max: 258947 Points
3DMark - 3DMark Cloud Gate Score
min: 27248     avg: 37718     median: 38723 (37%)     max: 40511 Points
3DMark - 3DMark Cloud Gate Graphics
min: 29973     avg: 52132     median: 53495 (13%)     max: 58319 Points
3DMark - 3DMark Night Raid
min: 17828     avg: 29346     median: 30453 (29%)     max: 33268 Points
3DMark - 3DMark Night Raid Graphics Score
min: 18681     avg: 35392     median: 37159 (14%)     max: 40656 Points
3DMark 11 - 3DM11 Performance Score
min: 8720     avg: 14198     median: 14421.5 (17%)     max: 16633 Points
3DMark 11 - 3DM11 Performance GPU
min: 8947     avg: 14871     median: 15284.5 (12%)     max: 17483 Points
171.8 -99%
...
13714 -8%
NVIDIA GeForce GTX 780M SLI
14140 -5%
14147 -5%
AMD Radeon RX Vega M GH
14302 -4%
AMD Radeon RX 5300M
14412 -3%
14428 -3%
14453 -3%
14692 -1%
14725 -1%
AMD Radeon 890M
14871
15135 2%
AMD Radeon RX 580 (Laptop)
15223 2%
NVIDIA Quadro P4000
15433 4%
15592 5%
15823 6%
NVIDIA Quadro P4000 Max-Q
15837 6%
NVIDIA Quadro P3200
16233 9%
16289 10%
16564 11%
...
NVIDIA RTX PRO 5000 Blackwell Generation Laptop
68271 359%
max:
NVIDIA GeForce RTX 5090
129772 773%
0%
100%
Restrict / Search: Model: Max. age: years
3DMark Vantage
3DM Vant. Perf. total +
3DMark Vantage - 3DM Vant. Perf. total
min: 27238     avg: 42369     median: 44128.5 (13%)     max: 47376 Points
3DM Vant. Perf. GPU no PhysX +
3DMark Vantage - 3DM Vant. Perf. GPU no PhysX
min: 22391     avg: 37283     median: 38975.5 (21%)     max: 42086 Points
ATI Radeon HD 3200
62 -100%
...
34680 -7%
34951 -6%
35209 -6%
35807 -4%
36214 -3%
AMD Radeon RX 5300M
36391 -2%
36405 -2%
36527 -2%
NVIDIA Quadro T2000 Max-Q
36812 -1%
AMD Radeon 890M
37283
37644 1%
38502 3%
38910 4%
AMD Radeon HD 8970M Crossfire
39191 5%
39213 5%
39319 5%
40134 8%
40146 8%
40643 9%
...
132443 255%
max:
173912 366%
0%
100%
Restrict / Search: Model: Max. age: years
3DMark 05 - 3DMark 05 - Standard
min: 51961     avg: 61133     median: 60701 (66%)     max: 70657 Points
Restrict / Search: Model: Max. age: years
3DMark 06 3DMark 06 - Standard 1280x1024 +
3DMark 06
min: 31279     avg: 45631     median: 46785 (61%)     max: 50117 Points
Unigine Valley 1.0 - Unigine Valley 1.0 DX
min: 13.7     avg: 26.5     median: 28 (8%)     max: 31.6 fps
SPECviewperf 2020 specvp2020 solidworks-05 1080p +
SPECviewperf 2020 - specvp2020 solidworks-05 1080p
min: 59.49     avg: 60.1     median: 60.1 (11%)     max: 60.61 fps
specvp2020 snx-04 1080p +
SPECviewperf 2020 - specvp2020 snx-04 1080p
min: 85.7     avg: 134.8     median: 139 (15%)     max: 153 fps
specvp2020 medical-03 1080p +
SPECviewperf 2020 - specvp2020 medical-03 1080p
min: 46.32     avg: 60.8     median: 65.4 (18%)     max: 73.5 fps
specvp2020 maya-06 1080p +
SPECviewperf 2020 - specvp2020 maya-06 1080p
min: 77.9     avg: 135     median: 142 (15%)     max: 156 fps
specvp2020 energy-03 1080p +
SPECviewperf 2020 - specvp2020 energy-03 1080p
min: 19     avg: 25.9     median: 27.1 (4%)     max: 30.2 fps
specvp2020 creo-03 1080p +
SPECviewperf 2020 - specvp2020 creo-03 1080p
min: 42     avg: 58.9     median: 59.5 (20%)     max: 67.2 fps
specvp2020 catia-06 1080p +
SPECviewperf 2020 - specvp2020 catia-06 1080p
min: 24     avg: 37.6     median: 39 (19%)     max: 41.2 fps
specvp2020 3dsmax-07 1080p +
SPECviewperf 2020 - specvp2020 3dsmax-07 1080p
min: 23     avg: 38.4     median: 40.9 (11%)     max: 46.5 fps
specvp2020 snx-04 4k +
SPECviewperf 2020 - specvp2020 snx-04 4k
min: 39.2     avg: 65.2     median: 69.3 (7%)     max: 74.9 fps
specvp2020 medical-03 4k +
SPECviewperf 2020 - specvp2020 medical-03 4k
min: 15.2     avg: 21.9     median: 24.2 (15%)     max: 26.1 fps
specvp2020 maya-06 4k +
SPECviewperf 2020 - specvp2020 maya-06 4k
min: 31.3     avg: 53.6     median: 57.5 (8%)     max: 62.9 fps
specvp2020 energy-03 4k +
SPECviewperf 2020 - specvp2020 energy-03 4k
min: 14     avg: 19.5     median: 16.8 (4%)     max: 28.5 fps
specvp2020 creo-03 4k +
SPECviewperf 2020 - specvp2020 creo-03 4k
min: 21.4     avg: 33.2     median: 35.2 (16%)     max: 38.2 fps
specvp2020 catia-06 4k +
SPECviewperf 2020 - specvp2020 catia-06 4k
min: 16.2     avg: 23.9     median: 25.6 (17%)     max: 27.4 fps
specvp2020 3dsmax-07 4k +
SPECviewperf 2020 - specvp2020 3dsmax-07 4k
min: 13.4     avg: 22.9     median: 24.3 (8%)     max: 26.8 fps
Cinebench R10 Cinebench R10 Shading (32bit) +
Cinebench R10 - Cinebench R10 Shading (32bit)
min: 16665     avg: 21784     median: 23487 (17%)     max: 24937 points
Cinebench R15
Cinebench R15 OpenGL 64 Bit +
Cinebench R15 - Cinebench R15 OpenGL 64 Bit
min: 111.9     avg: 220.3     median: 242 (14%)     max: 304 fps
Cinebench R15 OpenGL Ref. Match 64 Bit +
Cinebench R15 - Cinebench R15 OpenGL Ref. Match 64 Bit
97.9 % (98%)
GFXBench - GFXBench 5.0 4K Aztec Ruins High Tier Offscreen
min: 35.7     avg: 37.7     median: 37.7 (14%)     max: 39.7 fps
GFXBench - GFXBench 5.0 Aztec Ruins High Tier Offscreen
min: 75.6     avg: 80.1     median: 80.1 (14%)     max: 84.6 fps
3.3 -96%
...
63.8 -20%
64.7 -19%
NVIDIA Quadro T2000 Max-Q
64.8 -19%
65.5 -18%
Apple M3 9-Core GPU
67.6 -16%
Apple M1 7-Core GPU
72.4 -10%
Apple M1 8-Core GPU
74.3 -7%
74.6 -7%
78.8 -2%
AMD Radeon 890M
80.1
80.5 0%
83 4%
87.1 9%
Intel Arc Graphics 140T
88 10%
89.3 11%
Apple M2 8-Core GPU
91 14%
93.2 16%
94.7 18%
95 19%
...
530 562%
0%
100%
Restrict / Search: Model: Max. age: years
GFXBench - GFXBench 5.0 Aztec Ruins Normal Tier Offscreen
min: 173.2     avg: 183.6     median: 183.6 (14%)     max: 194 fps
GFXBench - GFXBench Car Chase Offscreen
211.6 fps (20%)
GFXBench 3.1 - GFXBench Manhattan ES 3.1 Offscreen
277.2 fps (6%)
GFXBench 3.0 - GFXBench 3.0 Manhattan Offscreen
350 fps (15%)
GFXBench (DX / GLBenchmark) 2.7
GFXBench T-Rex HD Offscreen C24Z16 +
GFXBench (DX / GLBenchmark) 2.7 - GFXBench T-Rex HD Offscreen C24Z16
496.9 fps (4%)
Basemark GPU 1.2 - Basemark GPU 1.2 Vulkan Official Medium Offscreen 1080
min: 104.6     avg: 470.5     median: 104.6 (3%)     max: 3908 fps
Basemark GPU 1.2 - Basemark GPU 1.2 Vulkan Official High Offscreen 2160
min: 3.64     avg: 78     median: 3.6 (1%)     max: 546 fps
Geekbench 6.5 - Geekbench 6.5 GPU OpenCL
min: 26531     avg: 38069     median: 38547 (10%)     max: 43082 points
Geekbench 6.5 - Geekbench 6.5 GPU Vulkan
min: 30243     avg: 43998     median: 45676.5 (11%)     max: 50886 points
LuxMark v2.0 64Bit - LuxMark v2.0 Room GPU
min: 583     avg: 957     median: 998 (4%)     max: 1075 Samples/s
LuxMark v2.0 64Bit - LuxMark v2.0 Sala GPU
min: 1166     avg: 1587     median: 1621 (3%)     max: 1743 Samples/s
ComputeMark v2.1 - ComputeMark v2.1 Result
min: 9395     avg: 10599     median: 10562 (9%)     max: 12026 points
Power Consumption - Furmark Stress Test Power Consumption - external Monitor *
min: 40.1     avg: 61.1     median: 59.1 (8%)     max: 74.8 Watt
05101520253035404550556065707580Tooltip
Power Consumption - The Witcher 3 Power Consumption - external Monitor *
min: 45.8     avg: 59.8     median: 59.8 (8%)     max: 73.7 Watt
051015202530354045505560657075Tooltip
Power Consumption - Power Efficiency - Witcher 3 ultra external Monitor
min: 0.4613     avg: 0.6     median: 0.6 (47%)     max: 0.677 fps per Watt
Power Consumption - Cyberpunk 2077 Power Consumption 150cd *
min: 35.5     avg: 58.5     median: 54.7 (15%)     max: 93.6 Watt
051015202530354045505560657075808590Tooltip
Power Consumption - Cyberpunk 2077 Power Consumption - external Monitor *
min: 37.6     avg: 62.9     median: 60.7 (8%)     max: 91.8 Watt
051015202530354045505560657075808590Tooltip
Power Consumption - Power Efficiency - Cyberpunk 2077 ultra
min: 0.2178     avg: 0.4     median: 0.4 (1%)     max: 0.62 fps per Watt
Emissions Witcher 3 Fan Noise +
Emissions - Witcher 3 Fan Noise
min: 32.3     avg: 39.8     median: 40.6 (58%)     max: 49.7 dB(A)
- Range of benchmark values
red legend - Average benchmark values
* Smaller numbers mean a higher performance

Game Benchmarks

The following benchmarks stem from our benchmarks of review laptops. The performance depends on the used graphics memory, clock rate, processor, system settings, drivers, and operating systems. So the results don't have to be representative for all laptops with this GPU. For detailed information on the benchmark results, click on the fps number.

Call of Duty Black Ops 7

Call of Duty Black Ops 7

2025
low 1920x1080
76  fps    + Compare
med. 1920x1080
67  fps    + Compare
high 1920x1080
49  fps    + Compare
ultra 1920x1080
14  fps    + Compare
» With all tested laptops playable in detail settings high.
Anno 117: Pax Romana

Anno 117: Pax Romana

2025
low 1920x1080
33.6  fps    + Compare
med. 1920x1080
19.3  fps    + Compare
high 1920x1080
13.2  fps    + Compare
ultra 1920x1080
8.3  fps    + Compare
» The benchmarks indicate that the game is not playable in the tested settings.
F1 25

F1 25

2025
low 1920x1080
78.4 88.7 91.1 ~ 86 fps    + Compare
med. 1920x1080
63.8 69.7 70 ~ 68 fps    + Compare
high 1920x1080
19.3 48.4 52.9 ~ 40 fps    + Compare
» With most tested laptops playable in detail settings high.
Additional Benchmarks
Ultra High Preset 16xAF TAA 1920x1080
11.5
9.8
low 1920x1080
20.3  fps    + Compare + 📈 Graph
med. 1920x1080
17.3  fps    + Compare + 📈 Graph
high 1920x1080
15.8  fps    + Compare + 📈 Graph
» The benchmarks indicate that the game is not playable in the tested settings.
low 1920x1080
49.3  fps    + Compare + 📈 Graph
med. 1920x1080
29.2  fps    + Compare + 📈 Graph
high 1920x1080
19.7  fps    + Compare + 📈 Graph
ultra 1920x1080
8.5  fps    + Compare + 📈 Graph
» With all tested laptops playable in detail settings low.
low 1920x1080
27 29 ~ 28 fps    + Compare
med. 1920x1080
25 27 ~ 26 fps    + Compare
high 1920x1080
21 23 ~ 22 fps    + Compare
ultra 1920x1080
13 15 ~ 14 fps    + Compare
» The benchmarks indicate that the game is not playable in the tested settings.
low 1920x1080
116 126.8 ~ 121 fps    + Compare + 📈 Graph
med. 1920x1080
59.5 66.3 ~ 63 fps    + Compare + 📈 Graph
high 1920x1080
32.3 35.9 ~ 34 fps    + Compare + 📈 Graph
» With all tested laptops playable in detail settings med..
low 1920x1080
25 29.2 ~ 27 fps    + Compare
med. 1920x1080
19.5 22.8 ~ 21 fps    + Compare
ultra 1920x1080
14  fps    + Compare
» The benchmarks indicate that the game is not playable in the tested settings.
Additional Benchmarks
lowest, FSR Quality, Frame Generation 1920x1080
58.9
44.3
lowest, XeSS Quality 1920x1080
31.1
low 1920x1080
19.9  fps    + Compare + 📈 Graph
med. 1920x1080
16.3  fps    + Compare + 📈 Graph
ultra 1920x1080
10.8 14.2 ~ 13 fps    + Compare + 📈 Graph
» The benchmarks indicate that the game is not playable in the tested settings.
Additional Benchmarks
Low Preset + Quality FSR 1920x1080
27.9
low 1920x1080
29.1  fps    + Compare
high 1920x1080
18.8  fps    + Compare
» The benchmarks indicate that the game is not playable in the tested settings.
Stalker 2

Stalker 2

2024
low 1920x1080
25.4  fps    + Compare + 📈 Graph
med. 1920x1080
21.8  fps    + Compare + 📈 Graph
high 1920x1080
18.6  fps    + Compare + 📈 Graph
» The benchmarks indicate that the game is not playable in the tested settings.
Additional Benchmarks
Low Preset 1280x720
38.5
low 1920x1080
69  fps    + Compare
med. 1920x1080
62  fps    + Compare
high 1920x1080
43  fps    + Compare
ultra 1920x1080
37  fps    + Compare
» With all tested laptops playable in detail settings ultra.
Additional Benchmarks
Minimum Preset 1280x720
112
low 1920x1080
50.3  fps    + Compare + 📈 Graph
med. 1920x1080
32.5  fps    + Compare + 📈 Graph
high 1920x1080
22.1  fps    + Compare + 📈 Graph
ultra 1920x1080
16.4  fps    + Compare + 📈 Graph
» With all tested laptops playable in detail settings low.
Additional Benchmarks
Low Preset 1280x720
71.2
low 1920x1080
41.1  fps    + Compare + 📈 Graph
med. 1920x1080
34.3  fps    + Compare + 📈 Graph
high 1920x1080
30.6  fps    + Compare + 📈 Graph
ultra 1920x1080
24.9  fps    + Compare + 📈 Graph
» With all tested laptops playable in detail settings low.
Additional Benchmarks
Low Preset TAA 1280x720
56.7
low 1920x1080
22.7  fps    + Compare + 📈 Graph
med. 1920x1080
22.7  fps    + Compare + 📈 Graph
high 1920x1080
18.8  fps    + Compare + 📈 Graph
» The benchmarks indicate that the game is not playable in the tested settings.
Additional Benchmarks
Low Preset (Super Resolution off) 1280x720
35.9
low 1920x1080
34  fps    + Compare + 📈 Graph
med. 1920x1080
28.7  fps    + Compare + 📈 Graph
high 1920x1080
26.9  fps    + Compare + 📈 Graph
ultra 1920x1080
22.6  fps    + Compare + 📈 Graph
» The benchmarks indicate that the game is not playable in the tested settings.
Additional Benchmarks
Low Preset TAA 1280x720
44.7
low 1920x1080 cinem.
16  fps    + Compare + 📈 Graph
med. 1920x1080 cinem.
14.7  fps    + Compare + 📈 Graph
high 1920x1080 cinem.
12.5  fps    + Compare + 📈 Graph
» The benchmarks indicate that the game is not playable in the tested settings.
Additional Benchmarks
low 1280x720 cinem.
23.7
low 1920x1080
31 51 ~ 41 fps    + Compare
med. 1920x1080
24 40 ~ 32 fps    + Compare
high 1920x1080
18 31 ~ 25 fps    + Compare
ultra 1920x1080
18 18 ~ 18 fps    + Compare
QHD FSR 2560x1440
18  fps    + Compare
» With most tested laptops playable in detail settings low.
Additional Benchmarks
low TSR 100 1280x720
52
low FSR 68 1280x720
66
low 1920x1080
51.6 64.2 ~ 58 fps    + Compare + 📈 Graph
med. 1920x1080
38.3 40.6 ~ 39 fps    + Compare + 📈 Graph
high 1920x1080
30.2 34.1 ~ 32 fps    + Compare + 📈 Graph
ultra 1920x1080
25 30.6 ~ 28 fps    + Compare + 📈 Graph
» With all tested laptops playable in detail settings med..
Additional Benchmarks
Very Low Preset 1280x720
110.7
low 1920x1080
59.1 67.5 ~ 63 fps    + Compare + 📈 Graph
med. 1920x1080
35 42.7 ~ 39 fps    + Compare + 📈 Graph
high 1920x1080
27.8 33.7 ~ 31 fps    + Compare + 📈 Graph
ultra 1920x1080
23.6 28.8 ~ 26 fps    + Compare + 📈 Graph
» With most tested laptops playable in detail settings med..
Additional Benchmarks
Low Preset 1280x720
103.3
F1 24

F1 24

2024
low 1920x1080
0 (!) 48.4 49.8 68.4 73.5 82.4 83.6 85.1 85.3 86.6 87.2 87.3 87.5 87.8 89.4 92 94 100 104.6 ~ 79 fps    + Compare
med. 1920x1080
0 (!) 43.9 46 67.3 72.8 74.8 75.4 76 76 76.4 76.8 77.3 77.6 78.9 80.9 84.7 88 91.9 94 ~ 72 fps    + Compare
high 1920x1080
0 (!) 31.6 34.4 50.9 51 53.4 53.4 54.2 55.8 56.6 56.9 57.1 58.5 58.6 59.3 60.1 61.2 66 67 ~ 52 fps    + Compare
ultra 1920x1080
0 (!) 8.4 9.5 12.5 13.6 13.8 13.9 14.1 14.3 14.3 14.9 15.2 15.7 15.8 17.7 ~ 13 fps    + Compare
QHD 2560x1440
6.5  fps    + Compare
QHD FSR 2560x1440
11.2  fps    + Compare
» With most tested laptops playable in detail settings high.
low 1920x1080
20.8  fps    + Compare + 📈 Graph
med. 1920x1080
16.6  fps    + Compare + 📈 Graph
high 1920x1080
12.6  fps    + Compare + 📈 Graph
» The benchmarks indicate that the game is not playable in the tested settings.
low 1920x1080
34.6  fps    + Compare
med. 1920x1080
28 30.3 ~ 29 fps    + Compare
high 1920x1080
19.4 27.4 ~ 23 fps    + Compare
ultra 1920x1080
18.7 20.7 ~ 20 fps    + Compare
» The benchmarks indicate that the game is not playable in the tested settings.
Additional Benchmarks
Very High Preset + Quality FSR 2560x1440
26.4
low 1920x1080
26 30.6 ~ 28 fps    + Compare + 📈 Graph
med. 1920x1080
24.7 27.3 ~ 26 fps    + Compare + 📈 Graph
high 1920x1080
16.8 21.1 ~ 19 fps    + Compare + 📈 Graph
ultra 1920x1080
14.7 19.9 ~ 17 fps    + Compare + 📈 Graph
» The benchmarks indicate that the game is not playable in the tested settings.
low 1920x1080
0 (!)  fps    + Compare
high 1920x1080
0 (!)  fps    + Compare
low 1920x1080
60.4  fps    + Compare + 📈 Graph
med. 1920x1080
44.9  fps    + Compare + 📈 Graph
high 1920x1080
38  fps    + Compare + 📈 Graph
ultra 1920x1080
30.2  fps    + Compare + 📈 Graph
» With all tested laptops playable in detail settings high.
low 1920x1080
48  fps    + Compare
med. 1920x1080
41  fps    + Compare
high 1920x1080
34  fps    + Compare
ultra 1920x1080
26  fps    + Compare
» With all tested laptops playable in detail settings med..
low 1920x1080
41.6  fps    + Compare + 📈 Graph
med. 1920x1080
31.9  fps    + Compare + 📈 Graph
high 1920x1080
30.1  fps    + Compare + 📈 Graph
ultra 1920x1080
26.8  fps    + Compare + 📈 Graph
» With all tested laptops playable in detail settings low.
low 1920x1080
23.2  fps    + Compare + 📈 Graph
med. 1920x1080
22.9  fps    + Compare + 📈 Graph
high 1920x1080
20.3  fps    + Compare + 📈 Graph
ultra 1920x1080
14.5  fps    + Compare + 📈 Graph
» The benchmarks indicate that the game is not playable in the tested settings.
Palworld

Palworld

2024
low 1920x1080
81.5  fps    + Compare + 📈 Graph
med. 1920x1080
62.3  fps    + Compare + 📈 Graph
high 1920x1080
36.2  fps    + Compare + 📈 Graph
ultra 1920x1080
30.1  fps    + Compare + 📈 Graph
» With all tested laptops playable in detail settings high.
med. 1920x1080
209  fps    + Compare + 📈 Graph
high 1920x1080
168.4  fps    + Compare + 📈 Graph
ultra 1920x1080
160.3  fps    + Compare + 📈 Graph
» With all tested laptops playable in detail settings ultra.
low 1920x1080
75.3  fps    + Compare + 📈 Graph
med. 1920x1080
59.8  fps    + Compare + 📈 Graph
high 1920x1080
43.8  fps    + Compare + 📈 Graph
ultra 1920x1080
27.5  fps    + Compare + 📈 Graph
» With all tested laptops playable in detail settings high.
low 1920x1080
94.6  fps    + Compare + 📈 Graph
med. 1920x1080
69.9  fps    + Compare + 📈 Graph
high 1920x1080
60.2  fps    + Compare + 📈 Graph
ultra 1920x1080
46.2  fps    + Compare + 📈 Graph
» With all tested laptops playable in detail settings ultra.
low 1920x1080
22  fps    + Compare
med. 1920x1080
20  fps    + Compare
high 1920x1080
17  fps    + Compare
ultra 1920x1080
12  fps    + Compare
» The benchmarks indicate that the game is not playable in the tested settings.
low 1920x1080
77  fps    + Compare
med. 1920x1080
64  fps    + Compare
high 1920x1080
49  fps    + Compare
ultra 1920x1080
43  fps    + Compare
» With all tested laptops playable in detail settings ultra.
low 1920x1080
21.6  fps    + Compare + 📈 Graph
med. 1920x1080
20.2  fps    + Compare + 📈 Graph
high 1920x1080
19.8  fps    + Compare + 📈 Graph
» The benchmarks indicate that the game is not playable in the tested settings.
low 1920x1080
26.1  fps    + Compare + 📈 Graph
med. 1920x1080
23.9  fps    + Compare + 📈 Graph
high 1920x1080
18.7  fps    + Compare + 📈 Graph
ultra 1920x1080
13.2  fps    + Compare + 📈 Graph
» The benchmarks indicate that the game is not playable in the tested settings.
low 1920x1080
90.3 99.7 100 101.4 ~ 98 fps    + Compare
med. 1920x1080
67.9 74 81.9 82.6 ~ 77 fps    + Compare
high 1920x1080
48.3 50.7 63.2 63.7 ~ 56 fps    + Compare
ultra 1920x1080
38.3 42.2 54.4 54.7 ~ 47 fps    + Compare
» With all tested laptops playable in detail settings ultra.
Additional Benchmarks
Low Preset 1280x720
171.5
low 1920x1080
52  fps    + Compare
med. 1920x1080
44  fps    + Compare
high 1920x1080
42  fps    + Compare
ultra 1920x1080
32  fps    + Compare
» With all tested laptops playable in detail settings high.
low 1920x1080
117.3  fps    + Compare + 📈 Graph
med. 1920x1080
90.7  fps    + Compare + 📈 Graph
high 1920x1080
52.3  fps    + Compare + 📈 Graph
ultra 1920x1080
35.8  fps    + Compare + 📈 Graph
» With all tested laptops playable in detail settings ultra.
low 1920x1080
27.1 28.8 36.1 40 43 43.7 43.9 44.4 44.5 44.9 46 46 46 46.8 47.7 47.8 48 48.1 48.9 49.2 49.5 49.6 49.9 50.4 50.5 50.6 51.4 51.5 52.5 ~ 46 fps    + Compare
med. 1920x1080
22.3 22.5 31.3 32.3 32.4 34.7 34.9 35.5 35.5 35.8 36.2 36.3 36.7 37.8 37.9 38 38.1 38.1 38.2 38.3 39.4 39.6 40.2 40.4 40.5 40.5 40.7 40.9 ~ 36 fps    + Compare
high 1920x1080
17.2 18.4 24.9 25.4 26.8 26.8 27.3 27.4 28.1 28.3 28.7 28.7 28.9 28.9 28.9 29.3 29.3 29.4 29.9 30.1 30.1 30.4 30.7 30.8 30.9 31.6 31.9 32.3 ~ 28 fps    + Compare
ultra 1920x1080
15.5 15.6 21.5 23 23.1 23.8 23.9 24.1 24.4 24.9 25 25 25.1 25.1 25.4 25.5 25.5 25.5 26 26.2 26.2 26.5 26.6 26.7 26.8 27 27.8 28 28.4 ~ 25 fps    + Compare
» With most tested laptops playable in detail settings med..
Additional Benchmarks
Low Preset (FSR off) 1280x720
76.7
82.2
85.1
72.5
80.3
77.1
82.6
78.3
74
83.4
71.3
84.9
80.8
46
Ray Tracing Ultra Preset (DLSS off) 1920x1080
5.2
6.4
8.2
7.3
5.5
7.5
Steam Deck 1280x800
81
77.7
60
Ultra Preset (FSR2 on) 1920x1080
32.3
29.4
26.7
30.6
30min Start Ultra Preset (FSR off) 1920x1080
19.5
25.3
20.9
24.9
27
25.1
23.8
24.2
17.4
24.9
24.7
22.8
23.2
23.3
21.8
28.7
25.4
23.9
23.8
25.1
21.8
23.6
12.5
low 1920x1080
26.8 26.8 35 35.8 38.8 39.8 40.2 41.1 41.3 43.7 44.1 44.5 44.6 44.8 44.9 45.2 45.4 45.7 46 46 46.2 47.1 48.5 48.6 48.7 49.5 49.8 50 51.3 ~ 43 fps    + Compare + 📈 Graph
med. 1920x1080
20.4 21.3 29.1 29.2 31.5 31.8 32.1 33.6 34.1 34.2 34.5 34.6 35.4 35.6 35.6 35.8 35.8 35.9 36.4 36.9 37.5 37.7 37.8 37.9 38.2 38.2 38.7 39.8 40.1 ~ 34 fps    + Compare + 📈 Graph
high 1920x1080
16.9 18.8 24.1 25.6 26.8 27.1 27.9 28.2 28.5 28.5 28.6 28.8 28.9 29 29.4 29.4 29.4 29.9 30.2 30.2 30.8 30.9 30.9 31.2 31.6 31.8 32.1 32.8 33.2 ~ 29 fps    + Compare + 📈 Graph
ultra 1920x1080
16.8 18.6 19.7 24 24.9 25.5 26.5 27.4 27.5 27.9 28.1 28.3 28.4 28.4 28.7 28.9 29.1 29.1 29.6 29.7 30 30.7 30.7 31.1 31.3 31.5 32.5 32.7 ~ 28 fps    + Compare + 📈 Graph
» With most tested laptops playable in detail settings low.
Additional Benchmarks
Low Preset SMAA 1280x720
64.2
58.9
73.4
55.2
67.9
59.4
60.7
68
65.1
76.6
71.1
75.6
82.1
41
Low Preset FSR 2.2 Balanced 1920x1080
41.9
47.8
Lies of P

Lies of P

2023
low 1920x1080
62.5  fps    + Compare + 📈 Graph
med. 1920x1080
53.9  fps    + Compare + 📈 Graph
high 1920x1080
46.3  fps    + Compare + 📈 Graph
ultra 1920x1080
38.4  fps    + Compare + 📈 Graph
» With all tested laptops playable in detail settings ultra.
low 1920x1080
40  fps    + Compare
med. 1920x1080
36  fps    + Compare
high 1920x1080
30  fps    + Compare
ultra 1920x1080
26  fps    + Compare
» With all tested laptops playable in detail settings med..
low 1920x1080
49.8  fps    + Compare + 📈 Graph
med. 1920x1080
43.3  fps    + Compare + 📈 Graph
high 1920x1080
40.1  fps    + Compare + 📈 Graph
ultra 1920x1080
33.1  fps    + Compare + 📈 Graph
» With all tested laptops playable in detail settings high.
low 1920x1080
0 (!)  fps    + Compare
med. 1920x1080
0 (!)  fps    + Compare
high 1920x1080
0 (!)  fps    + Compare
ultra 1920x1080
0 (!)  fps    + Compare
low 1920x1080
31.8  fps    + Compare + 📈 Graph
med. 1920x1080
26  fps    + Compare + 📈 Graph
high 1920x1080
21.5  fps    + Compare + 📈 Graph
ultra 1920x1080
20.9  fps    + Compare + 📈 Graph
» The benchmarks indicate that the game is not playable in the tested settings.
F1 23

F1 23

2023
low 1920x1080
72.8 88.3 106.3 ~ 89 fps    + Compare
med. 1920x1080
69.3 76.4 96.5 ~ 81 fps    + Compare
high 1920x1080
55.6 58.6 70.3 ~ 62 fps    + Compare
ultra 1920x1080
12.1 12.3 17 ~ 14 fps    + Compare
» With all tested laptops playable in detail settings high.
low 1920x1080
0 (!)  fps    + Compare
med. 1920x1080
0 (!)  fps    + Compare
high 1920x1080
0 (!)  fps    + Compare
ultra 1920x1080
0 (!)  fps    + Compare
low 1920x1080
93.1  fps    + Compare
med. 1920x1080
65.3  fps    + Compare
high 1920x1080
49.8  fps    + Compare
ultra 1920x1080
49.1  fps    + Compare
» With all tested laptops playable in detail settings ultra.
low 1920x1080
59.3  fps    + Compare + 📈 Graph
med. 1920x1080
46  fps    + Compare + 📈 Graph
high 1920x1080
26.8  fps    + Compare + 📈 Graph
ultra 1920x1080
21.3  fps    + Compare + 📈 Graph
» With all tested laptops playable in detail settings med..
Returnal

Returnal

2023
low 1920x1080
32  fps    + Compare
med. 1920x1080
30  fps    + Compare
high 1920x1080
26  fps    + Compare
ultra 1920x1080
22  fps    + Compare
» The benchmarks indicate that the game is not playable in the tested settings.
low 1920x1080
42.6  fps    + Compare + 📈 Graph
med. 1920x1080
36.8  fps    + Compare + 📈 Graph
high 1920x1080
24.8  fps    + Compare + 📈 Graph
ultra 1920x1080
19.3  fps    + Compare + 📈 Graph
» With all tested laptops playable in detail settings med..
low 1920x1080
60.2  fps    + Compare + 📈 Graph
med. 1920x1080
46.7  fps    + Compare + 📈 Graph
high 1920x1080
40.9  fps    + Compare + 📈 Graph
ultra 1920x1080
35  fps    + Compare + 📈 Graph
» With all tested laptops playable in detail settings high.
Additional Benchmarks
Low Preset / Off 1280x720
112.5
F1 22

F1 22

2022
low 1920x1080
81 99.2 101.6 106 106.3 107.3 110.1 110.5 111.2 ~ 104 fps    + Compare
med. 1920x1080
76.8 90.6 94.5 96.1 97.1 98.2 100.3 100.8 102.9 ~ 95 fps    + Compare
high 1920x1080
64.2 67.8 71.6 72.3 72.7 74.3 76.8 77 78.1 ~ 73 fps    + Compare
ultra 1920x1080
16.7 19 19.7 20.1 20.2 20.9 21.2 22 22 ~ 20 fps    + Compare
» With all tested laptops playable in detail settings high.
Additional Benchmarks
Ultra Low Preset 16xAF TAA 1280x720
178.8
186.8
173.2
176.1
164.3
160.9
med. 1920x1080
44.7  fps    + Compare
high 1920x1080
43.1  fps    + Compare
» With all tested laptops playable in detail settings high.
low 1920x1080
68.1 80 84.4 85.2 86.9 88.3 ~ 82 fps    + Compare
med. 1920x1080
52.2 53.8 60.7 62.1 62.3 62.4 ~ 59 fps    + Compare
high 1920x1080
35.9 36.1 39.5 41.2 41.4 41.8 ~ 39 fps    + Compare
ultra 1920x1080
28.1 29.4 31.6 32.5 33 34.1 ~ 31 fps    + Compare
» With all tested laptops playable in detail settings high.
Additional Benchmarks
Lowest Preset (DX12) 1280x720
172.1
170.3
148.2
161.5
139.5
104.3
low 1280x720
194.2 207 ~ 201 fps    + Compare + 📈 Graph
med. 1920x1080
119.8 119.9 ~ 120 fps    + Compare + 📈 Graph
high 1920x1080
79 82.8 ~ 81 fps    + Compare + 📈 Graph
ultra 1920x1080
77.6 78.3 ~ 78 fps    + Compare + 📈 Graph
» With all tested laptops playable in detail settings ultra.
Additional Benchmarks
Low Preset 1920x1080
172.6
171.6
low 1280x720
141 160 ~ 151 fps    + Compare
med. 1920x1080
77 83 ~ 80 fps    + Compare
high 1920x1080
69 73 ~ 71 fps    + Compare
ultra 1920x1080
35 35 ~ 35 fps    + Compare
» With all tested laptops playable in detail settings high.
Additional Benchmarks
Low Preset 1920x1080
91
low 1280x720
179.3  fps    + Compare
med. 1920x1080
61.6  fps    + Compare
high 1920x1080
37.3  fps    + Compare
ultra 1920x1080
25.2  fps    + Compare
» With all tested laptops playable in detail settings high.
low 1280x720
114  fps    + Compare
med. 1920x1080
46 49 ~ 48 fps    + Compare
high 1920x1080
44 45 ~ 45 fps    + Compare
ultra 1920x1080
37 39 ~ 38 fps    + Compare
QHD 2560x1440
23  fps    + Compare
» With all tested laptops playable in detail settings ultra.
Additional Benchmarks
Lowest Preset 1920x1080
59
80
Strange Brigade

Strange Brigade

2018
low 1280x720
117.3 136.1 147.9 156 165.1 166.8 170.1 170.3 171.9 174.4 176.7 179.7 180.7 182.1 182.9 186.1 186.7 189.2 191.3 193 195.7 198 199.8 ~ 175 fps    + Compare
med. 1920x1080
60.4 68.1 69.3 70.8 71.1 71.5 74.5 74.9 75.2 75.7 76.3 76.6 76.9 77.7 77.8 78.5 78.6 79 79.5 79.7 80.6 81.9 82 ~ 76 fps    + Compare
high 1920x1080
51 56.1 58.7 59.4 59.7 60.2 60.8 63.6 63.8 63.8 64.3 64.8 65.1 65.2 65.2 65.9 66.1 66.7 67.3 67.8 68 68.6 69.8 ~ 64 fps    + Compare
ultra 1920x1080
44.8 48.3 48.5 49.8 51.2 51.4 51.4 54.2 54.2 54.2 54.2 54.6 54.6 55.4 55.7 56.1 56.1 56.4 56.5 57.6 58.4 58.8 59.7 ~ 54 fps    + Compare
» With all tested laptops playable in detail settings ultra.
Far Cry 5

Far Cry 5

2018
low 1280x720
75 80 81 92 92 93 98 98 98 98 101 ~ 91 fps    + Compare + 📈 Graph
med. 1920x1080
42 45 50 55 57 57 58 58 59 59 60 ~ 55 fps    + Compare + 📈 Graph
high 1920x1080
39 42 46 53 53 53 53 53 54 54 55 ~ 50 fps    + Compare + 📈 Graph
ultra 1920x1080
33 36 40 50 50 50 50 51 51 52 52 ~ 47 fps    + Compare + 📈 Graph
» With most tested laptops playable in detail settings ultra.
low 1280x720
45.5 49.3 53.9 57.1 65.1 65.7 66.5 67.2 70.8 71.6 71.7 73.7 77.3 78.2 78.2 79.1 80 81 82.1 82.2 82.6 85.1 86.9 87 87.5 88.8 91.1 ~ 74 fps    + Compare
med. 1920x1080
40.8 41.6 46.6 47.8 50.2 54.3 54.4 54.9 55 55 56 58.6 59.4 60 60.7 61.7 62.4 63.6 63.7 64.9 65 65.5 67.6 67.9 68 68.6 69.9 ~ 59 fps    + Compare
high 1920x1080
33.7 33.9 38.2 38.8 41.9 42.2 43 43.1 44 44.2 45.4 45.6 46.2 46.2 46.7 47.3 49.6 49.9 50.5 50.6 50.6 50.8 51 51.1 51.6 53.3 53.3 ~ 46 fps    + Compare
» With most tested laptops playable in detail settings high.
low 1280x720
46.4 59 63.8 72.7 73 75.5 75.5 75.6 78.9 81.9 82.1 82.9 82.9 83.3 83.7 85.5 85.5 86 88.8 89 89.3 92.2 92.5 92.8 93.7 94.6 ~ 81 fps    + Compare
med. 1920x1080
23.7 33.4 33.7 37 38.3 39.1 39.7 40.8 41.5 42.1 42.3 43.9 44 44.1 44.2 44.5 45.1 45.2 45.4 45.6 45.7 45.9 46.3 47 47.5 48.4 ~ 42 fps    + Compare
high 1920x1080
17.7 24.1 25.5 26.4 26.6 27.8 28.6 28.7 30.1 30.2 30.3 30.6 30.8 31.2 31.5 31.6 32 32.3 32.4 32.5 32.9 33.2 33.3 33.5 34.4 34.8 ~ 30 fps    + Compare
QHD 2560x1440
22.8  fps    + Compare
» With most tested laptops playable in detail settings med..
low 1280x720
92.1 92.6 104.7 109.7 112.4 127.5 129.9 132.3 135.4 142.7 143.7 153.6 154.3 155.6 157.1 157.8 158 158.1 161.1 162.7 165.2 166.6 167.6 168.1 169.1 170.6 171.3 171.8 175.6 ~ 147 fps    + Compare
med. 1366x768
85.7 91.2 98.7 100.5 102.6 104 104.7 108.5 111.6 112.7 121.2 121.4 123.1 123.7 124 125.7 126.7 127.7 128 129 129.7 133.2 133.2 133.6 134.1 135.7 138.8 138.9 143.6 ~ 120 fps    + Compare
high 1920x1080
34.8 35.8 35.8 37.9 45.7 46.4 46.6 47.7 48.1 60.7 64.7 76.8 80.9 85.7 86.7 87.2 88.7 90 90 90.6 91.6 92.1 93 93.2 93.4 98.7 99.2 99.5 100 ~ 74 fps    + Compare
ultra 1920x1080
32.4 33.1 33.6 36 43.6 44.7 44.8 45.1 46.7 54.1 57.5 70.1 70.5 76.3 77.6 77.7 78.3 79.7 79.8 82 82.5 82.8 83.3 83.4 84.6 85 87.4 89.8 93 ~ 67 fps    + Compare
» With most tested laptops playable in detail settings ultra.
low 1024x768
91.4 115.2 155 158.4 164 167 169 170.1 173 179.5 ~ 154 fps    + Compare + 📈 Graph
med. 1366x768
56.9 89.3 104.5 109.2 111.7 116.8 ~ 98 fps    + Compare + 📈 Graph
high 1920x1080
28.9 48 51 51 52 53.3 55 57.4 57.7 61.7 ~ 52 fps    + Compare + 📈 Graph
ultra 1920x1080
19.4 31 32 32.7 33 34 36.7 37 37.7 39.1 ~ 33 fps    + Compare + 📈 Graph
» With most tested laptops playable in detail settings high.
Additional Benchmarks
Medium Graphics & Postprocessing 1920x1080
66.9
67.2
62.8
51.4
73.3
34
GTA V

GTA V

2015
low 1024x768
126.4 149.1 150.2 151 157.8 158.6 161 161.3 164.5 166.1 166.2 166.6 166.6 167 167.2 167.7 168.7 168.9 170.4 172.7 172.7 173 174.3 175.8 ~ 163 fps    + Compare
med. 1366x768
115 129.6 132.9 143.5 145.9 150.1 151.3 152.7 154.1 154.9 156.4 157 157.2 158.7 158.9 159.9 160.8 161.5 162.6 167.6 167.7 170.9 ~ 153 fps    + Compare
high 1920x1080
36.6 64.8 68.4 69.6 70.8 71.2 71.7 71.7 71.9 73.5 73.9 74 74.7 76 76.2 76.5 78.2 78.8 79 79.1 79.5 79.5 79.9 80.2 81.5 ~ 73 fps    + Compare
ultra 1920x1080
14.9 29 29.5 29.7 29.7 30.3 30.4 30.6 31 31.1 31.1 31.2 31.4 31.4 31.5 31.6 31.9 32.2 32.3 32.4 32.7 32.8 33.1 33.2 33.3 ~ 31 fps    + Compare
» With all tested laptops playable in detail settings high.
Additional Benchmarks
Highest 16xAF 4xMSAA + FXAA 3840x2160
10.1
Normal/Off 4xAF 1920x1080
146.1
143.2
145.5
139.7
127.8
140.4
134.2
139.9
130.2
136.7
139.1
137.4
153.1
136.4
149.7
151.4
152.8
81.6
Lowest Settings possible 1920x1080
150.4
146.6
150.9
139.9
137
142.2
138.6
141.6
131.4
136.7
140.5
136.4
150.8
138.5
146.2
150.5
156.5
76.1
lowmed.highultraQHD4K
Call of Duty Black Ops 776674914
Anno 117: Pax Romana33.619.313.28.3
F1 25866840
Doom: The Dark Ages20.317.315.8
The Elder Scrolls IV Oblivion Remastered49.329.219.78.54
Assassin's Creed Shadows28262214
Civilization 71216334
Monster Hunter Wilds272114
Kingdom Come Deliverance 219.916.313
Indiana Jones and the Great Circle29.118.8
Stalker 225.421.818.6
Call of Duty Black Ops 669624337
Until Dawn50.332.522.116.4
God of War Ragnarök41.134.330.624.9
Final Fantasy XVI22.722.718.8
Space Marine 23428.726.922.6
Star Wars Outlaws1614.712.5
Black Myth: Wukong41322518
Once Human58393228
The First Descendant63393126
F1 24797252136.46
Senua's Saga Hellblade 220.816.612.6
Ghost of Tsushima34.6292320
Horizon Forbidden West28261917
Dragon's Dogma 2
Last Epoch60.444.93830.2
Skull & Bones48413426
Helldivers 241.631.930.126.8
Enshrouded23.222.920.314.5
Palworld81.562.336.230.1
Prince of Persia The Lost Crown209168.4160.3
Ready or Not75.359.843.827.5
The Finals94.669.960.246.2
Avatar Frontiers of Pandora22201712
Call of Duty Modern Warfare 3 202377644943
Alan Wake 221.620.219.8
Lords of the Fallen26.123.918.713.2
Total War Pharaoh98775647
Assassin's Creed Mirage52444232
Counter-Strike 2117.390.752.335.8
Cyberpunk 207746362825
Baldur's Gate 343342928
Lies of P62.553.946.338.4
The Crew Motorfest40363026
Armored Core 649.843.340.133.1
Atlas Fallen
Ratchet & Clank Rift Apart31.82621.520.9
F1 2389816214
Resident Evil 4 Remake
Company of Heroes 393.165.349.849.1
Atomic Heart59.34626.821.3
Returnal32302622
Hogwarts Legacy42.636.824.819.3
The Witcher 3 v460.246.740.935
F1 22104957320
Ghostwire Tokyo44.743.1
Tiny Tina's Wonderlands82593931
Farming Simulator 222011208178
Forza Horizon 5151807135
Total War: Three Kingdoms179.361.637.325.2
Shadow of the Tomb Raider11448453823
Strange Brigade175766454
Far Cry 591555047
X-Plane 11.11745946
Final Fantasy XV Benchmark81423022.8
Dota 2 Reborn1471207467
The Witcher 3154985233
GTA V1631537331
lowmed.highultraQHD4K
< 30 fps
< 60 fps
< 120 fps
≥ 120 fps
14
19
22
8
18
25
17
4
24
30
8
1
31
19
2
1
3


For more games that might be playable and a list of all games and graphics cards visit our Gaming List

v1.35
log 13. 21:10:56

#0 ran 0s before starting gpusingle class +0s ... 0s

#1 no ids found in url (should be separated by "_") +0s ... 0s

#2 not redirecting to Ajax server +0s ... 0s

#3 did not recreate cache, as it is less than 5 days old! Created at Fri, 13 Mar 2026 15:31:10 +0100 +0.001s ... 0.001s

#4 no comparison url found in template nbc.compare_page_1 needed +0.012s ... 0.014s

#5 no comparison url found in template nbc.compare_page_1 needed +0s ... 0.014s

#6 no comparison url found in template nbc.compare_page_1 needed +0s ... 0.014s

#7 no comparison url found in template nbc.compare_page_1 needed +0s ... 0.015s

#8 composed specs +0s ... 0.015s

#9 did output specs +0s ... 0.015s

#10 start showIntegratedCPUs +0s ... 0.015s

#11 getting avg benchmarks for device 12524 +0.032s ... 0.047s

#12 got single benchmarks 12524 +0.083s ... 0.13s

#13 got avg benchmarks for devices +0s ... 0.13s

#14 min, max, avg, median took s +1.998s ... 2.128s

#15 before gaming benchmark output +0.001s ... 2.129s

#16 Got 1315 rows for game benchmarks. +0.227s ... 2.356s

#17 composed SQL query for gamebenchmarks +0s ... 2.356s

#18 got data and put it in $dataArray +0.049s ... 2.405s

#19 benchmarks composed for output. +0.649s ... 3.053s

#20 no comparison url found in template nbc.compare_page_1 needed +0.127s ... 3.18s

#21 return log +0s ... 3.18s

Notebook reviews with AMD Radeon 890M graphics card

迷你论坛 AI X1 Pro

Minisforum AI X1 Pro 与 Ryzen AI 9 HX 470 评测:用于办公、游戏和人工智能的迷你 PC 升级,内存是否存在瓶颈?

Minisforum 对 AI X1 Pro 进行了更新,现在又为这款小巧的动力装置配备了 AMD Ryzen AI 9 HX 470,带来了更强大的 APU,承诺提供更多储备,尤其是针对要求苛刻的工作负载和 AI 应用。但这款新处理器在实际应用中能否满足人们的高期望值呢?
AMD Ryzen AI 9 HX 470, Radeon 890M, 1.3 kg
Peladn HO5

性价比最高的迷你 PC 评测:针对 Geekom 和 Minisforum 的内幕消息:Peladn HO5 搭载 Ryzen AI 9 HX 370

配备 AMD Ryzen AI 9 HX 370 和 Radeon 890M 的 Peladn HO5 是一款功能强大的迷你 PC,售价约为 1,000 美元。在我们的评测中,我们考察了性能、效率、体积和功能,包括 OCuLink。小巧的 Strix Point 电脑能否经得起 Minisforum 和 Geekom 的考验?
AMD Ryzen AI 9 HX 370, Radeon 890M, 575 g
配备 144 Hz OLED 显示屏和可拆卸控制器的游戏掌上电脑 - 联想Legion Go 2 评测

配备 144 Hz OLED 显示屏和可拆卸控制器的游戏掌上电脑 - 联想Legion Go 2 评测

联想为其游戏手持设备配备了高品质的 OLED 面板和 AMD Ryzen Z2 Extreme,使其性能更上一层楼。可拆卸的控制器依然包括在内。不过,其售价高达 1,499 欧元(约合 1777 美元),成为市场上最昂贵的掌上游戏机之一。
AMD Ryzen Z2 Extreme, Radeon 890M, 8.8", 922 g
这是联想功能最强大的 16 英寸 AMD 笔记本电脑:配备 Ryzen AI 9 HX 的 ThinkPad P16s Gen 4 评测

这是联想功能最强大的 16 英寸 AMD 笔记本电脑:配备 Ryzen AI 9 HX 的 ThinkPad P16s Gen 4 评测

这是 AMD CPU 在 ThinkPad P 系列中的胜利回归:通过 Strix Point,联想让联想 ThinkPad P16s AMD 起死回生。全新的 P16s Gen 6 AMD 配备了 AMD Ryzen AI 9 Pro HX 370,这是笔记本电脑中最强大的 Strix Point CPU 之一。
AMD Ryzen AI 9 HX PRO 370, Radeon 890M, 16", 2 kg
8 英寸游戏掌上电脑也配备 AMD - MSI Claw A8 评测

8 英寸游戏掌上电脑也配备 AMD - MSI Claw A8 评测

除了搭载英特尔处理器的 Claw 8 AI+ 游戏掌机外,微星现在还推出了搭载 AMD Ryzen Z2 Extreme 处理器的版本。除了处理器,Claw A8 还换上了新的外壳。建议零售价仍为 999 欧元,但人体工学设计有所逊色。
AMD Ryzen Z2 Extreme, Radeon 890M, 8", 765 g

Sapphire Edge AI, Ryzen AI 9 HX 370: AMD Ryzen AI 9 HX 370, 0.4 kg
  Review » 蓝宝石 Edge AI:搭载 AMD Ryzen AI 9 HX 370 和磁性盖子的迷你 PC 回归评测

Minisforum N5 Pro: AMD Ryzen AI 9 HX PRO 370, 5 kg
  Review » Minisforum N5 Pro:全球首款搭载 AMD Ryzen AI 9 HX PRO 370 的 AI NAS - IFA 2025 获奖评测

Asus ROG Xbox Ally X: AMD Ryzen Z2 Extreme, 7.00", 0.7 kg
  Review » 游戏掌上设备的 Xbox 全屏体验--华硕 ROG Xbox Ally X 评测

Geekom A9 Max, AI 9 HX 370: AMD Ryzen AI 9 HX 370, 0.7 kg
  Review » 有史以来最好的 Geekom 迷你 PC?Geekom A9 Max 评测,搭载 AMD Ryzen AI 9 HX 370,售价 999 美元

Tuxedo Infinity Book Pro 14 Gen10 AMD: AMD Ryzen AI 9 HX 370, 14.00", 1.5 kg
  Review » Tuxedo Infinity Book Pro 14 Gen10 评论 - 配备 AMD Zen 5 和 128 GB 内存的 Linux 超极本

Lenovo ThinkPad P14s Gen 6 21RV0017GE: AMD Ryzen AI 9 HX PRO 370, 14.00", 1.4 kg
  Review » 搭载 Ryzen AI 9 HX 的最强 AMD 14 英寸 ThinkPad:联想 ThinkPad P14s 第 6 代 AMD 笔记本电脑评测

Acemagic F3A: AMD Ryzen AI 9 HX 370, 1 kg
  Review » 搭载 AMD Ryzen AI 9 HX 370、价格不到 700 美元的经济型迷你 PC - Acemagic F3A 的详细评测

Framework Laptop 13.5 Ryzen AI 9 HX 370: AMD Ryzen AI 9 HX 370, 13.50", 1.3 kg
  Review » 框架笔记本 13.5 Ryzen AI 9 评测:跳过英特尔版本,获得更佳性能

ONEXPLAYER X1 Pro GA15H: AMD Ryzen AI 9 HX 370, 10.95", 0.9 kg
  Review » XL 游戏掌上电脑、平板电脑和笔记本电脑:OneXplayer X1 Pro 评论

Minisforum AI X1 Pro, HX 370: AMD Ryzen AI 9 HX 370, 1.4 kg
  Review » Minisforum AI X1 Pro 评测:适用于办公、多媒体、游戏和创意任务的全能迷你 PC

HP EliteBook X G1a 14 AI: AMD Ryzen AI 9 HX PRO 375, 14.00", 1.5 kg
  Review » 惠普 EliteBook X G1a 14 AI 评测:配备 AMD Ryzen AI 9 HX 的超强商务笔记本电脑

GMK EVO-X1: AMD Ryzen AI 9 HX 370, 0.6 kg
  Review » GMKtec EVO-X1 mini PC 评测:采用 Oculink 和 Ryzen AI 9 的全新盒式设计

GPD Pocket 4: AMD Ryzen AI 9 HX 370, 8.80", 0.8 kg
  Review » GPD Pocket 4 Ryzen AI 9 掌上电脑评测:小巧、快速、可爱

Minisforum EliteMini AI370: AMD Ryzen AI 9 HX 370, 0.5 kg
  Review » Minisforum EliteMini AI370 评测:采用 AMD Zen 5 Strix Point APU 的迷你 PC 树立了新标准

Beelink SER9: AMD Ryzen AI 9 HX 370, 0.8 kg
  Review » Beelink SER9 评测:AMD Zen 5 让这款迷你电脑比以往更快

HP OmniBook Ultra 14: AMD Ryzen AI 9 HX 375, 14.00", 1.5 kg
  Review » Ryzen AI 9 HX 375 性能首次亮相:惠普 OmniBook Ultra 14 笔记本电脑评测

Asus VivoBook S 14 OLED M5406WA: AMD Ryzen AI 9 HX 370, 14.00", 1.3 kg
  Review » 华硕 VivoBook S 14 OLED 笔记本电脑评测:Ryzen AI 9 HX 370 的成功表现

Asus ProArt P16 H7606WI: AMD Ryzen AI 9 HX 370
  Review » AMD Zen 5 Strix Point iGPU 分析 - Radeon 890M 与英特尔 Arc Graphics、Apple M3 和高通 Adreno X1-85 的比较

Asus ProArt PX13 HN7306: AMD Ryzen AI 9 HX 370
  Review » AMD Zen 5 Strix Point iGPU 分析 - Radeon 890M 与英特尔 Arc Graphics、Apple M3 和高通 Adreno X1-85 的比较

Asus Zenbook S 16 UM5606-RK333W: AMD Ryzen AI 9 HX 370, 16.00", 1.5 kg
  Review » AMD Zen 5 Strix Point iGPU 分析 - Radeon 890M 与英特尔 Arc Graphics、Apple M3 和高通 Adreno X1-85 的比较

Asus ProArt P16 H7606WI: AMD Ryzen AI 9 HX 370
  Review » AMD Zen 5 Strix Point CPU 分析 - Ryzen AI 9 HX 370 与英特尔酷睿 Ultra、Apple M3 和高通骁龙 X Elite 的比较

Asus Zenbook S 16 UM5606-RK333W: AMD Ryzen AI 9 HX 370, 16.00", 1.5 kg
  Review » AMD Zen 5 Strix Point CPU 分析 - Ryzen AI 9 HX 370 与英特尔酷睿 Ultra、Apple M3 和高通骁龙 X Elite 的比较

  Review » 华硕 Zenbook S 16 笔记本电脑评测--首款在 1.3 厘米厚的外壳内搭载 AMD Zen 5 的 Copilot+ 笔记本电脑

Lenovo ThinkPad P14s Gen 6 21RV0017GE: AMD Ryzen AI 9 HX PRO 370, 14.00", 1.4 kg
  External Review » Lenovo ThinkPad P14s Gen 6 21RV0017GE

Asus Zenbook S16 UM5606GA: AMD Ryzen AI 9 HX 470, 16.00", 1.5 kg
  External Review » Asus Zenbook S16 UM5606GA

MSI Prestige A16 AI+ A3HMG: AMD Ryzen AI 9 HX 370, 16.00", 2 kg
  External Review » MSI Prestige A16 AI+ A3HMG

Lenovo Legion Go 2: AMD Ryzen Z2 Extreme, 8.80", 0.9 kg
  External Review » 联想Legion Go 2

Asus ROG Xbox Ally X: AMD Ryzen Z2 Extreme, 7.00", 0.7 kg
  External Review » Asus ROG Xbox Ally X

MSI Claw A8 BZ2EM: AMD Ryzen Z2 Extreme, 8.00", 0.8 kg
  External Review » MSI Claw A8 BZ2EM

Framework Laptop 13.5 Ryzen AI 9 HX 370: AMD Ryzen AI 9 HX 370, 13.50", 1.3 kg
  External Review » Framework Laptop 13.5 Ryzen AI 9 HX 370

HP EliteBook X G1a 14 AI: AMD Ryzen AI 9 HX PRO 375, 14.00", 1.5 kg
  External Review » HP EliteBook X G1a 14 AI

MSI Stealth A16 AI+ A3XVGG, HX 370: AMD Ryzen AI 9 HX 370, 16.00", 2.1 kg
  External Review » MSI Stealth A16 AI+ A3XVGG, HX 370

HP OmniBook Ultra 14: AMD Ryzen AI 9 HX 375, 14.00", 1.5 kg
  External Review » HP OmniBook Ultra 14

HP EliteBook X G1a: AMD Ryzen AI 9 HX 375, 14.00", 1.2 kg
  External Review » HP EliteBook X G1a

Asus VivoBook S 14 OLED M5406WA: AMD Ryzen AI 9 HX 370, 14.00", 1.3 kg
  External Review » Asus VivoBook S 14 OLED M5406WA

Asus Zenbook S 16 UM5606-RK333W: AMD Ryzen AI 9 HX 370, 16.00", 1.5 kg
  External Review » Asus Zenbook S16 UM5606

Minisforum AI X1 Pro, HX 470: AMD Ryzen AI 9 HX 470, 1.3 kg
   » 小巧、高品质、强大的连接能力 - Minisforum AI X1 Pro(配备 Ryzen AI 9 HX 470)评测

Peladn HO5, AI 9 HX 370: AMD Ryzen AI 9 HX 370, 0.6 kg
   » 性能卓越,价格公道:Peladn HO5 迷你电脑性价比极高

Lenovo Legion Go 2: AMD Ryzen Z2 Extreme, 8.80", 0.9 kg
   » 联想的Legion Go 2 也配备了速度较慢的 AMD Ryzen Z2,但 SteamOS 仍需时日

   » 1500 欧元购买联想Legion Go 2 游戏掌上电脑和 Z2 Extreme 太贵了

MSI Claw A8 BZ2EM: AMD Ryzen Z2 Extreme, 8.00", 0.8 kg
   » 微星Claw A8的新AMD版本比英特尔版本差,尽管价格相同

Framework Laptop 13.5 Ryzen AI 9 HX 370: AMD Ryzen AI 9 HX 370, 13.50", 1.3 kg
   » 仅一周后,Framework 笔记本电脑再次提价

Lenovo ThinkPad P16s Gen 4 21RX000YGE: AMD Ryzen AI 9 HX PRO 370, 16.00", 2 kg
   » Strix Point ThinkPads 没有 OLED:联想人为地将其 AMD 型号限制在 WUXGA IPS 上

Sapphire Edge AI, Ryzen AI 9 HX 370: AMD Ryzen AI 9 HX 370, 0.4 kg
   » 蓝宝石 Edge AI 评测:搭载人工智能和 AMD Ryzen AI 9 HX 370 的迷你 PC 复出

Asus ROG Xbox Ally X: AMD Ryzen Z2 Extreme, 7.00", 0.7 kg
   » 微软全新 Xbox 全屏体验并未提高游戏性能

Minisforum N5 Pro: AMD Ryzen AI 9 HX PRO 370, 5 kg
   » Minisforum N5 Pro 评测--全球首款搭载 Ryzen AI 9 HX PRO 370 的人工智能 NAS,荣获 IFA 2025 大奖

Asus ROG Xbox Ally X: AMD Ryzen Z2 Extreme
   » 华硕 ROG Xbox Ally X 供应疲软,表明微软对掌上游戏机信心不足

   » 华硕 ROG Xbox Ally X:目前市场上最舒适的游戏掌上电脑

Tuxedo Infinity Book Pro 14 Gen10 AMD: AMD Ryzen AI 9 HX 370, 14.00", 1.5 kg
   » 快速的 AMD 处理器、高达 128 GB 的内存和 Linux - InfinityBook Pro 14 在我们的评测中给人留下了良好印象

Lenovo ThinkPad P14s Gen 6 21RV0017GE: AMD Ryzen AI 9 HX PRO 370, 14.00", 1.4 kg
   » 奇怪的分割:联想无缘无故从 Ryzen AI 9 ThinkPad 笔记本电脑中保留 2.8K OLED 屏幕

   » Ryzen 9 CPU 让这款联想 ThinkPad 脱颖而出:在所有 14 英寸 ThinkPad 笔记本电脑中,紧凑型移动工作站的 CPU 性能最高

ONEXPLAYER X1 Pro GA15H: AMD Ryzen AI 9 HX 370, 10.95", 0.9 kg
   » OneXplayer X1 Pro:打了类固醇的任天堂 Switch

Asus VivoBook S 14 OLED M5406WA: AMD Ryzen AI 9 HX 370, 14.00", 1.3 kg
   » 华硕 Vivobook S 16 (S5606CA) 发布,配备最新英特尔酷睿 Ultra 200H Arrow Lake 移动 CPU 和 Lumina OLED 显示屏

   » 华硕 Vivobook S 16 (M506KA) 和 Vivobook S 14 (M5406WA) 首次亮相,配备全新 AMD Krackan Point APU 和 OLED 显示屏

Asus ProArt P16 H7606WI: AMD Ryzen AI 9 HX 370
   » Strix Point APU 掌上电脑性能模拟:Ryzen AI 9 HX 370 在游戏中大放异彩,即使测试功耗仅为 17 W

Asus ProArt PX13 HN7306: AMD Ryzen AI 9 HX 370
   » Strix Point APU 掌上电脑性能模拟:Ryzen AI 9 HX 370 在游戏中大放异彩,即使测试功耗仅为 17 W

Asus Zenbook S 16 UM5606-RK333W: AMD Ryzen AI 9 HX 370, 16.00", 1.5 kg
   » Strix Point APU 掌上电脑性能模拟:Ryzen AI 9 HX 370 在游戏中大放异彩,即使测试功耗仅为 17 W

Please share our article, every link counts!
Mail Logo

» Comparison of GPUs
Detailed list of all laptop GPUs sorted by class and performance.

» Benchmark List
Sort and restrict laptop GPUs based on performance in synthetic benchmarks.

» Notebook Gaming List
Playable games for each graphics card and their average FPS results.

Class 1

Class 2

GeForce RTX 2080 Super Mobile
RTX PRO 2000 Blackwell Generation Laptop
M5 Max 32-Core GPU *
M1 Max 32-Core GPU *
M1 Max 24-Core GPU *
GeForce RTX 2070 Super Mobile
Radeon 8050S
Quadro RTX 5000 Max-Q
Radeon RX 5700M *
Quadro RTX 4000 (Laptop)
GeForce GTX 1080 Mobile
M1 Pro 16-Core GPU *
Radeon PRO W6600M *
GeForce RTX 2070 Super Max-Q
RTX PRO 1000 Blackwell Generation Laptop *
M1 Pro 14-Core GPU *
Quadro RTX 4000 Max-Q
Quadro P5200
Quadro RTX 3000 Max-Q
Quadro P4200
Radeon 8040S *
Pro A60M *

Class 3

Quadro P5000 Max-Q *
Quadro P4000
Arc 140T
Quadro P4000 Max-Q
Quadro P3200
Radeon RX 580X (Laptop) *
Radeon RX 580 (Laptop)
Pro A30M
Radeon Pro 5300M
Radeon RX 5300M
Quadro P3000 Max-Q *
Quadro T2000 Max-Q
Radeon RX 570X (Laptop) *
Radeon RX 570 (Laptop) *
Quadro T1000 Max-Q *
Vega M GH
GeForce GTX 1050 Ti Mobile
GeForce GTX 1050 Ti Max-Q
Radeon 680M
Quadro P2000
Quadro P2000 Max-Q
T500 Laptop GPU
Arc 130T
Radeon Pro Vega 16
WX Vega M GL
GeForce GTX 1050 Max-Q
Radeon 660M
Radeon Pro WX 4150 *
Radeon RX 560X (Laptop)
Radeon RX 560 (Laptop)
Quadro P1000
Xe MAX
Radeon Pro 560X
Radeon Pro 560
Quadro P620
Radeon RX 550X (Laptop)
Radeon Pro WX 3200 *
Radeon Pro 555X
Radeon Pro 555
Quadro P600
Graphics 3-Core iGPU (Arrow Lake) *
Radeon Pro WX 2100 *
Radeon Pro WX 3100 *
Graphics 2-Core iGPU (Arrow Lake) *
Radeon 630
Quadro P520
Radeon RX 540X *
Radeon 540X *
Quadro P500 *
Vega 10
Vega 9
Iris Plus Graphics G7 (Ice Lake 64 EU) *
UHD Graphics 32EUs
UHD Graphics 750
Vega 7
UHD Graphics Xe 32EUs (Tiger Lake-H)
UHD Graphics Xe G4 48EUs
Vega 8
UHD Graphics 730
Iris Plus Graphics G4 (Ice Lake 48 EU)
Iris Plus Graphics 650
Radeon 625
Vega 6 *
Iris Plus Graphics 640
UHD Graphics 24EUs (Alder Lake-N) *
GeForce 920M
Radeon 620
Radeon 610
Radeon 610M *
Vega 6 *
UHD Graphics Xe 16EUs (Tiger Lake-H) *
UHD Graphics G1 (Ice Lake 32 EU)
Adreno 690 *
Adreno 685 *
Adreno 680 *
GeForce 910M

Class 4

* Approximate position of the graphics adapter