


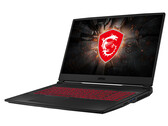
MSI GL75 Leopard笔记本电脑评测:成功的144Hz游戏本
通过GL75 Leopard,MSI拥有了其强大的17.3英寸游戏笔记本电脑,可将所有现代游戏流畅的运行在全高清显示屏(144 Hz,IPS)上。 设备的其余部分也没什么问题:16 GB内存(双通道模式),NVMe SSD和1 TB HDD。
Intel Core i7-10750H, NVIDIA GeForce RTX 2070 Mobile, 17.3", 2.6 kg用于笔记本电脑的NVIDIA GeForce RTX 2070是2019年初笔记本电脑上第二强的显卡。它基于台式机RTX 2070,但核心速度降低(-11%Boost,-14%Base)。内存的频率和大小似乎相似。RTX2070提供了2304个着色器和通过256位接口(14 GHz,448 GB / s)连接的8 GB GDDR6内存。
还计划推出更省电的“ Max-Q”版本,并进一步降低时钟速率。
特征
TU106芯片以12 nm FinFET工艺制造,并包括深度学习超级采样(DLSS)和实时光线追踪(RTRT)等功能,与基于Pascal架构的旧GPU相比,它们应结合起来可创造出更逼真的照光照效果(如果游戏支持)。 RTX 2070还支持DisplayPort 1.4,同时还支持HDMI 2.0b,HDR,同时多投影(SMP)和H.265视频编码/解码(PlayReady 3.0)。
性能
移动RTX 2070的性能应比台式机RTX 2070差一些,因此与旧GTX 1080相当。因此,它应该能够以很高画质在4k下运行所有硬件要求高的游戏。但是,光线追踪功能可能会大大降低帧率。
GeForce RTX 2000 Series
| ||||||||||||||||||||||||||||||||||||||||||||||||||||||||||
| Codename | N18E-G2 TU106 | |||||||||||||||||||||||||||||||||||||||||||||||||||||||||
| Architecture | Turing | |||||||||||||||||||||||||||||||||||||||||||||||||||||||||
| Pipelines | 2304 - unified | |||||||||||||||||||||||||||||||||||||||||||||||||||||||||
| Core Speed | 1215 - 1440 (Boost) MHz | |||||||||||||||||||||||||||||||||||||||||||||||||||||||||
| Memory Speed | 14000 MHz | |||||||||||||||||||||||||||||||||||||||||||||||||||||||||
| Memory Bus Width | 256 Bit | |||||||||||||||||||||||||||||||||||||||||||||||||||||||||
| Memory Type | GDDR6 | |||||||||||||||||||||||||||||||||||||||||||||||||||||||||
| Max. Amount of Memory | 8 GB | |||||||||||||||||||||||||||||||||||||||||||||||||||||||||
| Shared Memory | no | |||||||||||||||||||||||||||||||||||||||||||||||||||||||||
| API | DirectX 12_1, OpenGL 4.6 | |||||||||||||||||||||||||||||||||||||||||||||||||||||||||
| Power Consumption | 115 Watt | |||||||||||||||||||||||||||||||||||||||||||||||||||||||||
| Transistor Count | 10.8 Billion | |||||||||||||||||||||||||||||||||||||||||||||||||||||||||
| Man. Technology | 12 nm | |||||||||||||||||||||||||||||||||||||||||||||||||||||||||
| Features | DLSS, Raytraycing, VR Ready, G-SYNC, Vulkan, Multi Monitor, 550 Watt system power recommended | |||||||||||||||||||||||||||||||||||||||||||||||||||||||||
| Notebook Size | large | |||||||||||||||||||||||||||||||||||||||||||||||||||||||||
| Date of Announcement | 06.01.2019 | |||||||||||||||||||||||||||||||||||||||||||||||||||||||||
The following benchmarks stem from our benchmarks of review laptops. The performance depends on the used graphics memory, clock rate, processor, system settings, drivers, and operating systems. So the results don't have to be representative for all laptops with this GPU. For detailed information on the benchmark results, click on the fps number.


| low | med. | high | ultra | QHD | 4K | |
|---|---|---|---|---|---|---|
| F1 2021 | 150 | 139 | 82 | 63 | 34 | |
| Days Gone | 115 | 101 | 74.9 | 55.4 | 31.9 | |
| Mass Effect Legendary Edition | 116 | 112 | 106 | 74 | ||
| Resident Evil Village | 126 | 126 | 110 | |||
| Outriders | 106 | 94.3 | 81.7 | 60.5 | 32.8 | |
| Hitman 3 | 136 | 124 | 113 | 77.1 | 41.4 | |
| Cyberpunk 2077 1.0 | 75.8 | 61.9 | 52.9 | 34.5 | 16.3 | |
| Immortals Fenyx Rising | 82 | 72 | 67 | 55 | 36 | |
| Yakuza Like a Dragon | 100 | 95.6 | 80.3 | 55.5 | 28.6 | |
| Call of Duty Black Ops Cold War | 94.9 | 80.7 | 72.5 | 51.7 | 27.7 | |
| Assassin´s Creed Valhalla | 81 | 69 | 59 | 47 | 28 | |
| Dirt 5 | 88.2 | 69.4 | 41.3 | 35.3 | 26.3 | |
| Watch Dogs Legion | 93.1 | 81.6 | 56.1 | 41.6 | 23.4 | |
| FIFA 21 | 225 | 223 | 211 | 210 | 206 | 173 |
| Star Wars Squadrons | 265 | 234 | 228 | 214 | 140 | 78 |
| Mafia Definitive Edition | 133 | 98.1 | 89.6 | 60.5 | 30.6 | |
| Serious Sam 4 | 119 | 73.9 | 71.4 | 61.3 | 54.5 | |
| Crysis Remastered | 133 | 70.8 | 50.2 | 32.6 | 20.3 | |
| Flight Simulator 2020 | 70.6 | 60.1 | 48.9 | 35.3 | 26.8 | 16.3 |
| Horizon Zero Dawn | 131 | 100 | 85 | 67 | 51 | 29 |
| Death Stranding | 153 | 126 | 115 | 113 | 78.8 | 42.6 |
| F1 2020 | 206 | 166 | 147 | 114 | 87 | 50 |
| Valorant | 237 | 234 | 230 | 229 | 202 | |
| Gears Tactics | 237 | 176 | 121 | 87 | 59.9 | 31.6 |
| Doom Eternal | 238 | 170 | 156 | 152 | 104 | 54.7 |
| Hunt Showdown | 195 | 124 | 103 | 65.8 | 31.3 | |
| Escape from Tarkov | 121 | 121 | 120 | 111 | 78.8 | 37.8 |
| Red Dead Redemption 2 | 122 | 98 | 67 | 43 | 35 | 22.9 |
| Star Wars Jedi Fallen Order | 106 | 95 | 92 | 73.4 | 37.3 | |
| Need for Speed Heat | 104 | 94.2 | 86 | 78 | 63.9 | 37.5 |
| Call of Duty Modern Warfare 2019 | 199 | 132 | 122 | 99 | 75.4 | 42.5 |
| GRID 2019 | 187 | 152 | 114 | 79 | 66 | 39.3 |
| Ghost Recon Breakpoint | 122 | 106 | 94 | 69 | 52 | 29 |
| FIFA 20 | 265 | 260 | 215 | 214 | 231 | 179 |
| Borderlands 3 | 110 | 97 | 78 | 63 | 45.1 | 24.2 |
| Control | 185 | 93 | 69 | 46.9 | 23 | |
| F1 2019 | 214 | 182 | 151 | 109 | 90 | 58 |
| Total War: Three Kingdoms | 232.7 | 129.9 | 88.5 | 63.1 | ||
| Rage 2 | 180 | 122 | 103 | 101 | ||
| Anno 1800 | 73 | 40 | ||||
| The Division 2 | 121 | 112 | 96 | 77 | 60 | 33 |
| Dirt Rally 2.0 | 143 | 119 | 75 | 62.1 | ||
| Anthem | 88.8 | 85 | 79 | 62 | 35.5 | |
| Far Cry New Dawn | 94 | 92 | 83 | 74 | 42 | |
| Metro Exodus | 95 | 86 | 66 | 54 | 42 | 26.1 |
| Apex Legends | 143 | 131 | 129 | 88.2 | 45.4 | |
| Just Cause 4 | 169.5 | 127 | 97 | 90 | 63.6 | 36.3 |
| Darksiders III | 169.2 | 122 | 109 | 101 | 76.7 | 37.8 |
| Battlefield V | 111.6 | 120 | 116 | 106 | 91.7 | 52.1 |
| Farming Simulator 19 | 194 | 162 | 141 | 104 | ||
| Hitman 2 | 94.5 | 86.1 | 83.3 | 72.4 | 37.9 | |
| Call of Duty Black Ops 4 | 142 | 135 | 119 | 77.9 | 39.2 | |
| Assassin´s Creed Odyssey | 100 | 84 | 58 | 48 | 31 | |
| Forza Horizon 4 | 137 | 113 | 112 | 94 | ||
| FIFA 19 | 382 | 287 | 279 | 277 | 160 | |
| Shadow of the Tomb Raider | 124 | 100 | 96 | 89 | 58 | 33 |
| Strange Brigade | 313 | 183 | 149 | 125 | ||
| F1 2018 | 186 | 152 | 103 | 84 | 51 | |
| Monster Hunter World | 117 | 103 | 81 | 51.9 | 25.1 | |
| The Crew 2 | 60 | 60 | 60 | 60 | 38.8 | |
| Far Cry 5 | 147 | 122 | 113 | 106 | 76 | 40 |
| X-Plane 11.11 | 108 | 95 | 80 | |||
| Kingdom Come: Deliverance | 125 | 97.3 | 73.2 | 52.4 | 26.2 | |
| Final Fantasy XV Benchmark | 155 | 103 | 79 | 32.2 | ||
| Fortnite | 236 | 188 | 149 | 141 | 93.5 | 45.5 |
| Star Wars Battlefront 2 | 163 | 140 | 106 | 75.3 | 39.8 | |
| Need for Speed Payback | 157 | 141 | 135 | 90.1 | 48 | |
| Assassin´s Creed Origins | 84 | 72 | 71 | 64 | ||
| Destiny 2 | 206.1 | 181.2 | 169.5 | 144.5 | ||
| ELEX | 121 | 119 | 94.1 | 62.7 | 33.1 | |
| Middle-earth: Shadow of War | 161 | 127 | 96 | 39 | ||
| Playerunknown's Battlegrounds (PUBG) | 196 | 173 | 130 | 46.3 | ||
| Dirt 4 | 242 | 175 | 104 | |||
| Rocket League | 249 | 247 | 118 | |||
| Prey | 143 | 140 | 139 | 62.8 | ||
| Ghost Recon Wildlands | 106 | 98.9 | 56.8 | 39.1 | ||
| For Honor | 164 | 156 | 118 | 50.6 | ||
| Resident Evil 7 | 349 | 194 | 162 | 55.8 | ||
| Dishonored 2 | 117 | 105 | 53.3 | |||
| Battlefield 1 | 165.4 | 141.5 | 120.6 | 113.3 | ||
| Civilization 6 | 224.1 | 163.6 | 129.8 | 121.1 | ||
| Deus Ex Mankind Divided | 103 | 59.8 | 36.9 | |||
| Mirror's Edge Catalyst | 131 | 120 | 45.5 | |||
| Overwatch | 291 | 184 | 101 | |||
| Doom | 184 | 159 | 67.4 | |||
| Ashes of the Singularity | 112.4 | 102 | 98.6 | |||
| The Division | 118 | 93.1 | 46.3 | |||
| Rise of the Tomb Raider | 190 | 154 | 126 | 109 | ||
| Rainbow Six Siege | 234 | 216 | 93.3 | |||
| Dota 2 Reborn | 144 | 131 | 122 | 116 | ||
| Batman: Arkham Knight | 214 | 202 | 159 | 108 | ||
| The Witcher 3 | 290 | 222 | 140 | 74 | 52 | |
| Dirt Rally | 254.5 | 160.6 | 199.7 | 113.6 | ||
| GTA V | 173 | 166 | 145 | 80 | ||
| BioShock Infinite | 339 | 298 | 276 | 167 | ||
| low | med. | high | ultra | QHD | 4K | < 30 fps < 60 fps < 120 fps ≥ 120 fps | 10 39 | 34 52 | 1 50 43 | 12 55 20 | 1 21 33 5 | 16 46 7 4 |
For more games that might be playable and a list of all games and graphics cards visit our Gaming List


MSI GE75 Raider 10SF-286: Intel Core i7-10875H, 17.30", 2.6 kg
External Review » MSI GE75 Raider 10SF-286
MSI GE66 Raider 10SF: Intel Core i7-10870H, 15.60", 2.4 kg
External Review » MSI GE66 Raider 10SF
MSI GL65 Leopard 10SFK-062: Intel Core i7-10750H, 15.60", 2.3 kg
External Review » MSI GL65 Leopard 10SFK-062
Asus Zephyrus S17 GX701LWS-EV029T: Intel Core i7-10750H, 17.30", 2.6 kg
External Review » Asus Zephyrus S17 GX701LWS-EV029T
Asus ROG Strix G15 G512LW: Intel Core i7-10750H, 15.60", 2.3 kg
External Review » Asus ROG Strix G15 G512LW
Dell G5 15 5500, i7-10750H RTX 2070: Intel Core i7-10750H, 15.60", 2.4 kg
External Review » Dell G5 15 5500, i7-10750H RTX 2070
HP Omen 15-dh1020tx: Intel Core i7-10750H, 15.60", 2.4 kg
External Review » HP Omen 15-dh1020tx
MSI GL65 Leopard 10SFR-483XES: Intel Core i7-10750H, 15.60", 2.4 kg
External Review » MSI GL65 Leopard 10SFR-483XES
Acer Predator Triton 300 PT315-52-73S0: Intel Core i7-10750H, 15.60", 2 kg
External Review » Acer Predator Triton 300 PT315-52-73S0
Asus ROG Strix G15 G512LW-HN069: Intel Core i7-10750H, 15.60", 2.4 kg
External Review » Asus ROG Strix G15 G512LW-HN069
MSI GP65 Leopard 10SFK-495XES: Intel Core i7-10750H, 15.60"
External Review » MSI GP65 Leopard 10SFK-495XES
Acer Predator Helios 300 PH317-54-77RQ: Intel Core i7-10750H, 17.30", 2.9 kg
External Review » Acer Predator Helios 300 PH317-54-77RQ
MSI GE66 Raider 10SF-056XES: Intel Core i7-10750H, 15.60"
External Review » MSI GE66 Raider 10SF-056XES
MSI GL75 10SFK-060XES: Intel Core i7-10750H, 17.30", 2.6 kg
External Review » MSI GL75 10SFK-060XES
HP Omen 15-dc1016no: Intel Core i7-8750H, 15.60", 2.4 kg
External Review » HP Omen 15-dc1016no
Alienware m15 R3 P87F: Intel Core i7-10750H, 15.60", 2.3 kg
External Review » Alienware m15 R3 P87F
MSI GL75 10SFR-221 Leopard: Intel Core i7-10750H, 17.30", 2.6 kg
External Review » MSI GL75 10SFR-221 Leopard
Asus Strix G17 G712LW-EV251T: Intel Core i7-10750H, 17.30", 2.9 kg
External Review » Asus Strix G17 G712LW-EV251T
Asus Strix Scar 17 G732LW-EV050T: Intel Core i7-10875H, 17.30", 2.9 kg
External Review » Asus Strix Scar 17 G732LW-EV050T
Asus Strix Scar 15 G532LW-AZ056T: Intel Core i7-10875H, 15.60", 2.6 kg
External Review » Asus Strix Scar 15 G532LW-AZ056T
MSI GE65 Raider 9SF-003ES: Intel Core i7-9750H, 15.60", 2.3 kg
External Review » MSI GE65 Raider 9SF-003ES
MSI GL75 9SFK-1248: Intel Core i7-9750H, 17.30", 2.5 kg
External Review » MSI GL75 9SFK-1248
MSI GP65 10SFK-047US: Intel Core i7-10750H, 15.60", 2.3 kg
External Review » MSI GP65 10SFK-047US
MSI GE63 Raider RGB 8SF-031XES: Intel Core i7-8750H, 15.60", 2.4 kg
External Review » MSI GE63 Raider RGB 8SF-031XES
Asus ROG Zephyrus M15 GU502LW-HC130T: Intel Core i7-10750H, 15.60", 2 kg
External Review » Asus ROG Zephyrus M GU502LW-HC130T
Origin PC Eon15-X 2020, R9 3900, RTX 2070: AMD Ryzen 9 3900, 15.60", 2.7 kg
External Review » Origin PC Eon15-X 2020, R9 3900, RTX 2070
Schenker XMG Apex 15 Ryzen 9 3950X, RTX 2070: AMD Ryzen 9 3950X, 15.60", 2.6 kg
External Review » Schenker XMG Apex 15 Ryzen 9 3950X, RTX 2070
Asus Strix G15 G512LW-HN038: Intel Core i7-10750H, 15.60", 2.4 kg
External Review » Asus Strix G15 G512LW-HN038
Acer Predator Helios 300 PH317-53-750A: Intel Core i7-9750H, 17.30", 2.9 kg
External Review » Acer Predator Helios 300 PH317-53-750A
MSI GE65 Raider 9SF-049US: Intel Core i9-9880H, 15.60", 2.3 kg
External Review » MSI GE65 Raider 9SF-049US
Acer Predator Helios 700 PH717-71-914K: Intel Core i9-9980HK, 17.30", 4.5 kg
External Review » Acer Predator Helios 700 PH717-71-914K
Asus ROG Strix G531GW-AL137: Intel Core i7-9750H, 15.60", 2.4 kg
External Review » Asus ROG Strix G531GW-AL137
Asus ROG Zephyrus S GX701GWR-H6089R: Intel Core i7-9750H, 17.30", 2.7 kg
External Review » Asus ROG Zephyrus S GX701GWR-H6089R
Asus ROG Zephyrus S GX502GW-AZ064T: Intel Core i7-9750H, 15.60", 2 kg
External Review » Asus ROG Zephyrus S GX502GW-AZ064T
Acer Predator Helios 700 PH717-71-95MA: Intel Core i9-9980HK, 17.30", 4.9 kg
External Review » Acer Predator Helios 700 PH717-71-95MA
Asus ROG Strix Scar III G531GW-AZ150T: Intel Core i9-9880H, 15.60", 2.6 kg
External Review » Asus ROG Strix Scar III G531GW-AZ150T
MSI GL65 9SFK-286XES: Intel Core i7-9750H, 15.60", 2.3 kg
External Review » MSI GL65 9SFK-286XES
HP Omen 15-dh0022nf : Intel Core i7-9750H, 15.60", 2.6 kg
External Review » HP Omen 15-dh0022nf
Asus ROG Strix G731GW-EV010T : Intel Core i7-9750H, 17.30", 2.9 kg
External Review » Asus ROG Strix G731GW-EV010T
MSI GE65 Raider 9SF-006: Intel Core i7-9750H, 15.60", 2.3 kg
External Review » MSI GE65 Raider 9SF-006
HP Omen 17-cb0040nr: Intel Core i7-9750H, 17.30", 3.3 kg
External Review » HP Omen 17-cb0040nr
Asus ROG Zephyrus S GX502GW-ES004T: Intel Core i7-9750H, 15.60", 2 kg
External Review » Asus ROG Zephyrus S GX502GW-ES004T
MSI GE75 Raider 8SF-032ES: Intel Core i7-8750H, 17.30", 2.7 kg
External Review » MSI GE75 Raider 8SF-032ES
Acer Predator Helios 700 PH717-71-7091: Intel Core i7-9750H, 17.30", 4.5 kg
External Review » Acer Predator Helios 700 PH717-71-7091
HP Omen 17-cb0006ng: Intel Core i7-9750H, 17.30", 3.3 kg
External Review » HP Omen 17-cb0006ng
MSI GT76 9SF-013: Intel Core i7-9750H, 17.30", 4.5 kg
External Review » MSI GT76 9SF-013
MSI GP75 Leopard 9SF-1037XES: Intel Core i7-9750H, 17.30", 2.6 kg
External Review » MSI GP75 Leopard 9SF-1037XES
Asus ASUS ROG Strix SCAR III G731GW-XB74: Intel Core i7-9750H, 17.30", 2.9 kg
External Review » Asus ASUS ROG Strix SCAR III G731GW-XB74
MSI GE65 9SF-006: Intel Core i9-9880H, 15.60", 2.3 kg
External Review » MSI GE65 9SF-006
Asus Zephyrus S GX701GW-EV047R: Intel Core i7-8750H, 17.30", 2.7 kg
External Review » Asus Zephyrus S GX701GW-EV047R
Acer Predator Helios 300 PH317-53-75YB: Intel Core i7-9750H, 17.30", 2.9 kg
External Review » Acer Predator Helios 300 PH317-53-75YB
Asus Strix Scar 3 G531GW-DB76: Intel Core i7-9750H, 15.60", 2.6 kg
External Review » Asus Strix Scar 3 G531GW-DB76
Asus ROG Strix HERO III G531GW-ES013T: Intel Core i7-9750H, 15.60", 2.4 kg
External Review » Asus ROG Strix HERO III G531GW-ES013T
HP Omen 15-dc1001ns: Intel Core i7-8750H, 15.60", 2.5 kg
External Review » HP OMEN 15-dc1001ns
Asus ROG Strix Scar III G531GW-AZ015T: Intel Core i7-9750H, 15.60", 2.6 kg
External Review » Asus ROG Strix Scar III G531GW-AZ015T
Asus ROG Strix G531GW-AL023T: Intel Core i7-9750H, 15.60", 2.6 kg
External Review » Asus ROG Strix G531GW-AL023T
Asus ROG Zephyrus S GX502GW-ES002: Intel Core i7-9750H, 15.60", 2 kg
External Review » Asus ROG Zephyrus S GX502GW-ES002
MSI GE75 Raider 049-HID4-US: Intel Core i7-8750H, 17.30", 2.6 kg
External Review » MSI GE75 Raider 049-HID4-US
Schenker XMG Pro 17-M19msb: Intel Core i7-9750H, 17.30", 2.9 kg
External Review » Schenker XMG Pro 17-M19msb
Acer Predator Helios 300 PH317-53-79S0: Intel Core i7-9750H, 17.30", 2.9 kg
External Review » Acer Predator Helios 300 PH317-53-79S0
BTO Notebooks X-Book 15X990: Intel Core i9-9980HK, 15.60", 2.4 kg
External Review » BTO Notebooks X-Book 15X990
Asus ROG Zephyrus S GX502GW-ES010T: Intel Core i7-9750H, 15.60", 2 kg
External Review » Asus ROG Zephyrus S GX502GW-ES010T
Medion Erazer X17805-MD61499: Intel Core i7-9750H, 17.30", 2.6 kg
External Review » Medion Erazer X17805-MD61499
Asus Zephyrus S GX701GWR-EV021R: Intel Core i7-8750H, 17.30", 2.7 kg
External Review » Asus Zephyrus S GX701GWR-EV021R
Asus ROG Strix Scar III G531GW-ES081T: Intel Core i7-9750H, 15.60", 2.6 kg
External Review » Asus ROG Strix Scar III G531GW-ES081T
MSI GE65 Raider-9SF, i7-8750H: Intel Core i7-8750H, 15.60", 2.3 kg
External Review » MSI GE65 Raider-9SF, i7-8750H
Asus Strix Scar III G531GW: Intel Core i9-9880H, 15.60", 2.3 kg
External Review » Asus Strix Scar III G531GW
HP Omen 17-cb0005ng: Intel Core i7-9750H, 17.30", 3.3 kg
External Review » HP Omen 17-cb0005ng
MSI GS75 Stealth 8SF-099FR: Intel Core i7-8750H, 17.30", 2.3 kg
External Review » MSI GS75 Stealth 8SF-099FR
BTO Notebooks X-Book 17X882: Intel Core i7-8750H, 17.30", 2.6 kg
External Review » BTO Notebooks X-Book 17X882
Asus ROG Strix Scar II GL504GW-ES043: Intel Core i7-8750H, 15.60", 2.4 kg
External Review » Asus ROG Strix Scar II GL504GW-ES043
MSI GS75 Stealth 8SF-099EN: Intel Core i7-8750H, 17.30", 2.3 kg
External Review » MSI GS75 Stealth 8SF-099EN
Aorus 15 X9: Intel Core i7-8750H, 15.60", 2.4 kg
External Review » Aorus 15 X9
Aorus 15-XA-F74CDW: Intel Core i7-9750H, 15.60", 2.4 kg
External Review » Aorus 15-XA-F74CDW
Asus Zephyrus S GX502GW: Intel Core i7-9750H, 15.60", 2.1 kg
External Review » Asus Zephyrus S GX502GW
Asus Strix Scar III G531GW-AZ062T: Intel Core i7-9750H, 15.60", 2.4 kg
External Review » Asus Strix Scar III G531GW-AZ062T
Asus Zephyrus S GX502GW-ES006R: Intel Core i7-9750H, 15.60", 2 kg
External Review » Asus Zephyrus S GX502GW-ES006R
Asus ROG Strix Scar II GL704GW: Intel Core i7-8750H, 17.30", 2.9 kg
External Review » Asus ROG Strix Scar II GL704GW
MSI GE75 8SF: Intel Core i7-8750H, 17.30", 2.6 kg
External Review » MSI GE75 8SF
Asus ROG Strix Scar II GL704GW-EV042T: Intel Core i7-8750H, 17.00", 2.9 kg
External Review » Asus ROG Strix Scar II GL704GW-EV042T
MSI GE75 Raider 8SF-033XES: Intel Core i7-8750H, 17.30", 2.7 kg
External Review » MSI GE75 Raider 8SF-033XES
Asus Zephyrus S GX735GW-EV005T: Intel Core i7-8750H, 17.30", 2.7 kg
External Review » Asus Zephyrus S GX735GW-EV005T
Asus ROG Strix Scar II GL504GW-ES012T: Intel Core i7-8750H, 15.60", 2.4 kg
External Review » Asus ROG Strix Scar II GL504GW-ES012T
Asus Strix GL504GW-DS74: Intel Core i7-8750H, 15.60", 2.5 kg
External Review » Asus Strix GL504GW-DS74
Asus ROG Strix Scar II GL704GW-EV005T: Intel Core i7-8750H, 17.30", 2.9 kg
External Review » Asus ROG Strix Scar II GL704GW-EV005T
» Comparison of GPUs
Detailed list of all laptop GPUs sorted by class and performance.
» Benchmark List
Sort and restrict laptop GPUs based on performance in synthetic benchmarks.
» Notebook Gaming List
Playable games for each graphics card and their average FPS results.
* Approximate position of the graphics adapter
» Notebookcheck多媒体笔记本电脑Top 10排名
» Notebookcheck游戏笔记本电脑Top 10排名
» Notebookcheck低价办公/商务笔记本电脑Top 10排名
» Notebookcheck高端办公/商务笔记本电脑Top 10排名
» Notebookcheck工作站笔记本电脑Top 10排名
» Notebookcheck亚笔记本电脑Top 10排名
» Notebookcheck超级本产品Top 10排名
» Notebookcheck变形本产品Top 10排名
» Notebookcheck平板电脑Top 10排名
» Notebookcheck智能手机Top 10排名
» Notebookcheck评测过最出色的笔记本电脑屏幕
» Notebookcheck售价500欧元以下笔记本电脑Top 10排名
» Notebookcheck售价300欧元以下笔记本电脑Top 10排名