华硕Zenbook S 13 OLED 2023评测--全球最轻薄的OLED超极本与恼人的粉丝斗争
华硕对其紧凑的13英寸ZenBook S 13超极本进行了彻底改造,主要集中在为市场带来一个更轻更薄的设备。根据营销材料,这甚至是世界上最薄的13.3英寸OLED超极本。在这次重新设计中,制造商还决定用英特尔目前的Raptor Lake芯片取代去年模型中非常好的AMD处理器。当然,我们将评估这是否是正确的决定。
我们的Zenbook S 13 OLED的测试单元再次配备了16:10格式的13.3英寸OLED面板。此外,还有一个英特尔酷睿i7-1355U,16GB内存,以及一个大的1TB PCIe 4.0固态硬盘,建议零售价为1499欧元(约1657美元)。但我们也有一个好消息给去年的Zenbook S 13的粉丝 去年的Zenbook S 13的粉丝来说也是一个好消息,因为它也将采用AMD的Zen4 CPU进行更新。
潜在的竞争对手比较
Rating | Date | Model | Weight | Height | Size | Resolution | Price |
|---|---|---|---|---|---|---|---|
| 85.4 % v7 (old) | 05 / 2023 | Asus ZenBook S13 OLED UX5304 i7-1355U, Iris Xe G7 96EUs | 1 kg | 11.8 mm | 13.30" | 2880x1800 | |
| 90.1 % v7 (old) | 07 / 2022 | Asus Zenbook S 13 OLED R7 6800U, Radeon 680M | 1.1 kg | 14.9 mm | 13.30" | 2880x1800 | |
| 92 % v7 (old) | 08 / 2022 | Apple MacBook Air M2 10C GPU M2, M2 10-Core GPU | 1.2 kg | 11.3 mm | 13.60" | 2560x1664 | |
| 86.4 % v7 (old) | 10 / 2022 | Lenovo Yoga Slim 7 Carbon 13IAP7-82U9005FGE i7-1260P, Iris Xe G7 96EUs | 986 g | 14.8 mm | 13.30" | 2560x1600 | |
| 87.3 % v7 (old) | 09 / 2022 | Dell XPS 13 Plus 9320 i7-1280P OLED i7-1280P, Iris Xe G7 96EUs | 1.3 kg | 15.28 mm | 13.40" | 3456x2160 | |
| 86.7 % v7 (old) | 05 / 2022 | Samsung Galaxy Book2 Pro 13 NP930XED-KA1DE i5-1240P, Iris Xe G7 80EUs | 885 g | 11 mm | 13.30" | 1920x1080 |
外壳 - 华硕使用等离子陶瓷涂层
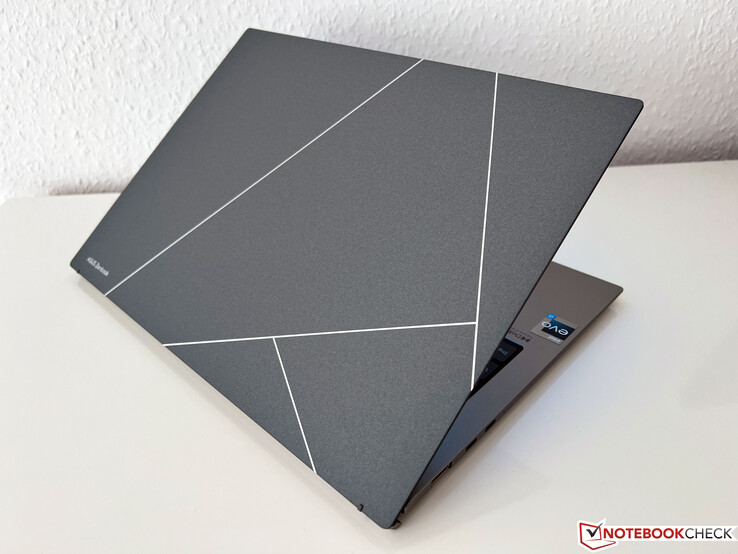
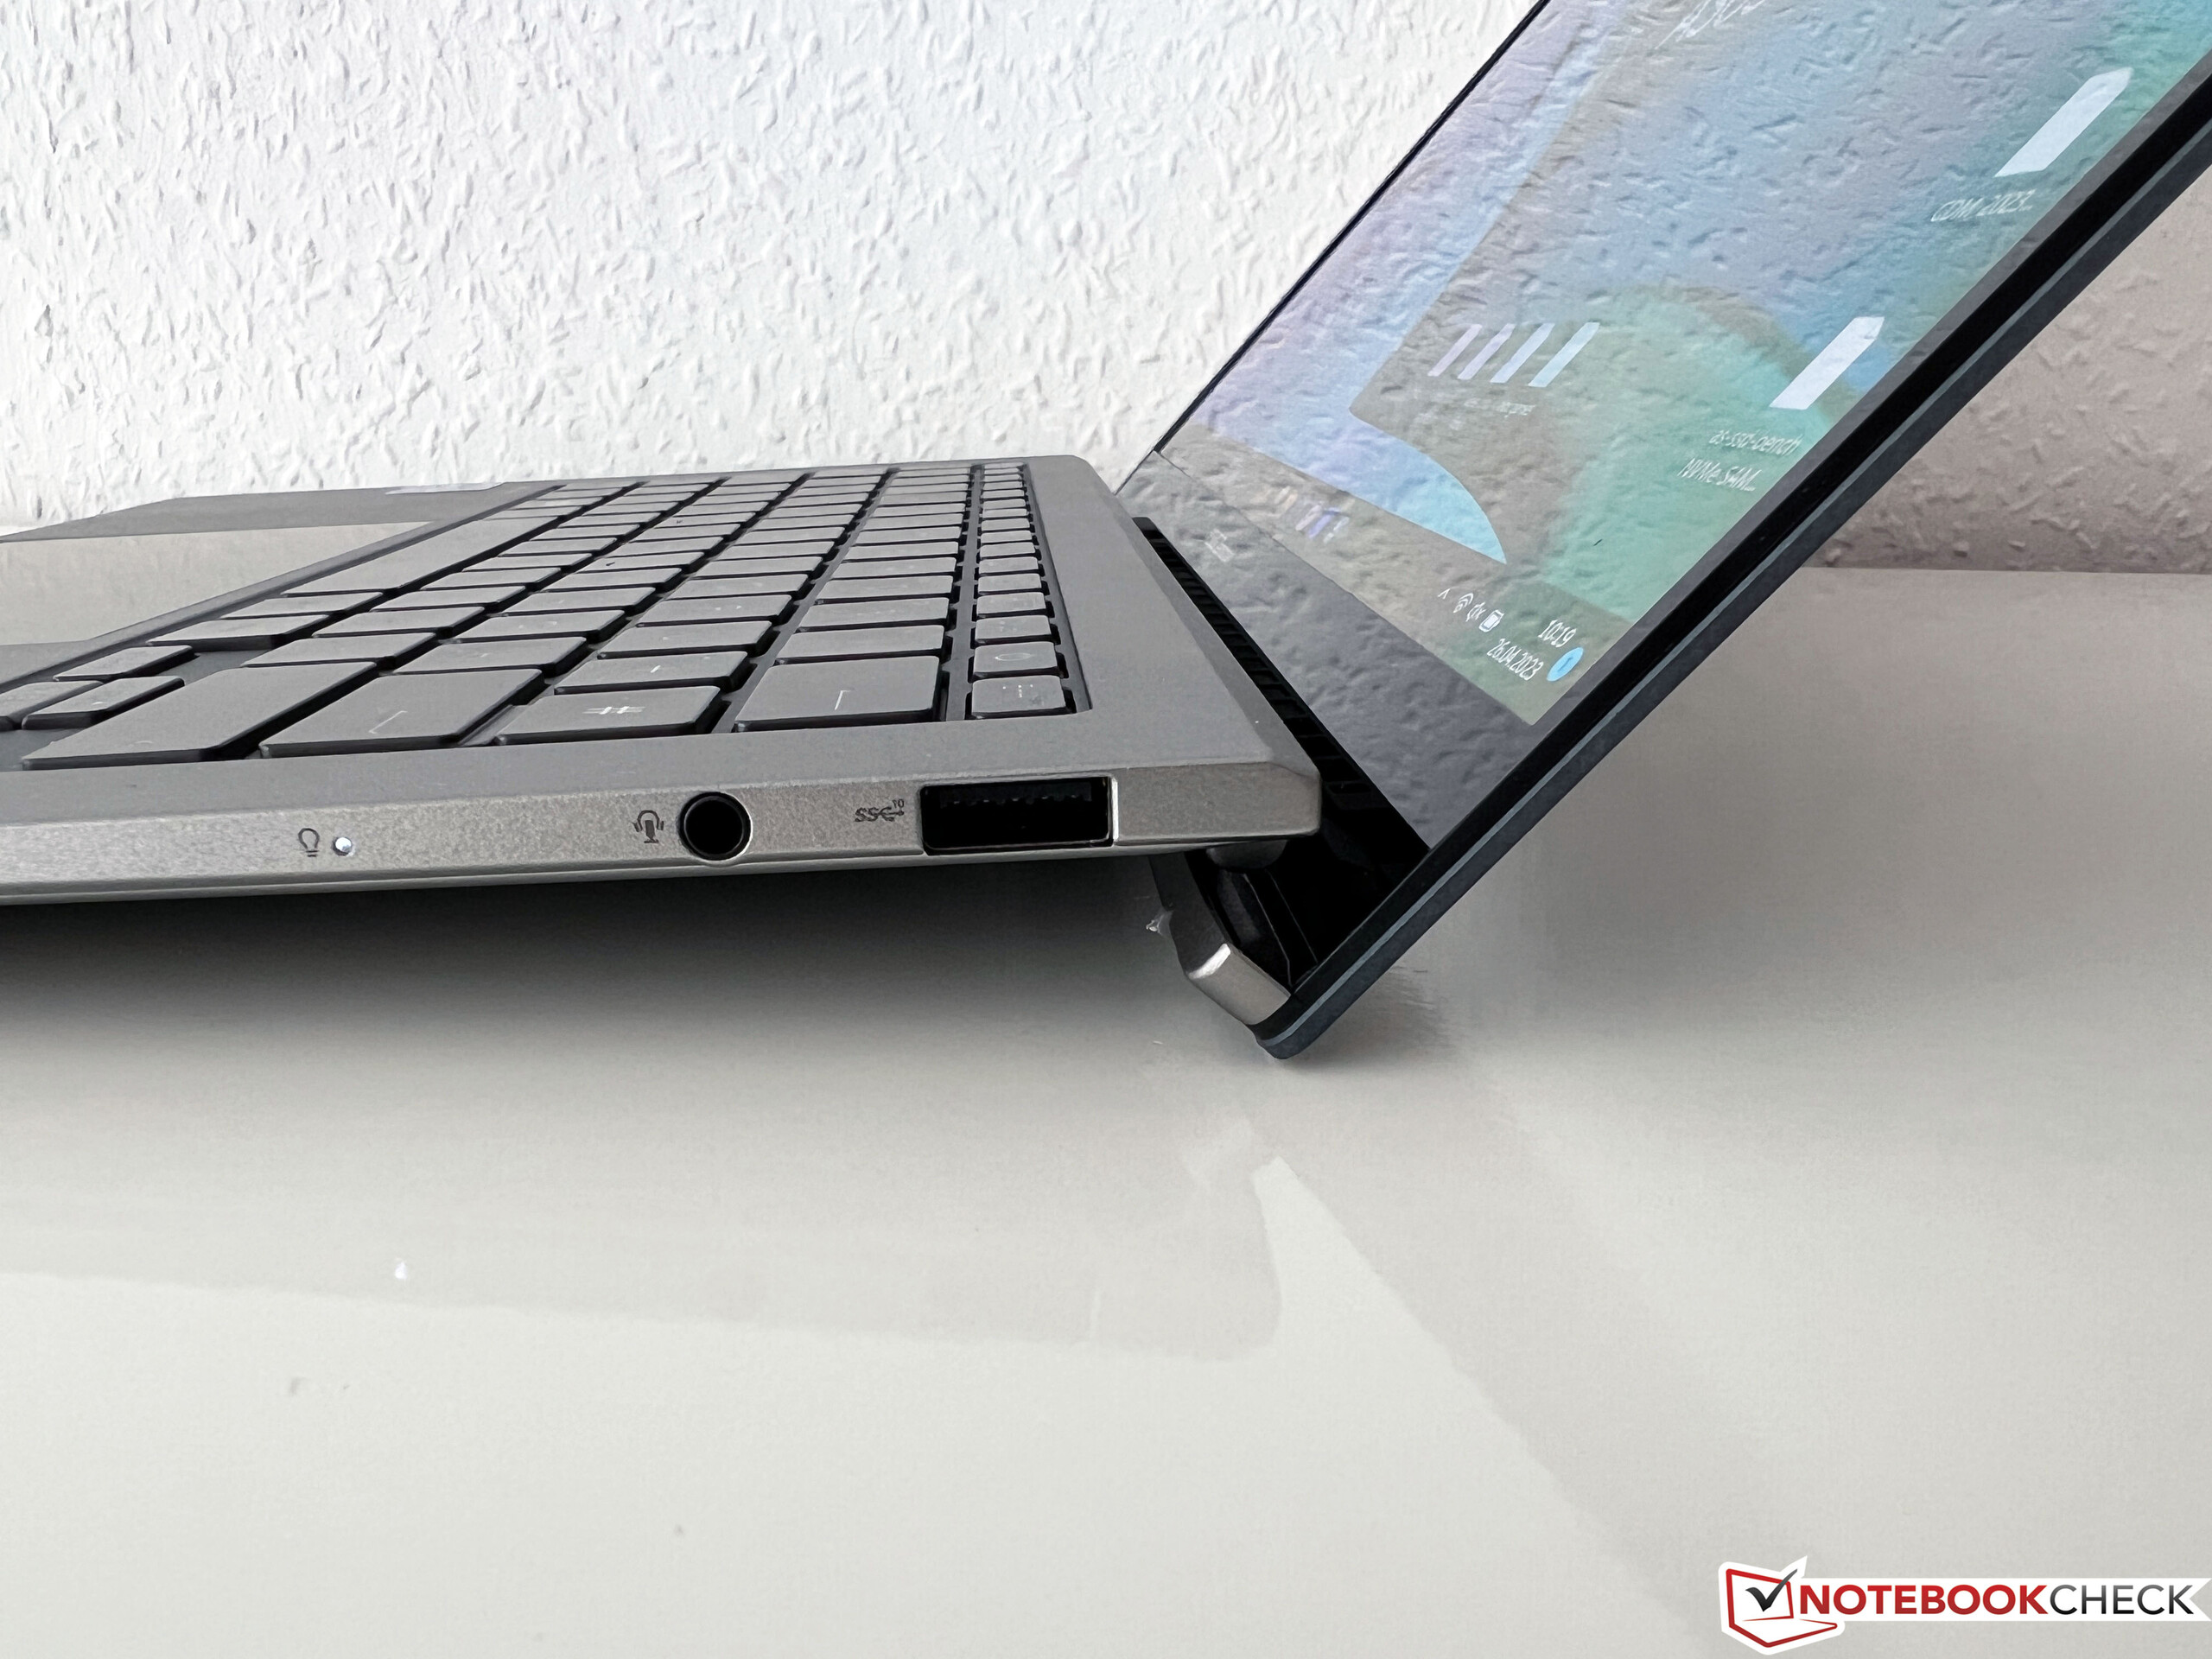
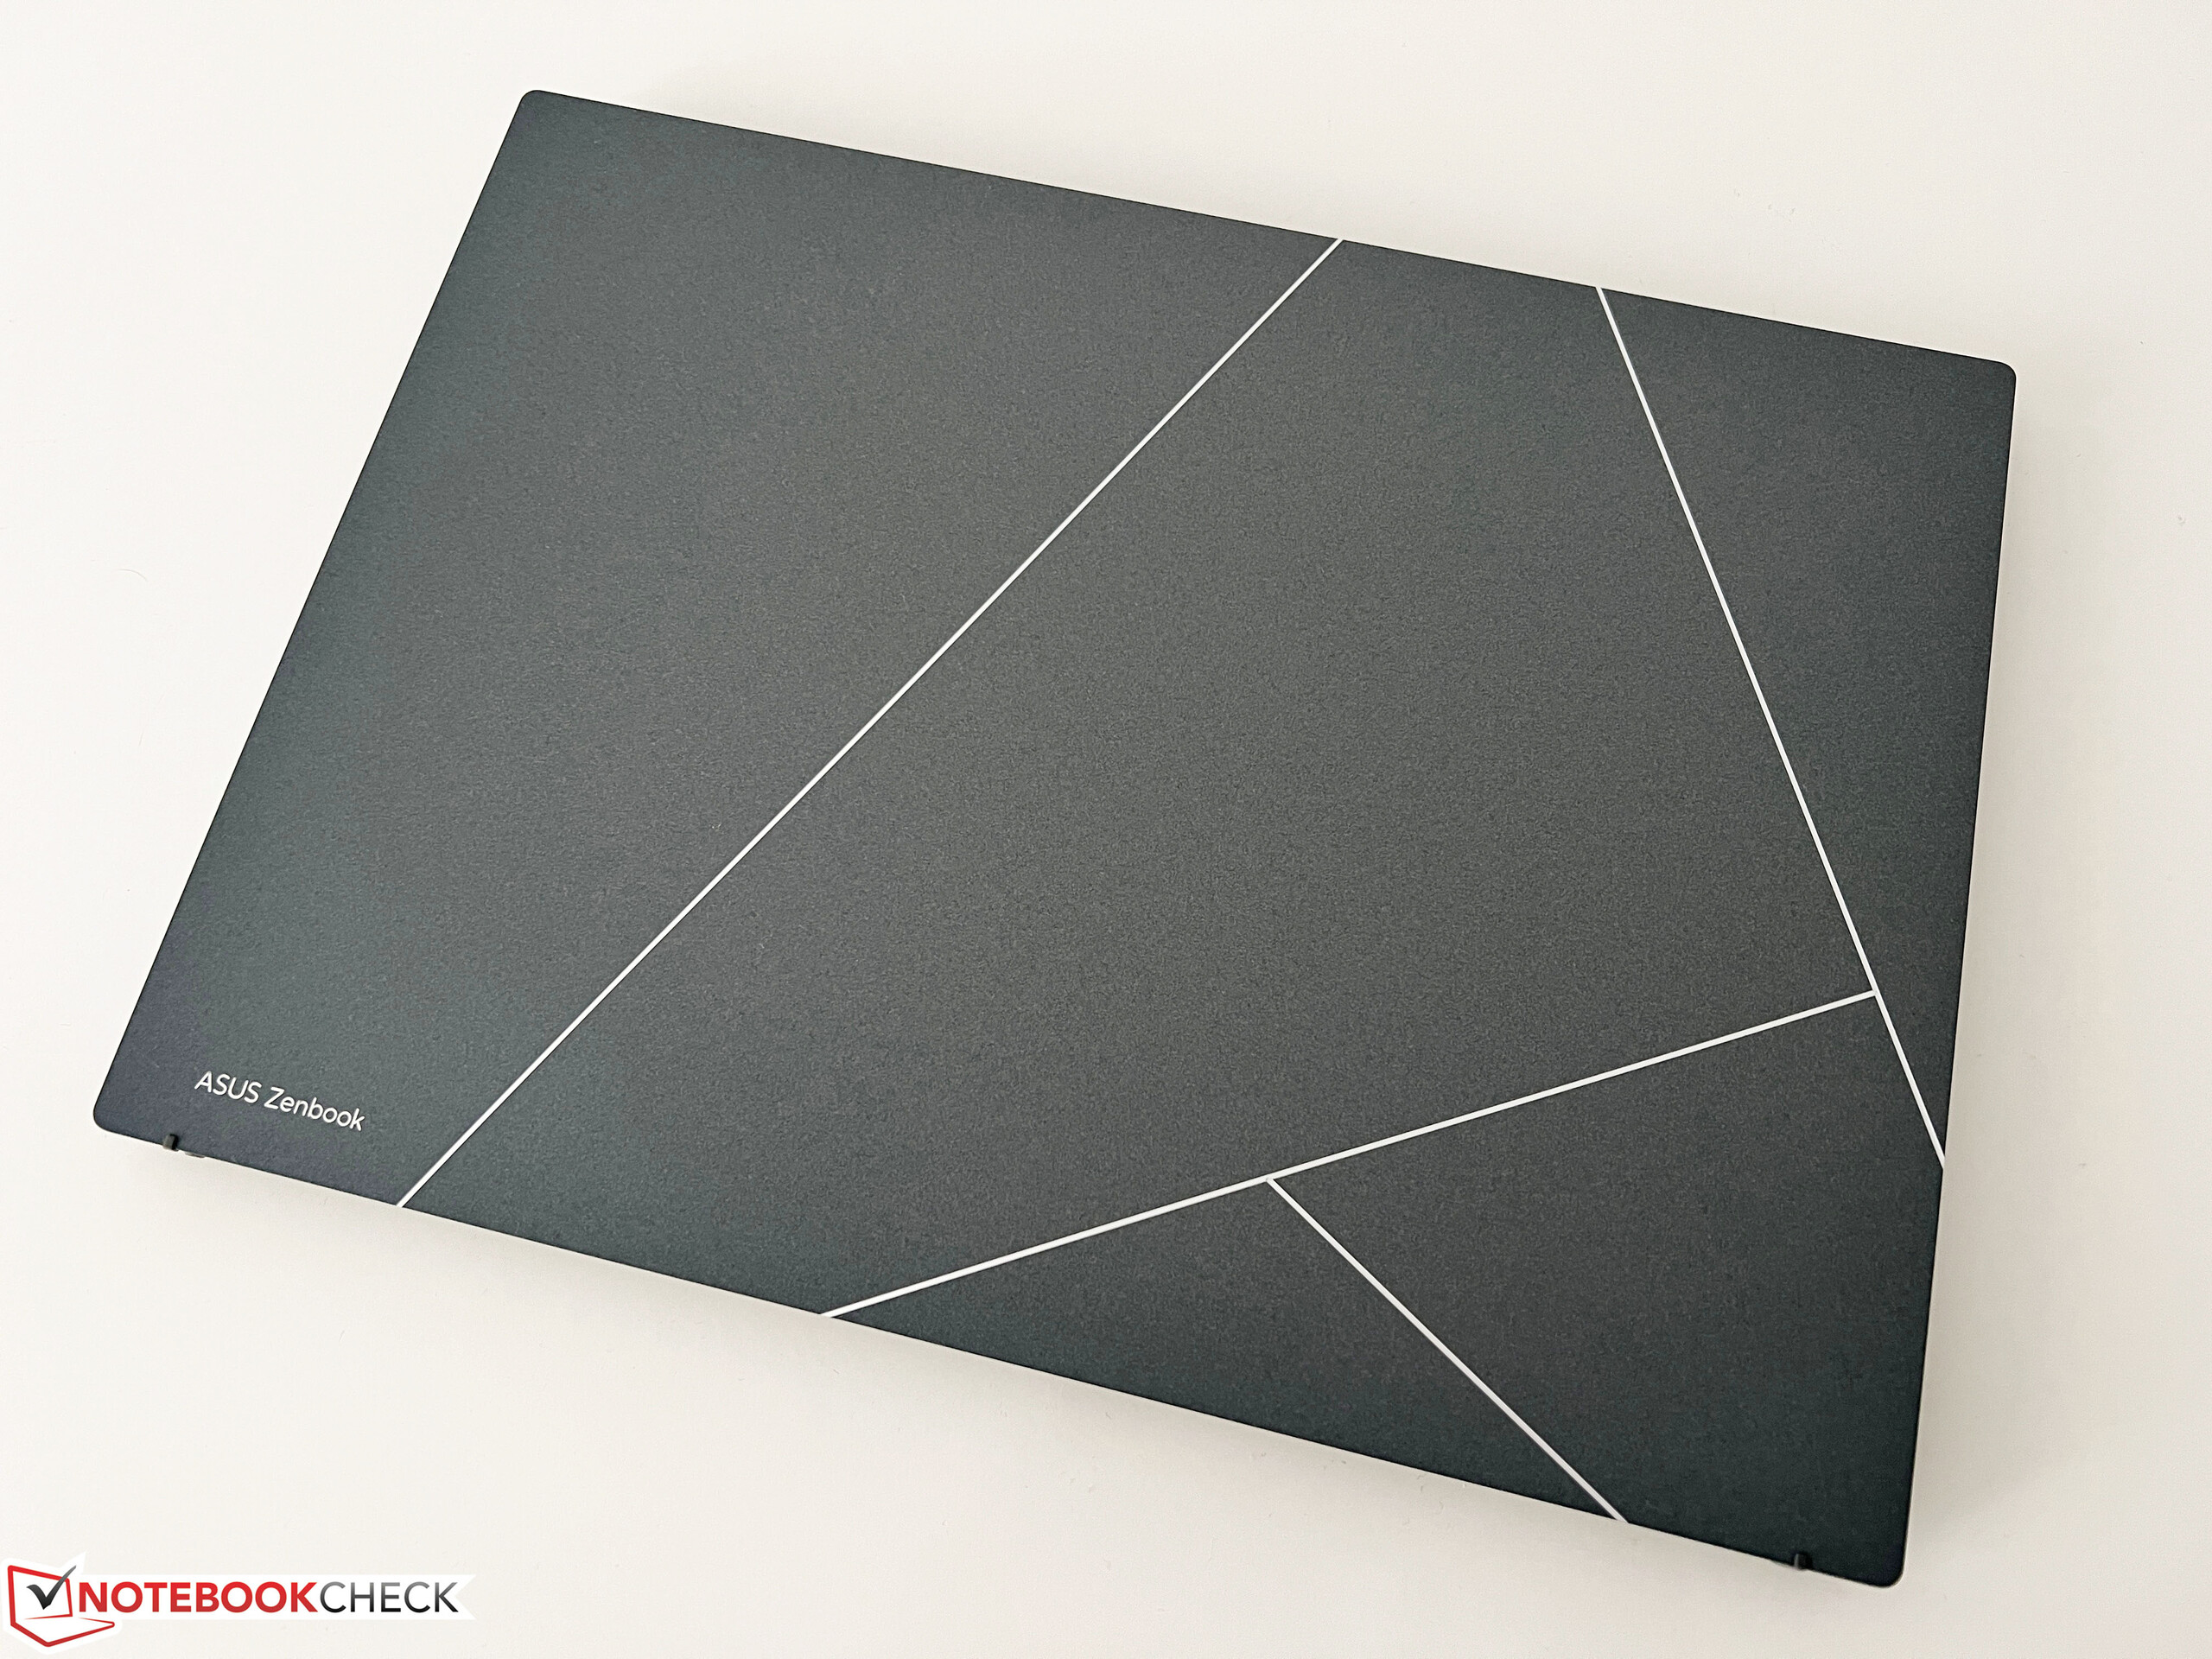
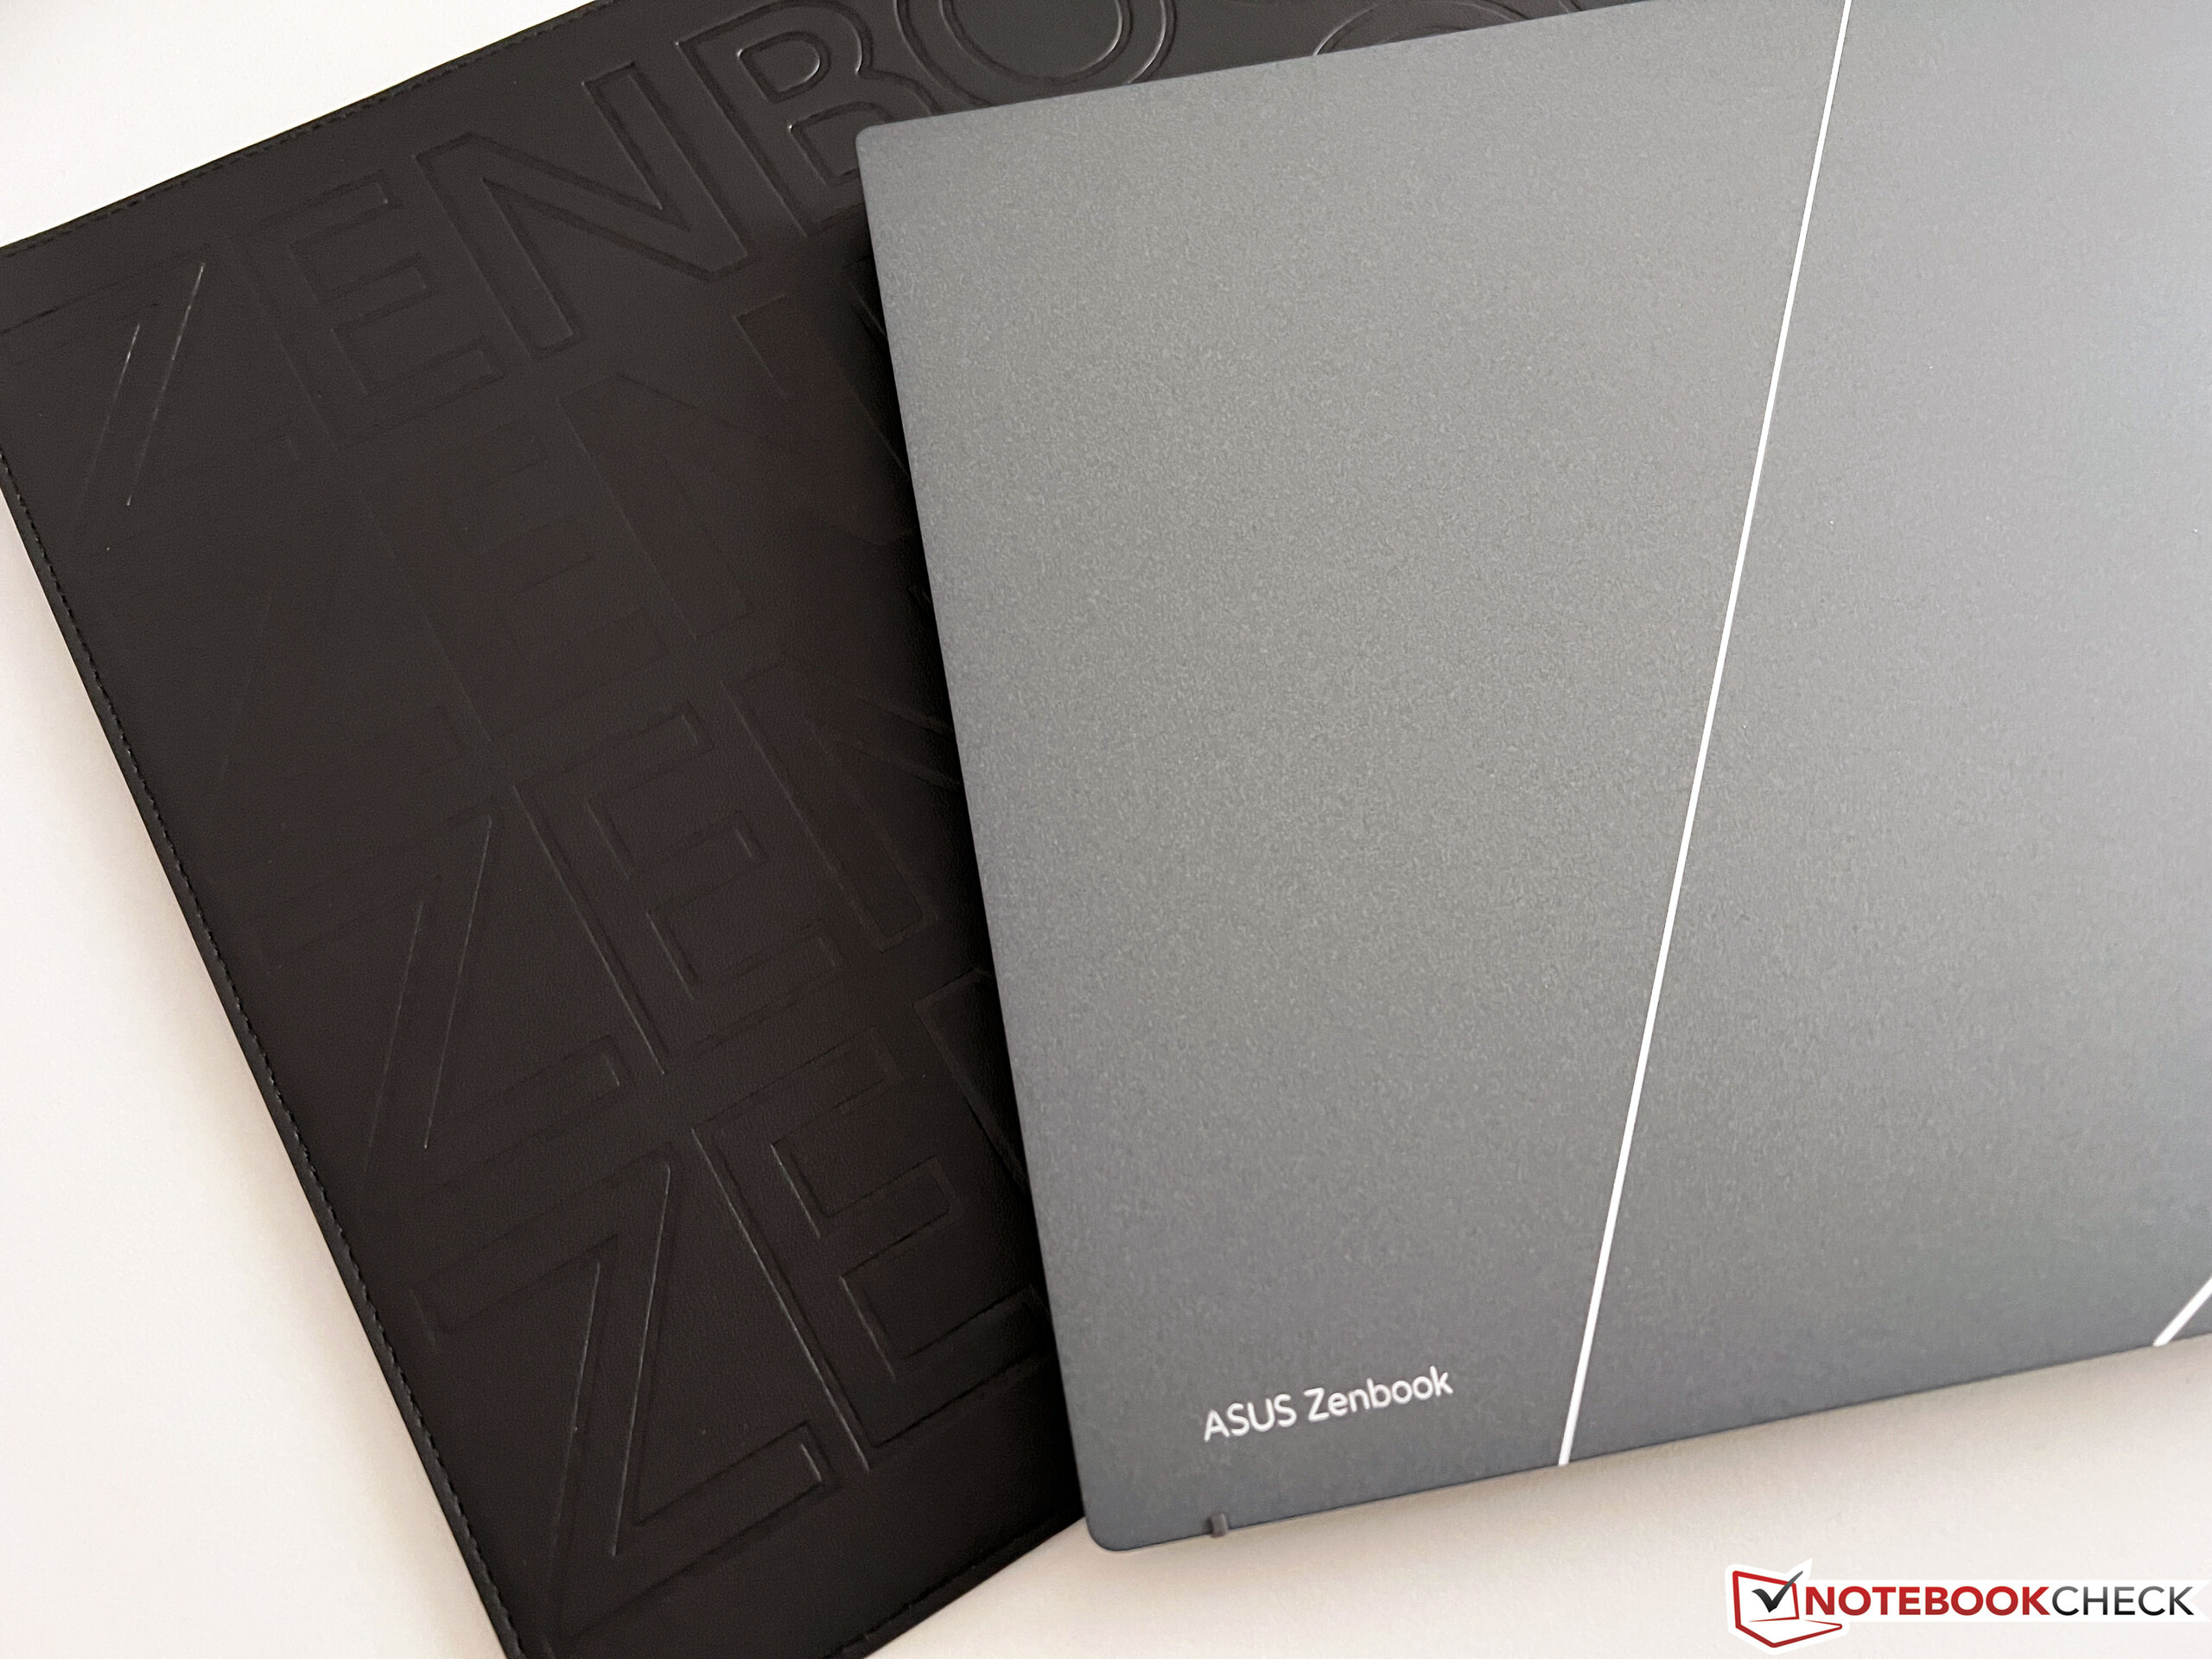
2023年Zenbook S 13的外壳采用了新的设计,包括一个新的显示器铰链。这是一种ErgoLift机制,在提高盖子时,底座单元是有角度的。这有好处也有坏处,虽然有角度的底座装置使打字更舒适,但现在把设备放在大腿上时有一个硬边。 新的Zenbook有思索蓝或玄武岩灰两种颜色,我们的灰色测试装置在各种灰色的映衬下显得非常好,非常优雅。此外,我们非常喜欢显示屏盖顶部的大型ProArt标志。
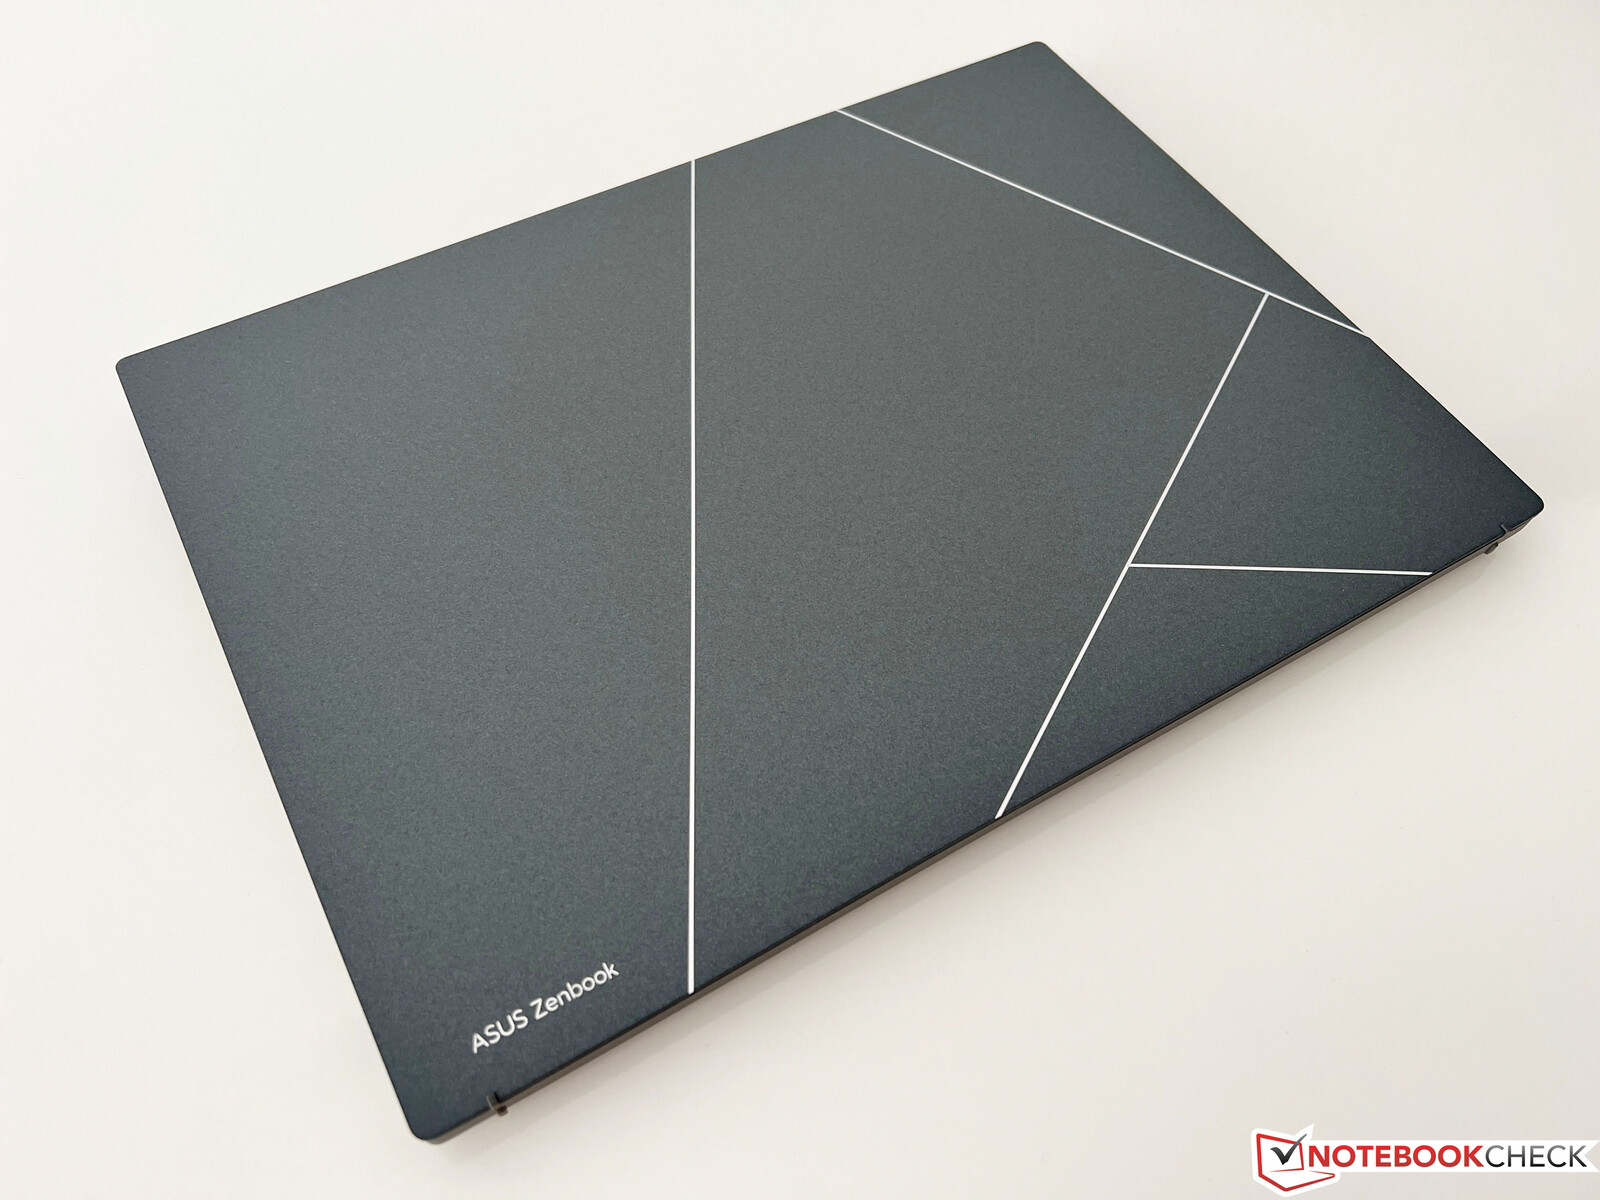
除了新的设计之外,盖子也采用了新的材料。基本上,外壳由铝制成,然后由一层等离子体陶瓷涂层覆盖。这种新的表面技术具有各种优势,如提高了抗磨损和抗腐蚀能力。在日常操作中,略微粗糙的表面还有一个好处,就是根本看不到任何指纹。一个多星期后,我们甚至不需要清洁布。 根据制造商的说法,这种生产过程也更加环境友好。
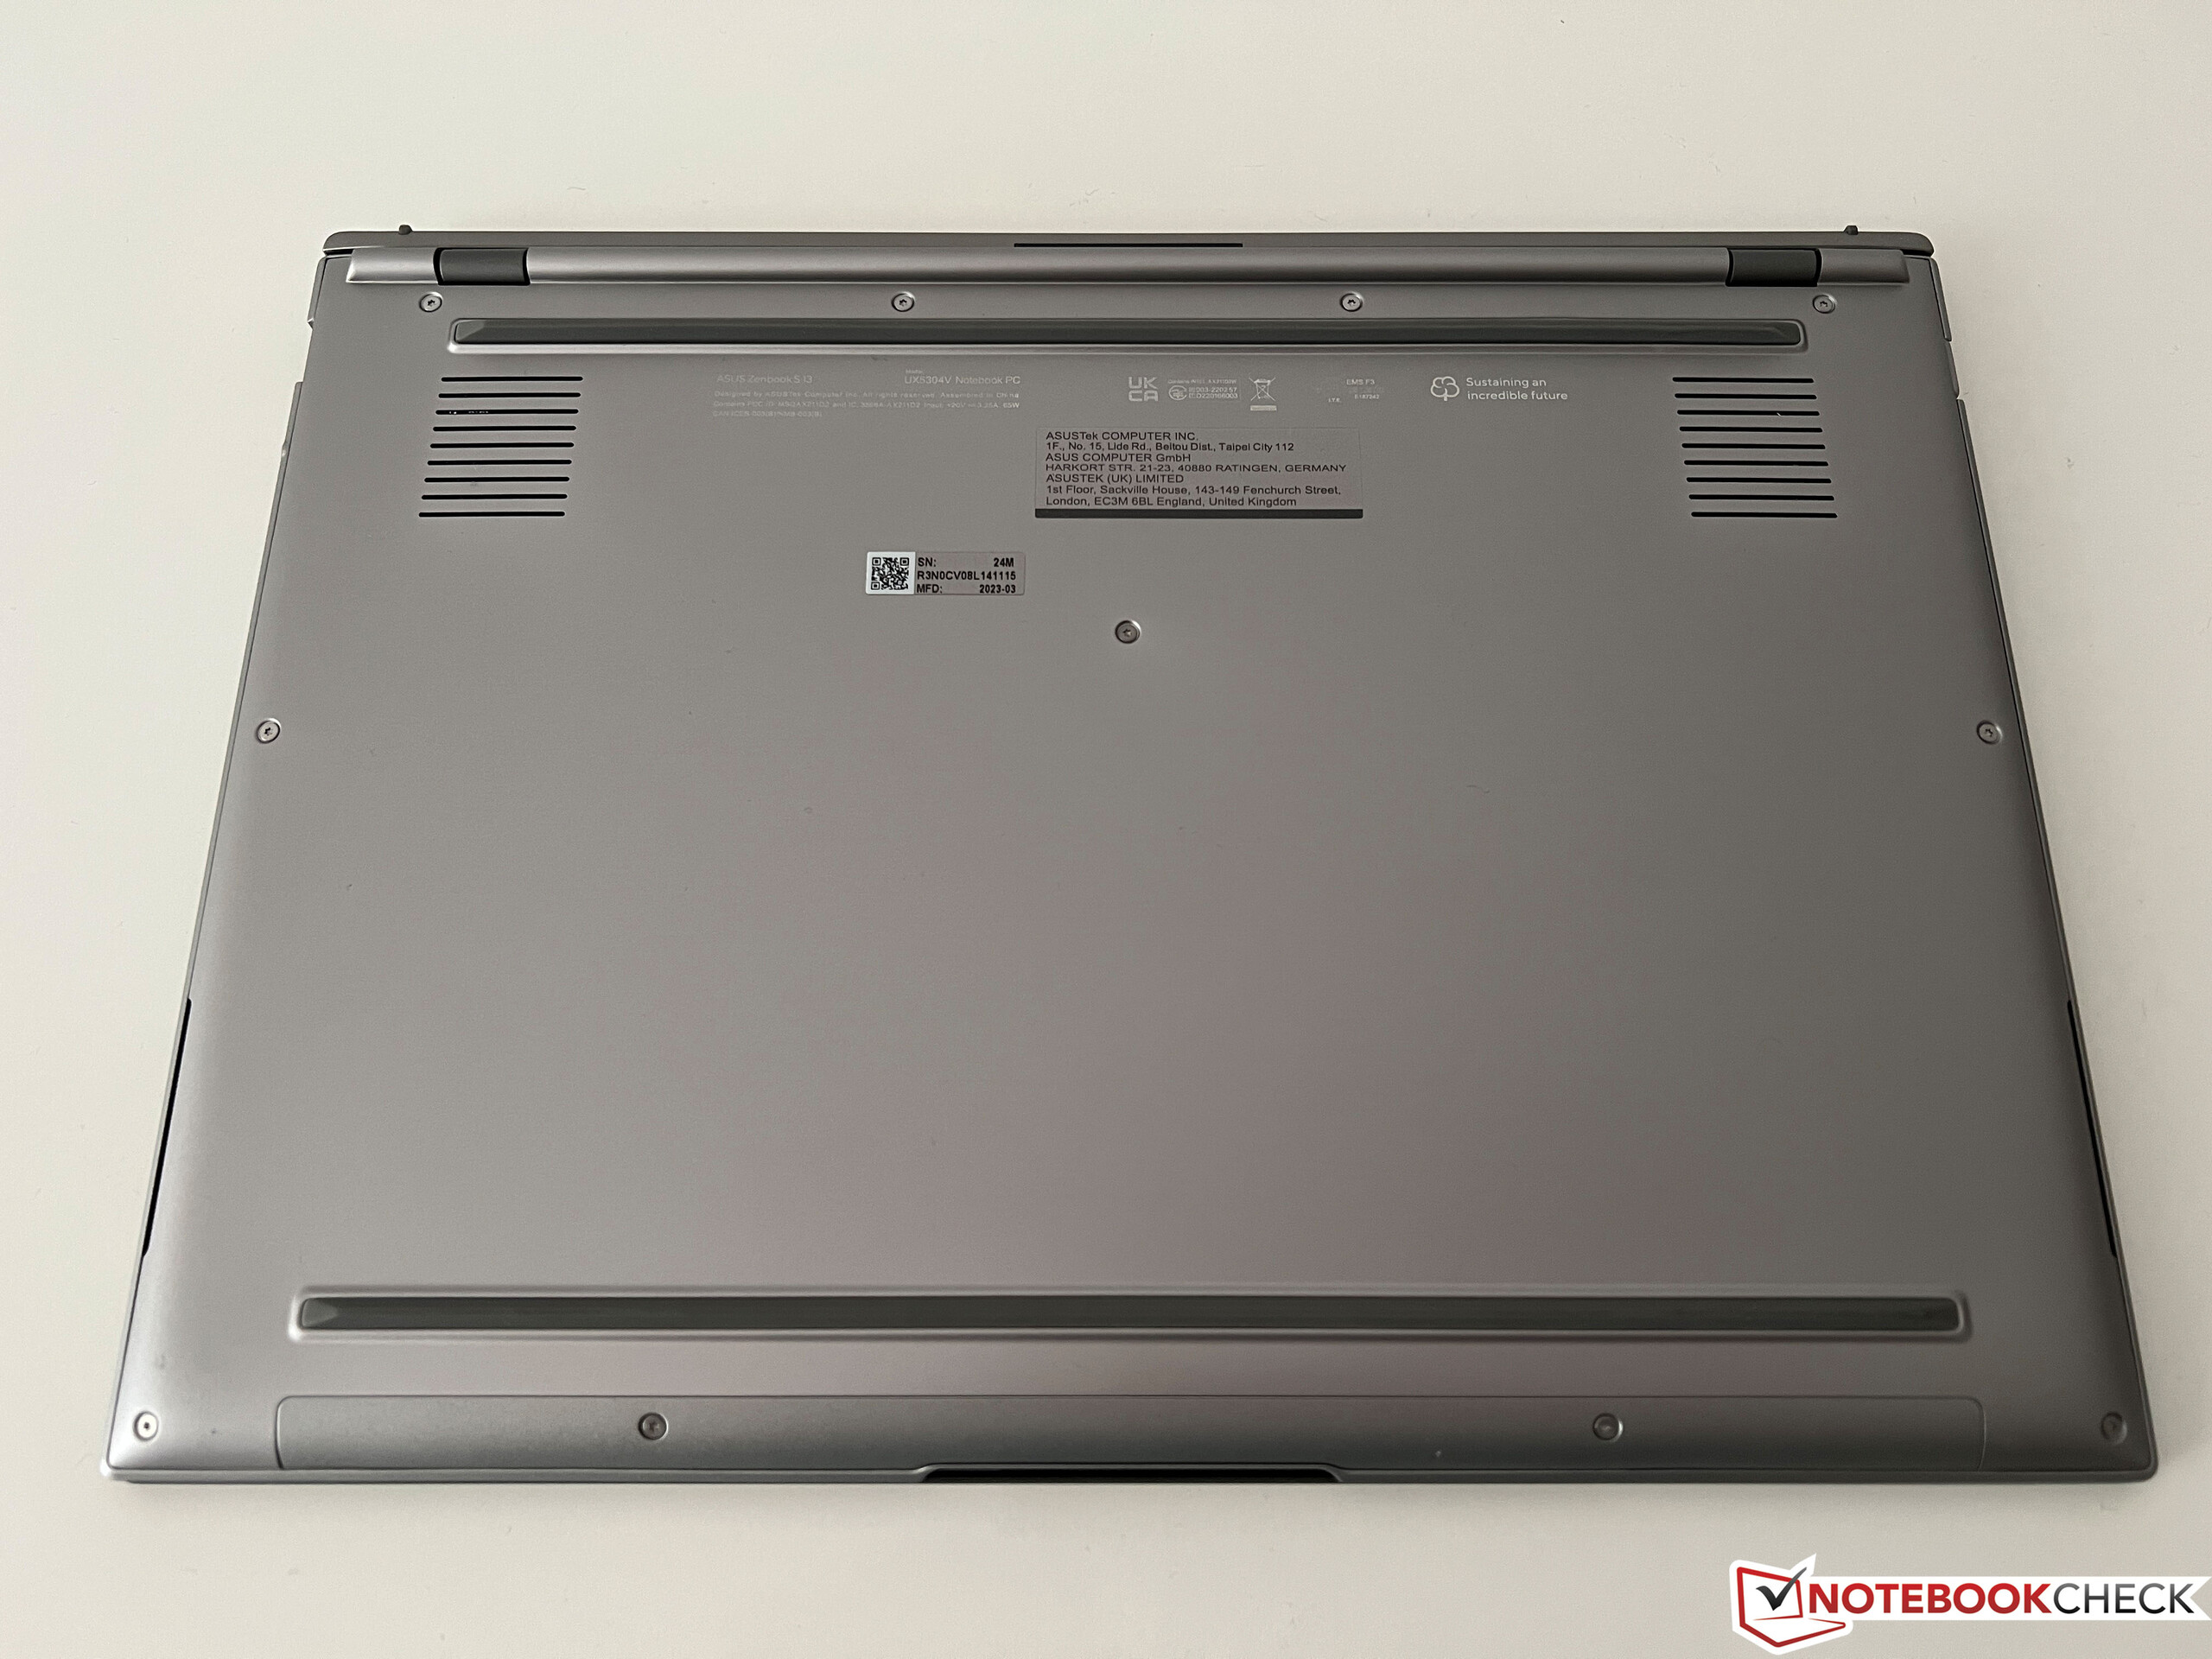
基本单元的表面也略微粗糙,指纹在那里也不成问题。整台笔记本电脑的稳定性给我们留下了极好的印象,尽管结构纤细,但无论是底座还是盖子都不能过度翘起或弯曲。铰链也调整得很好,尽管这不能防止在改变打开角度后出现一些轻微的晃动。最大的打开角度是180度。
尺寸对比显示,新的Zenbook S 13尤其变得更苗条。虽然它的厚度也低于Windows的竞争对手,但目前的 MacBook Air M2从Apple甚至是最小的瘦身。另一方面,就重量而言,规格表有点乐观,因为我们的测试装置带来了1048克(约3.263磅)的重量,仅在该领域的中间位置。与前代产品相比,这只是节省了47克(约1.7盎司)的重量。根据华硕的说法,它是最轻的13.3英寸OLED笔记本电脑,但一些采用IPS面板的竞争对手甚至更轻。但总体而言,Zenbook S 13的移动性当然很好。紧凑的充电器又为其增加了228克(约8盎司)的重量。
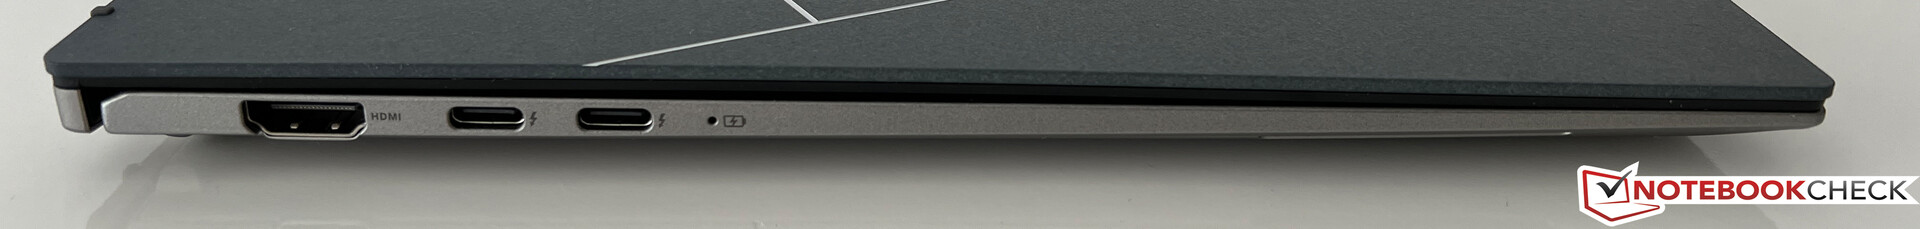
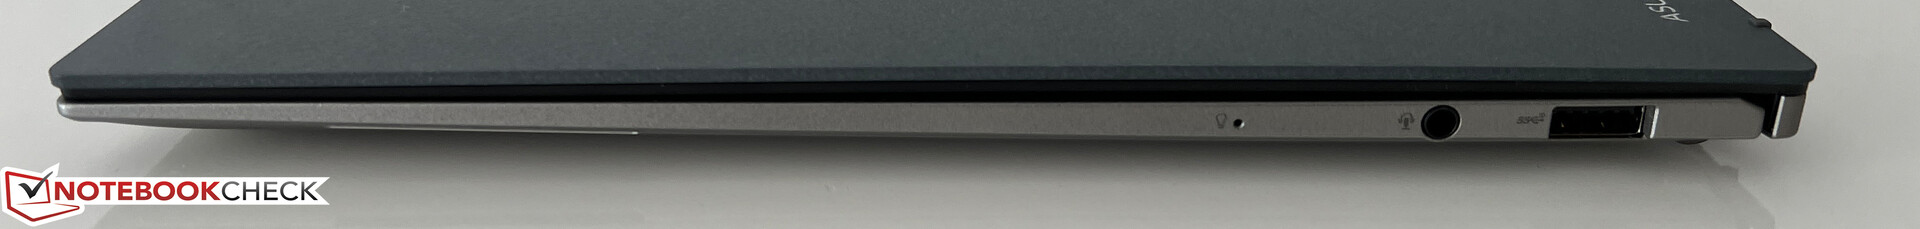
设备 - 带有Thunderbolt 4的Zenbook
继去年的 去年的Zenbook S 13独家使用三个USB-C接口后,华硕现在提供了2个USB-C接口,还增加了一个USB-A接口(尽管外壳很薄)和一个全尺寸的HDMI接口。这在日常操作中更加实用,而且由于这是一台英特尔笔记本电脑,这两个USB-C端口当然也支持雷电4。
沟通
华硕使用英特尔的现代AZ211 WLAN模块,它已经支持最新的Wi-Fi 6E WLAN标准以及蓝牙5.2。然而,在我们的测试中,我们无法连接到华硕参考路由器的相应6-GHz网络,因此使用了5-GHz网络来代替。总的来说,传输率非常高,而且在很大程度上也是稳定的。我们在实践中也没有看到任何连接问题。
| Networking | |
| Asus ZenBook S13 OLED UX5304 | |
| iperf3 transmit AXE11000 | |
| iperf3 receive AXE11000 | |
| Asus Zenbook S 13 OLED | |
| iperf3 transmit AXE11000 | |
| iperf3 receive AXE11000 | |
| Apple MacBook Air M2 Entry | |
| iperf3 transmit AXE11000 | |
| iperf3 receive AXE11000 | |
| Lenovo Yoga Slim 7 Carbon 13IAP7-82U9005FGE | |
| iperf3 transmit AXE11000 6GHz | |
| iperf3 receive AXE11000 6GHz | |
| Samsung Galaxy Book2 Pro 13 NP930XED-KA1DE | |
| iperf3 transmit AXE11000 6GHz | |
| iperf3 receive AXE11000 6GHz | |
网络摄像头
华硕已经更新了网络摄像头,现在使用的是全高清网络摄像头,加上红外传感器,与Windows Hello相结合进行人脸识别。质量比去年的略好,在良好的光线条件下也不错。


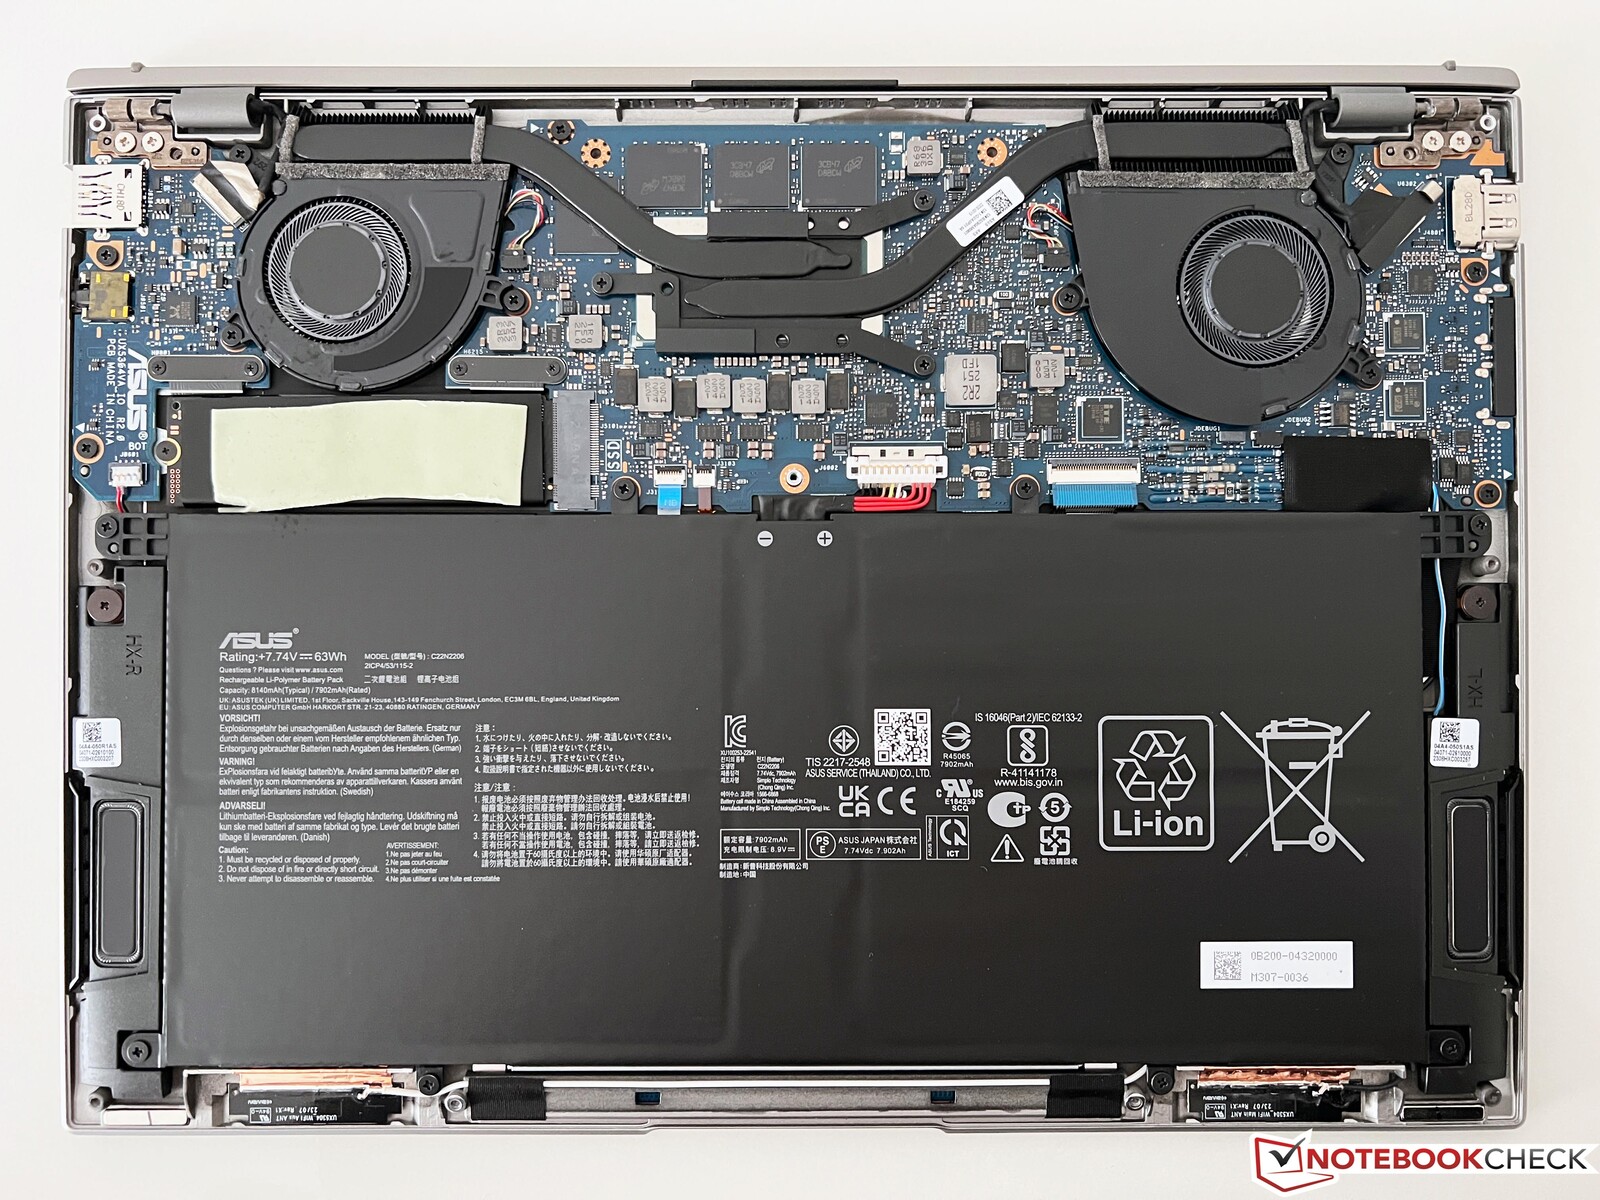
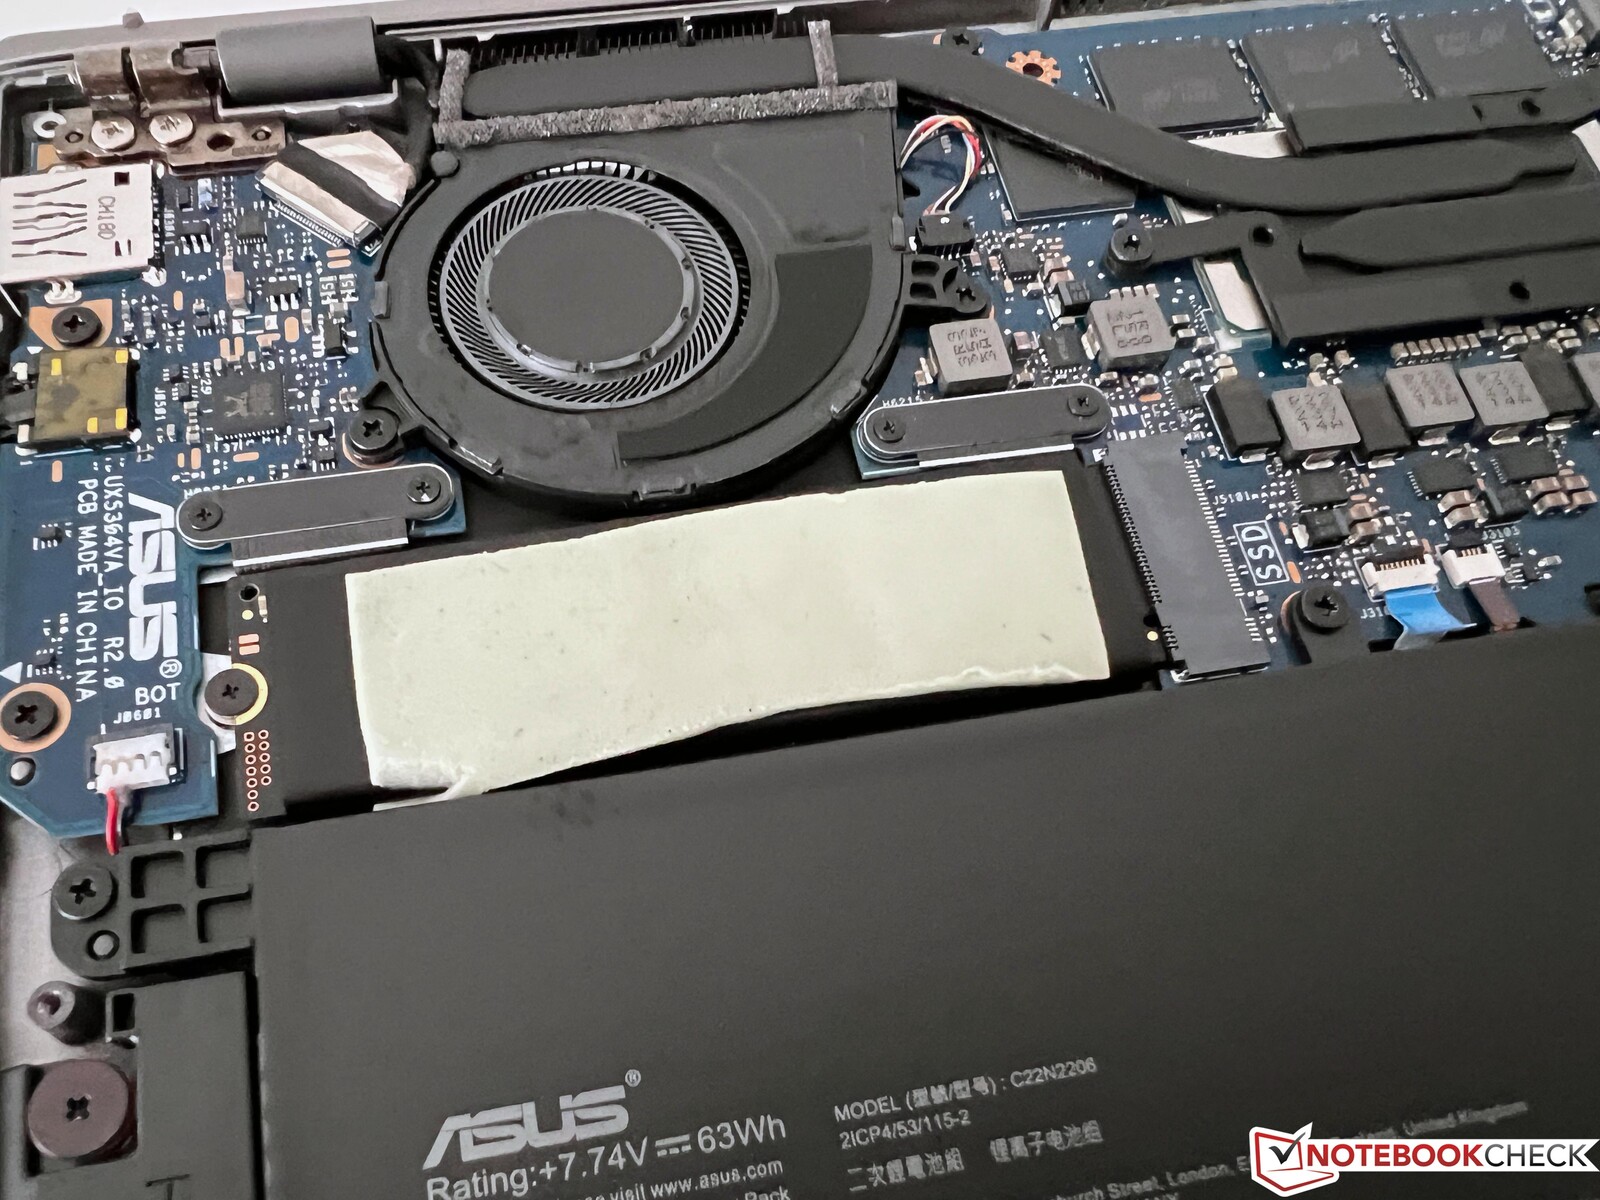
维护
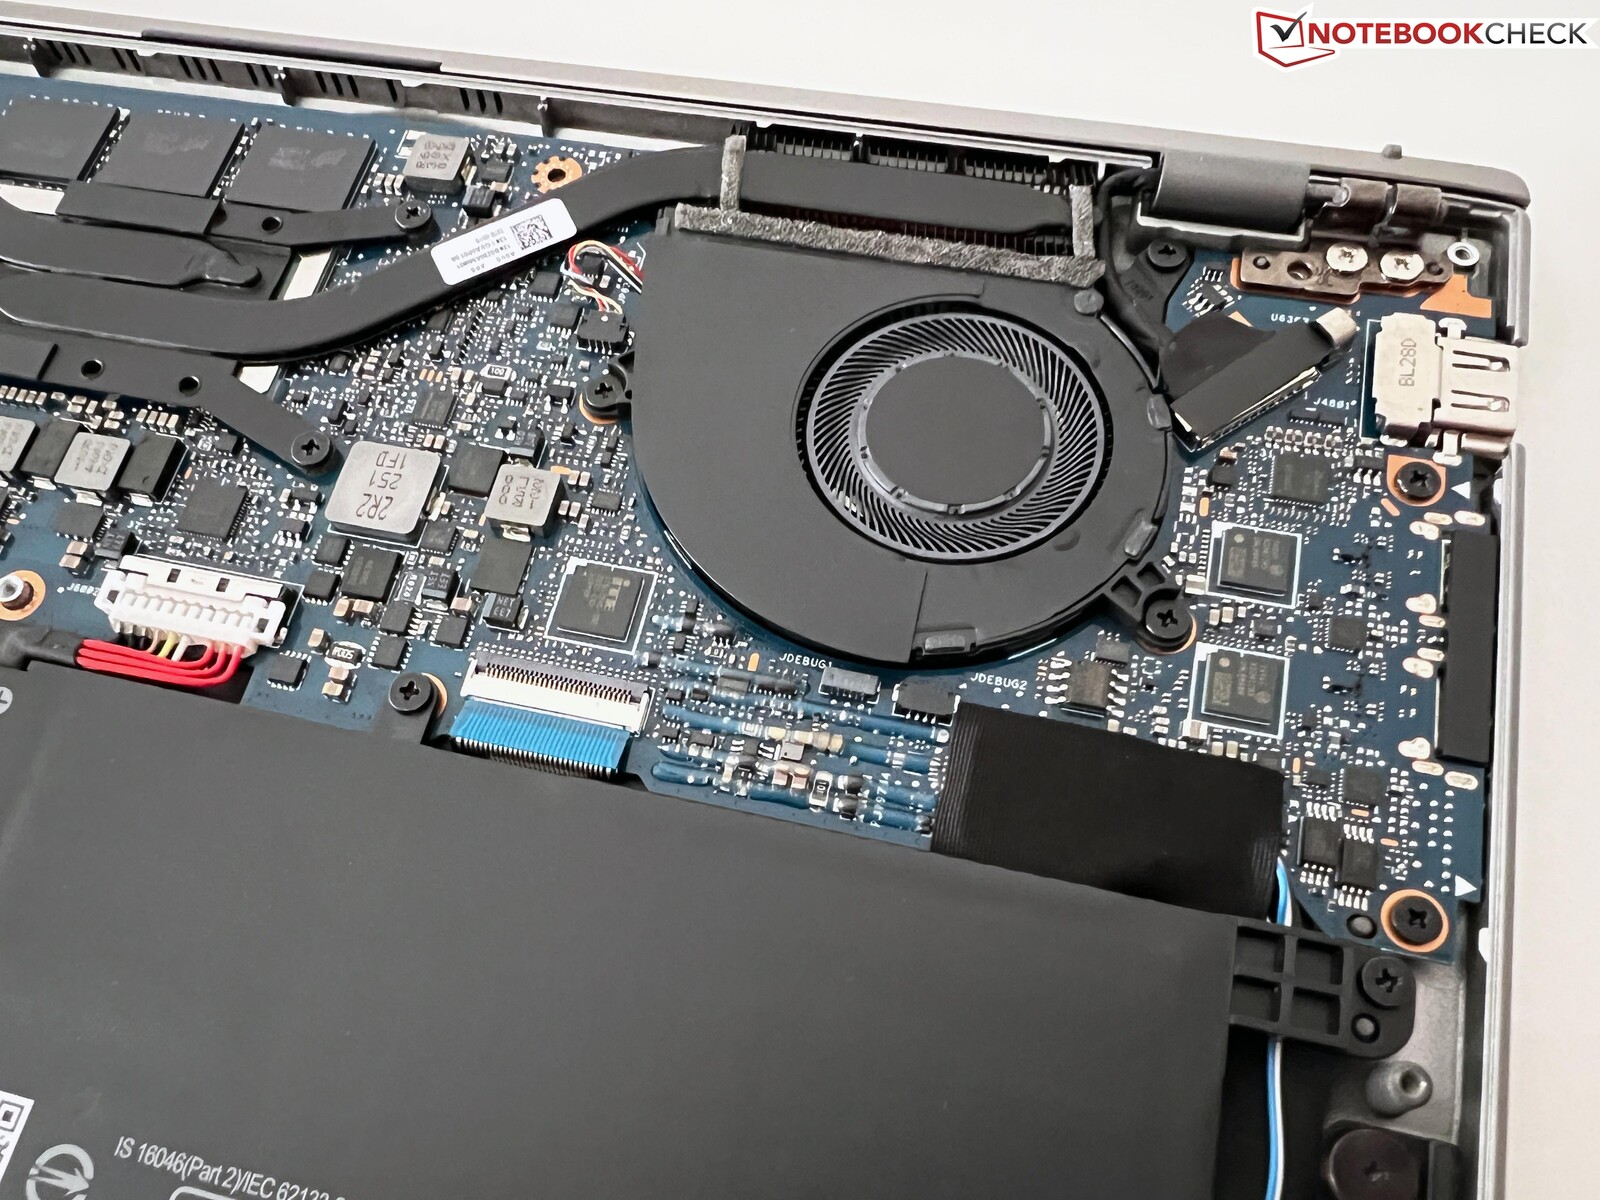
底盖用Torx螺钉(T5)固定,可以很容易地拆下。内部结构以大电池为主,你还可以看到两个可以清洗的风扇。虽然M.2 2280固态硬盘可以更换,但所有其他部件都是焊接而成的。
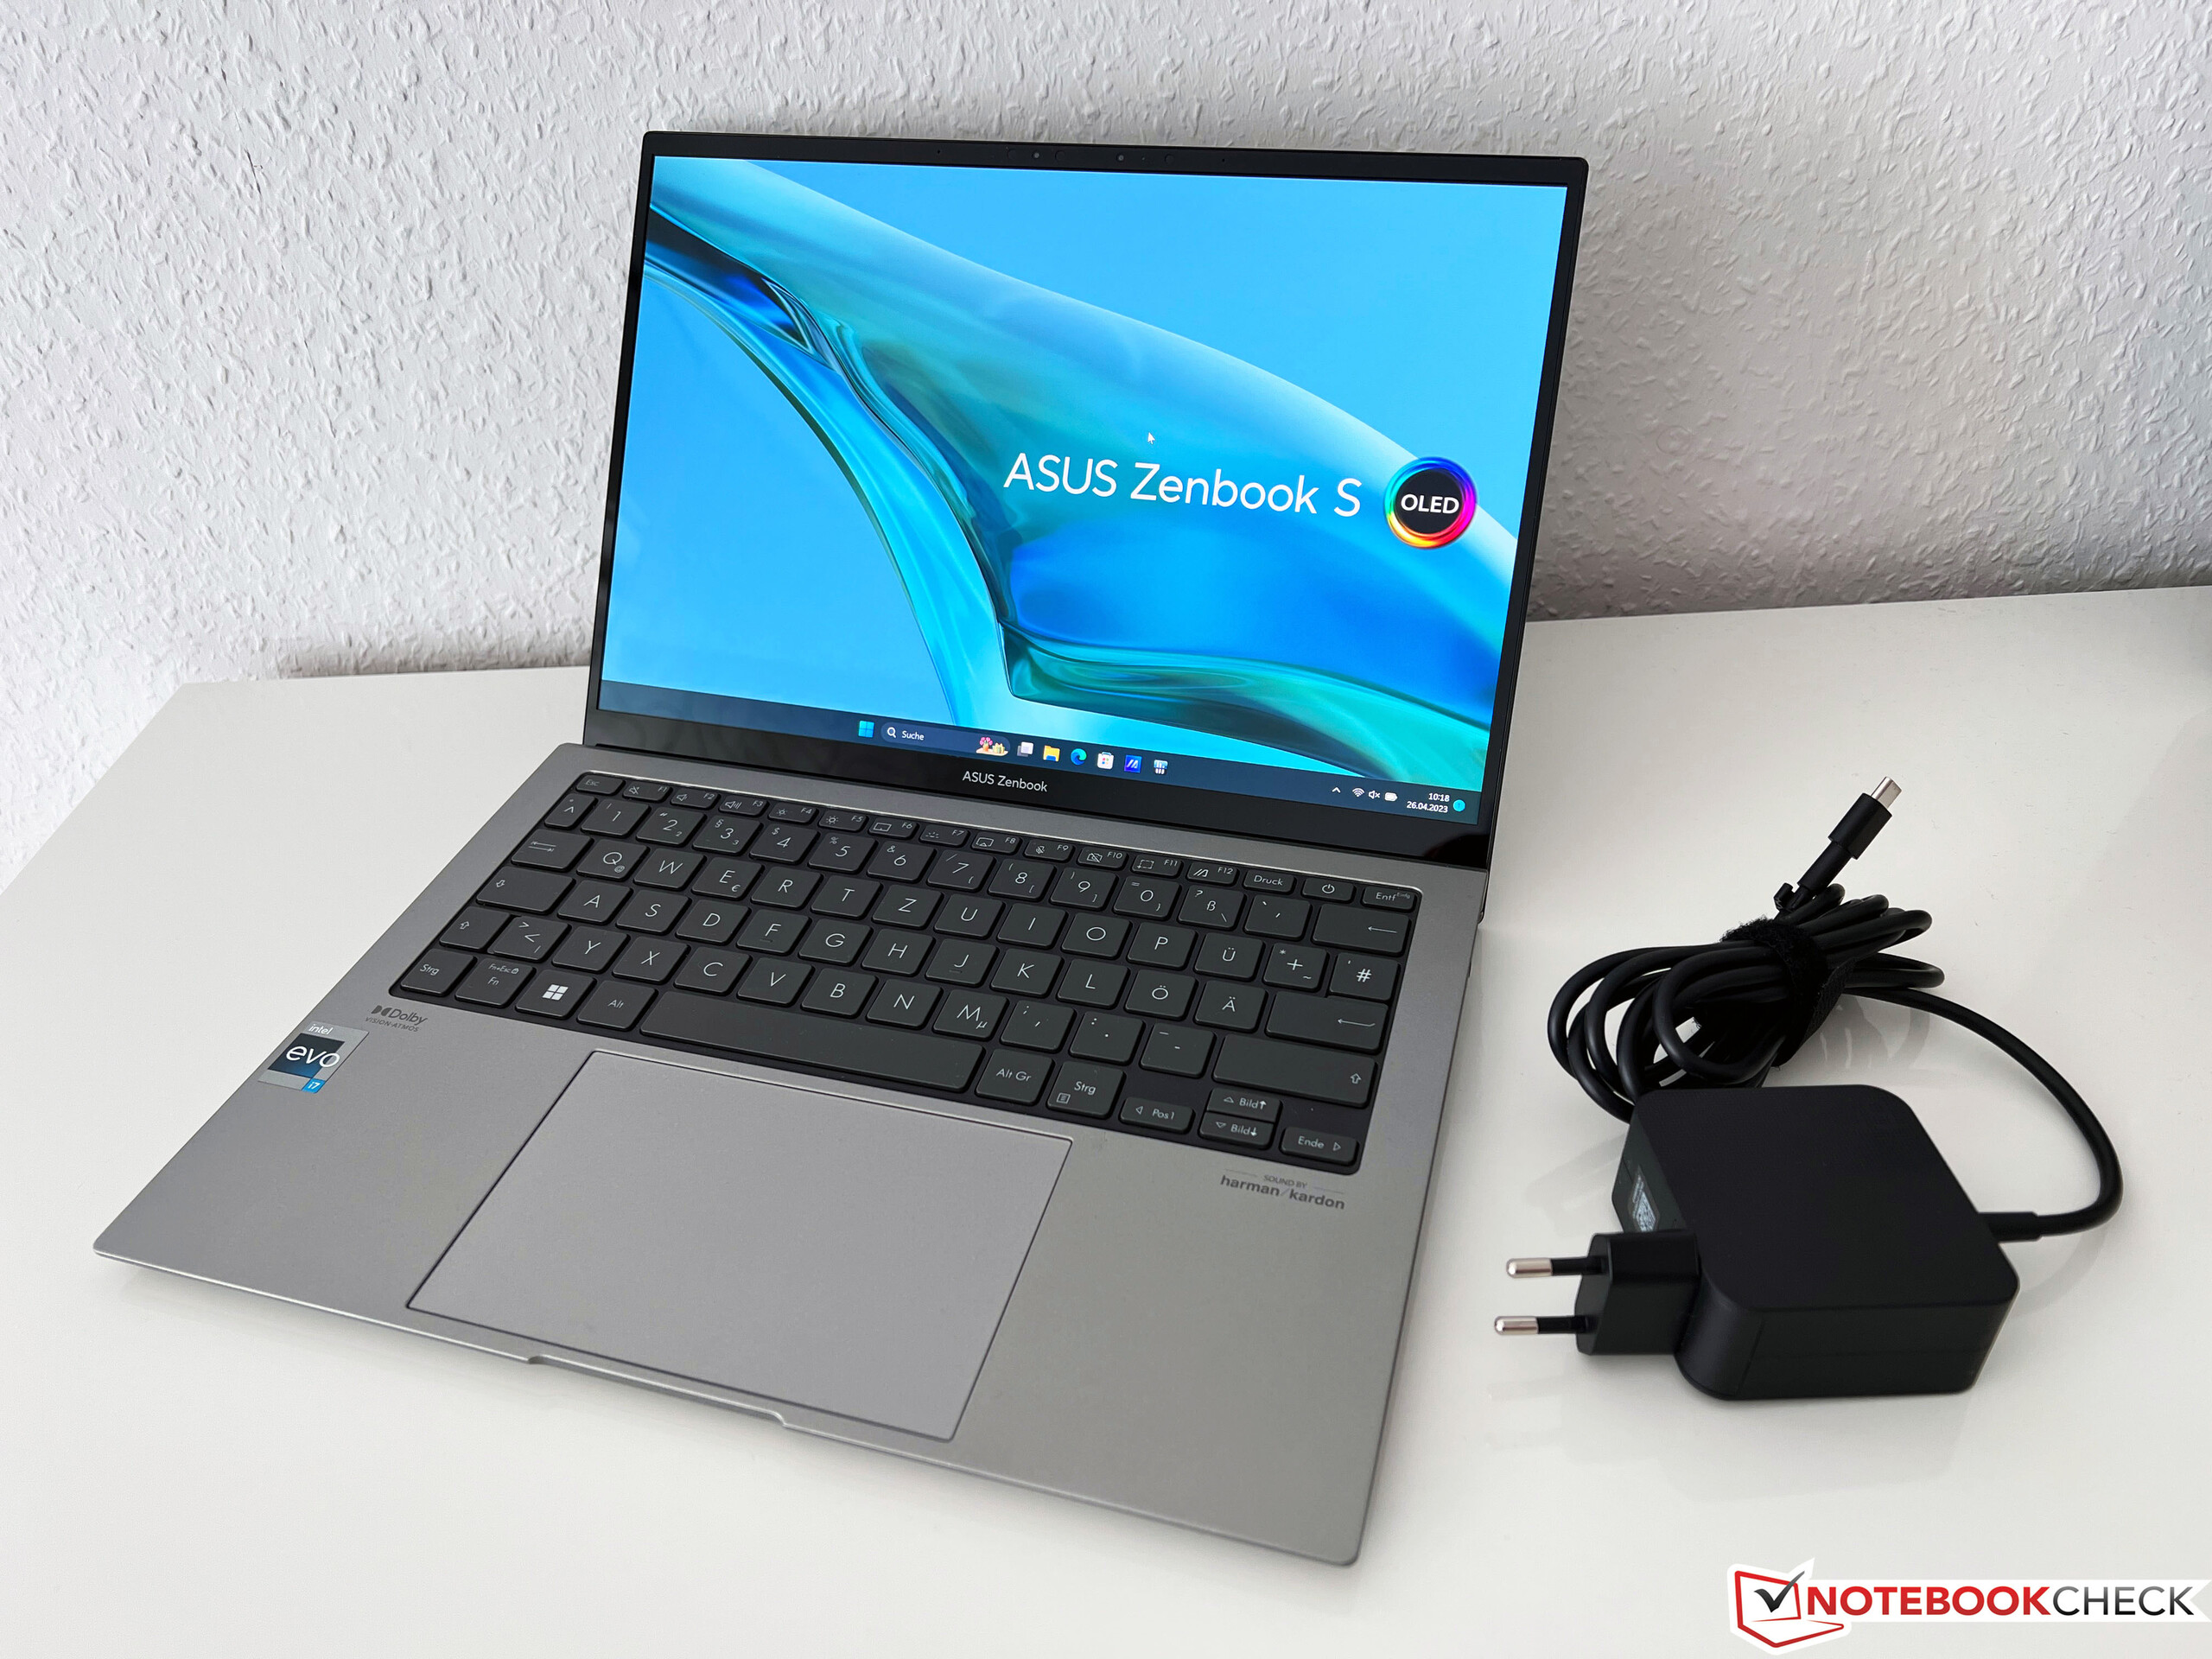
输入设备--Zenbook现在有了更短的键程
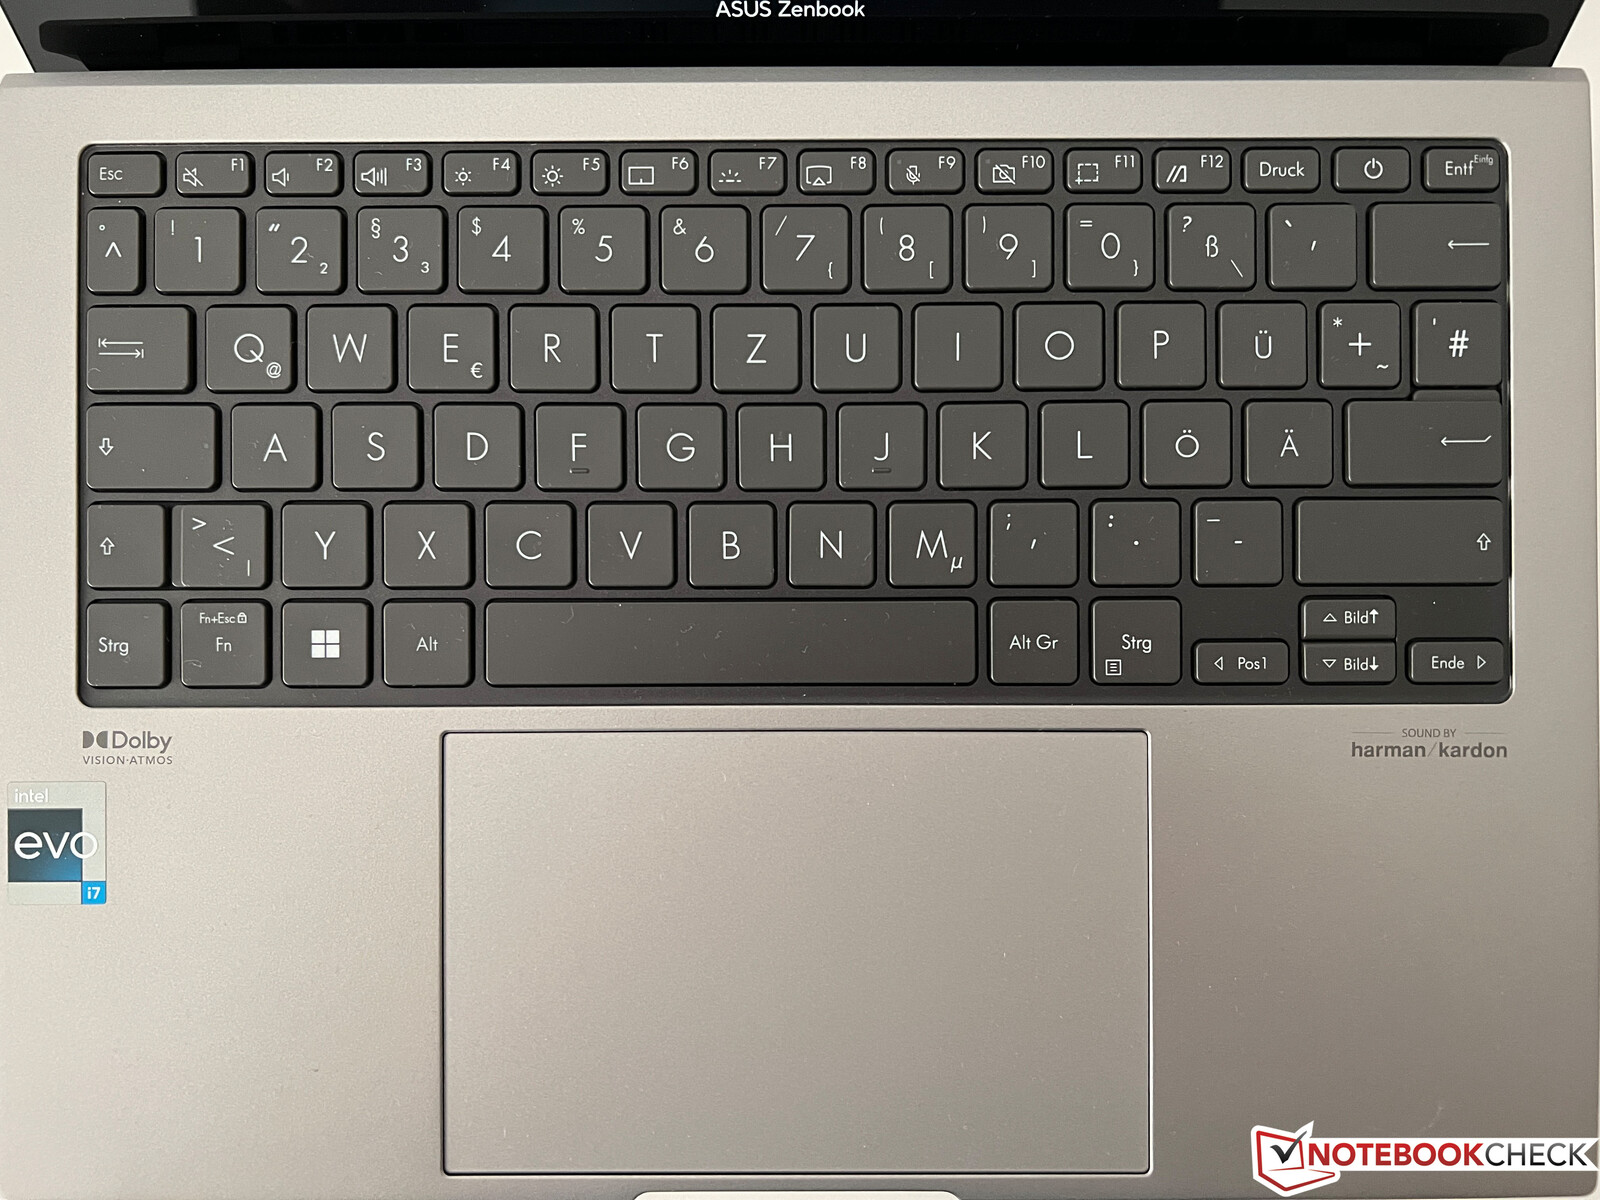
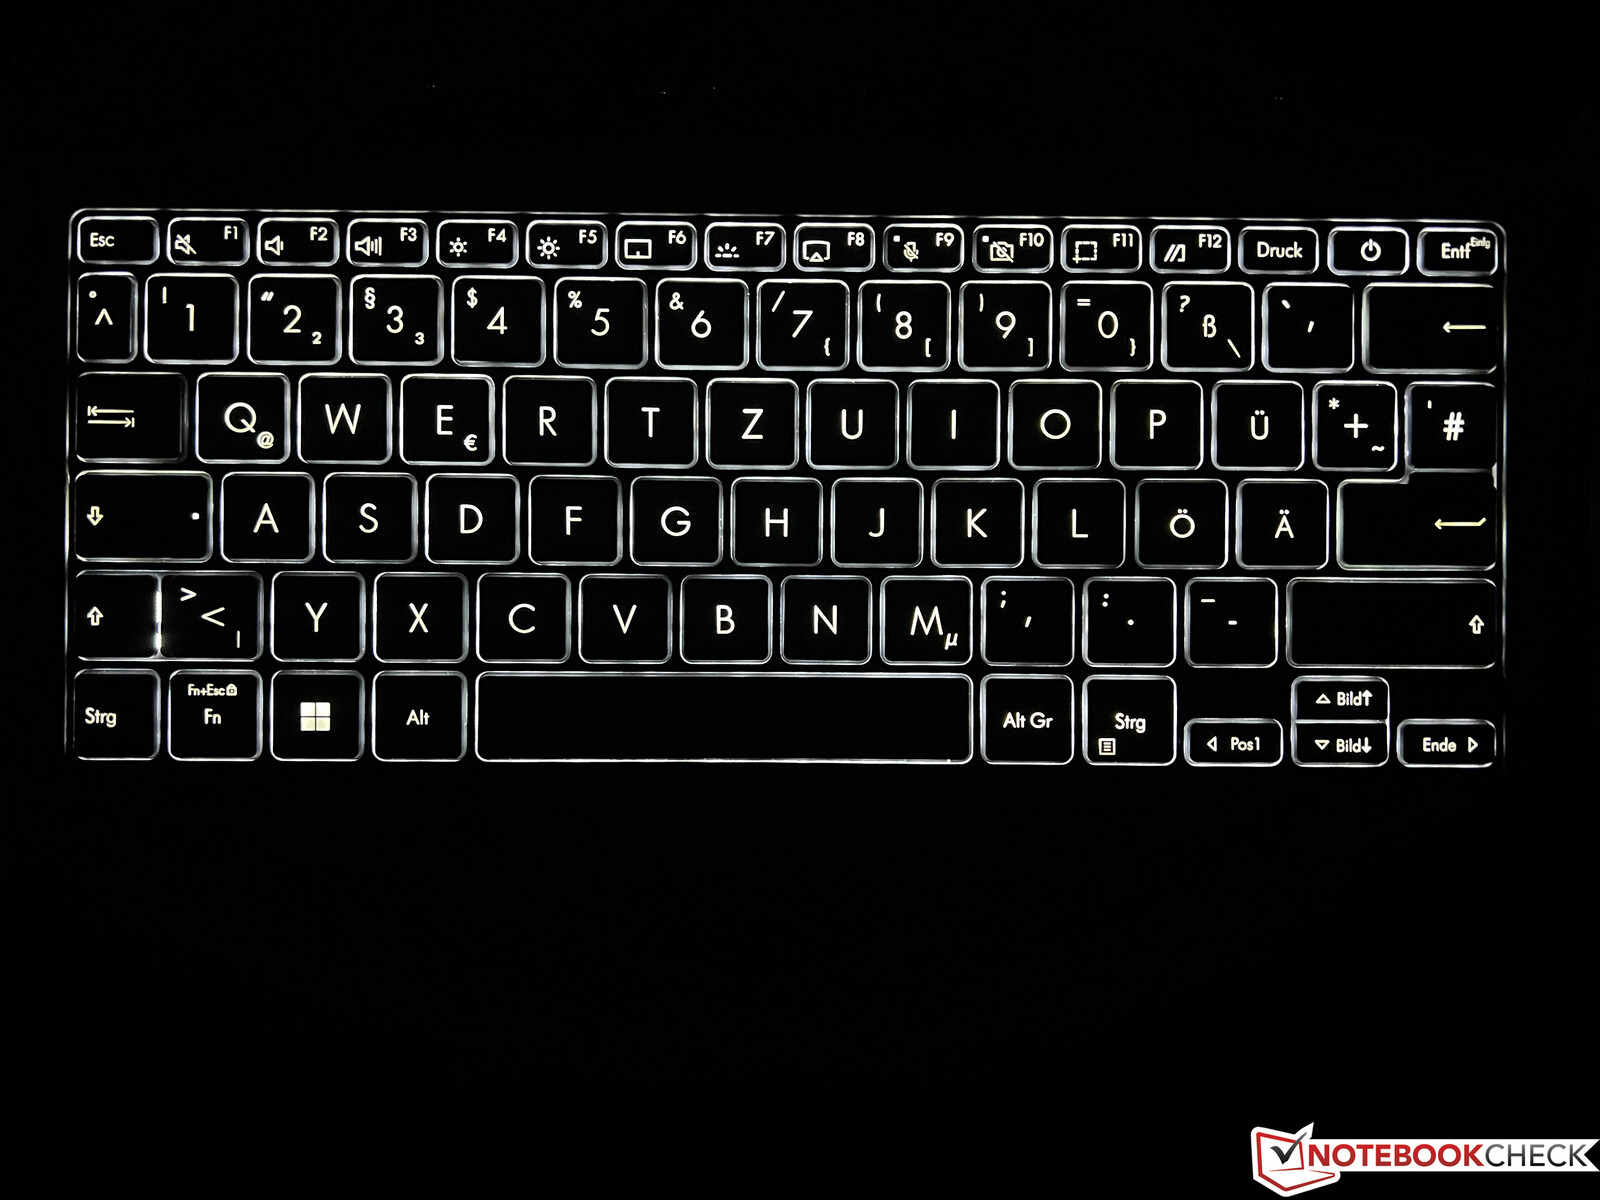
对于一个更薄的外壳,按键通常要减少,而恰恰在Zenbook S 13中也是如此。虽然在前代产品中还是1.4毫米(约0.055英寸),但现在只有1.1毫米(约0.043),这也是很明显的。反馈仍然非常清晰,这绝不是一个糟糕的键盘,但打字体验只是比前代产品更舒适一些。电源按钮中的指纹传感器刚刚被移除,没有任何替换。白色的三段式键盘照明不能通过亮度传感器自动激活。
大型ClickPad(13 x 8.1厘米,~5.1 x 3.2英寸)为光标移动和多达四个手指的手势提供了足够的空间。滑动特性非常好,常规的光标控制也能顺利进行。 ClickPad的底部区域可以被按下,这时会伴随着一些响亮的点击声。在以前的型号中,触摸板还可以作为数字块使用,但这个功能在当前版本中被取消了。
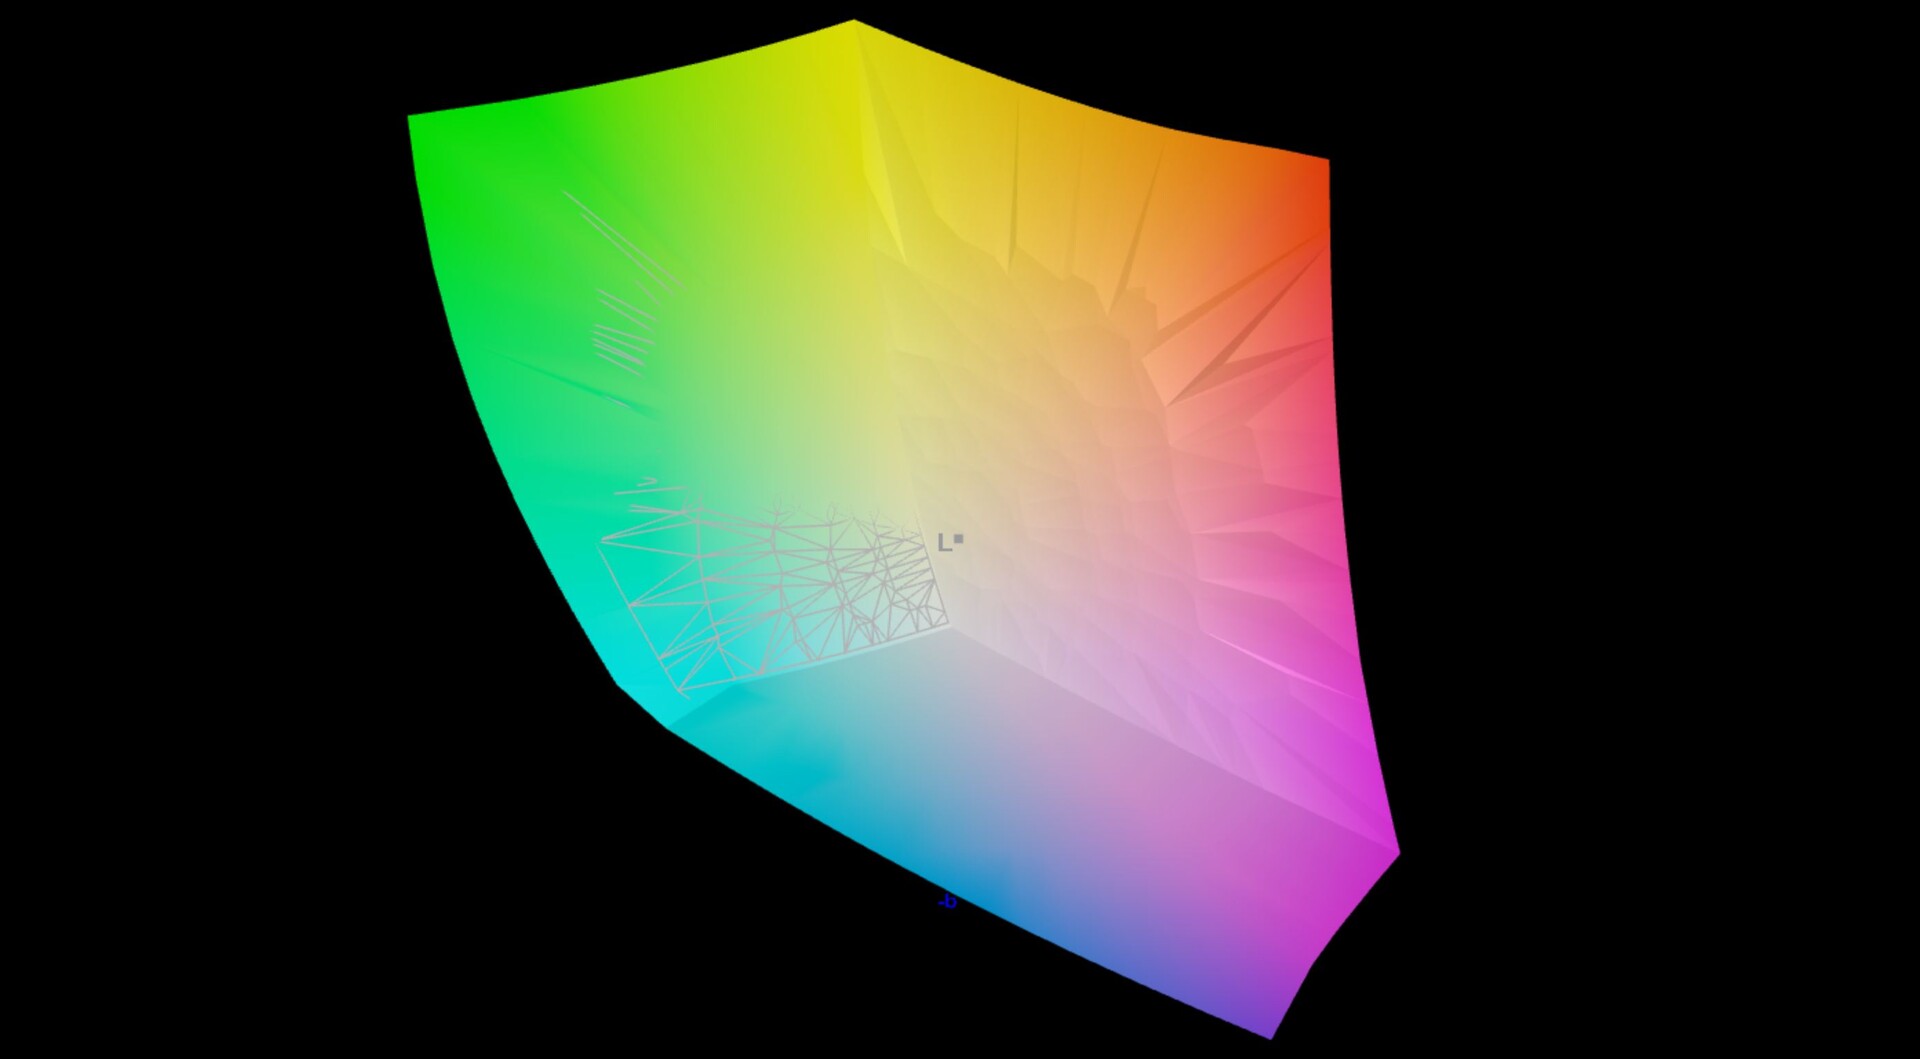
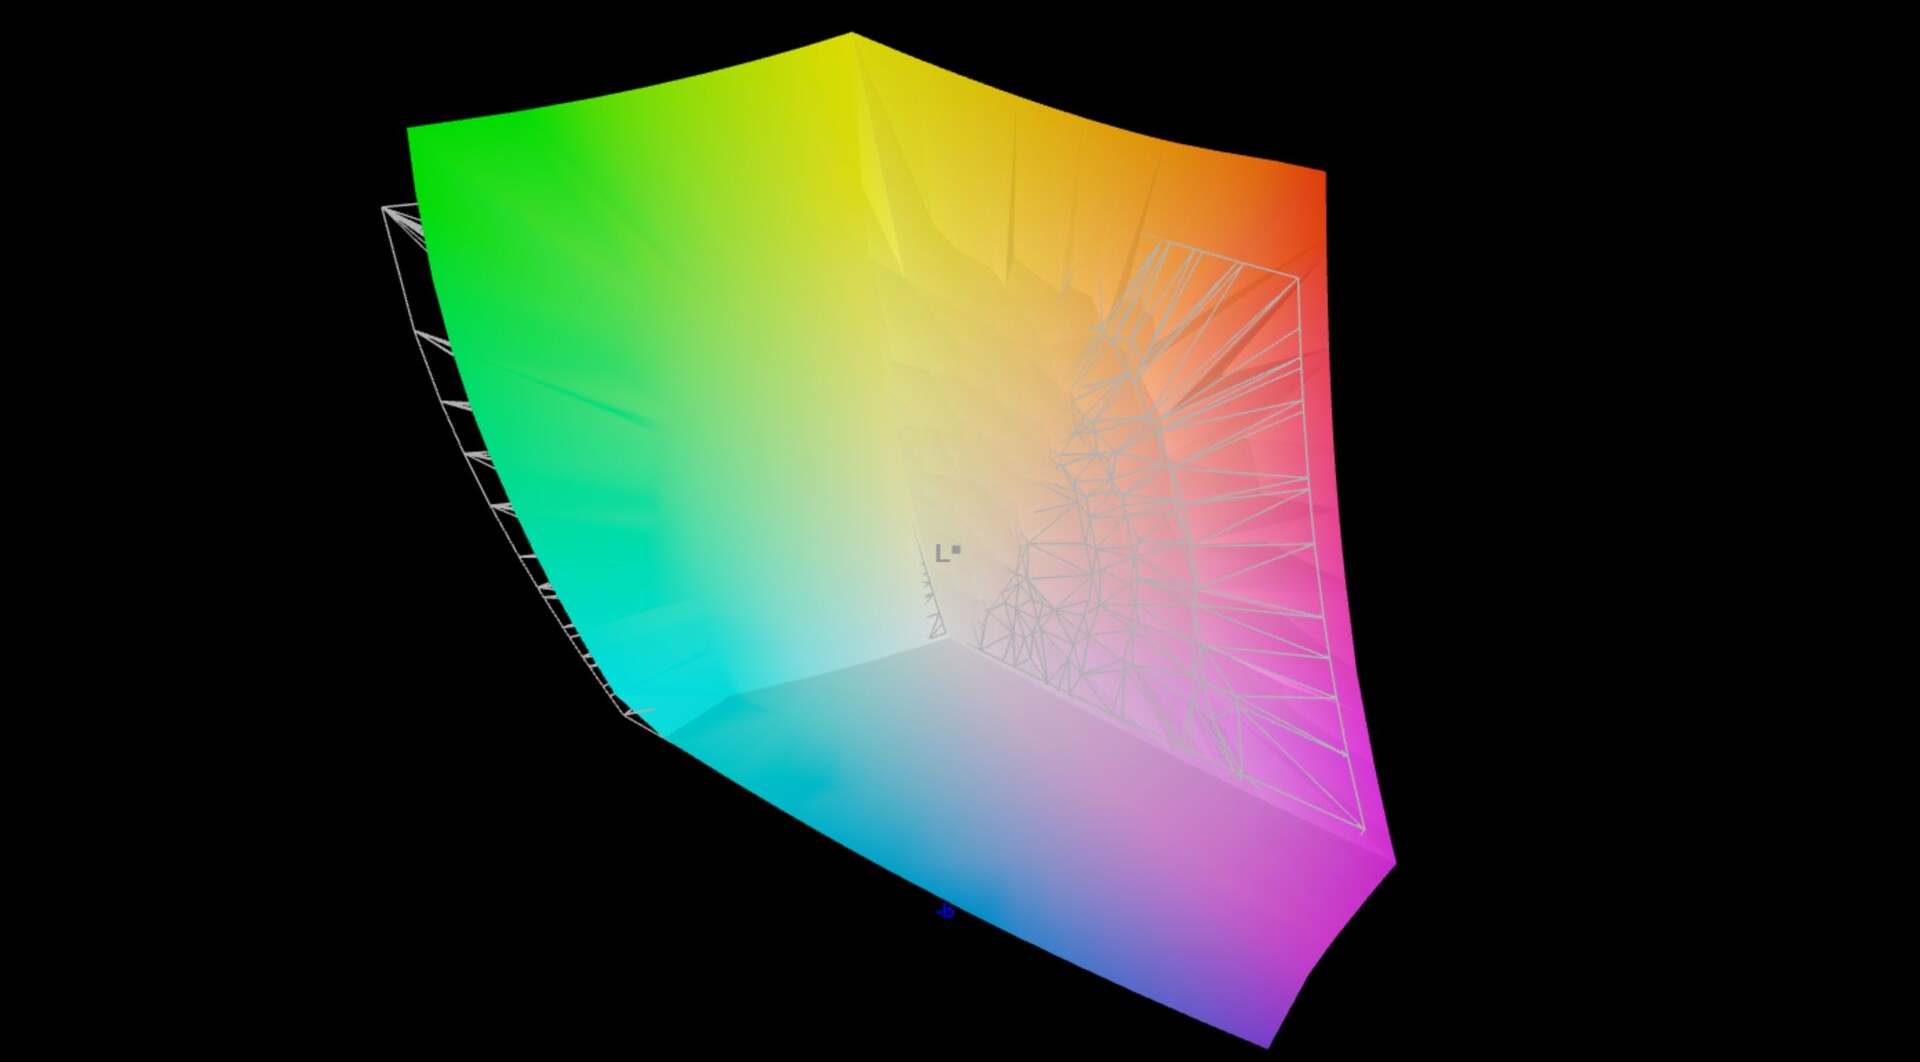
显示屏 - 带有直流调光的OLED
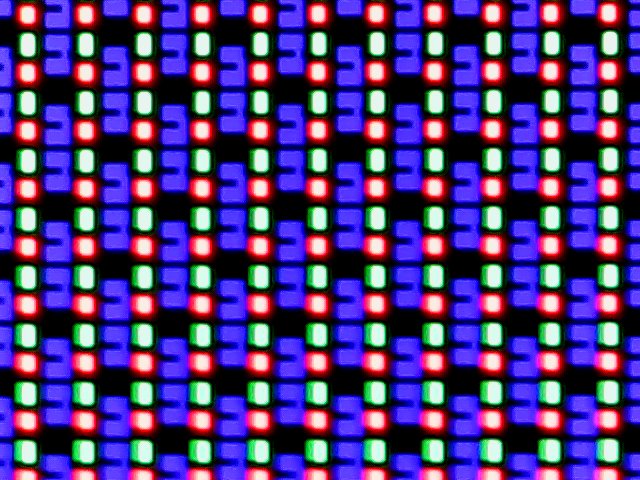
华硕保持了Zenbook S 13的显示规格,没有任何变化,因为它继续使用刷新率为60 Hz的13.3英寸OLED触摸屏。分辨率为2,880 x 1,800像素,主观的图像质量继续保持优秀。此外,没有像联想一些机型的2.8K OLED面板那样的闪光效应(摩尔纹效应)。面板ID是新的,根据华硕的说法,这是一个稍薄的面板。
就亮度而言,我们仍然要区分常规SDR和HDR内容。在SDR操作中,最大亮度为~360 cd/m²,具有优秀的OLED典型亮度分布。同时,黑值为0,造成极高的对比度。在HDR操作中,我们测得的最大亮度为589 cd/m²,略高于550 cd/m²的规格。自去年以来,Windows糟糕的HDR实施没有任何改变。HDR必须手动激活,届时将不再有任何色彩配置文件可用。在OLED显示器中没有屏幕出血,而黑色的图像只是完全的黑色。
| |||||||||||||||||||||||||
Brightness Distribution: 98 %
Center on Battery: 361 cd/m²
Contrast: ∞:1 (Black: 0 cd/m²)
ΔE ColorChecker Calman: 1.2 | ∀{0.5-29.43 Ø4.71}
ΔE Greyscale Calman: 1.2 | ∀{0.09-98 Ø4.96}
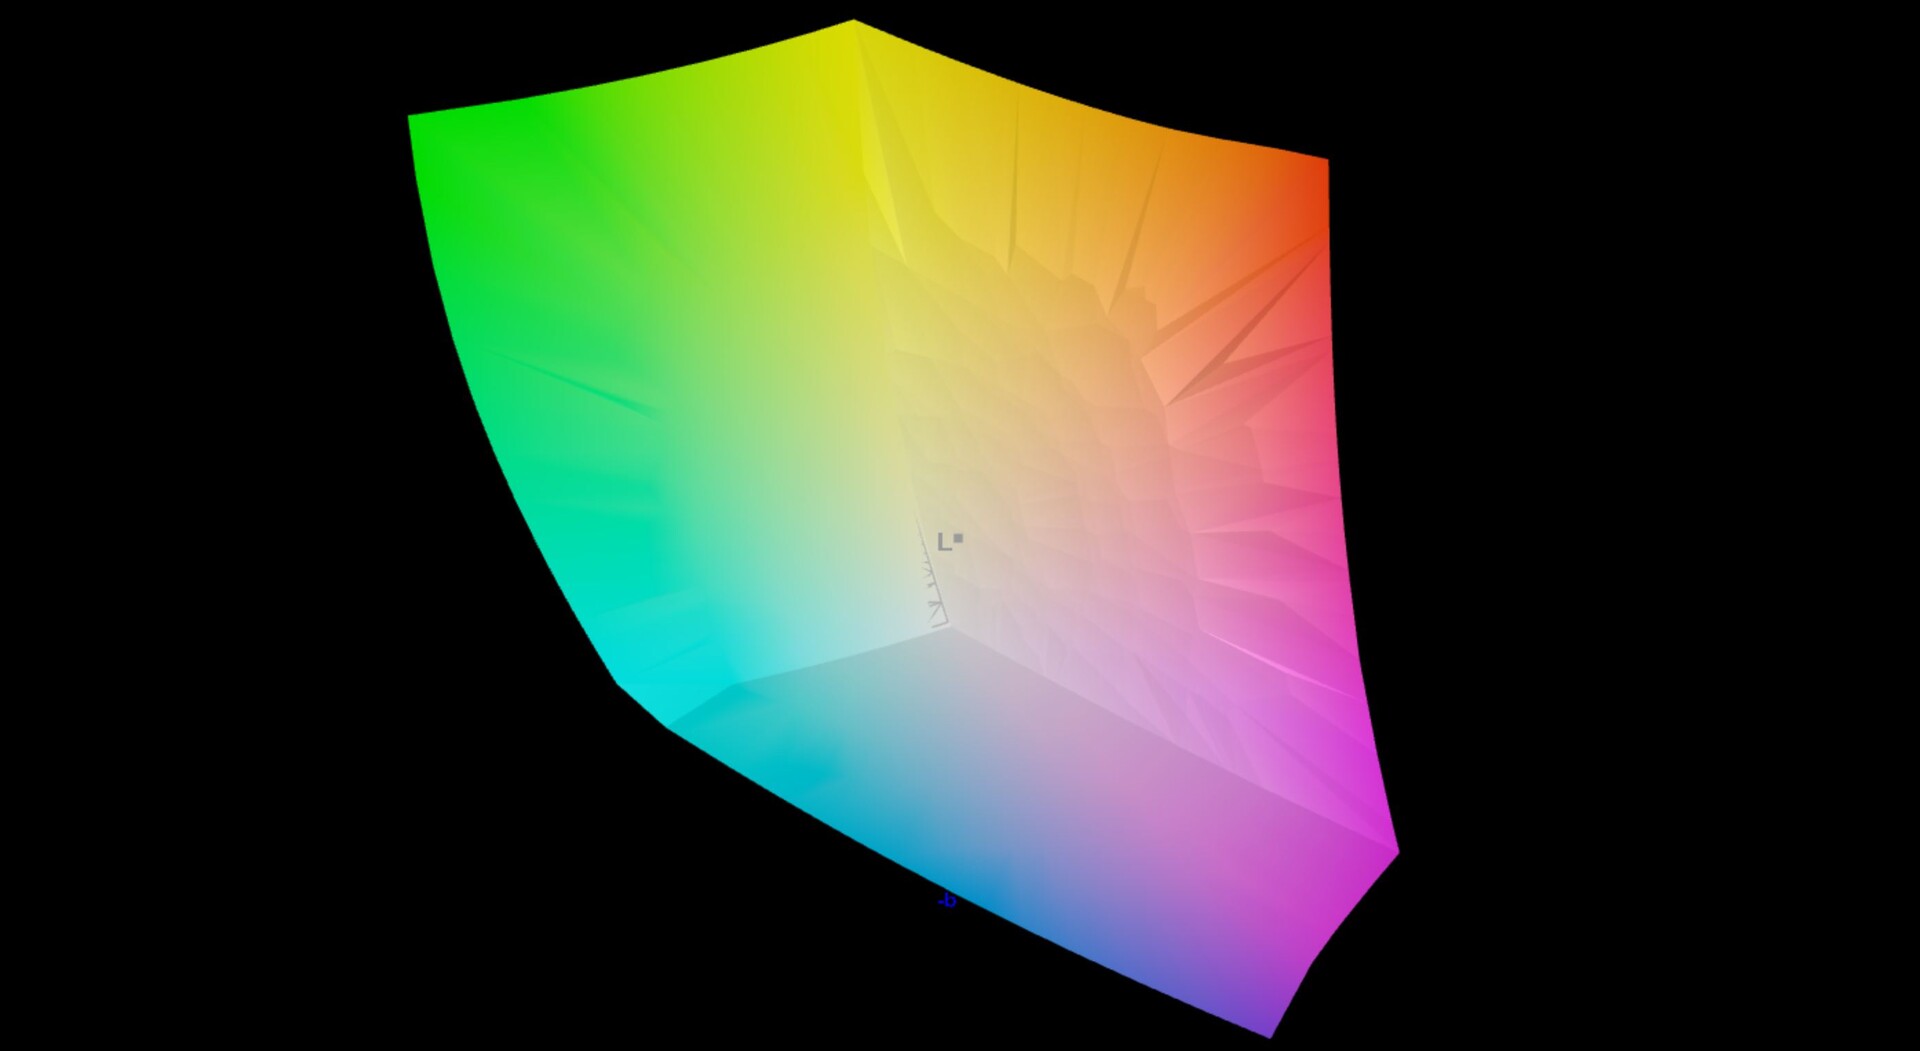
96.9% AdobeRGB 1998 (Argyll 3D)
100% sRGB (Argyll 3D)
99.7% Display P3 (Argyll 3D)
Gamma: 2.27
CCT: 6486 K
| Asus ZenBook S13 OLED UX5304 SDC417B, OLED, 2880x1800, 13.3" | Asus Zenbook S 13 OLED SDC4172, OLED, 2880x1800, 13.3" | Apple MacBook Air M2 Entry IPS, 2560x1664, 13.6" | Lenovo Yoga Slim 7 Carbon 13IAP7-82U9005FGE MND307DA1-9, IPS, 2560x1600, 13.3" | Dell XPS 13 Plus 9320 i7-1280P OLED Samsung 134XK04, OLED, 3456x2160, 13.4" | Samsung Galaxy Book2 Pro 13 NP930XED-KA1DE ATNA33XC10-0, OLED, 1920x1080, 13.3" | |
|---|---|---|---|---|---|---|
| Display | 0% | -4% | -21% | 1% | -0% | |
| Display P3 Coverage (%) | 99.7 | 99.8 0% | 98.4 -1% | 67.3 -32% | 99.5 0% | 99.81 0% |
| sRGB Coverage (%) | 100 | 100 0% | 99.9 0% | 98.9 -1% | 100 0% | 100 0% |
| AdobeRGB 1998 Coverage (%) | 96.9 | 97.8 1% | 87.6 -10% | 69.1 -29% | 98.4 2% | 95.55 -1% |
| Response Times | -5% | -1501% | -1310% | -31% | -63% | |
| Response Time Grey 50% / Grey 80% * (ms) | 2 ? | 2.1 ? -5% | 32.9 ? -1545% | 34 ? -1600% | 2.6 ? -30% | 4 ? -100% |
| Response Time Black / White * (ms) | 1.6 ? | 1.68 ? -5% | 24.9 ? -1456% | 17.9 ? -1019% | 2.1 ? -31% | 2 ? -25% |
| PWM Frequency (Hz) | 240 ? | 240.4 ? | 59.5 | 61 ? | ||
| Screen | -23% | -8% | -9% | -64% | -22% | |
| Brightness middle (cd/m²) | 361 | 336 -7% | 526 46% | 391 8% | 371.8 3% | 399 11% |
| Brightness (cd/m²) | 365 | 338 -7% | 486 33% | 362 -1% | 374 2% | 403 10% |
| Brightness Distribution (%) | 98 | 99 1% | 87 -11% | 87 -11% | 98 0% | 98 0% |
| Black Level * (cd/m²) | 0.02 | 0.38 | 0.26 | 0.07 | ||
| Colorchecker dE 2000 * | 1.2 | 1.8 -50% | 1.3 -8% | 1 17% | 2.37 -98% | 1.35 -13% |
| Colorchecker dE 2000 max. * | 1.9 | 3.8 -100% | 2.7 -42% | 2.4 -26% | 6.1 -221% | 2.77 -46% |
| Greyscale dE 2000 * | 1.2 | 0.9 25% | 2 -67% | 1.7 -42% | 2 -67% | 2.35 -96% |
| Gamma | 2.27 97% | 2.22 99% | 2.25 98% | 2.22 99% | 2.29 96% | 2.21 100% |
| CCT | 6486 100% | 6580 99% | 6858 95% | 6808 95% | 6261 104% | 6824 95% |
| Contrast (:1) | 16800 | 1384 | 1504 | 5700 | ||
| Colorchecker dE 2000 calibrated * | 1.8 | 0.7 | 1.35 | |||
| Total Average (Program / Settings) | -9% /
-13% | -504% /
-278% | -447% /
-249% | -31% /
-40% | -28% /
-24% |
* ... smaller is better

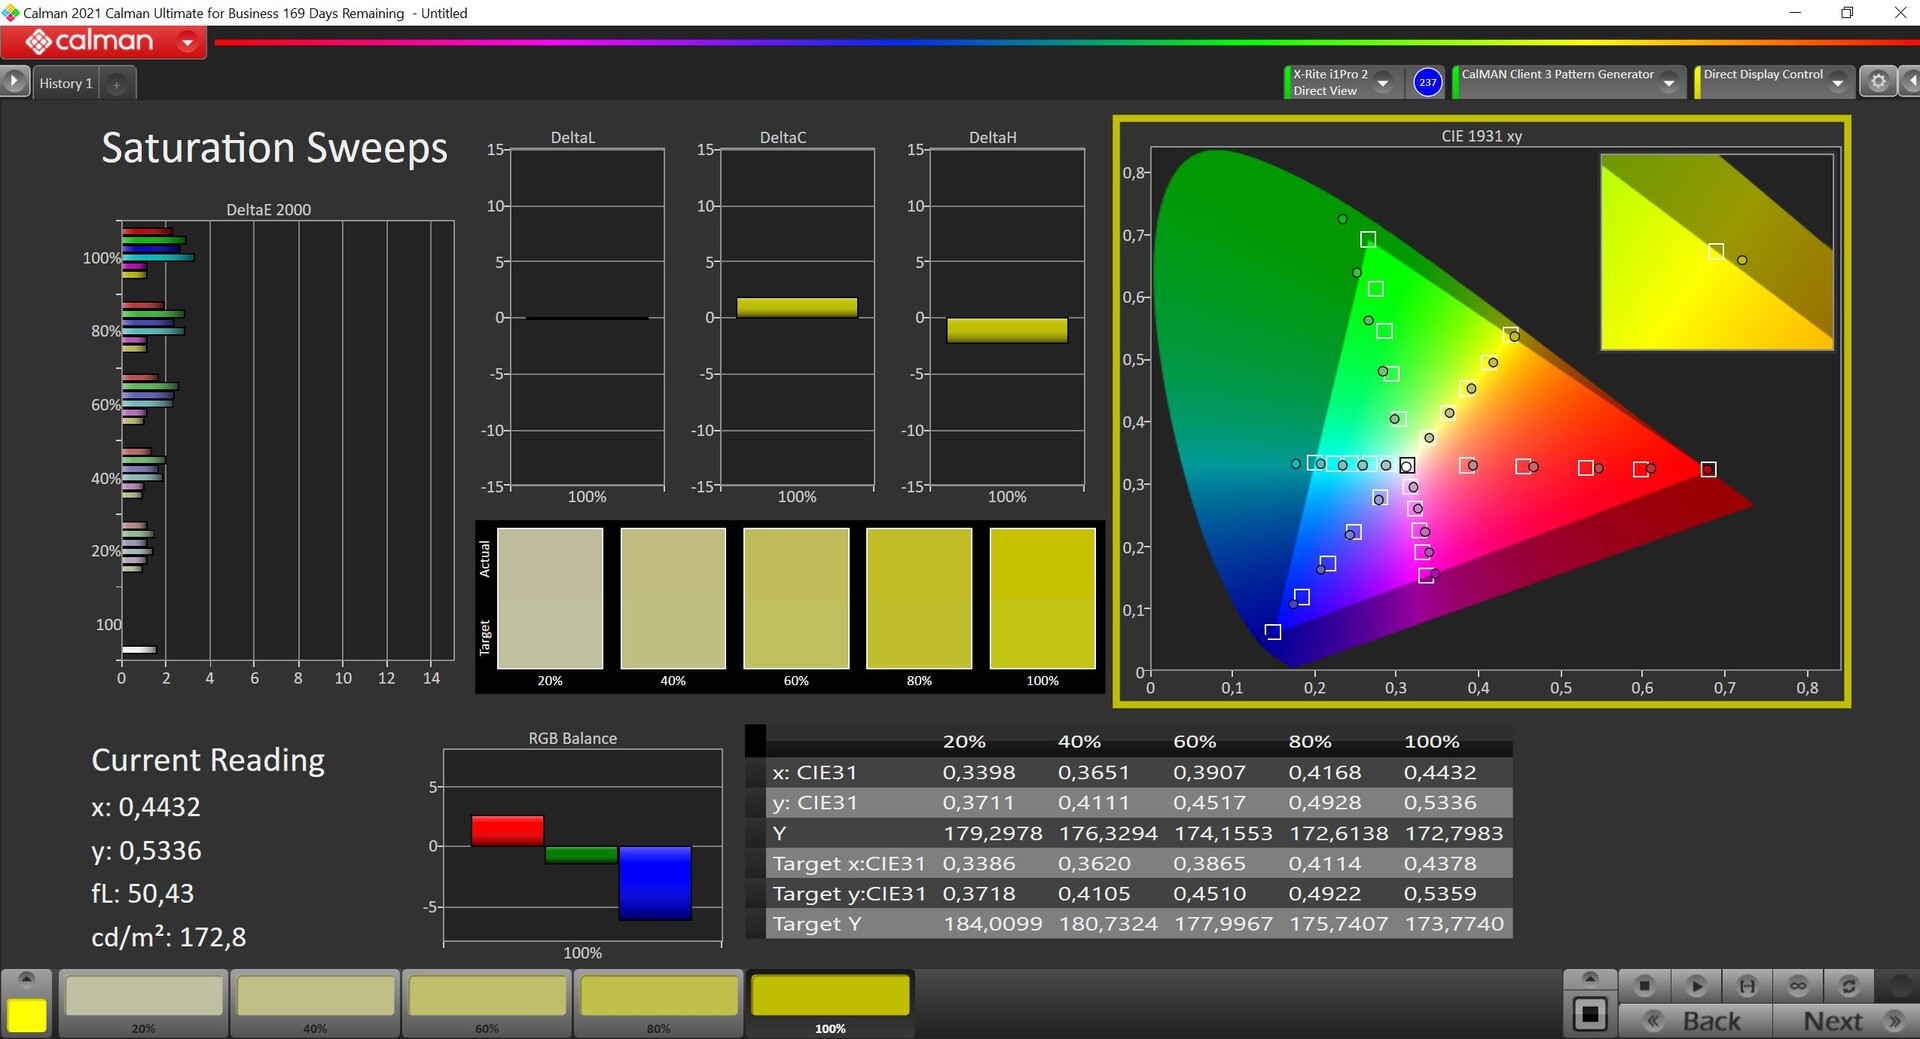
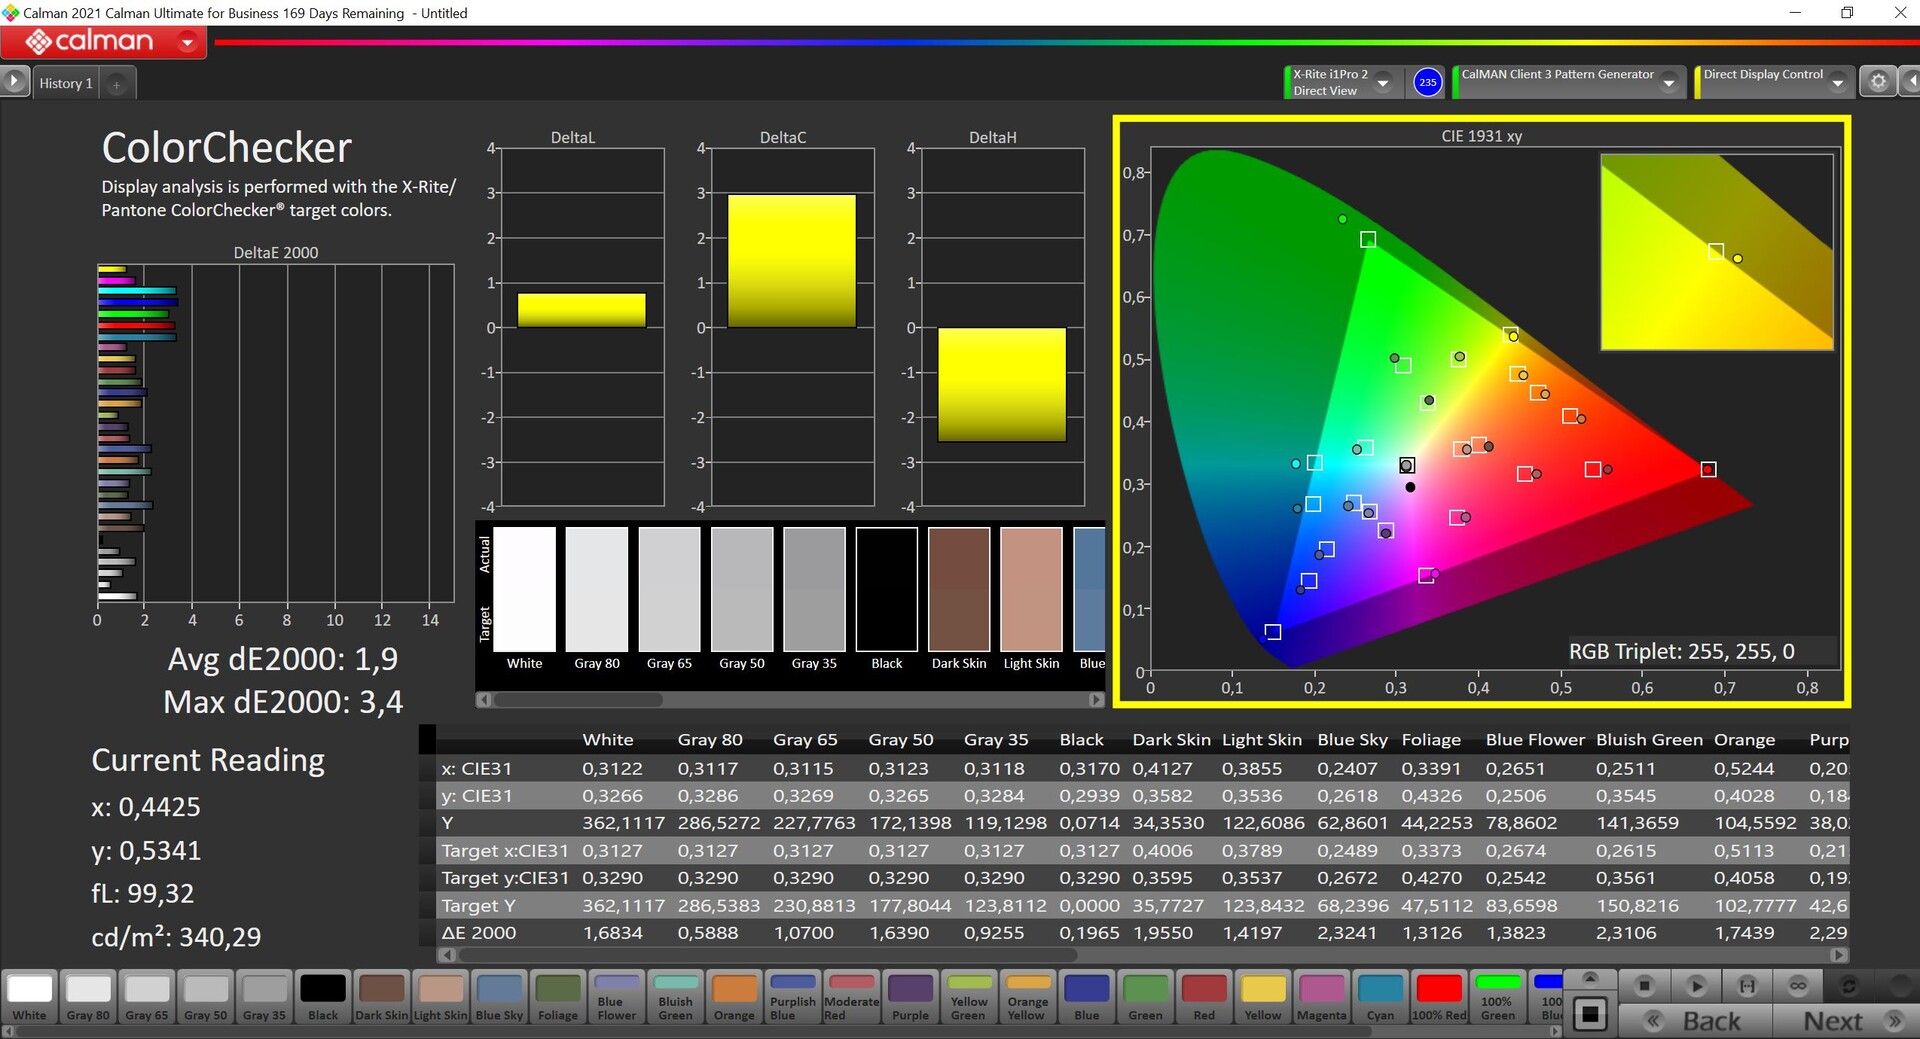

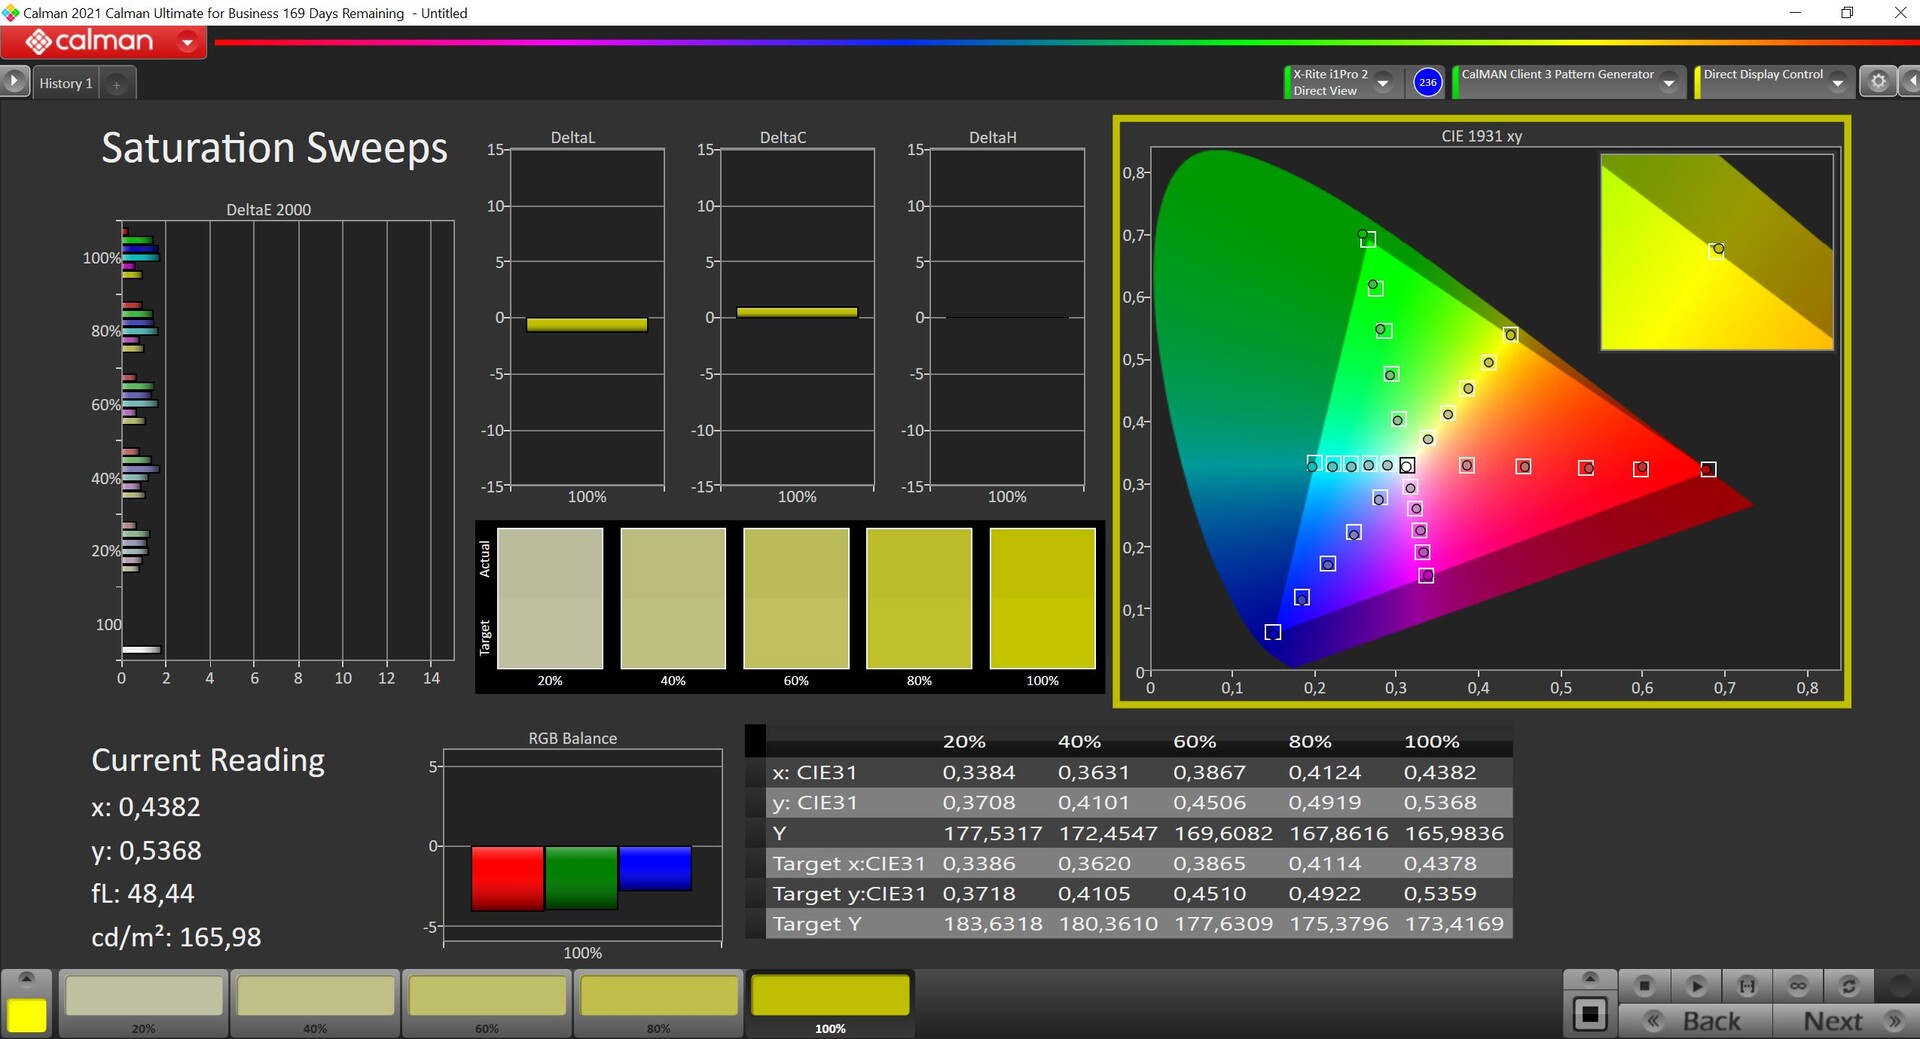
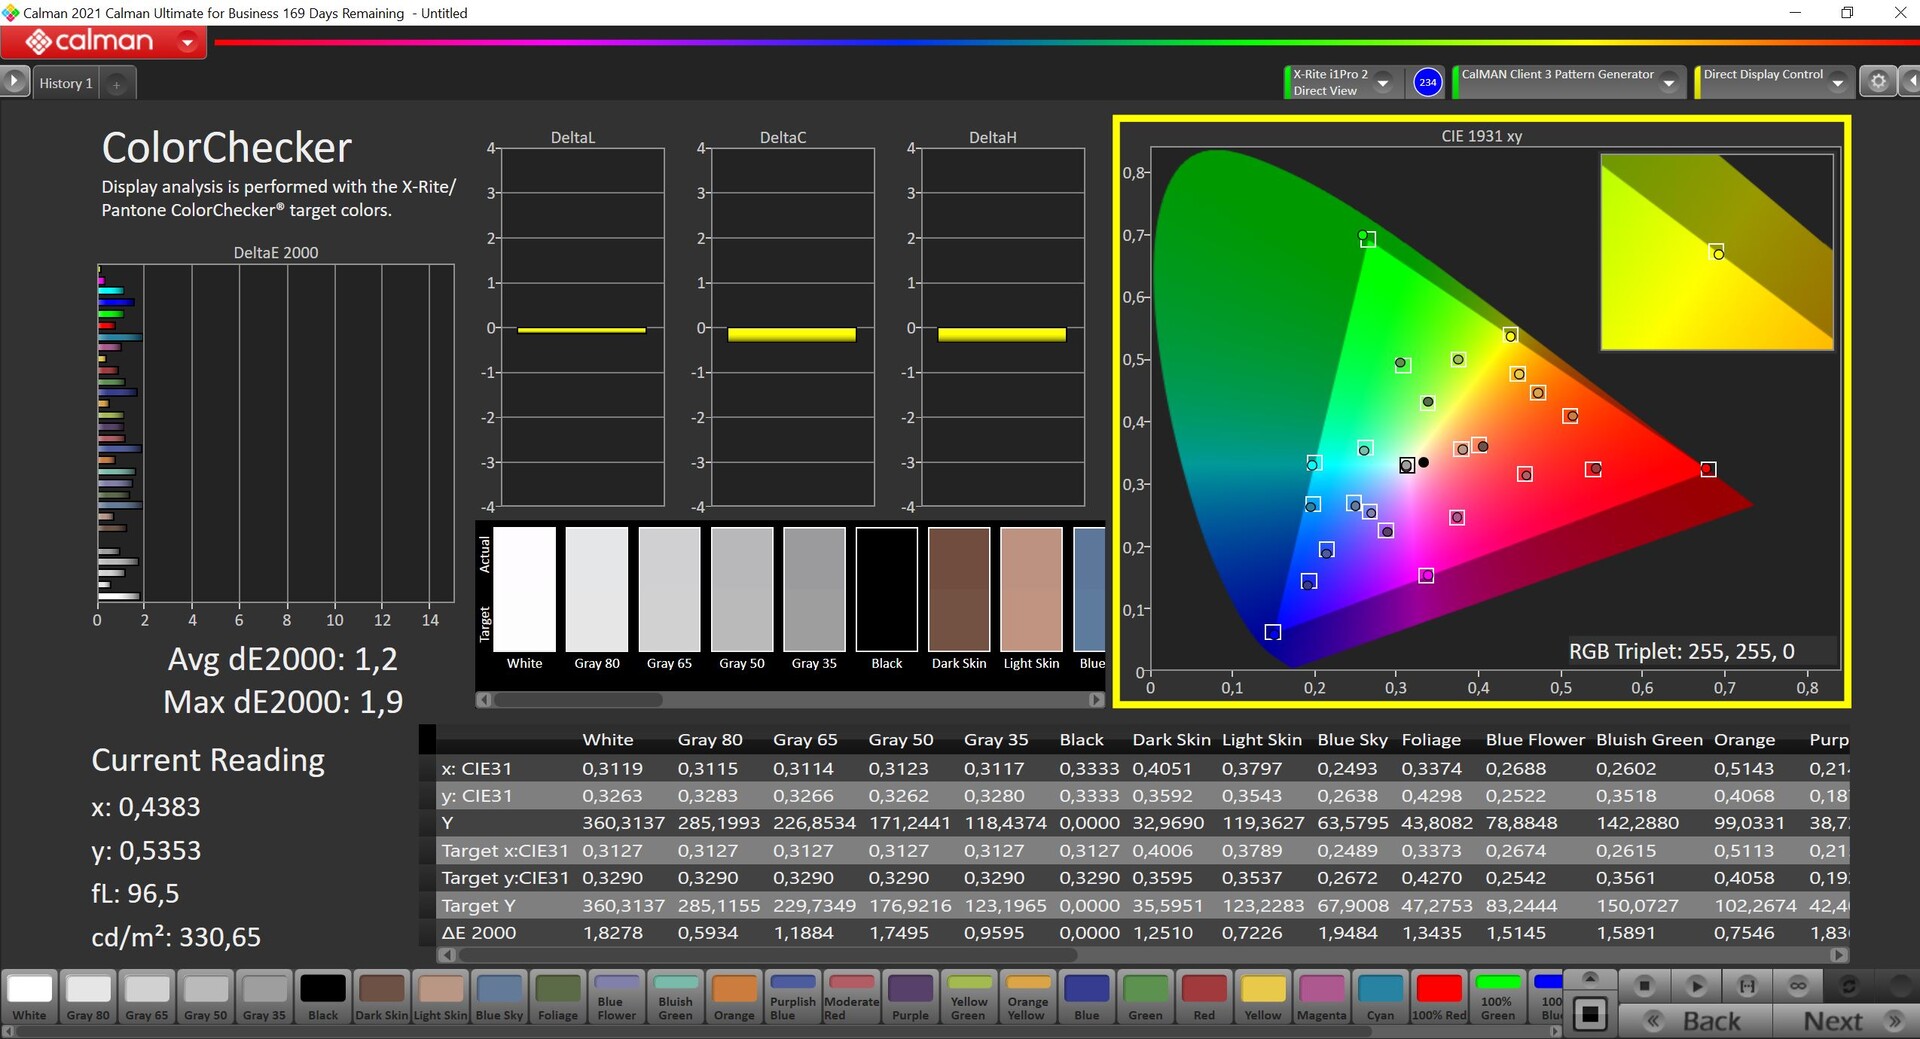
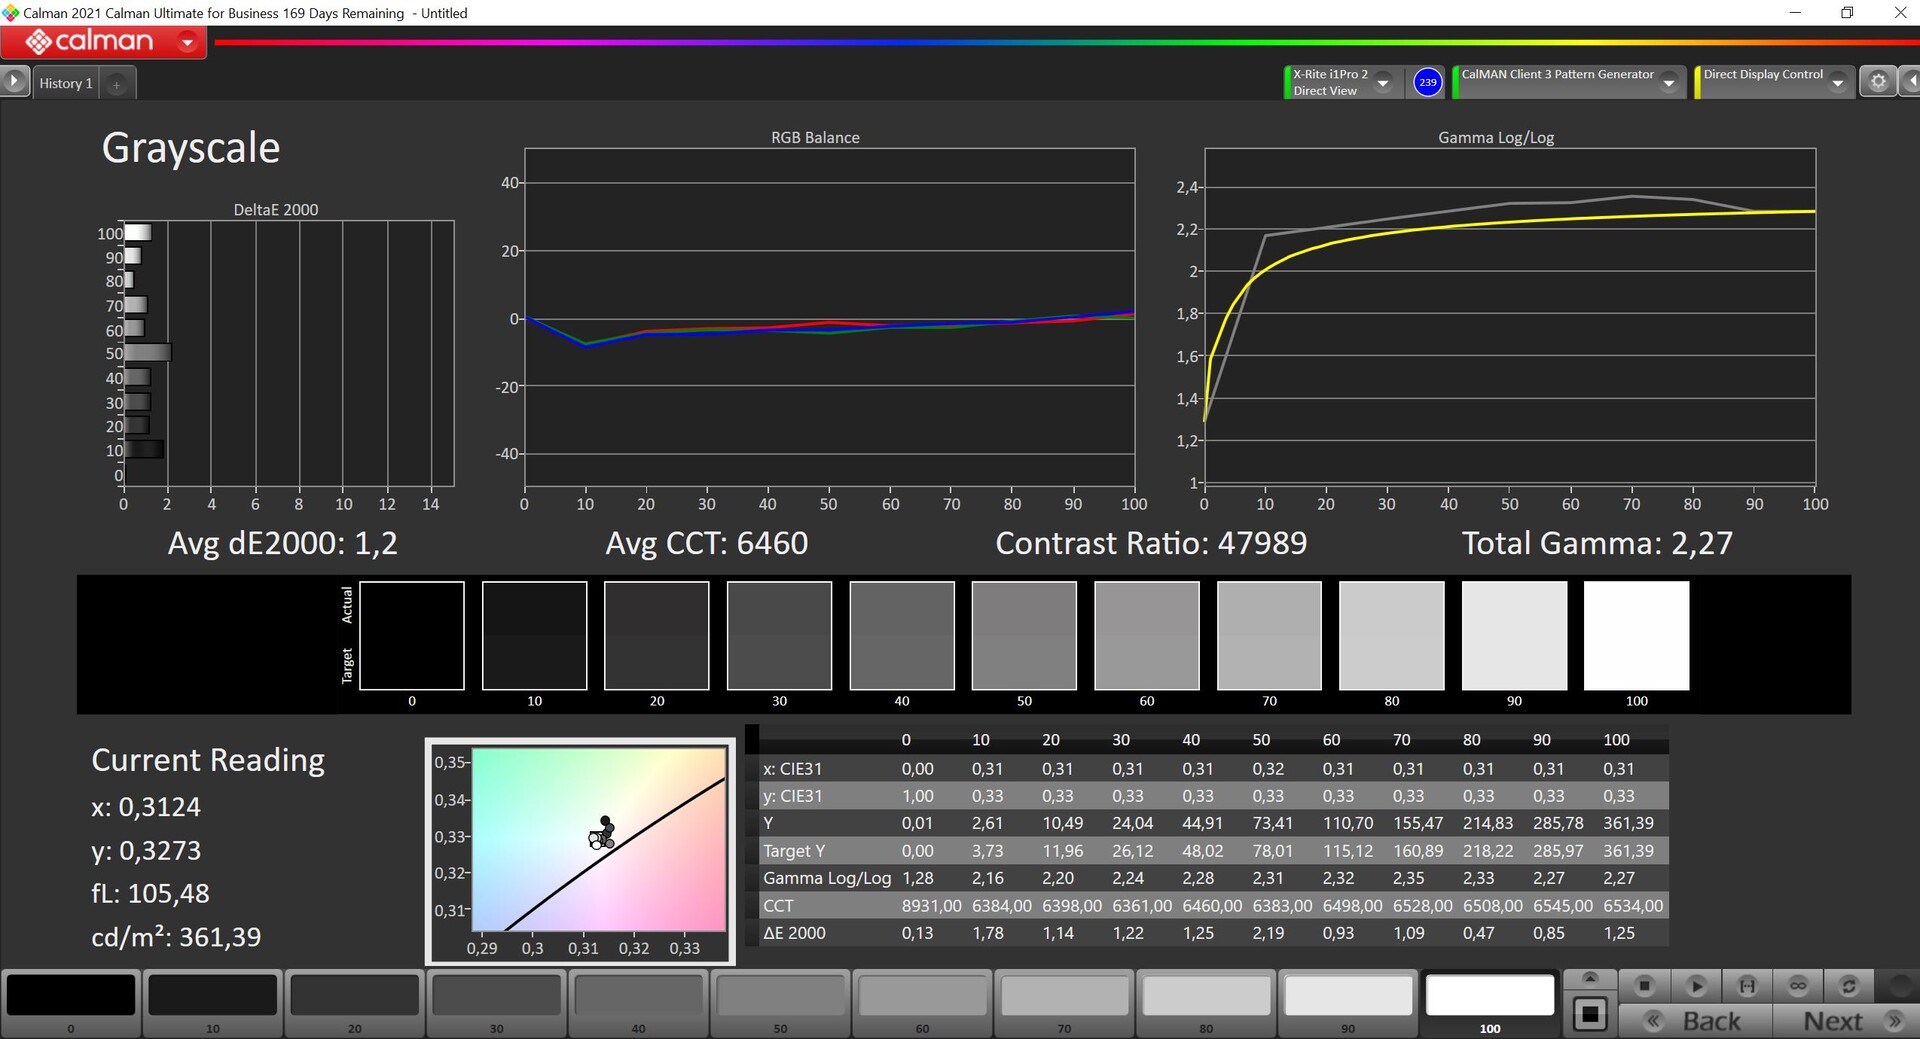
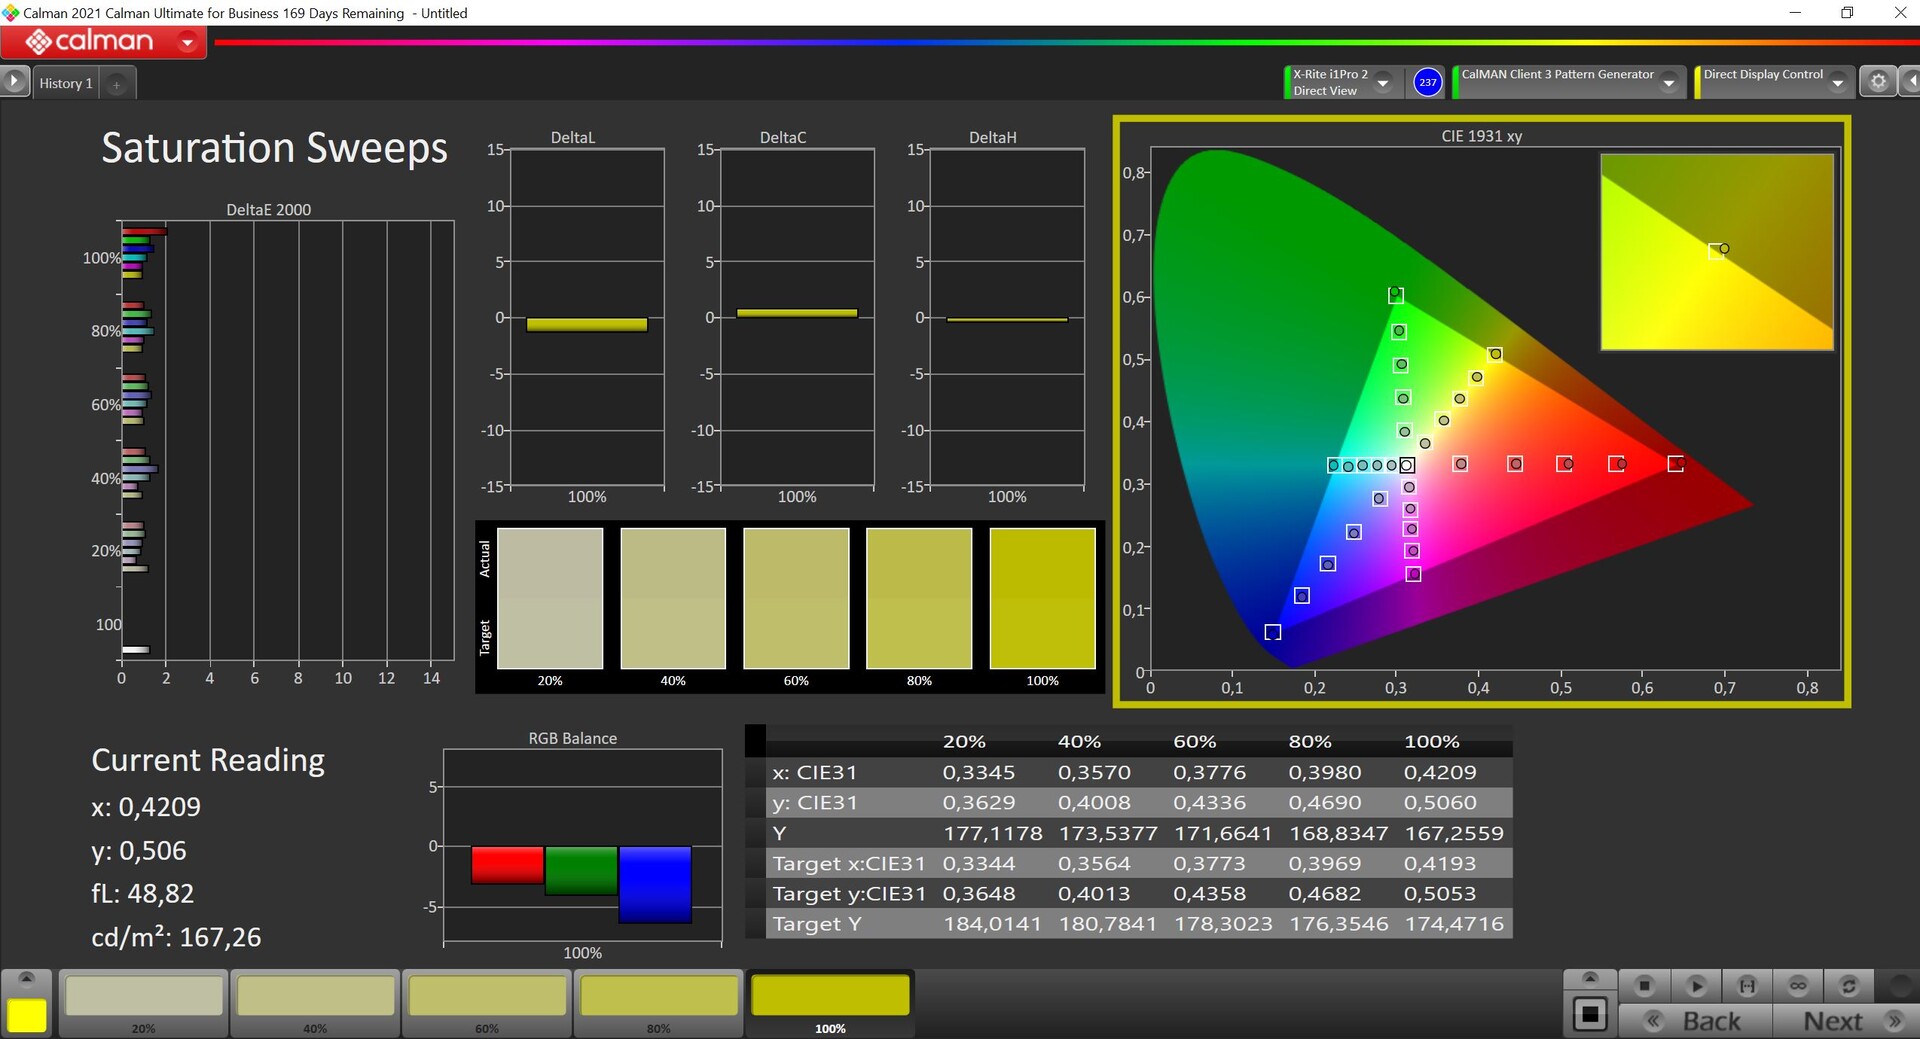
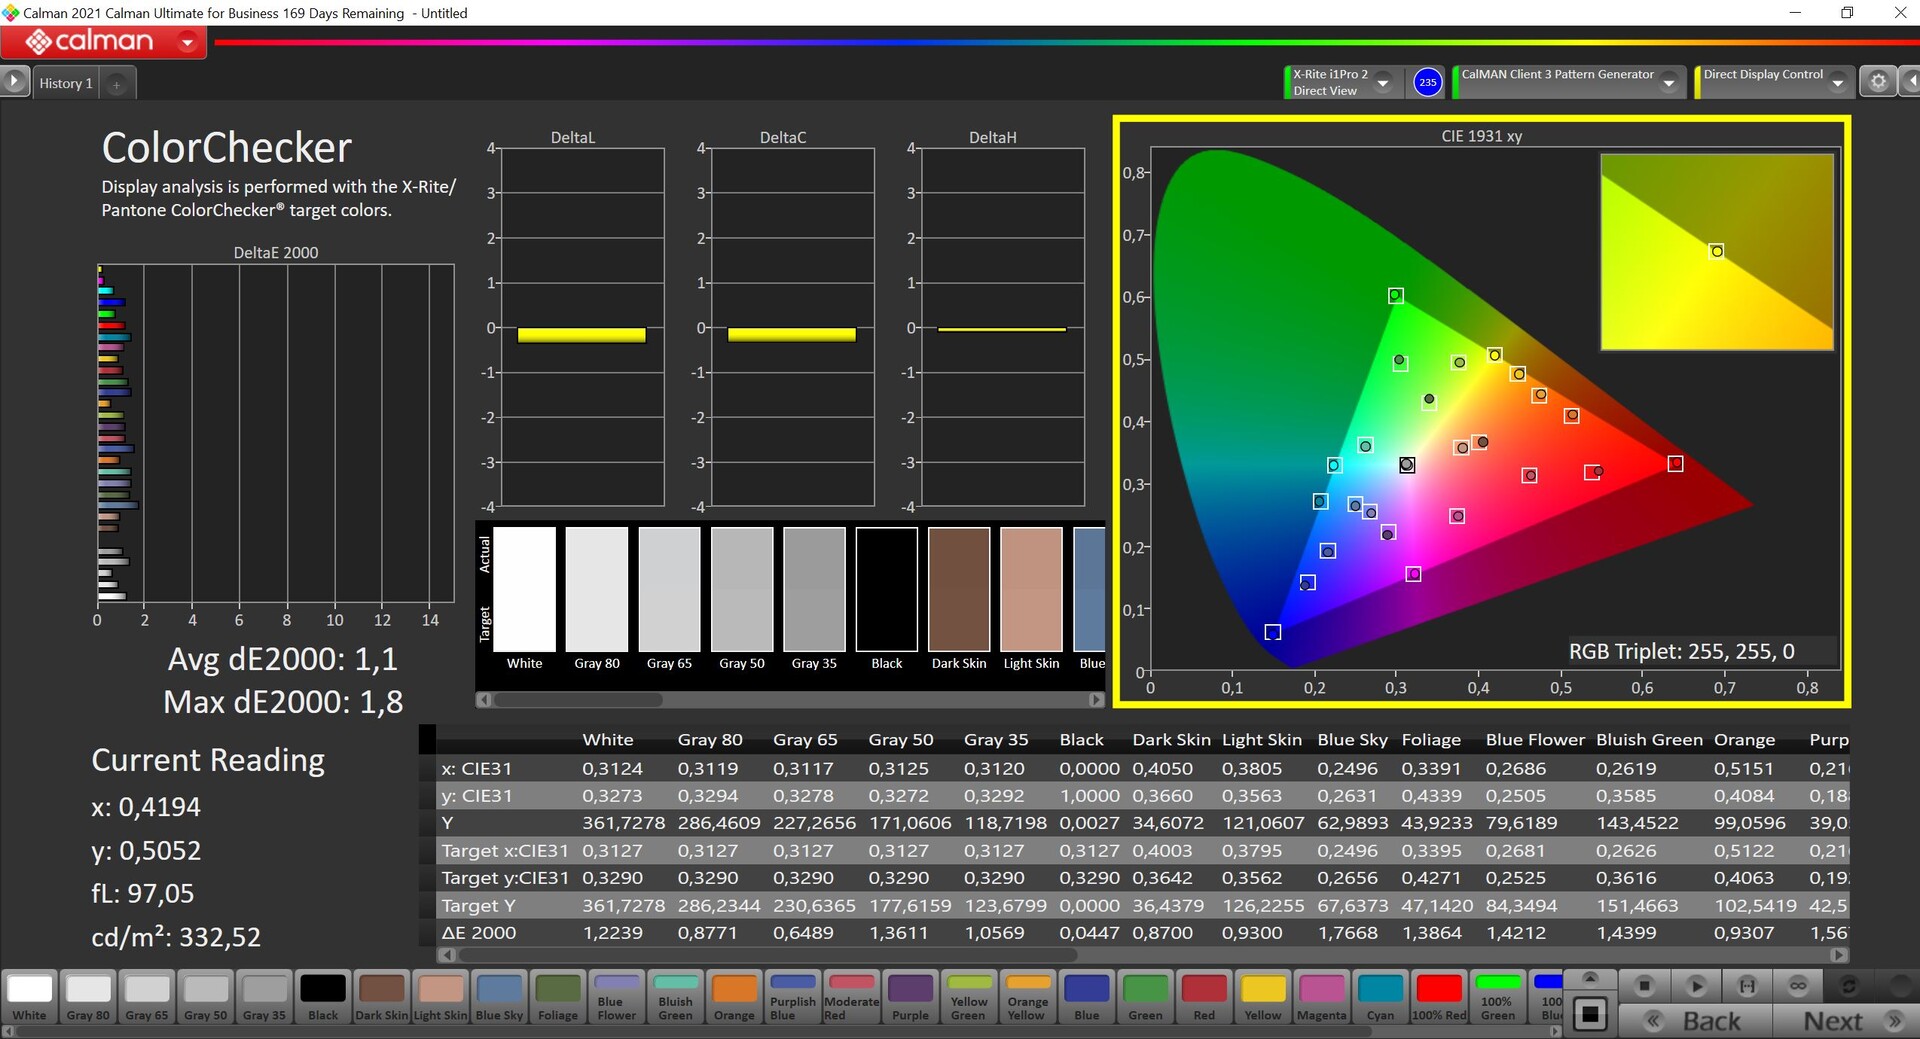
预装的MyAsus应用程序提供了各种颜色配置文件,我们用专业的CalMAN软件进行了测量。默认情况下,"本地 "配置文件被激活,它再现的颜色略微过于饱和,使图像主观上看起来更鲜艳一些。此外,如果你想在相应的色彩空间中处理图像,Display-P3和sRGB也有两个极其准确的配置文件。这两个配置文件在交付状态下已经得到了极好的校准,因此,我们无法通过自己的校准来进一步改善显示效果。 再加上几乎完整的P3色彩空间覆盖,这在整体上是非常出色的表现。
Display Response Times
| ↔ Response Time Black to White | ||
|---|---|---|
| 1.6 ms ... rise ↗ and fall ↘ combined | ↗ 0.8 ms rise | 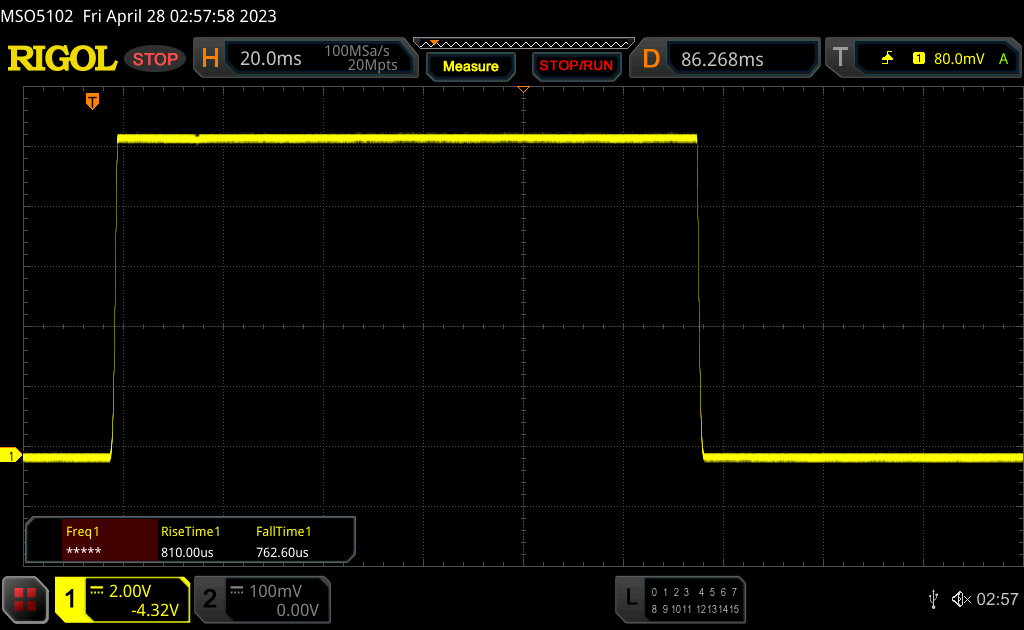 |
| ↘ 0.8 ms fall | ||
| The screen shows very fast response rates in our tests and should be very well suited for fast-paced gaming. In comparison, all tested devices range from 0.1 (minimum) to 240 (maximum) ms. » 10 % of all devices are better. This means that the measured response time is better than the average of all tested devices (19.8 ms). | ||
| ↔ Response Time 50% Grey to 80% Grey | ||
| 2 ms ... rise ↗ and fall ↘ combined | ↗ 1.1 ms rise | 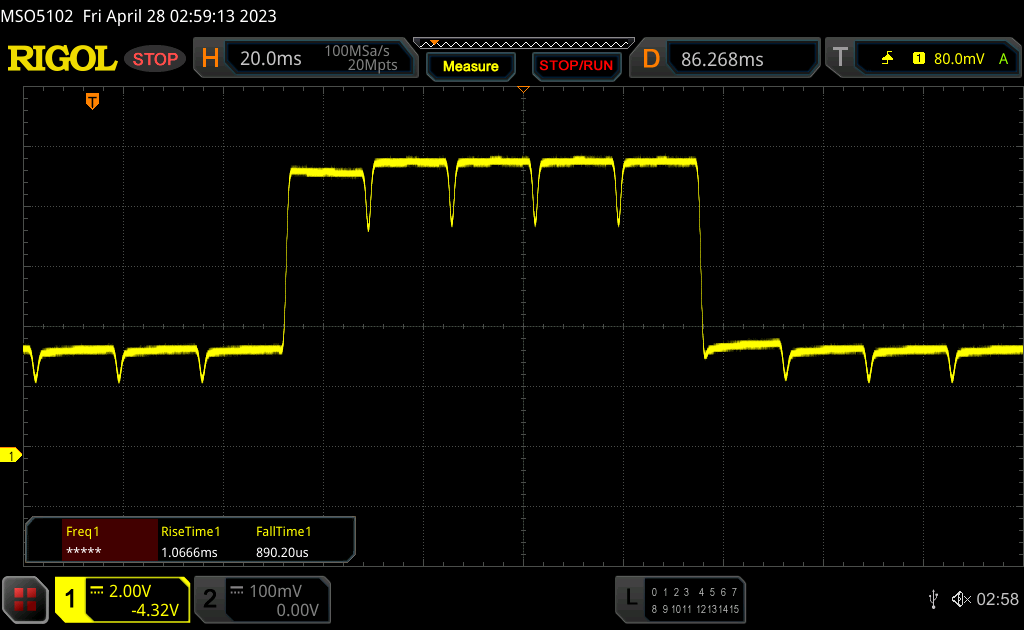 |
| ↘ 0.9 ms fall | ||
| The screen shows very fast response rates in our tests and should be very well suited for fast-paced gaming. In comparison, all tested devices range from 0.165 (minimum) to 636 (maximum) ms. » 10 % of all devices are better. This means that the measured response time is better than the average of all tested devices (31 ms). | ||
Screen Flickering / PWM (Pulse-Width Modulation)
| Screen flickering / PWM detected | 240 Hz | ≤ 57 % brightness setting | 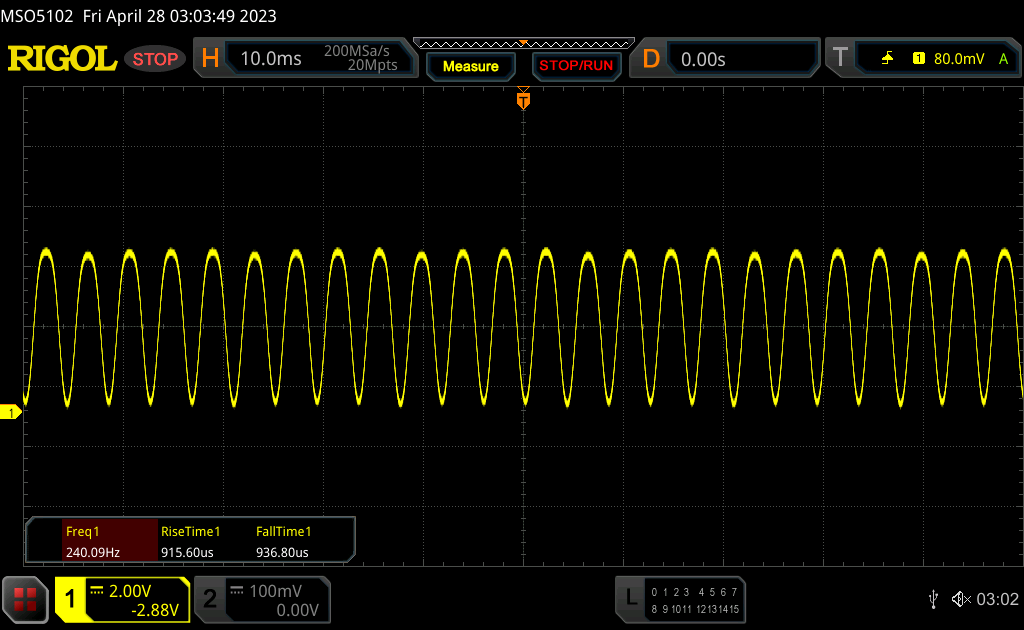 |
| ≤ 88 cd/m² brightness | |||
The display backlight flickers at 240 Hz (worst case, e.g., utilizing PWM) Flickering detected at a brightness setting of 57 % (88 cd/m²) and below. There should be no flickering or PWM above this brightness setting. The frequency of 240 Hz is relatively low, so sensitive users will likely notice flickering and experience eyestrain at the stated brightness setting and below. Flickering occurs at relatively low brightness settings, so extended use at this brightness setting or lower can cause eyestrain. In comparison: 52 % of all tested devices do not use PWM to dim the display. If PWM was detected, an average of 7754 (minimum: 5 - maximum: 343500) Hz was measured. | |||
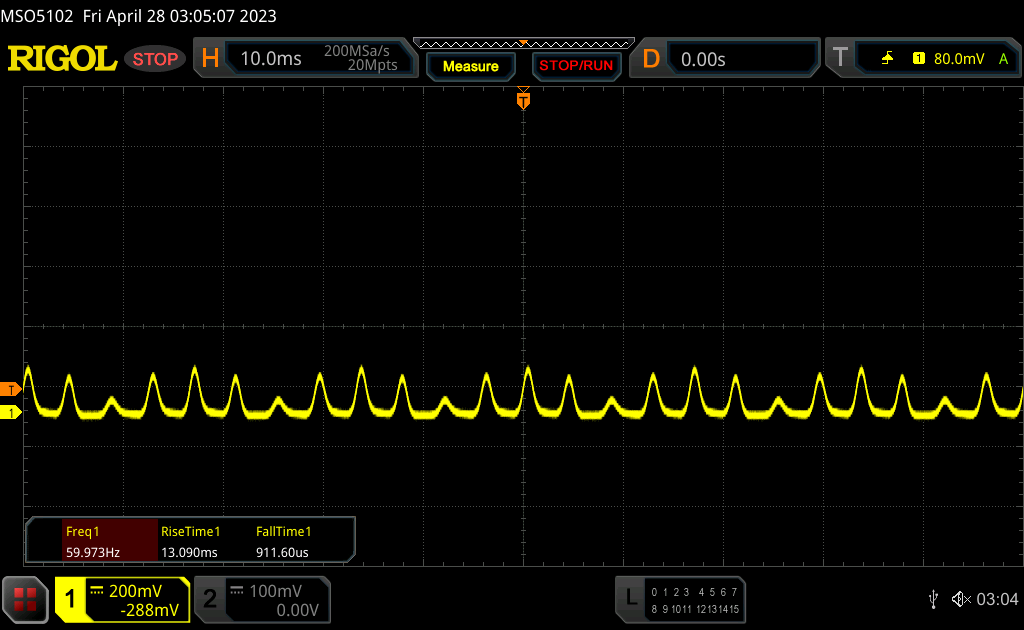
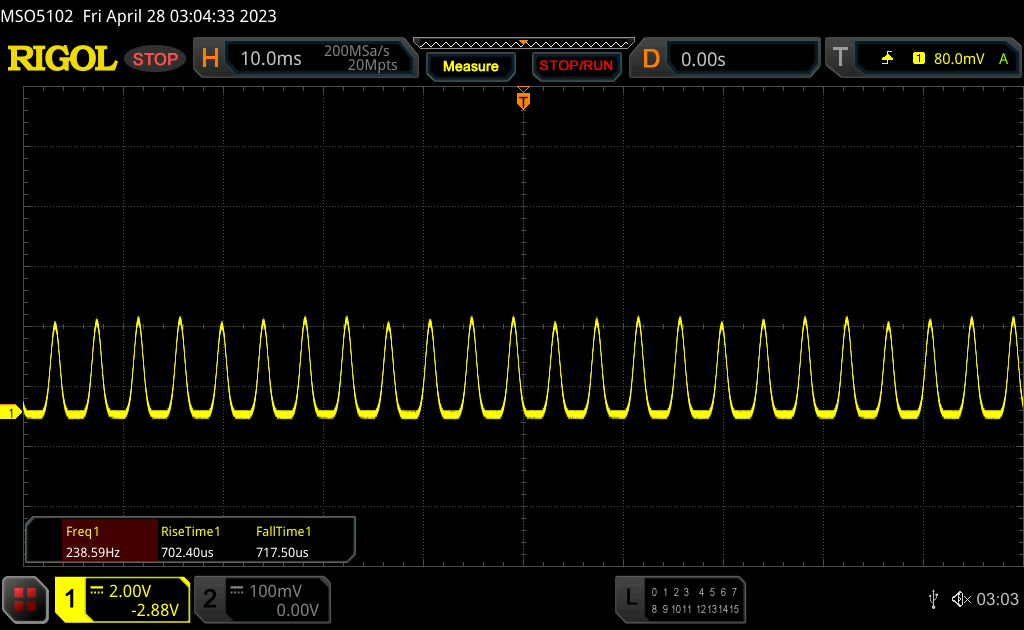
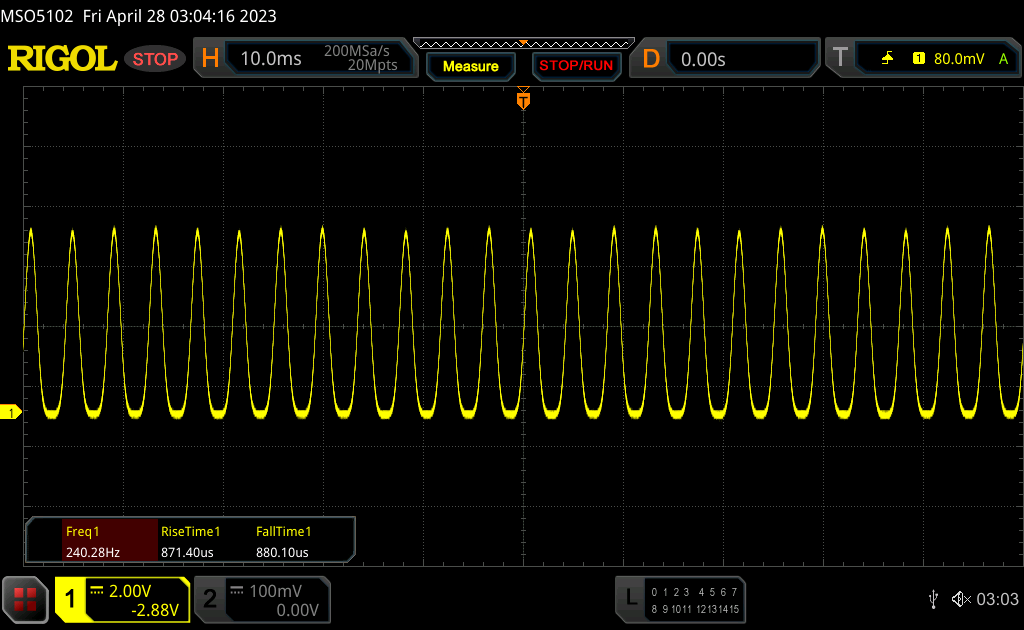
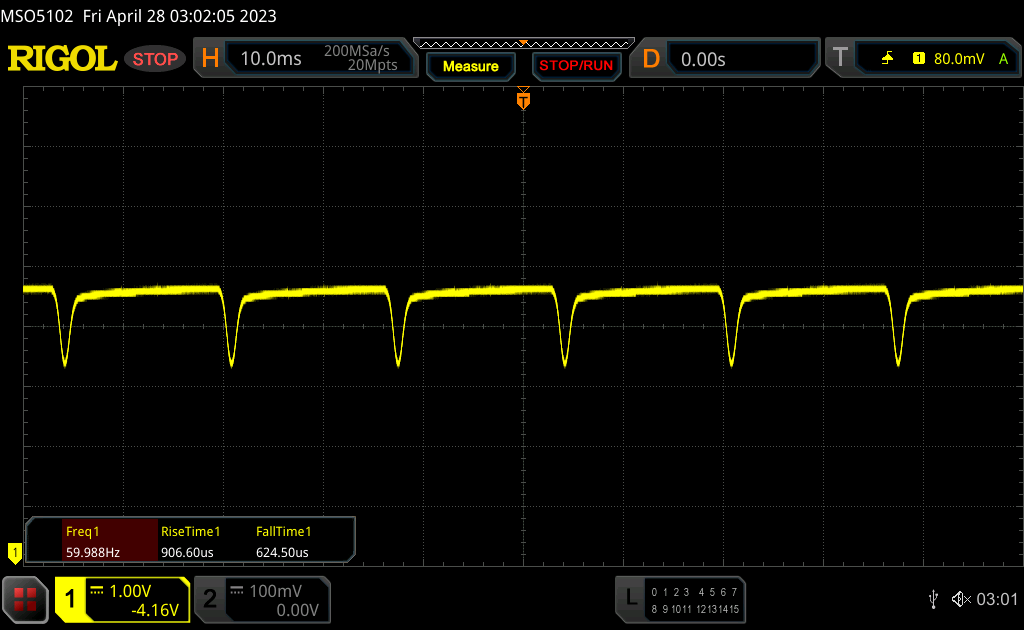
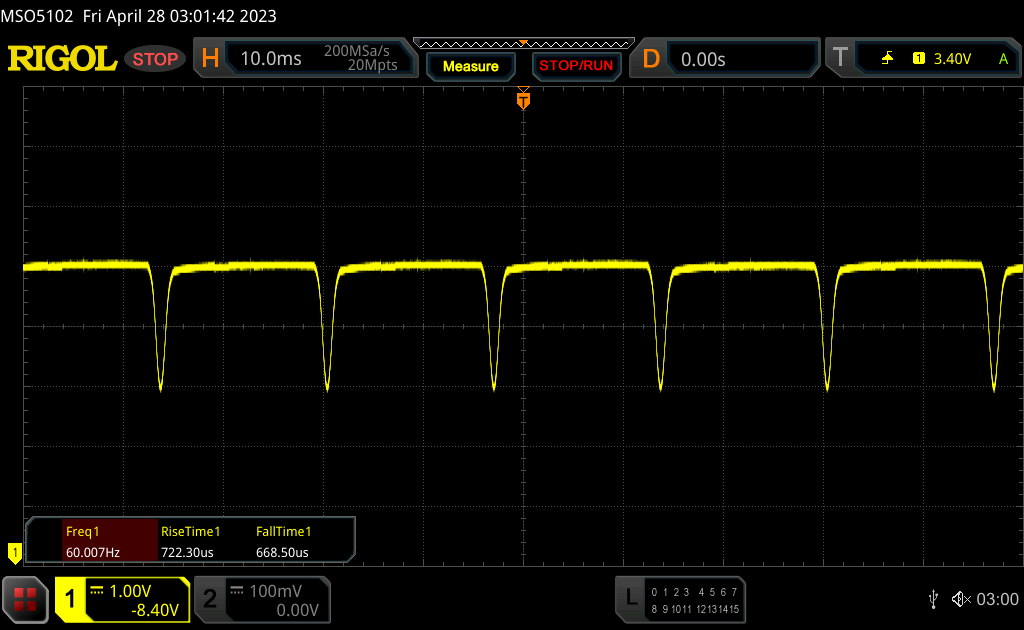
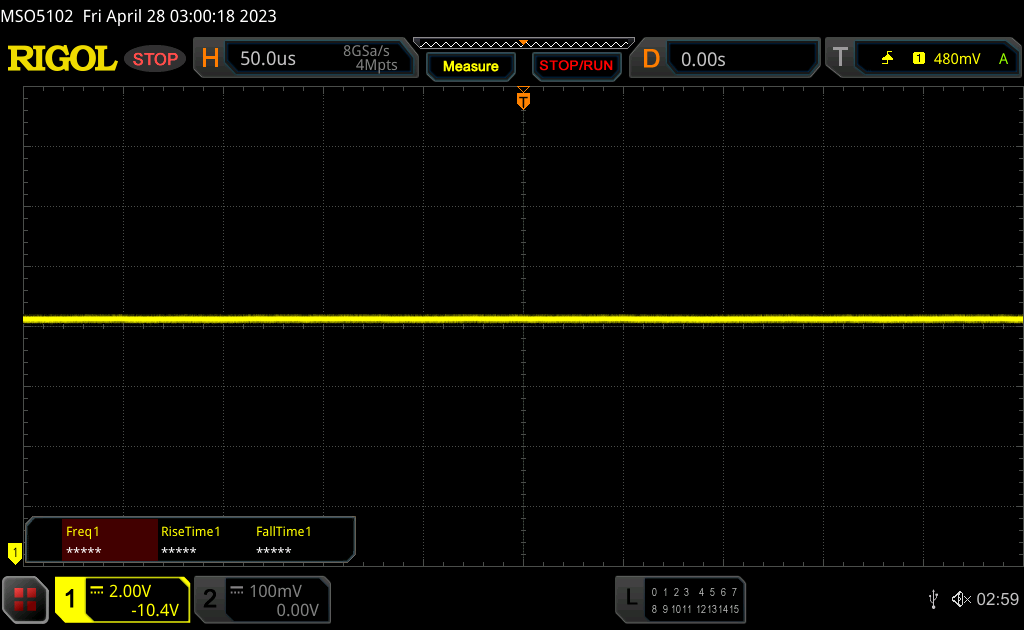
我们必须更详细地讨论PWM问题,因为有几个因素需要考虑,就像前者一样。在100%的亮度下,没有PWM;在58-99%的范围内,使用60赫兹的直流调光;从57%(88cd/m²)和更低的亮度开始,是经典的、可能更有害的240赫兹的PWM闪动。最初,60赫兹的直流调光频率听起来比它更糟糕,但由于它的振幅明显较低,你无法与经典的PWM相比,它应该不会造成任何问题。
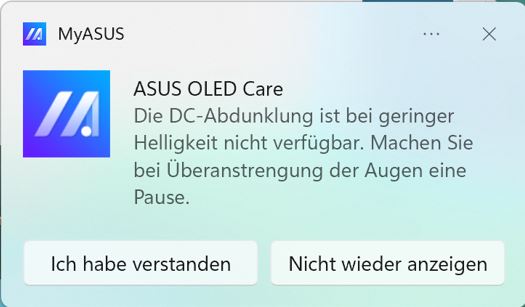
华硕继续提供一个软件解决方案,在不进入有害的PWM区域的情况下降低亮度。华硕称这一功能为 "无闪烁OLED变暗",允许你继续按步骤降低亮度。在实践中,你不应该低于60%的Windows亮度,如果要额外降低,可以用软件代替。尽管华硕在这里提供了一个警告通知,我们当然更喜欢一个更舒适的解决方案,即软件方法直接集成到Windows设置中,用户根本无法进入经典的PWM区域。
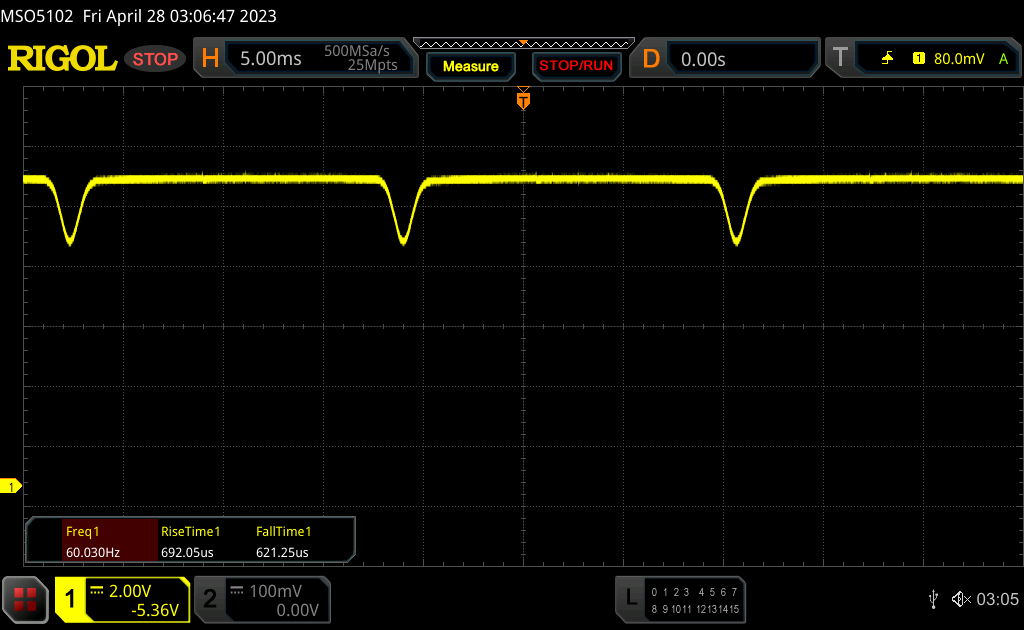
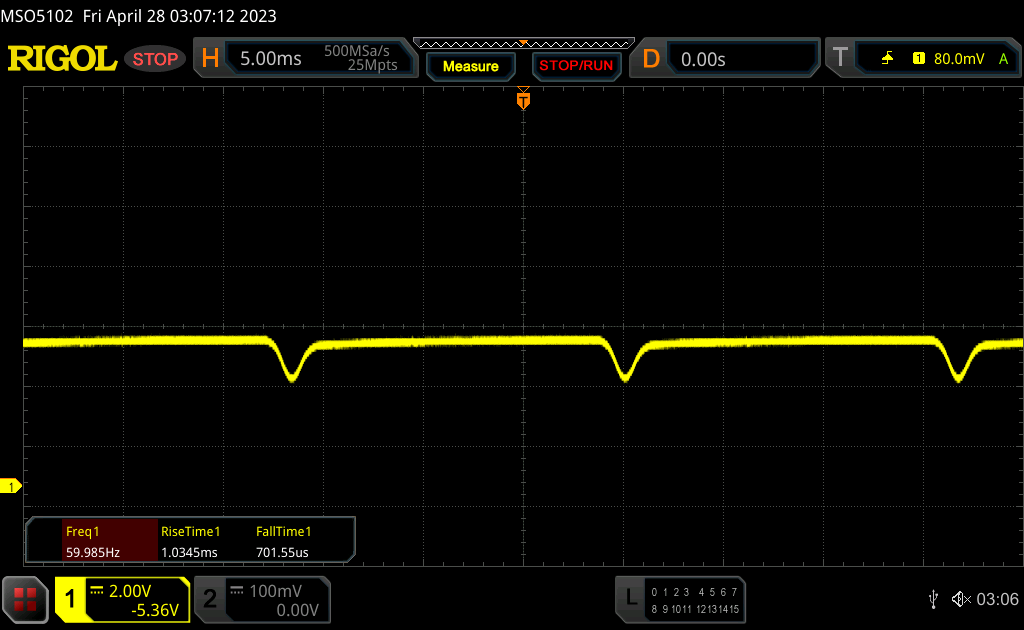
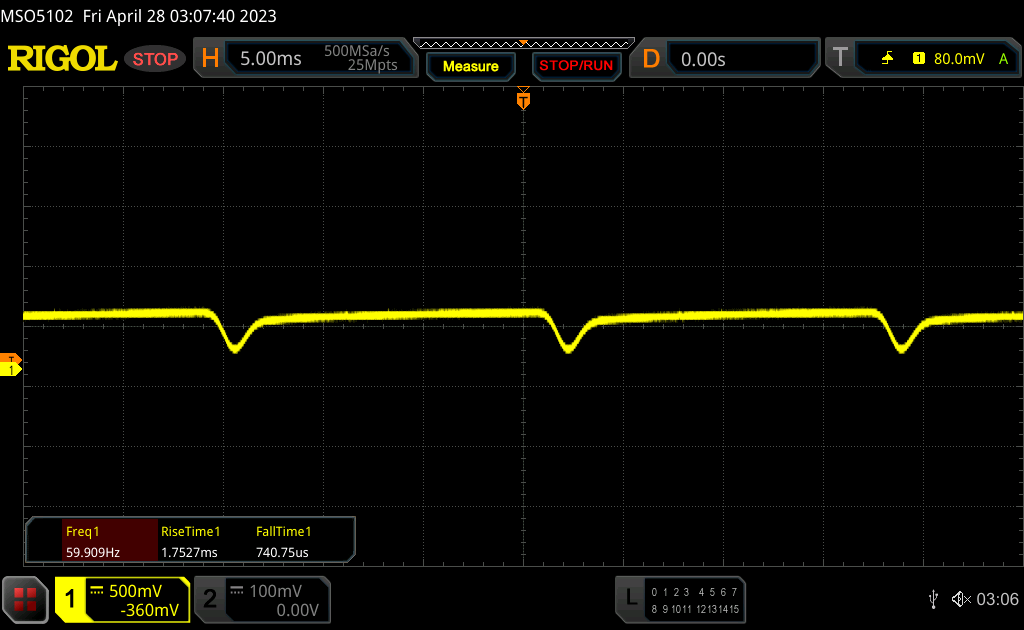
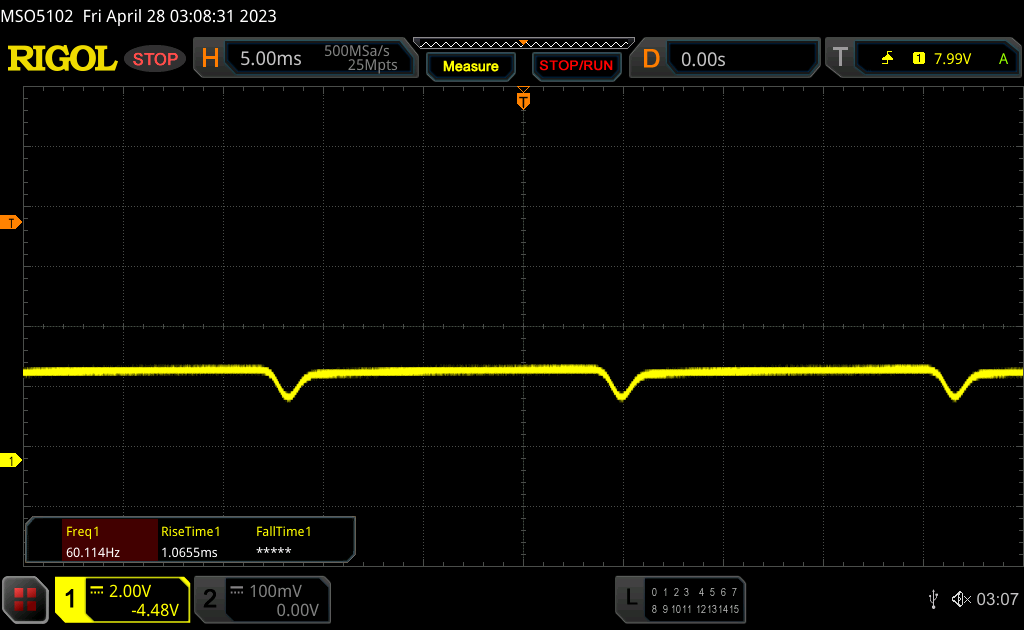
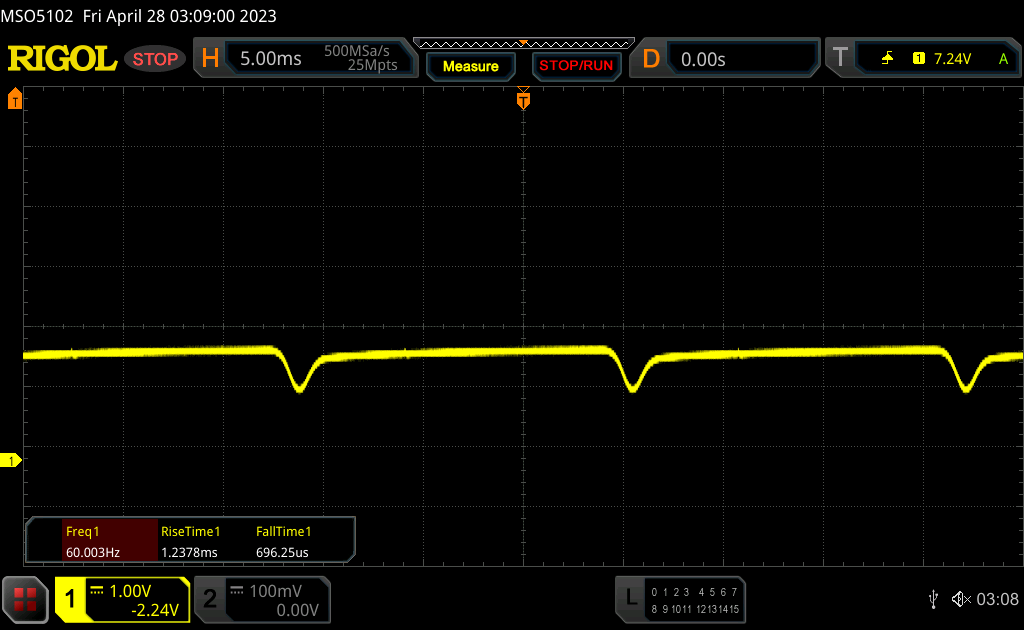
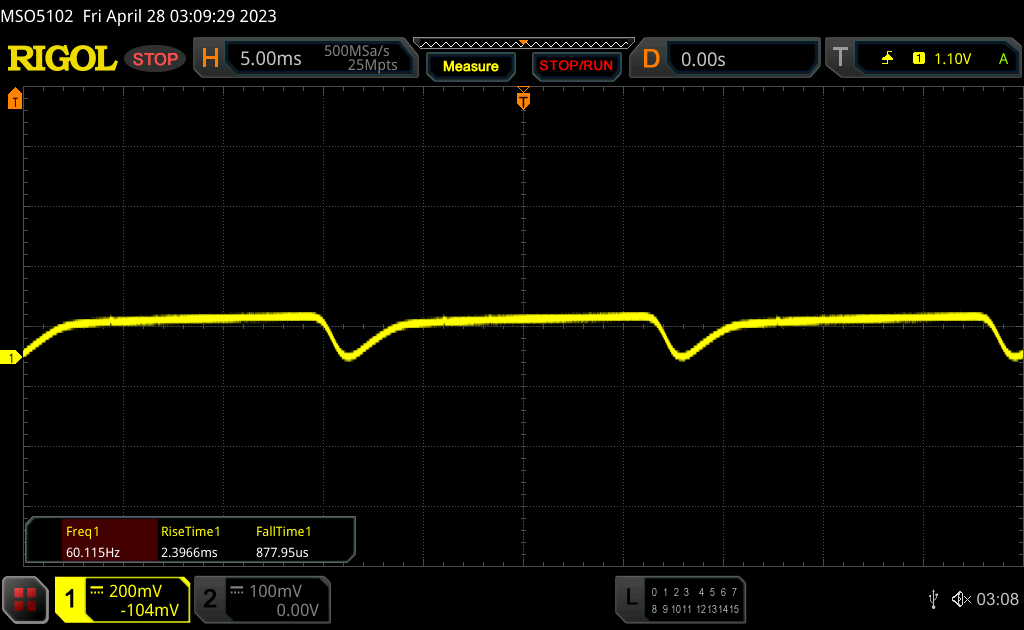
作为例子,我们用两个基本的亮度设置和各种暗调水平测量了几个设置。你可以清楚地看到,通过使用软件变暗,你也可以用直流调光实现较低的亮度水平。
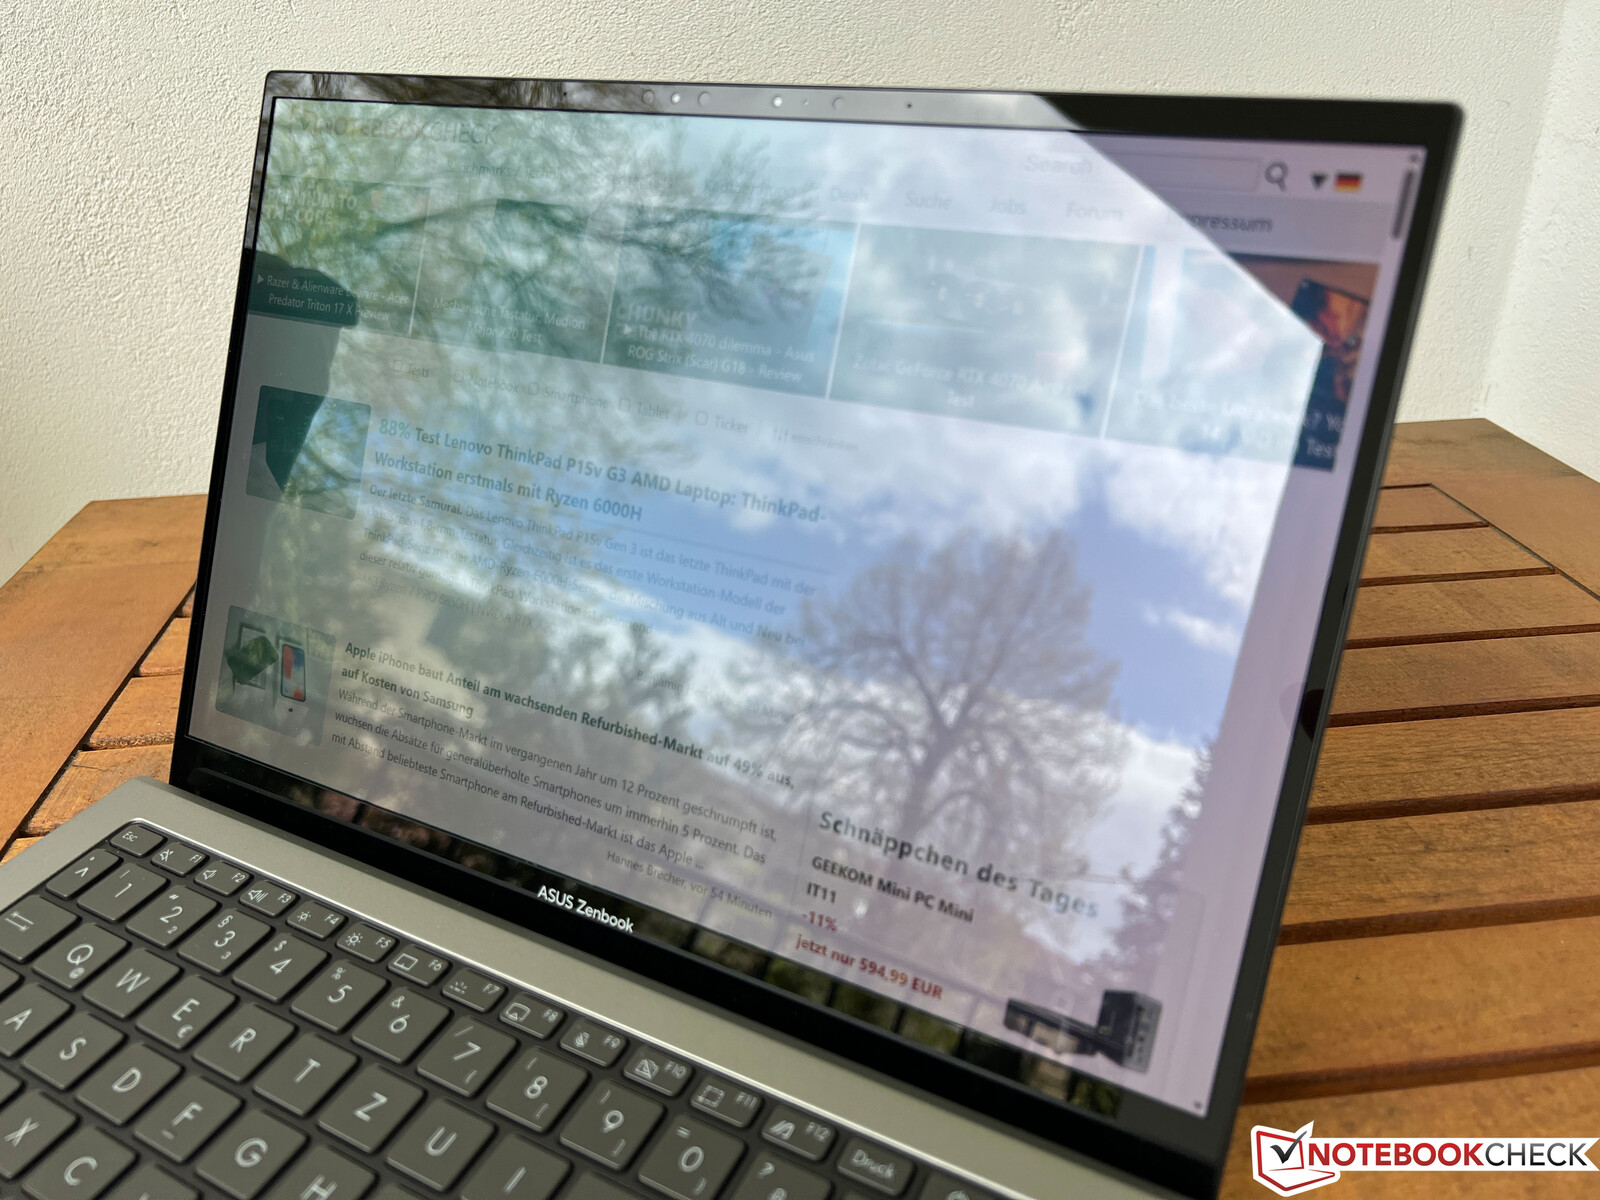
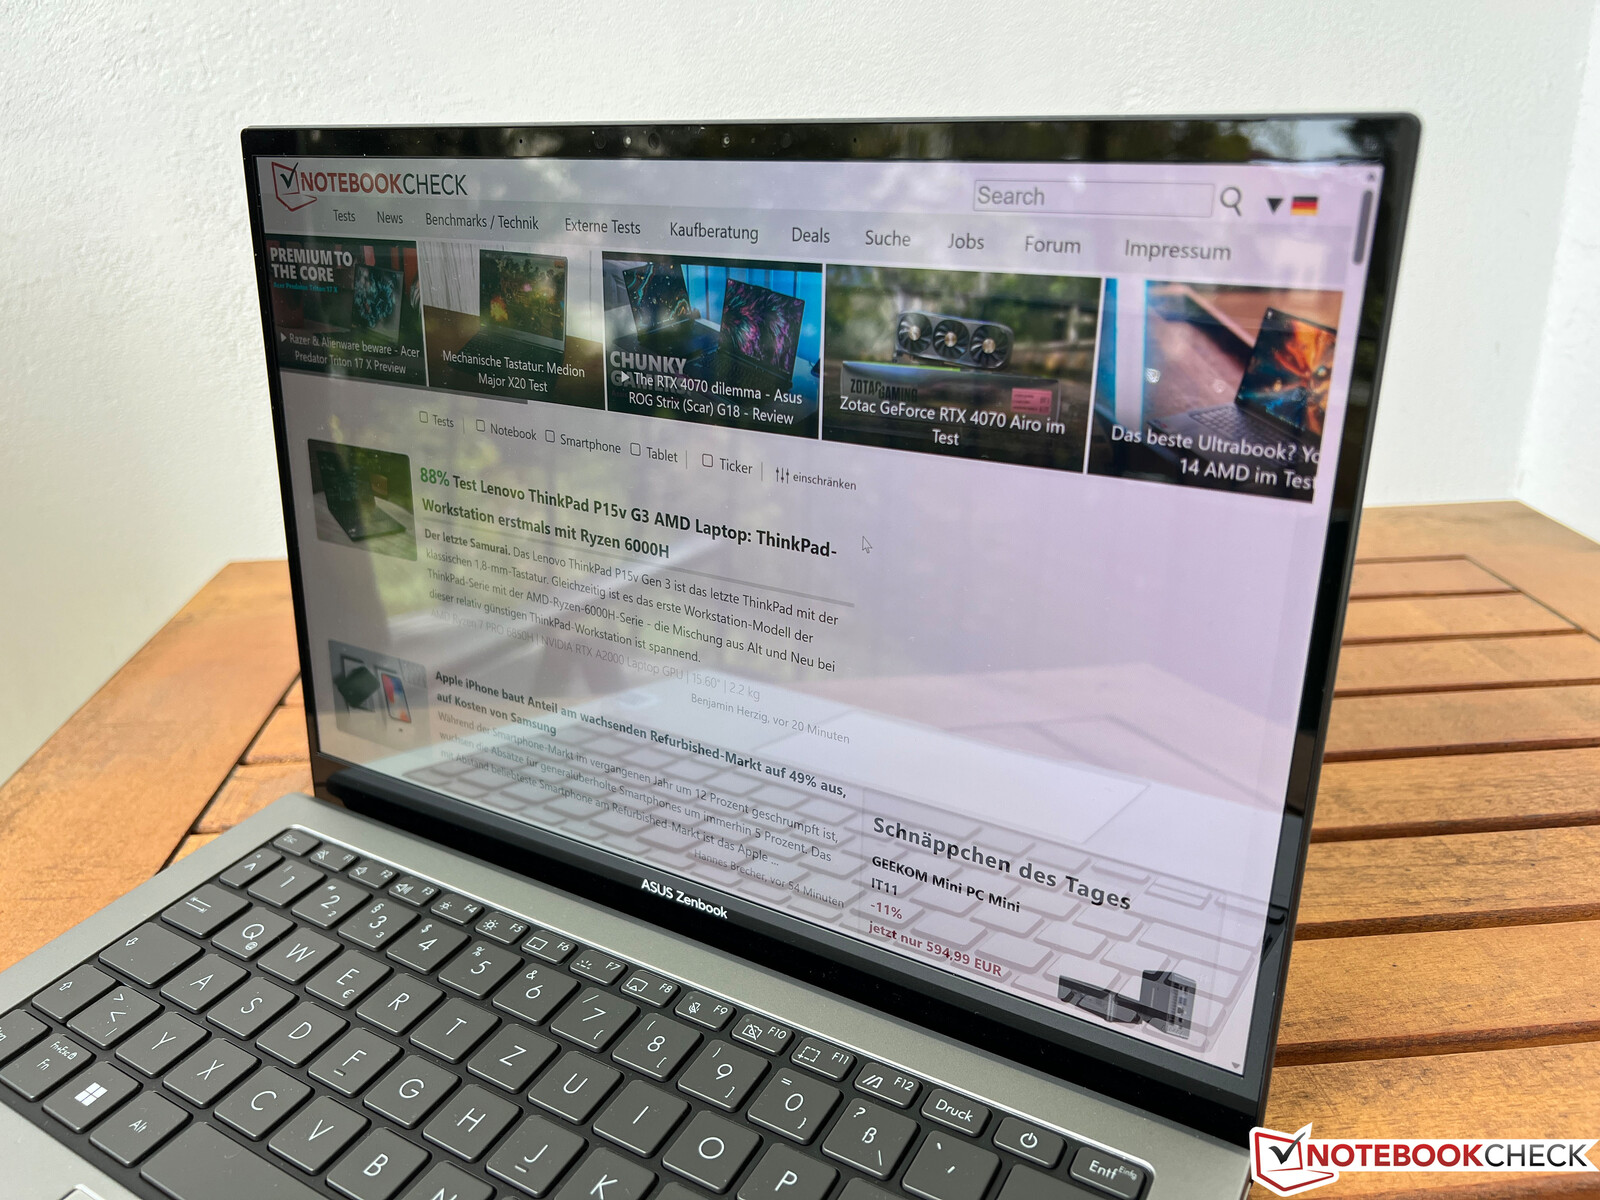
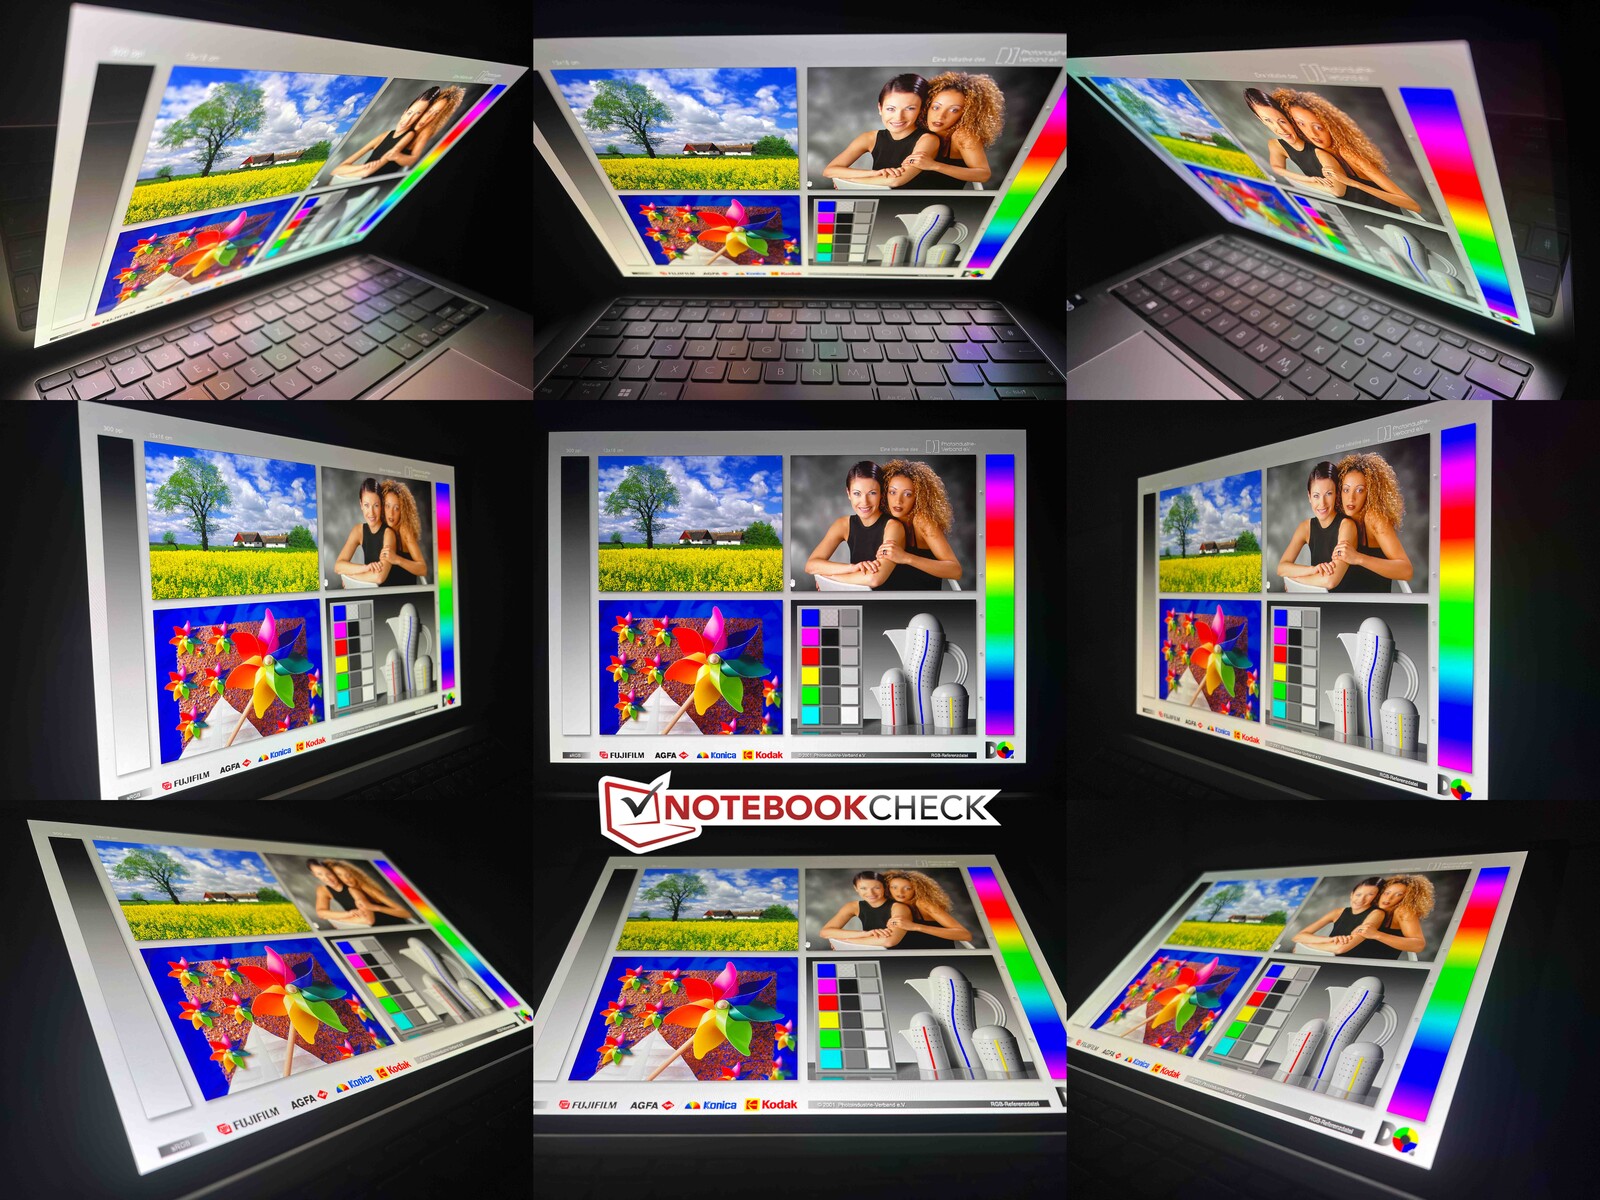
在户外,Zenbook受益于极高的对比度,但它仍然使用反射式屏幕,这必然会导致一些反射的出现。更高的SDR亮度肯定也会在这里有一些好处。视角的稳定性总体上非常好,你只能从某些特定的(非常陡峭的)视角看到OLED面板所特有的轻微蓝色色调。
性能 - 华硕现在使用猛禽湖U
测试条件
华硕提供三种不同的性能配置:低声模式、标准模式和性能模式。由于其巨大的风扇(没有带来明显的性能提升),后者失去了使用资格。我们在标准模式下进行了下面的基准测试和测量。当使用Whisper模式时,风扇明显更安静,但这并不一定是高频风扇噪音的优势。但以后会有更多关于这方面的内容。
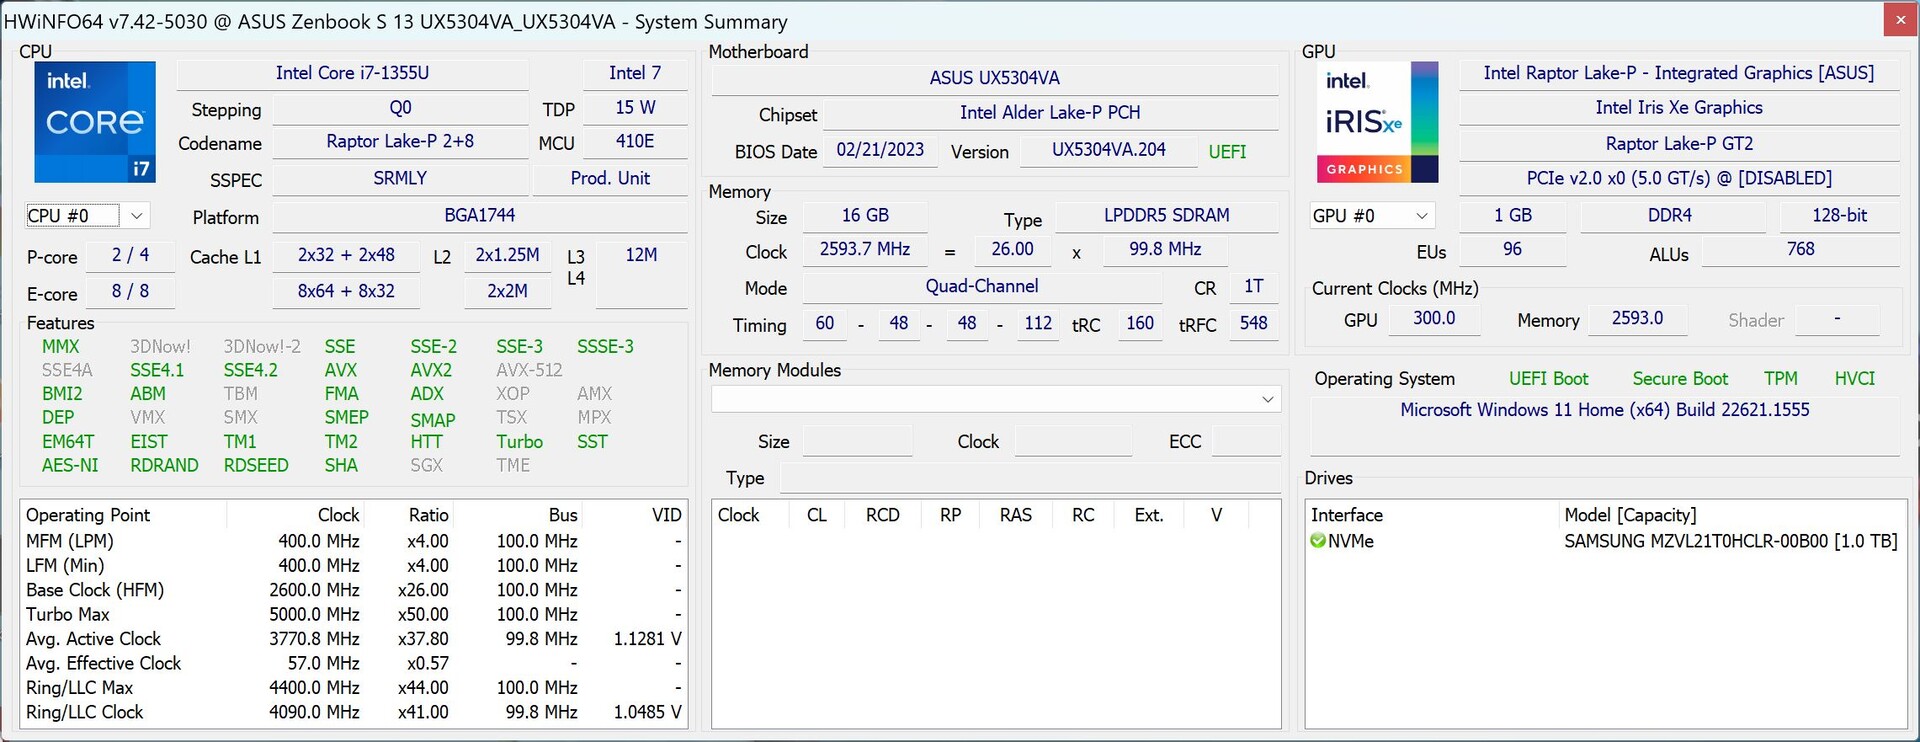
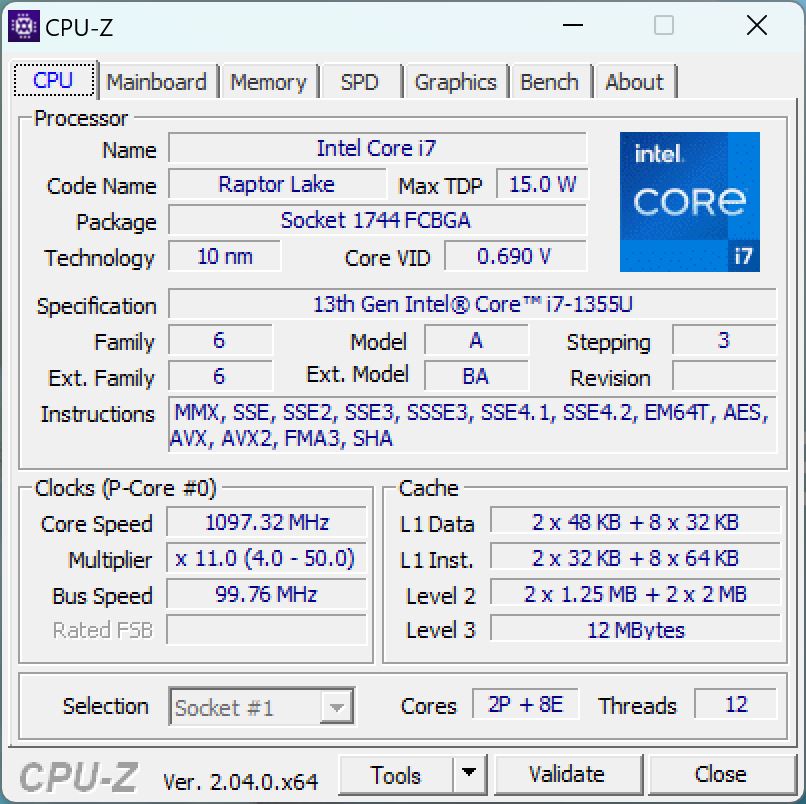
处理器 - 酷睿i7-1355U
的英特尔酷睿i7-1355U来自当前的猛禽湖一代,提供两个快速性能和八个效率核心。基本上,这就是去年的桤木湖酷睿i7-1255U时钟速度略有提高。该处理器允许在短时间内消耗高达44瓦的电量,但在持续负载下,消耗量迅速降至约17瓦。
因此,在多核测试中,性能只在短时间内具有竞争力,而被动冷却的 MacBook Air M2例如,被动冷却的MacBook Air M2在第二次运行时已经更快(尽管这里必须模拟Cinebench R15)。与去年的 配备Ryzen 7 6800U的Zenbook S 13只有在单核测试中,我们看到最多只有20%的轻微优势,与Ryzen 7 6800U相比,多核性能也明显下降。 Ryzen 7 6800U.但在所有CPU基准测试中,新机型仍比去年的Zenbook S 13落后10%。
在电池运行中,功耗进一步小幅降低,多核性能下降了约17%。另一方面,单核性能减少3%,可以忽略不计。你可以找到更多的CPU基准测试 这里.
Cinebench R15 Multi Constant Load Test
Cinebench R23: Multi Core | Single Core
Cinebench R20: CPU (Multi Core) | CPU (Single Core)
Cinebench R15: CPU Multi 64Bit | CPU Single 64Bit
Blender: v2.79 BMW27 CPU
7-Zip 18.03: 7z b 4 | 7z b 4 -mmt1
Geekbench 5.5: Multi-Core | Single-Core
HWBOT x265 Benchmark v2.2: 4k Preset
LibreOffice : 20 Documents To PDF
R Benchmark 2.5: Overall mean
| CPU Performance rating | |
| Average of class Subnotebook | |
| Dell XPS 13 Plus 9320 i7-1280P OLED | |
| Lenovo Yoga Slim 7 Carbon 13IAP7-82U9005FGE | |
| Asus Zenbook S 13 OLED | |
| Average Intel Core i7-1355U | |
| Asus ZenBook S13 OLED UX5304 | |
| Apple MacBook Air M2 10C GPU -5! | |
| Samsung Galaxy Book2 Pro 13 NP930XED-KA1DE | |
| Cinebench R23 / Multi Core | |
| Average of class Subnotebook (1555 - 21812, n=59, last 2 years) | |
| Dell XPS 13 Plus 9320 i7-1280P OLED | |
| Asus Zenbook S 13 OLED | |
| Lenovo Yoga Slim 7 Carbon 13IAP7-82U9005FGE | |
| Average Intel Core i7-1355U (6936 - 10252, n=18) | |
| Apple MacBook Air M2 10C GPU | |
| Asus ZenBook S13 OLED UX5304 | |
| Samsung Galaxy Book2 Pro 13 NP930XED-KA1DE | |
| Cinebench R23 / Single Core | |
| Average Intel Core i7-1355U (1687 - 1889, n=18) | |
| Lenovo Yoga Slim 7 Carbon 13IAP7-82U9005FGE | |
| Average of class Subnotebook (358 - 2213, n=60, last 2 years) | |
| Asus ZenBook S13 OLED UX5304 | |
| Dell XPS 13 Plus 9320 i7-1280P OLED | |
| Apple MacBook Air M2 10C GPU | |
| Asus Zenbook S 13 OLED | |
| Samsung Galaxy Book2 Pro 13 NP930XED-KA1DE | |
| Cinebench R20 / CPU (Multi Core) | |
| Average of class Subnotebook (579 - 8541, n=56, last 2 years) | |
| Dell XPS 13 Plus 9320 i7-1280P OLED | |
| Asus Zenbook S 13 OLED | |
| Lenovo Yoga Slim 7 Carbon 13IAP7-82U9005FGE | |
| Average Intel Core i7-1355U (2849 - 3907, n=18) | |
| Asus ZenBook S13 OLED UX5304 | |
| Apple MacBook Air M2 10C GPU | |
| Samsung Galaxy Book2 Pro 13 NP930XED-KA1DE | |
| Cinebench R20 / CPU (Single Core) | |
| Average Intel Core i7-1355U (654 - 725, n=18) | |
| Asus ZenBook S13 OLED UX5304 | |
| Lenovo Yoga Slim 7 Carbon 13IAP7-82U9005FGE | |
| Average of class Subnotebook (128 - 832, n=56, last 2 years) | |
| Dell XPS 13 Plus 9320 i7-1280P OLED | |
| Asus Zenbook S 13 OLED | |
| Apple MacBook Air M2 10C GPU | |
| Samsung Galaxy Book2 Pro 13 NP930XED-KA1DE | |
| Cinebench R15 / CPU Multi 64Bit | |
| Average of class Subnotebook (327 - 3345, n=56, last 2 years) | |
| Dell XPS 13 Plus 9320 i7-1280P OLED | |
| Lenovo Yoga Slim 7 Carbon 13IAP7-82U9005FGE | |
| Asus Zenbook S 13 OLED | |
| Average Intel Core i7-1355U (1206 - 1735, n=18) | |
| Asus ZenBook S13 OLED UX5304 | |
| Apple MacBook Air M2 10C GPU | |
| Samsung Galaxy Book2 Pro 13 NP930XED-KA1DE | |
| Cinebench R15 / CPU Single 64Bit | |
| Average of class Subnotebook (72.4 - 322, n=56, last 2 years) | |
| Average Intel Core i7-1355U (237 - 267, n=18) | |
| Asus ZenBook S13 OLED UX5304 | |
| Lenovo Yoga Slim 7 Carbon 13IAP7-82U9005FGE | |
| Asus Zenbook S 13 OLED | |
| Dell XPS 13 Plus 9320 i7-1280P OLED | |
| Apple MacBook Air M2 10C GPU | |
| Samsung Galaxy Book2 Pro 13 NP930XED-KA1DE | |
| Blender / v2.79 BMW27 CPU | |
| Apple MacBook Air M2 10C GPU | |
| Samsung Galaxy Book2 Pro 13 NP930XED-KA1DE | |
| Asus ZenBook S13 OLED UX5304 | |
| Asus ZenBook S13 OLED UX5304 | |
| Average Intel Core i7-1355U (328 - 503, n=18) | |
| Average of class Subnotebook (159 - 2271, n=57, last 2 years) | |
| Lenovo Yoga Slim 7 Carbon 13IAP7-82U9005FGE | |
| Asus Zenbook S 13 OLED | |
| Dell XPS 13 Plus 9320 i7-1280P OLED | |
| 7-Zip 18.03 / 7z b 4 | |
| Dell XPS 13 Plus 9320 i7-1280P OLED | |
| Asus Zenbook S 13 OLED | |
| Average of class Subnotebook (11668 - 77867, n=56, last 2 years) | |
| Lenovo Yoga Slim 7 Carbon 13IAP7-82U9005FGE | |
| Average Intel Core i7-1355U (30255 - 42092, n=18) | |
| Asus ZenBook S13 OLED UX5304 | |
| Samsung Galaxy Book2 Pro 13 NP930XED-KA1DE | |
| 7-Zip 18.03 / 7z b 4 -mmt1 | |
| Asus ZenBook S13 OLED UX5304 | |
| Average Intel Core i7-1355U (5301 - 5911, n=18) | |
| Average of class Subnotebook (2643 - 6699, n=58, last 2 years) | |
| Asus Zenbook S 13 OLED | |
| Lenovo Yoga Slim 7 Carbon 13IAP7-82U9005FGE | |
| Dell XPS 13 Plus 9320 i7-1280P OLED | |
| Samsung Galaxy Book2 Pro 13 NP930XED-KA1DE | |
| Geekbench 5.5 / Multi-Core | |
| Dell XPS 13 Plus 9320 i7-1280P OLED | |
| Average of class Subnotebook (2557 - 17218, n=48, last 2 years) | |
| Lenovo Yoga Slim 7 Carbon 13IAP7-82U9005FGE | |
| Apple MacBook Air M2 10C GPU | |
| Average Intel Core i7-1355U (7507 - 9328, n=18) | |
| Asus ZenBook S13 OLED UX5304 | |
| Asus Zenbook S 13 OLED | |
| Samsung Galaxy Book2 Pro 13 NP930XED-KA1DE | |
| Geekbench 5.5 / Single-Core | |
| Apple MacBook Air M2 10C GPU | |
| Average of class Subnotebook (726 - 2224, n=48, last 2 years) | |
| Dell XPS 13 Plus 9320 i7-1280P OLED | |
| Average Intel Core i7-1355U (1678 - 1872, n=18) | |
| Asus ZenBook S13 OLED UX5304 | |
| Lenovo Yoga Slim 7 Carbon 13IAP7-82U9005FGE | |
| Asus Zenbook S 13 OLED | |
| Samsung Galaxy Book2 Pro 13 NP930XED-KA1DE | |
| HWBOT x265 Benchmark v2.2 / 4k Preset | |
| Dell XPS 13 Plus 9320 i7-1280P OLED | |
| Average of class Subnotebook (0.97 - 25.1, n=56, last 2 years) | |
| Asus Zenbook S 13 OLED | |
| Lenovo Yoga Slim 7 Carbon 13IAP7-82U9005FGE | |
| Average Intel Core i7-1355U (7.83 - 11.4, n=18) | |
| Asus ZenBook S13 OLED UX5304 | |
| Samsung Galaxy Book2 Pro 13 NP930XED-KA1DE | |
| LibreOffice / 20 Documents To PDF | |
| Samsung Galaxy Book2 Pro 13 NP930XED-KA1DE | |
| Average of class Subnotebook (39.9 - 220, n=55, last 2 years) | |
| Asus Zenbook S 13 OLED | |
| Average Intel Core i7-1355U (41.1 - 108.6, n=18) | |
| Dell XPS 13 Plus 9320 i7-1280P OLED | |
| Asus ZenBook S13 OLED UX5304 | |
| Lenovo Yoga Slim 7 Carbon 13IAP7-82U9005FGE | |
| R Benchmark 2.5 / Overall mean | |
| Samsung Galaxy Book2 Pro 13 NP930XED-KA1DE | |
| Asus Zenbook S 13 OLED | |
| Average of class Subnotebook (0.4024 - 1.456, n=57, last 2 years) | |
| Dell XPS 13 Plus 9320 i7-1280P OLED | |
| Average Intel Core i7-1355U (0.4481 - 0.832, n=18) | |
| Lenovo Yoga Slim 7 Carbon 13IAP7-82U9005FGE | |
| Asus ZenBook S13 OLED UX5304 | |
* ... smaller is better
AIDA64: FP32 Ray-Trace | FPU Julia | CPU SHA3 | CPU Queen | FPU SinJulia | FPU Mandel | CPU AES | CPU ZLib | FP64 Ray-Trace | CPU PhotoWorxx
| Performance rating | |
| Asus Zenbook S 13 OLED | |
| Average of class Subnotebook | |
| Dell XPS 13 Plus 9320 i7-1280P OLED | |
| Average Intel Core i7-1355U | |
| Lenovo Yoga Slim 7 Carbon 13IAP7-82U9005FGE | |
| Asus ZenBook S13 OLED UX5304 | |
| Samsung Galaxy Book2 Pro 13 NP930XED-KA1DE | |
| AIDA64 / FP32 Ray-Trace | |
| Average of class Subnotebook (1135 - 32888, n=57, last 2 years) | |
| Asus Zenbook S 13 OLED | |
| Dell XPS 13 Plus 9320 i7-1280P OLED | |
| Average Intel Core i7-1355U (5673 - 8424, n=18) | |
| Asus ZenBook S13 OLED UX5304 | |
| Lenovo Yoga Slim 7 Carbon 13IAP7-82U9005FGE | |
| Samsung Galaxy Book2 Pro 13 NP930XED-KA1DE | |
| AIDA64 / FPU Julia | |
| Asus Zenbook S 13 OLED | |
| Average of class Subnotebook (5218 - 123315, n=57, last 2 years) | |
| Dell XPS 13 Plus 9320 i7-1280P OLED | |
| Average Intel Core i7-1355U (29580 - 42706, n=18) | |
| Asus ZenBook S13 OLED UX5304 | |
| Lenovo Yoga Slim 7 Carbon 13IAP7-82U9005FGE | |
| Samsung Galaxy Book2 Pro 13 NP930XED-KA1DE | |
| AIDA64 / CPU SHA3 | |
| Average of class Subnotebook (444 - 5287, n=57, last 2 years) | |
| Dell XPS 13 Plus 9320 i7-1280P OLED | |
| Asus Zenbook S 13 OLED | |
| Average Intel Core i7-1355U (1529 - 2200, n=18) | |
| Lenovo Yoga Slim 7 Carbon 13IAP7-82U9005FGE | |
| Asus ZenBook S13 OLED UX5304 | |
| Samsung Galaxy Book2 Pro 13 NP930XED-KA1DE | |
| AIDA64 / CPU Queen | |
| Dell XPS 13 Plus 9320 i7-1280P OLED | |
| Asus Zenbook S 13 OLED | |
| Lenovo Yoga Slim 7 Carbon 13IAP7-82U9005FGE | |
| Asus ZenBook S13 OLED UX5304 | |
| Average Intel Core i7-1355U (21547 - 66907, n=18) | |
| Average of class Subnotebook (10579 - 95002, n=48, last 2 years) | |
| Samsung Galaxy Book2 Pro 13 NP930XED-KA1DE | |
| AIDA64 / FPU SinJulia | |
| Asus Zenbook S 13 OLED | |
| Dell XPS 13 Plus 9320 i7-1280P OLED | |
| Average of class Subnotebook (744 - 18418, n=57, last 2 years) | |
| Lenovo Yoga Slim 7 Carbon 13IAP7-82U9005FGE | |
| Average Intel Core i7-1355U (4045 - 5426, n=18) | |
| Asus ZenBook S13 OLED UX5304 | |
| Samsung Galaxy Book2 Pro 13 NP930XED-KA1DE | |
| AIDA64 / FPU Mandel | |
| Asus Zenbook S 13 OLED | |
| Average of class Subnotebook (3341 - 65433, n=57, last 2 years) | |
| Dell XPS 13 Plus 9320 i7-1280P OLED | |
| Average Intel Core i7-1355U (14596 - 21627, n=18) | |
| Asus ZenBook S13 OLED UX5304 | |
| Lenovo Yoga Slim 7 Carbon 13IAP7-82U9005FGE | |
| Samsung Galaxy Book2 Pro 13 NP930XED-KA1DE | |
| AIDA64 / CPU AES | |
| Asus Zenbook S 13 OLED | |
| Dell XPS 13 Plus 9320 i7-1280P OLED | |
| Average of class Subnotebook (638 - 96917, n=57, last 2 years) | |
| Average Intel Core i7-1355U (31432 - 75408, n=18) | |
| Lenovo Yoga Slim 7 Carbon 13IAP7-82U9005FGE | |
| Asus ZenBook S13 OLED UX5304 | |
| Samsung Galaxy Book2 Pro 13 NP930XED-KA1DE | |
| AIDA64 / CPU ZLib | |
| Average of class Subnotebook (164.9 - 1379, n=57, last 2 years) | |
| Dell XPS 13 Plus 9320 i7-1280P OLED | |
| Asus Zenbook S 13 OLED | |
| Lenovo Yoga Slim 7 Carbon 13IAP7-82U9005FGE | |
| Average Intel Core i7-1355U (454 - 684, n=18) | |
| Asus ZenBook S13 OLED UX5304 | |
| Samsung Galaxy Book2 Pro 13 NP930XED-KA1DE | |
| AIDA64 / FP64 Ray-Trace | |
| Average of class Subnotebook (610 - 17495, n=57, last 2 years) | |
| Dell XPS 13 Plus 9320 i7-1280P OLED | |
| Asus Zenbook S 13 OLED | |
| Average Intel Core i7-1355U (2991 - 4453, n=18) | |
| Asus ZenBook S13 OLED UX5304 | |
| Lenovo Yoga Slim 7 Carbon 13IAP7-82U9005FGE | |
| Samsung Galaxy Book2 Pro 13 NP930XED-KA1DE | |
| AIDA64 / CPU PhotoWorxx | |
| Average of class Subnotebook (6569 - 85600, n=57, last 2 years) | |
| Dell XPS 13 Plus 9320 i7-1280P OLED | |
| Asus ZenBook S13 OLED UX5304 | |
| Average Intel Core i7-1355U (21800 - 46154, n=18) | |
| Lenovo Yoga Slim 7 Carbon 13IAP7-82U9005FGE | |
| Samsung Galaxy Book2 Pro 13 NP930XED-KA1DE | |
| Asus Zenbook S 13 OLED | |
系统性能
新款Zenbook S 13的主观性能印象非常好,所有的输入都能实现,没有任何明显的延迟。合成基准测试的结果是平均的,在某些方面甚至仍然落后于前代产品。然而,这在实践中是不明显的。
CrossMark: Overall | Productivity | Creativity | Responsiveness
| PCMark 10 / Score | |
| Average of class Subnotebook (4920 - 9939, n=45, last 2 years) | |
| Asus Zenbook S 13 OLED | |
| Average Intel Core i7-1355U, Intel Iris Xe Graphics G7 96EUs (5455 - 5933, n=15) | |
| Dell XPS 13 Plus 9320 i7-1280P OLED | |
| Lenovo Yoga Slim 7 Carbon 13IAP7-82U9005FGE | |
| Asus ZenBook S13 OLED UX5304 | |
| Samsung Galaxy Book2 Pro 13 NP930XED-KA1DE | |
| PCMark 10 / Essentials | |
| Average Intel Core i7-1355U, Intel Iris Xe Graphics G7 96EUs (10203 - 11822, n=15) | |
| Asus Zenbook S 13 OLED | |
| Asus ZenBook S13 OLED UX5304 | |
| Lenovo Yoga Slim 7 Carbon 13IAP7-82U9005FGE | |
| Dell XPS 13 Plus 9320 i7-1280P OLED | |
| Average of class Subnotebook (8552 - 11646, n=45, last 2 years) | |
| Samsung Galaxy Book2 Pro 13 NP930XED-KA1DE | |
| PCMark 10 / Productivity | |
| Average of class Subnotebook (5435 - 16606, n=45, last 2 years) | |
| Asus Zenbook S 13 OLED | |
| Average Intel Core i7-1355U, Intel Iris Xe Graphics G7 96EUs (6763 - 7536, n=15) | |
| Asus ZenBook S13 OLED UX5304 | |
| Dell XPS 13 Plus 9320 i7-1280P OLED | |
| Lenovo Yoga Slim 7 Carbon 13IAP7-82U9005FGE | |
| Samsung Galaxy Book2 Pro 13 NP930XED-KA1DE | |
| PCMark 10 / Digital Content Creation | |
| Average of class Subnotebook (5722 - 13779, n=45, last 2 years) | |
| Asus Zenbook S 13 OLED | |
| Dell XPS 13 Plus 9320 i7-1280P OLED | |
| Lenovo Yoga Slim 7 Carbon 13IAP7-82U9005FGE | |
| Average Intel Core i7-1355U, Intel Iris Xe Graphics G7 96EUs (5723 - 6712, n=15) | |
| Asus ZenBook S13 OLED UX5304 | |
| Samsung Galaxy Book2 Pro 13 NP930XED-KA1DE | |
| CrossMark / Overall | |
| Dell XPS 13 Plus 9320 i7-1280P OLED | |
| Average of class Subnotebook (365 - 2356, n=59, last 2 years) | |
| Lenovo Yoga Slim 7 Carbon 13IAP7-82U9005FGE | |
| Asus ZenBook S13 OLED UX5304 | |
| Average Intel Core i7-1355U, Intel Iris Xe Graphics G7 96EUs (1478 - 1643, n=15) | |
| Apple MacBook Air M2 10C GPU | |
| Asus Zenbook S 13 OLED | |
| CrossMark / Productivity | |
| Dell XPS 13 Plus 9320 i7-1280P OLED | |
| Average of class Subnotebook (364 - 2277, n=59, last 2 years) | |
| Asus ZenBook S13 OLED UX5304 | |
| Average Intel Core i7-1355U, Intel Iris Xe Graphics G7 96EUs (1444 - 1665, n=15) | |
| Lenovo Yoga Slim 7 Carbon 13IAP7-82U9005FGE | |
| Asus Zenbook S 13 OLED | |
| Apple MacBook Air M2 10C GPU | |
| CrossMark / Creativity | |
| Dell XPS 13 Plus 9320 i7-1280P OLED | |
| Average of class Subnotebook (372 - 2743, n=59, last 2 years) | |
| Apple MacBook Air M2 10C GPU | |
| Lenovo Yoga Slim 7 Carbon 13IAP7-82U9005FGE | |
| Asus ZenBook S13 OLED UX5304 | |
| Average Intel Core i7-1355U, Intel Iris Xe Graphics G7 96EUs (1563 - 1732, n=15) | |
| Asus Zenbook S 13 OLED | |
| CrossMark / Responsiveness | |
| Dell XPS 13 Plus 9320 i7-1280P OLED | |
| Asus ZenBook S13 OLED UX5304 | |
| Average of class Subnotebook (312 - 1854, n=59, last 2 years) | |
| Average Intel Core i7-1355U, Intel Iris Xe Graphics G7 96EUs (1217 - 1681, n=15) | |
| Lenovo Yoga Slim 7 Carbon 13IAP7-82U9005FGE | |
| Asus Zenbook S 13 OLED | |
| Apple MacBook Air M2 10C GPU | |
| PCMark 10 Score | 5576 points | |
Help | ||
| AIDA64 / Memory Copy | |
| Average of class Subnotebook (14554 - 131023, n=57, last 2 years) | |
| Dell XPS 13 Plus 9320 i7-1280P OLED | |
| Asus ZenBook S13 OLED UX5304 | |
| Lenovo Yoga Slim 7 Carbon 13IAP7-82U9005FGE | |
| Average Intel Core i7-1355U (35017 - 71600, n=18) | |
| Samsung Galaxy Book2 Pro 13 NP930XED-KA1DE | |
| Asus Zenbook S 13 OLED | |
| AIDA64 / Memory Read | |
| Average of class Subnotebook (15948 - 127174, n=57, last 2 years) | |
| Dell XPS 13 Plus 9320 i7-1280P OLED | |
| Lenovo Yoga Slim 7 Carbon 13IAP7-82U9005FGE | |
| Samsung Galaxy Book2 Pro 13 NP930XED-KA1DE | |
| Average Intel Core i7-1355U (38551 - 73377, n=18) | |
| Asus ZenBook S13 OLED UX5304 | |
| Asus Zenbook S 13 OLED | |
| AIDA64 / Memory Write | |
| Average of class Subnotebook (15709 - 135141, n=57, last 2 years) | |
| Asus ZenBook S13 OLED UX5304 | |
| Average Intel Core i7-1355U (35910 - 93342, n=18) | |
| Dell XPS 13 Plus 9320 i7-1280P OLED | |
| Lenovo Yoga Slim 7 Carbon 13IAP7-82U9005FGE | |
| Samsung Galaxy Book2 Pro 13 NP930XED-KA1DE | |
| Asus Zenbook S 13 OLED | |
| AIDA64 / Memory Latency | |
| Asus Zenbook S 13 OLED | |
| Lenovo Yoga Slim 7 Carbon 13IAP7-82U9005FGE | |
| Average Intel Core i7-1355U (72.2 - 346, n=18) | |
| Dell XPS 13 Plus 9320 i7-1280P OLED | |
| Average of class Subnotebook (6.1 - 159.9, n=55, last 2 years) | |
| Asus ZenBook S13 OLED UX5304 | |
* ... smaller is better
DPC延迟
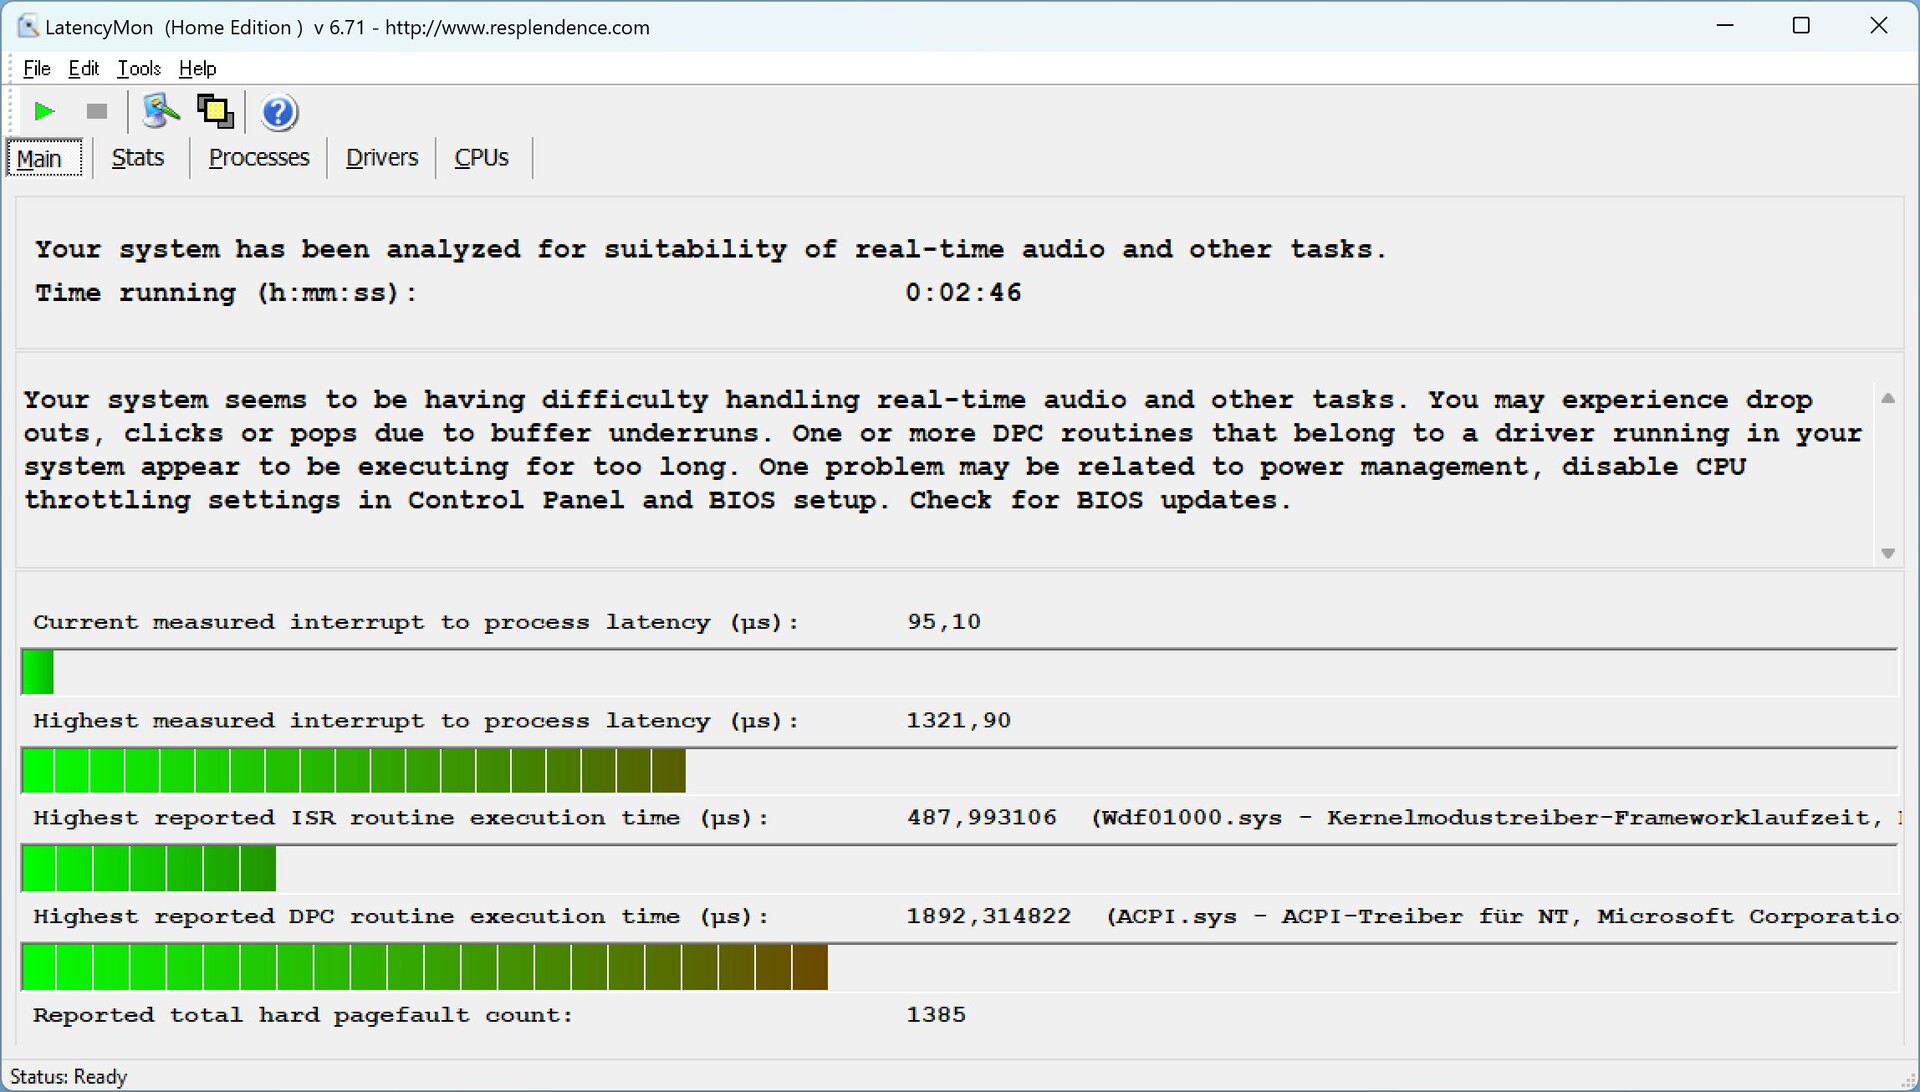
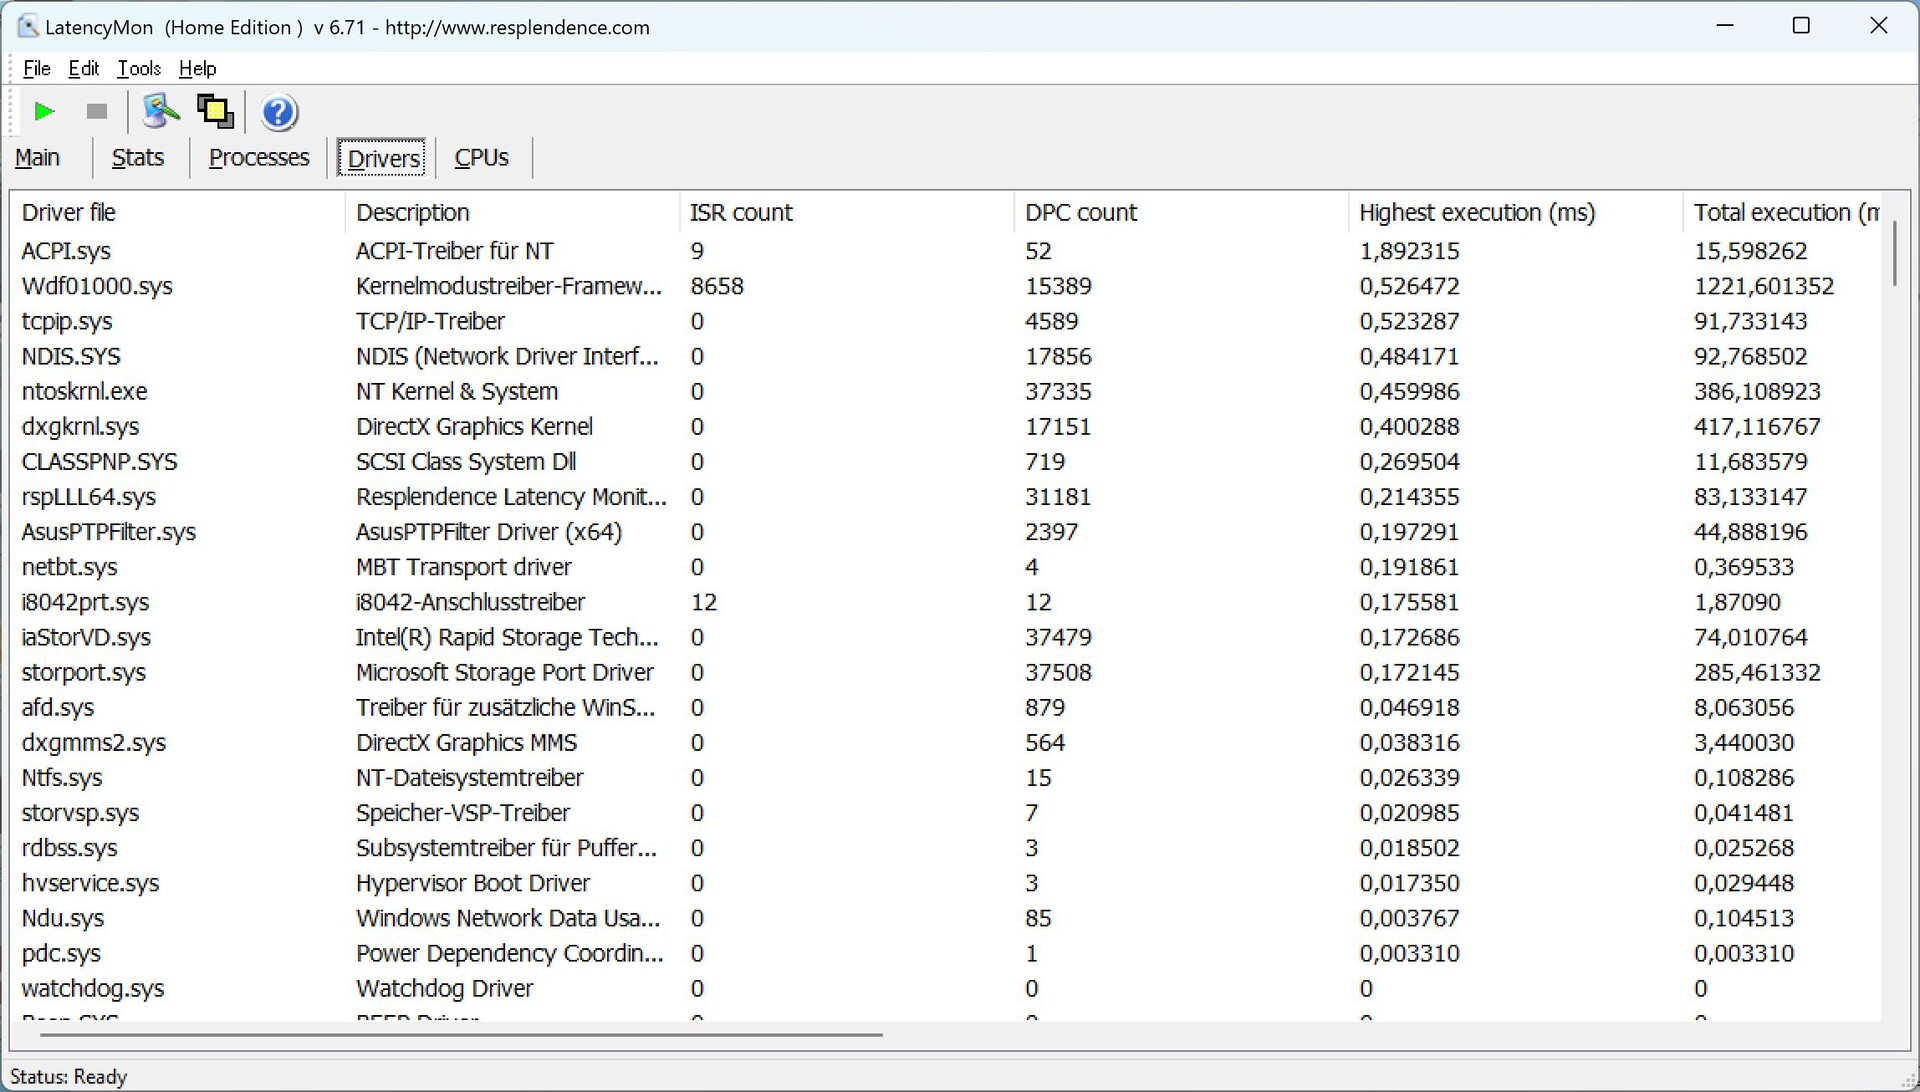
在我们的标准化延迟测试中(有上网冲浪、4K YouTube视频复制和CPU负载),我们的测试装置与相应的BIOS版本显示出一些轻微的限制,因此不是无条件地适合使用实时应用程序。
| DPC Latencies / LatencyMon - interrupt to process latency (max), Web, Youtube, Prime95 | |
| Samsung Galaxy Book2 Pro 13 NP930XED-KA1DE | |
| Asus ZenBook S13 OLED UX5304 | |
| Lenovo Yoga Slim 7 Carbon 13IAP7-82U9005FGE | |
| Asus Zenbook S 13 OLED | |
| Dell XPS 13 Plus 9320 i7-1280P OLED | |
* ... smaller is better
存储解决方案
华硕为Zenbook S 13配备了来自三星的快速PCIe 4.0固态硬盘,提供1TB的存储容量。首次启动后,其中903GB仍可供用户存储。PM9A1的传输速率达到7GB/s以上,恒定性能也长时间保持稳定,在我们的恒定性能测试结束时,只有极少的性能下降。考虑到超薄的外壳,这是一个非常好的性能。你可以找到更多的SSD基准测试 这里.

* ... smaller is better
Disk Throttling: DiskSpd Read Loop, Queue Depth 8
图形卡
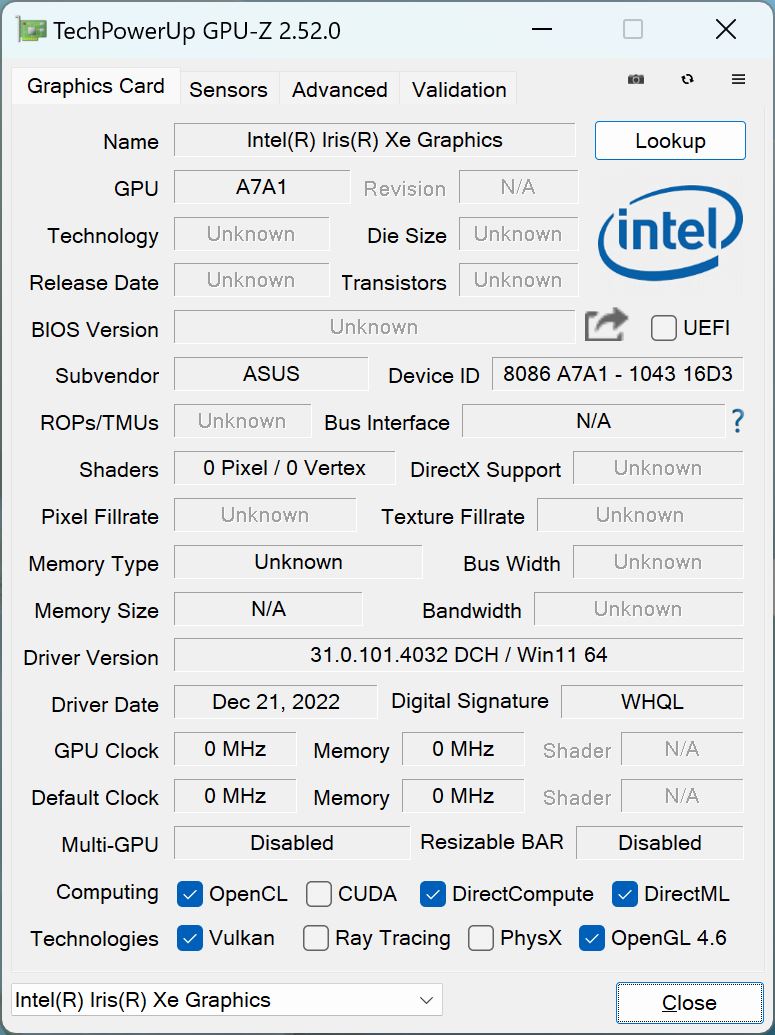
我们已经知道,集成的 Iris Xe Graphics G7图形卡已经有一段时间了,Zenbook使用了更快的版本,有96个EUs,最大时钟速度为1300MHz。对于日常任务,包括高分辨率视频的再现,iGPU也是足够的,但问题是在与Radeon 680M在我们的合成GPU测试中,其前身的运行速度平均快36%。
在我们的游戏基准测试中,在1080p分辨率和高细节下的差异更加明显,老款Radeon 680M的速度甚至高达 56%。这意味着新Zenbook S 13的游戏性能明显降低,如果你喜欢游戏,你必须大大减少图形细节。但至少,即使在较长时间的游戏过程中,图形性能仍然稳定。然而,在电池运行时,性能会降低12%。你可以找到更多的GPU基准测试 这里.
| 3DMark 06 Standard Score | 25303 points | |
| 3DMark 11 Performance | 6644 points | |
| 3DMark Fire Strike Score | 4613 points | |
| 3DMark Time Spy Score | 1683 points | |
Help | ||
* ... smaller is better
| The Witcher 3 - 1920x1080 Ultra Graphics & Postprocessing (HBAO+) | |
| Average of class Subnotebook (13.9 - 34.6, n=12, last 2 years) | |
| Asus Zenbook S 13 OLED | |
| Dell XPS 13 Plus 9320 i7-1280P OLED | |
| Lenovo Yoga Slim 7 Carbon 13IAP7-82U9005FGE | |
| Asus ZenBook S13 OLED UX5304 | |
| Samsung Galaxy Book2 Pro 13 NP930XED-KA1DE | |
| Final Fantasy XV Benchmark - 1920x1080 High Quality | |
| Average of class Subnotebook (11.6 - 54.5, n=53, last 2 years) | |
| Lenovo Yoga Slim 7 Carbon 13IAP7-82U9005FGE | |
| Asus Zenbook S 13 OLED | |
| Dell XPS 13 Plus 9320 i7-1280P OLED | |
| Asus ZenBook S13 OLED UX5304 | |
| Strange Brigade - 1920x1080 ultra AA:ultra AF:16 | |
| Average of class Subnotebook (19 - 101.3, n=49, last 2 years) | |
| Asus Zenbook S 13 OLED | |
| Dell XPS 13 Plus 9320 i7-1280P OLED | |
| Asus ZenBook S13 OLED UX5304 | |
| Lenovo Yoga Slim 7 Carbon 13IAP7-82U9005FGE | |
The Witcher 3 FPS Chart
| low | med. | high | ultra | |
|---|---|---|---|---|
| GTA V (2015) | 94.8 | 81 | 22.5 | 9.42 |
| The Witcher 3 (2015) | 79 | 51 | 28 | 12.3 |
| Dota 2 Reborn (2015) | 84.8 | 66.7 | 54.9 | 51.1 |
| Final Fantasy XV Benchmark (2018) | 37.4 | 20.5 | 14.9 | |
| X-Plane 11.11 (2018) | 34.6 | 32.1 | 27.3 | |
| Far Cry 5 (2018) | 42 | 25 | 24 | 22 |
| Strange Brigade (2018) | 88.4 | 37.8 | 29.1 | 23.6 |
| F1 2021 (2021) | 94.8 | 45.6 | 35.2 | 24.9 |
| F1 22 (2022) | 41.6 | 36.6 | 27.6 | 20.7 |
排放--Zenbook受到高频风扇噪音的影响
噪声水平
这两个小风扇显然代表了Zenbook S 13的最大问题。虽然噪音水平基本上保持在限制范围内--只要你不考虑产生最大47.8 dB(A)的性能模式--但问题是非常高的频率噪音。 看下面的图表,你可能认为Whisper模式可能是最好的选择,但你已经可以清楚地听到高频噪音,即使在低风扇速度下,它变得非常令人讨厌。在标准模式下,至少有一部分被呼啸的噪音所覆盖。此外,风扇还快速旋转,例如在播放YouTube视频时,这使情况变得更糟。这个问题对我们来说绝对是一个不合格的点。
| 低声模式 | 标准模式 | 性能模式 | |
|---|---|---|---|
| 3DMark 06 | 26 dB(A) | 37.7 dB(A) | 47.8 dB(A) |
| Witcher 3 | 26 dB(A) | 40.1 dB(A) | 47.8 dB(A) |
| 压力测试 | 26 dB(A) | 40.1 dB(A) | 47.8 dB(A) |
Noise level
| Idle |
| 23.3 / 23.3 / 23.3 dB(A) |
| Load |
| 37.7 / 40.1 dB(A) |
 | ||
30 dB silent 40 dB(A) audible 50 dB(A) loud |
||
min: | ||
| Asus ZenBook S13 OLED UX5304 Iris Xe G7 96EUs, i7-1355U, Samsung PM9A1 MZVL21T0HCLR | Asus Zenbook S 13 OLED Radeon 680M, R7 6800U, Samsung PM9A1 MZVL21T0HCLR | Lenovo Yoga Slim 7 Carbon 13IAP7-82U9005FGE Iris Xe G7 96EUs, i7-1260P, Samsung PM9A1 MZVL21T0HCLR | Dell XPS 13 Plus 9320 i7-1280P OLED Iris Xe G7 96EUs, i7-1280P, WDC PC SN810 512GB | Samsung Galaxy Book2 Pro 13 NP930XED-KA1DE Iris Xe G7 80EUs, i5-1240P, Samsung PM991a MZVLQ256HBJD | |
|---|---|---|---|---|---|
| Noise | -1% | -6% | 0% | -5% | |
| off / environment * (dB) | 23.3 | 24 -3% | 24.2 -4% | 23.4 -0% | 24.6 -6% |
| Idle Minimum * (dB) | 23.3 | 24 -3% | 24.2 -4% | 23.4 -0% | 24.6 -6% |
| Idle Average * (dB) | 23.3 | 24 -3% | 24.2 -4% | 23.4 -0% | 24.6 -6% |
| Idle Maximum * (dB) | 23.3 | 24 -3% | 25.1 -8% | 23.4 -0% | 26.3 -13% |
| Load Average * (dB) | 37.7 | 33.1 12% | 41.9 -11% | 35 7% | 38.4 -2% |
| Witcher 3 ultra * (dB) | 40.1 | 40.2 -0% | 41.9 -4% | 41.6 -4% | |
| Load Maximum * (dB) | 40.1 | 41.7 -4% | 41.9 -4% | 39.9 -0% | 38.7 3% |
* ... smaller is better
温度
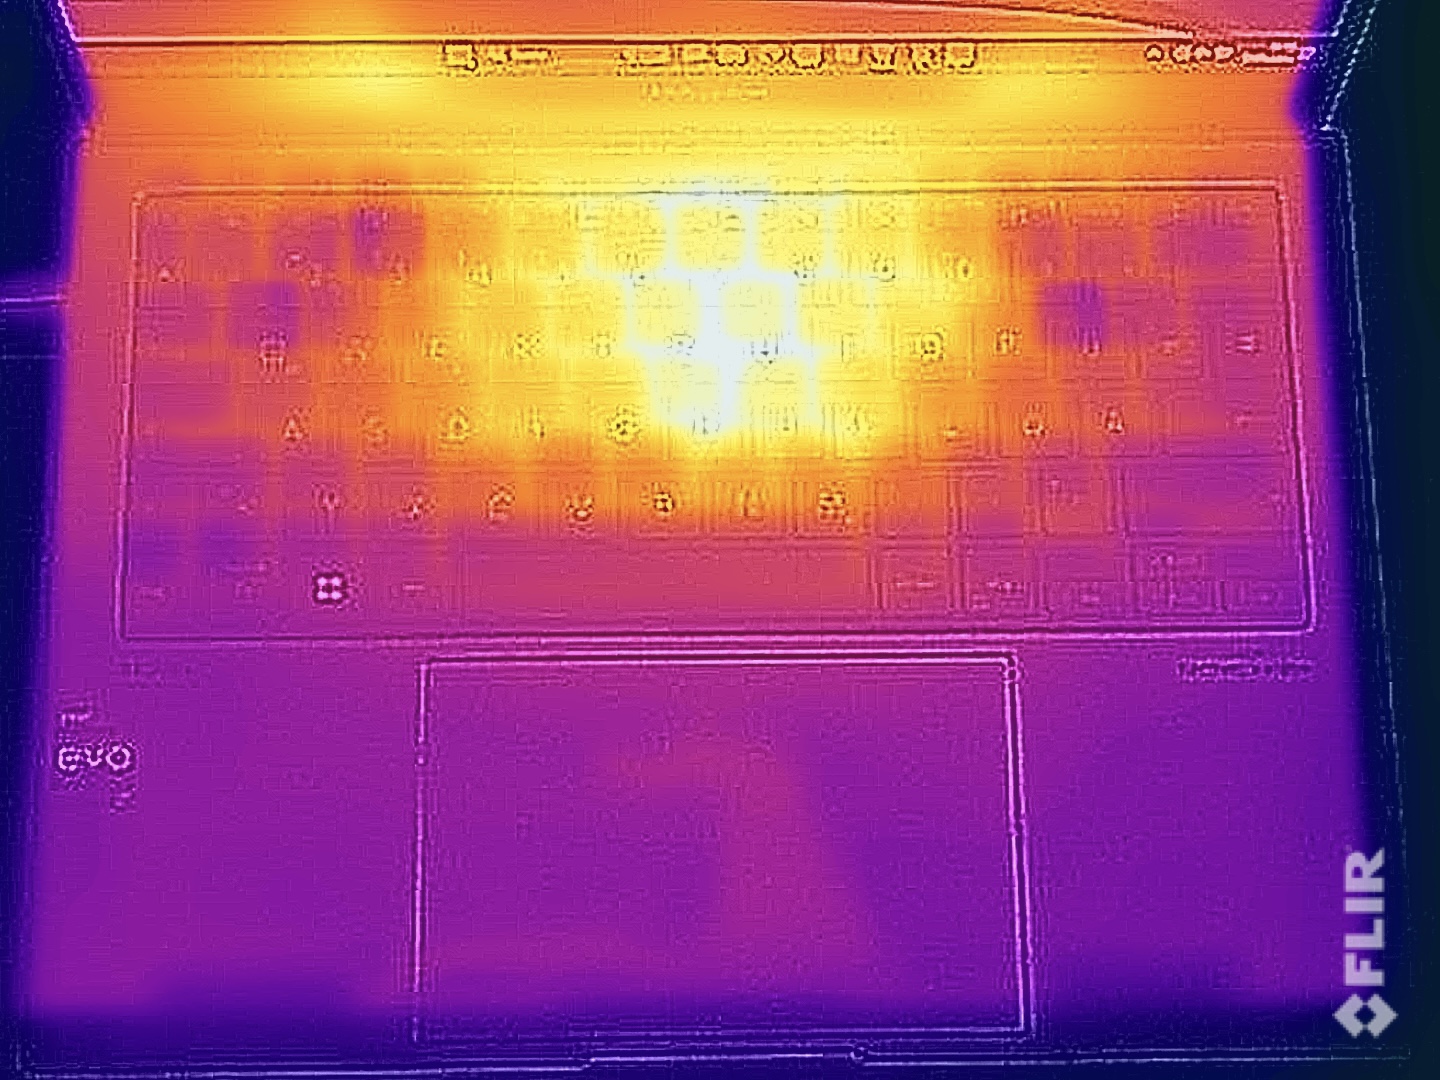
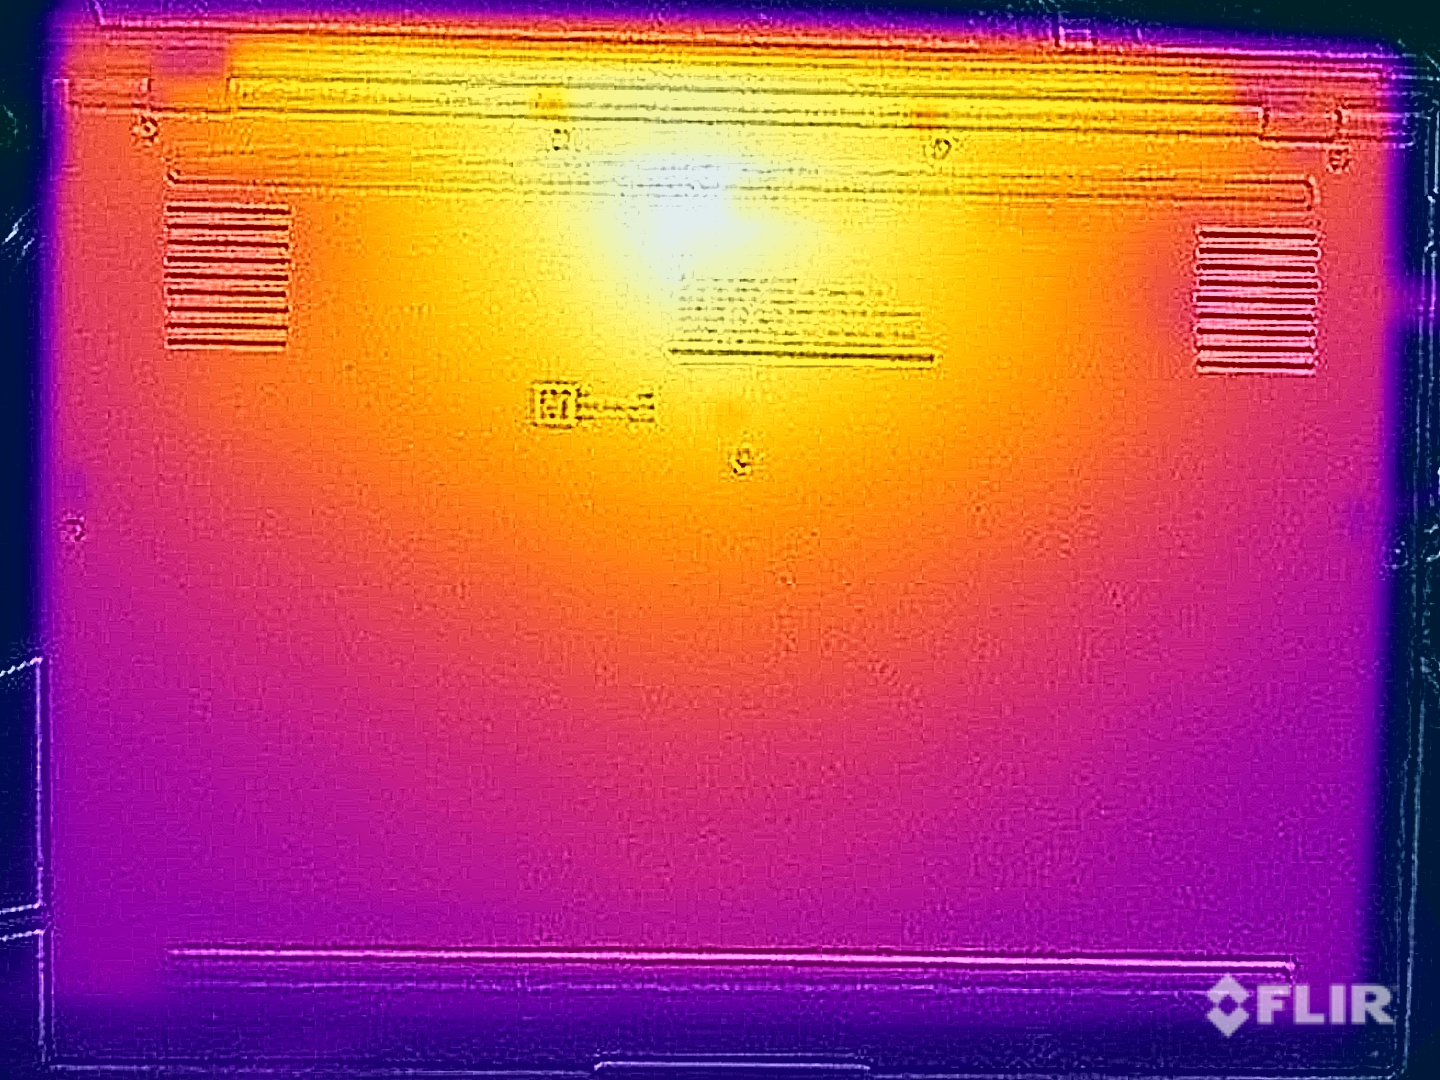
在日常操作中,Zenbook仍然非常凉爽。在负载情况下,尤其是底座顶部的中央区域会发热。然而,你仍然可以把设备放在腿上,没有任何问题,因为基座略微升高。在打字时,温度也变得很明显,但它不会造成任何限制。
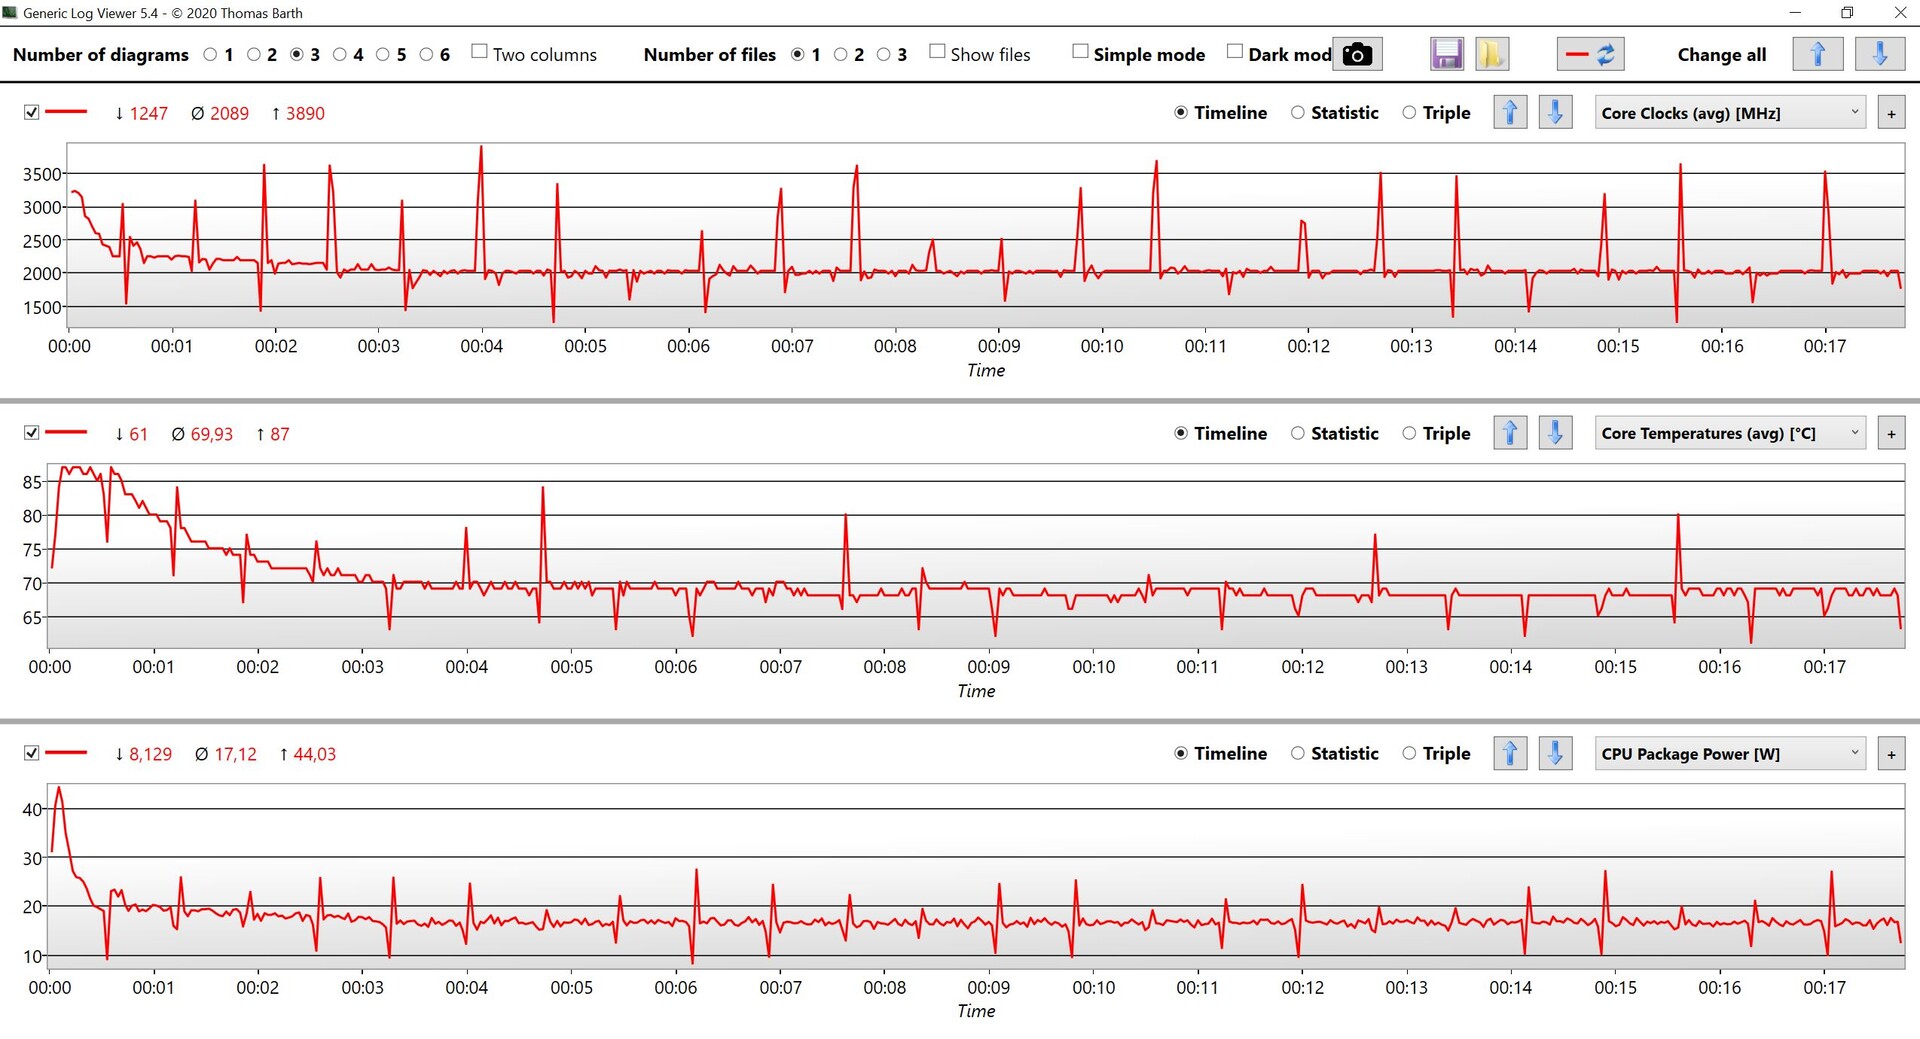
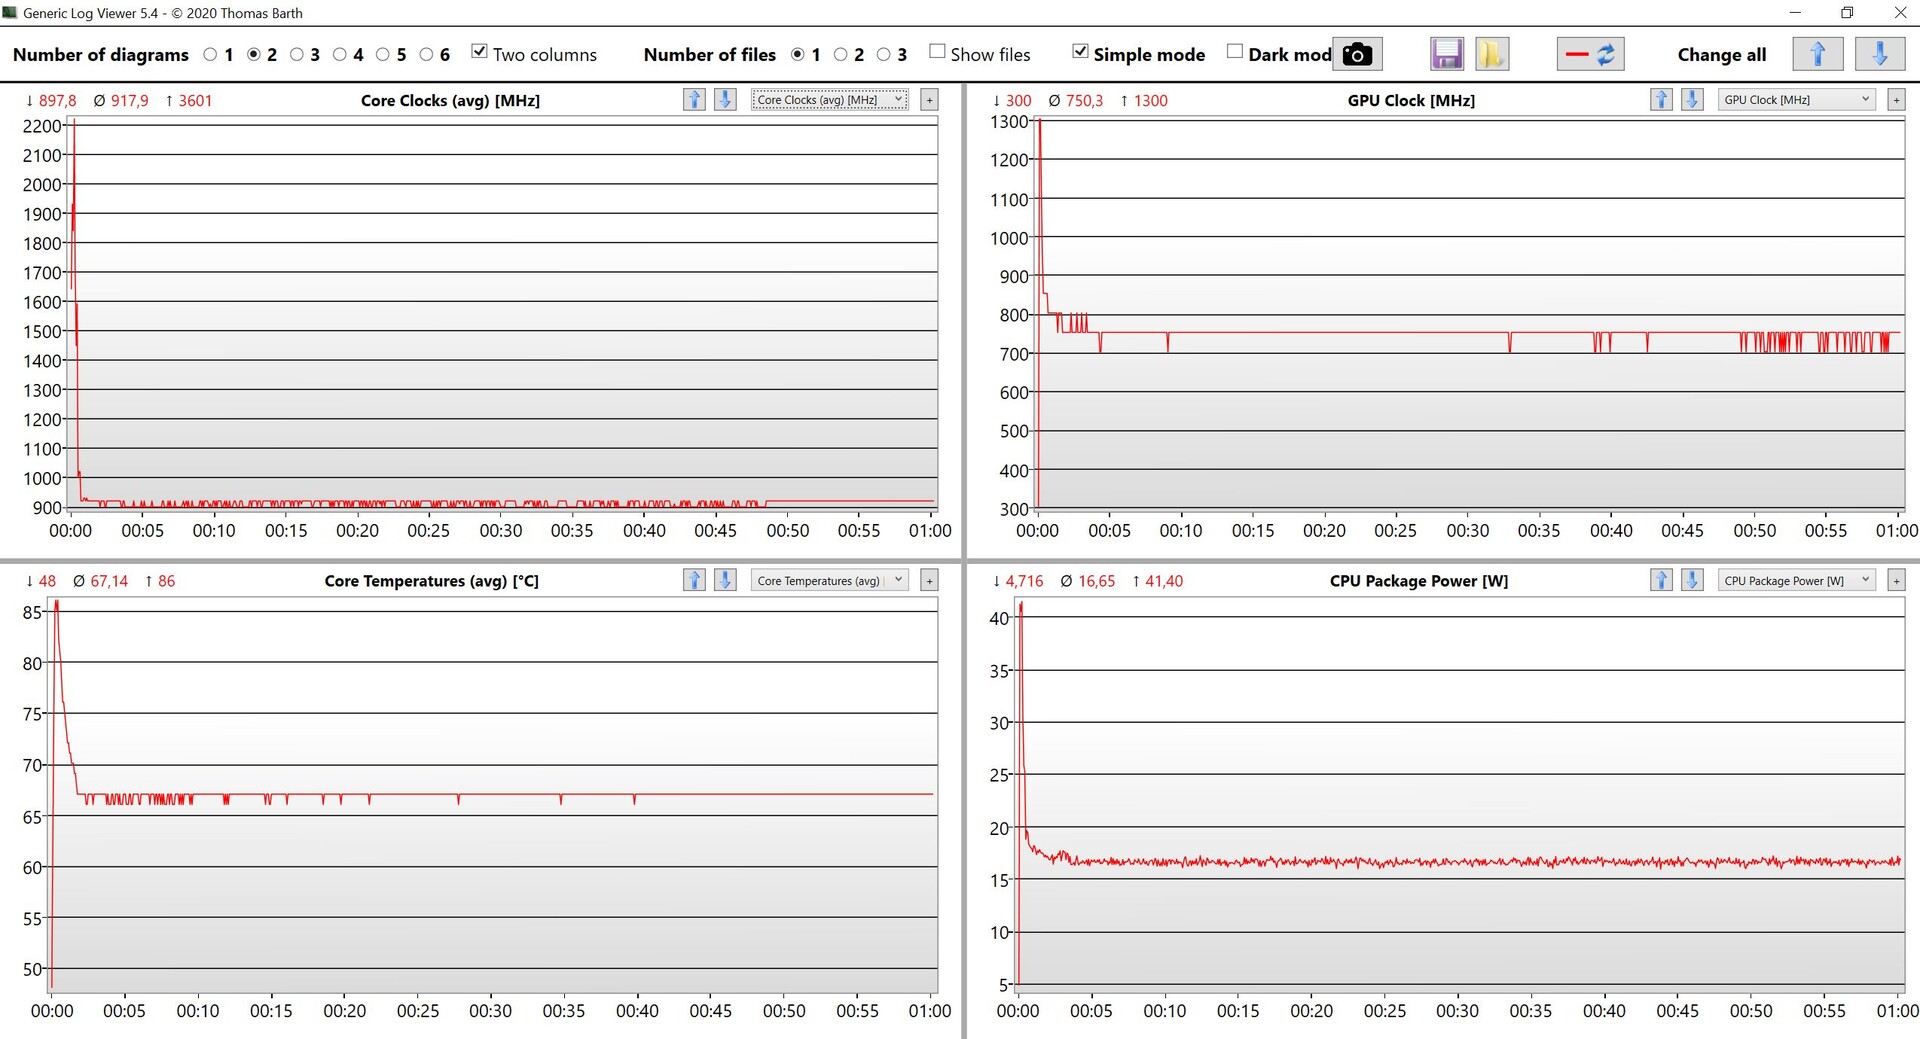
在压力测试中,我们短暂地看到了超过40瓦的消耗,但几秒钟后,这个数值就已经达到了略低于17瓦的水平,之后就保持在这个水平。
(±) The maximum temperature on the upper side is 43.1 °C / 110 F, compared to the average of 35.9 °C / 97 F, ranging from 21.4 to 59 °C for the class Subnotebook.
(±) The bottom heats up to a maximum of 45 °C / 113 F, compared to the average of 39.2 °C / 103 F
(+) In idle usage, the average temperature for the upper side is 24.6 °C / 76 F, compared to the device average of 30.8 °C / 87 F.
(±) Playing The Witcher 3, the average temperature for the upper side is 34.8 °C / 95 F, compared to the device average of 30.8 °C / 87 F.
(+) The palmrests and touchpad are cooler than skin temperature with a maximum of 26.1 °C / 79 F and are therefore cool to the touch.
(+) The average temperature of the palmrest area of similar devices was 28.2 °C / 82.8 F (+2.1 °C / 3.8 F).
| Asus ZenBook S13 OLED UX5304 Intel Core i7-1355U, Intel Iris Xe Graphics G7 96EUs | Asus Zenbook S 13 OLED AMD Ryzen 7 6800U, AMD Radeon 680M | Apple MacBook Air M2 10C GPU Apple M2, Apple M2 10-Core GPU | Lenovo Yoga Slim 7 Carbon 13IAP7-82U9005FGE Intel Core i7-1260P, Intel Iris Xe Graphics G7 96EUs | Samsung Galaxy Book2 Pro 13 NP930XED-KA1DE Intel Core i5-1240P, Intel Iris Xe Graphics G7 80EUs | |
|---|---|---|---|---|---|
| Heat | -8% | 4% | -10% | -9% | |
| Maximum Upper Side * (°C) | 43.1 | 47.9 -11% | 44.7 -4% | 43.9 -2% | 47.9 -11% |
| Maximum Bottom * (°C) | 45 | 56.1 -25% | 44.6 1% | 53.1 -18% | 51.3 -14% |
| Idle Upper Side * (°C) | 27.3 | 26.8 2% | 25.1 8% | 28.7 -5% | 28.5 -4% |
| Idle Bottom * (°C) | 27.8 | 27.3 2% | 25.3 9% | 31.6 -14% | 29.6 -6% |
* ... smaller is better
发言人
两个内置的扬声器提供了良好的性能,由于软件的放大作用,甚至可以变得非常响亮。但与目前的MacBook Air M2相比,有一个明显可闻的区别 Apple MacBook Air M2总体而言。不过,对于背景音乐或视频来说,质量还是完全足够的。
Asus ZenBook S13 OLED UX5304 audio analysis
(+) | speakers can play relatively loud (83 dB)
Bass 100 - 315 Hz
(±) | reduced bass - on average 14.4% lower than median
(+) | bass is linear (6.6% delta to prev. frequency)
Mids 400 - 2000 Hz
(+) | balanced mids - only 3.2% away from median
(+) | mids are linear (4.1% delta to prev. frequency)
Highs 2 - 16 kHz
(+) | balanced highs - only 2.7% away from median
(+) | highs are linear (3.5% delta to prev. frequency)
Overall 100 - 16.000 Hz
(+) | overall sound is linear (12.8% difference to median)
Compared to same class
» 19% of all tested devices in this class were better, 4% similar, 76% worse
» The best had a delta of 5%, average was 18%, worst was 53%
Compared to all devices tested
» 12% of all tested devices were better, 3% similar, 85% worse
» The best had a delta of 4%, average was 23%, worst was 134%
Apple MacBook Air M2 10C GPU audio analysis
(+) | speakers can play relatively loud (82.7 dB)
Bass 100 - 315 Hz
(±) | reduced bass - on average 12.2% lower than median
(±) | linearity of bass is average (12.6% delta to prev. frequency)
Mids 400 - 2000 Hz
(+) | balanced mids - only 1.1% away from median
(+) | mids are linear (3.1% delta to prev. frequency)
Highs 2 - 16 kHz
(+) | balanced highs - only 2.4% away from median
(+) | highs are linear (1.9% delta to prev. frequency)
Overall 100 - 16.000 Hz
(+) | overall sound is linear (9.5% difference to median)
Compared to same class
» 5% of all tested devices in this class were better, 2% similar, 93% worse
» The best had a delta of 5%, average was 18%, worst was 53%
Compared to all devices tested
» 4% of all tested devices were better, 1% similar, 95% worse
» The best had a delta of 4%, average was 23%, worst was 134%
电源管理 - 一个持久的Zenbook
消耗功率
在空闲运行期间,新机型的效率略高于其 AMD的前辈.我们在相同的墙纸和黑暗的Windows模式下测量了这两种型号。在明亮的图像内容下,OLED面板的耗电量增加。在播放HDR视频时也是如此,在全亮度下,峰值可以达到20瓦以上。
在压力测试中,我们在开始时测得的最大功率几乎为60瓦,但几秒钟后,消耗量就已经达到30瓦左右。附带的65瓦的充电器完全足够。
| Off / Standby | |
| Idle | |
| Load |
|
Key:
min: | |
| Asus ZenBook S13 OLED UX5304 i7-1355U, Iris Xe G7 96EUs, Samsung PM9A1 MZVL21T0HCLR, OLED, 2880x1800, 13.3" | Asus Zenbook S 13 OLED R7 6800U, Radeon 680M, Samsung PM9A1 MZVL21T0HCLR, OLED, 2880x1800, 13.3" | Apple MacBook Air M2 10C GPU M2, M2 10-Core GPU, Apple SSD AP1024Z, IPS, 2560x1664, 13.6" | Lenovo Yoga Slim 7 Carbon 13IAP7-82U9005FGE i7-1260P, Iris Xe G7 96EUs, Samsung PM9A1 MZVL21T0HCLR, IPS, 2560x1600, 13.3" | Dell XPS 13 Plus 9320 i7-1280P OLED i7-1280P, Iris Xe G7 96EUs, WDC PC SN810 512GB, OLED, 3456x2160, 13.4" | Samsung Galaxy Book2 Pro 13 NP930XED-KA1DE i5-1240P, Iris Xe G7 80EUs, Samsung PM991a MZVLQ256HBJD, OLED, 1920x1080, 13.3" | Average Intel Iris Xe Graphics G7 96EUs | Average of class Subnotebook | |
|---|---|---|---|---|---|---|---|---|
| Power Consumption | -11% | 13% | -29% | -33% | 5% | -13% | 8% | |
| Idle Minimum * (Watt) | 5.8 | 4.8 17% | 1.9 67% | 6.9 -19% | 6.5 -12% | 4.3 26% | 5.51 ? 5% | 3.73 ? 36% |
| Idle Average * (Watt) | 8.5 | 8.7 -2% | 9.6 -13% | 10.3 -21% | 7.8 8% | 6 29% | 8.66 ? -2% | 6.51 ? 23% |
| Idle Maximum * (Watt) | 8.8 | 10.1 -15% | 9.7 -10% | 10.9 -24% | 13 -48% | 8.8 -0% | 10.9 ? -24% | 7.88 ? 10% |
| Load Average * (Watt) | 35.1 | 45.6 -30% | 32.4 8% | 49.2 -40% | 56.6 -61% | 36 -3% | 45.6 ? -30% | 42.3 ? -21% |
| Witcher 3 ultra * (Watt) | 27.6 | 42.4 -54% | 30.8 -12% | 45.3 -64% | 49.2 -78% | 32.9 -19% | ||
| Load Maximum * (Watt) | 59.5 | 49.5 17% | 35.7 40% | 62.5 -5% | 63 -6% | 60 -1% | 67.8 ? -14% | 64.8 ? -9% |
* ... smaller is better
Power Consumption The Witcher 3 / Stress Test
Power Consumption With External Monitor
电池寿命
电池容量为63Wh,略低于旧型号的电池容量。 旧型号.在我们的视频测试中,在150cd/m²(相当于我们测试装置中最大SDR亮度的74%)下,电池寿命几乎达到14小时,仍然是一个非常好的结果。WLAN测试在150cd/m²下运行了11小时以上,在全亮度下仍略高于8小时。 HDR YouTube视频在全亮度下运行了4.5小时。总的来说,对于超薄的Zenbook来说,这些是非常好的结果。
| Asus ZenBook S13 OLED UX5304 i7-1355U, Iris Xe G7 96EUs, 63 Wh | Asus Zenbook S 13 OLED R7 6800U, Radeon 680M, 67 Wh | Apple MacBook Air M2 10C GPU M2, M2 10-Core GPU, 52.6 Wh | Lenovo Yoga Slim 7 Carbon 13IAP7-82U9005FGE i7-1260P, Iris Xe G7 96EUs, 50.2 Wh | Dell XPS 13 Plus 9320 i7-1280P OLED i7-1280P, Iris Xe G7 96EUs, 55 Wh | Samsung Galaxy Book2 Pro 13 NP930XED-KA1DE i5-1240P, Iris Xe G7 80EUs, 63 Wh | Average of class Subnotebook | |
|---|---|---|---|---|---|---|---|
| Battery runtime | -3% | 22% | -37% | -49% | -3% | 6% | |
| H.264 (h) | 13.8 | 15.2 10% | 15.8 14% | 10.5 -24% | 11.6 -16% | 15.3 ? 11% | |
| WiFi v1.3 (h) | 11.3 | 9.2 -19% | 14.7 30% | 7.5 -34% | 5.8 -49% | 11.6 3% | 14 ? 24% |
| Load (h) | 2.4 | 2.4 0% | 1.1 -54% | 2.5 4% | 1.998 ? -17% |
Pros
Cons
评语--有很多光,但也有暗影
新的Zenbook S 13让我们喜忧参半,特别是由于 去年的型号是如此之好。华硕对该设备进行了彻底改造,使笔记本电脑明显变薄。结果看起来也不错,外壳给人留下了很好的印象,特别是还在稳定性方面。新的等离子陶瓷表面感觉很好,没有指纹的问题。此外,它现在包括一些已知的连接,如一个HDMI端口和一个普通的USB-A连接,在这样一个超薄的设备中,这是一个很好的成就。
然而,为了瘦身设计,按键不得不缩短了0.3毫米(约0.012英寸)。虽然键盘仍然很体面,但老款Zenbook提供了更舒适的打字体验。此外,现在的冷却效果比较弱,即使新的英特尔 酷睿i7-1355U猛禽湖处理器提供了略高的单核性能,但它显然被去年的 AMD Ryzen 7 6800U在多核情况下,特别是在iGPU方面。
OLED显示屏继续提供良好的图像质量,在交付状态下已经实现了非常准确的色彩再现。此外,华硕是目前唯一提供软件解决方案以防止有害的PWM闪烁的制造商,即使在低亮度设置下也能实现直流调光。
新的华硕Zenbook S 13已经明显变薄,但新的英特尔处理器的整体性能也低于其AMD前辈。但最大的问题是,即使在低风扇速度下,高频的风扇噪音。
新Zenbook的最大问题是风扇,即使在低速时也会产生非常高的频率噪音。这简直令人讨厌,即使在日常工作中也是如此。因此,我们也降低了对这一类别的评价。虽然在许多方面的性能都很好,但我们很难因为这个原因推荐这款新机型。那些不介意3毫米(约0.12英寸)厚的设备的人应该看一下 去年的Zenbook S 13或者等待带有新Ryzen Zen4芯片的2022年更新版本。
Asus ZenBook S13 OLED UX5304
- 04/29/2023 v7 (old)
Andreas Osthoff
Transparency
The selection of devices to be reviewed is made by our editorial team. The test sample was provided to the author as a loan by the manufacturer or retailer for the purpose of this review. The lender had no influence on this review, nor did the manufacturer receive a copy of this review before publication. There was no obligation to publish this review. As an independent media company, Notebookcheck is not subjected to the authority of manufacturers, retailers or publishers.
This is how Notebookcheck is testing
Every year, Notebookcheck independently reviews hundreds of laptops and smartphones using standardized procedures to ensure that all results are comparable. We have continuously developed our test methods for around 20 years and set industry standards in the process. In our test labs, high-quality measuring equipment is utilized by experienced technicians and editors. These tests involve a multi-stage validation process. Our complex rating system is based on hundreds of well-founded measurements and benchmarks, which maintains objectivity. Further information on our test methods can be found here.
Price comparison

