


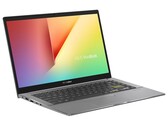
华硕VivoBook S14 S433FL笔记本电脑评测:多彩的坚固机身
华硕在视觉上为VivoBook S14增添色彩,提供具有多种颜色选择的耐用设备。 此外,还有各种功能,其中有些自相矛盾的地方。 我们的评测会告诉您VivoBook S14还提供什么。
Intel Core i7-10510U, NVIDIA GeForce MX250, 14", 1.4 kg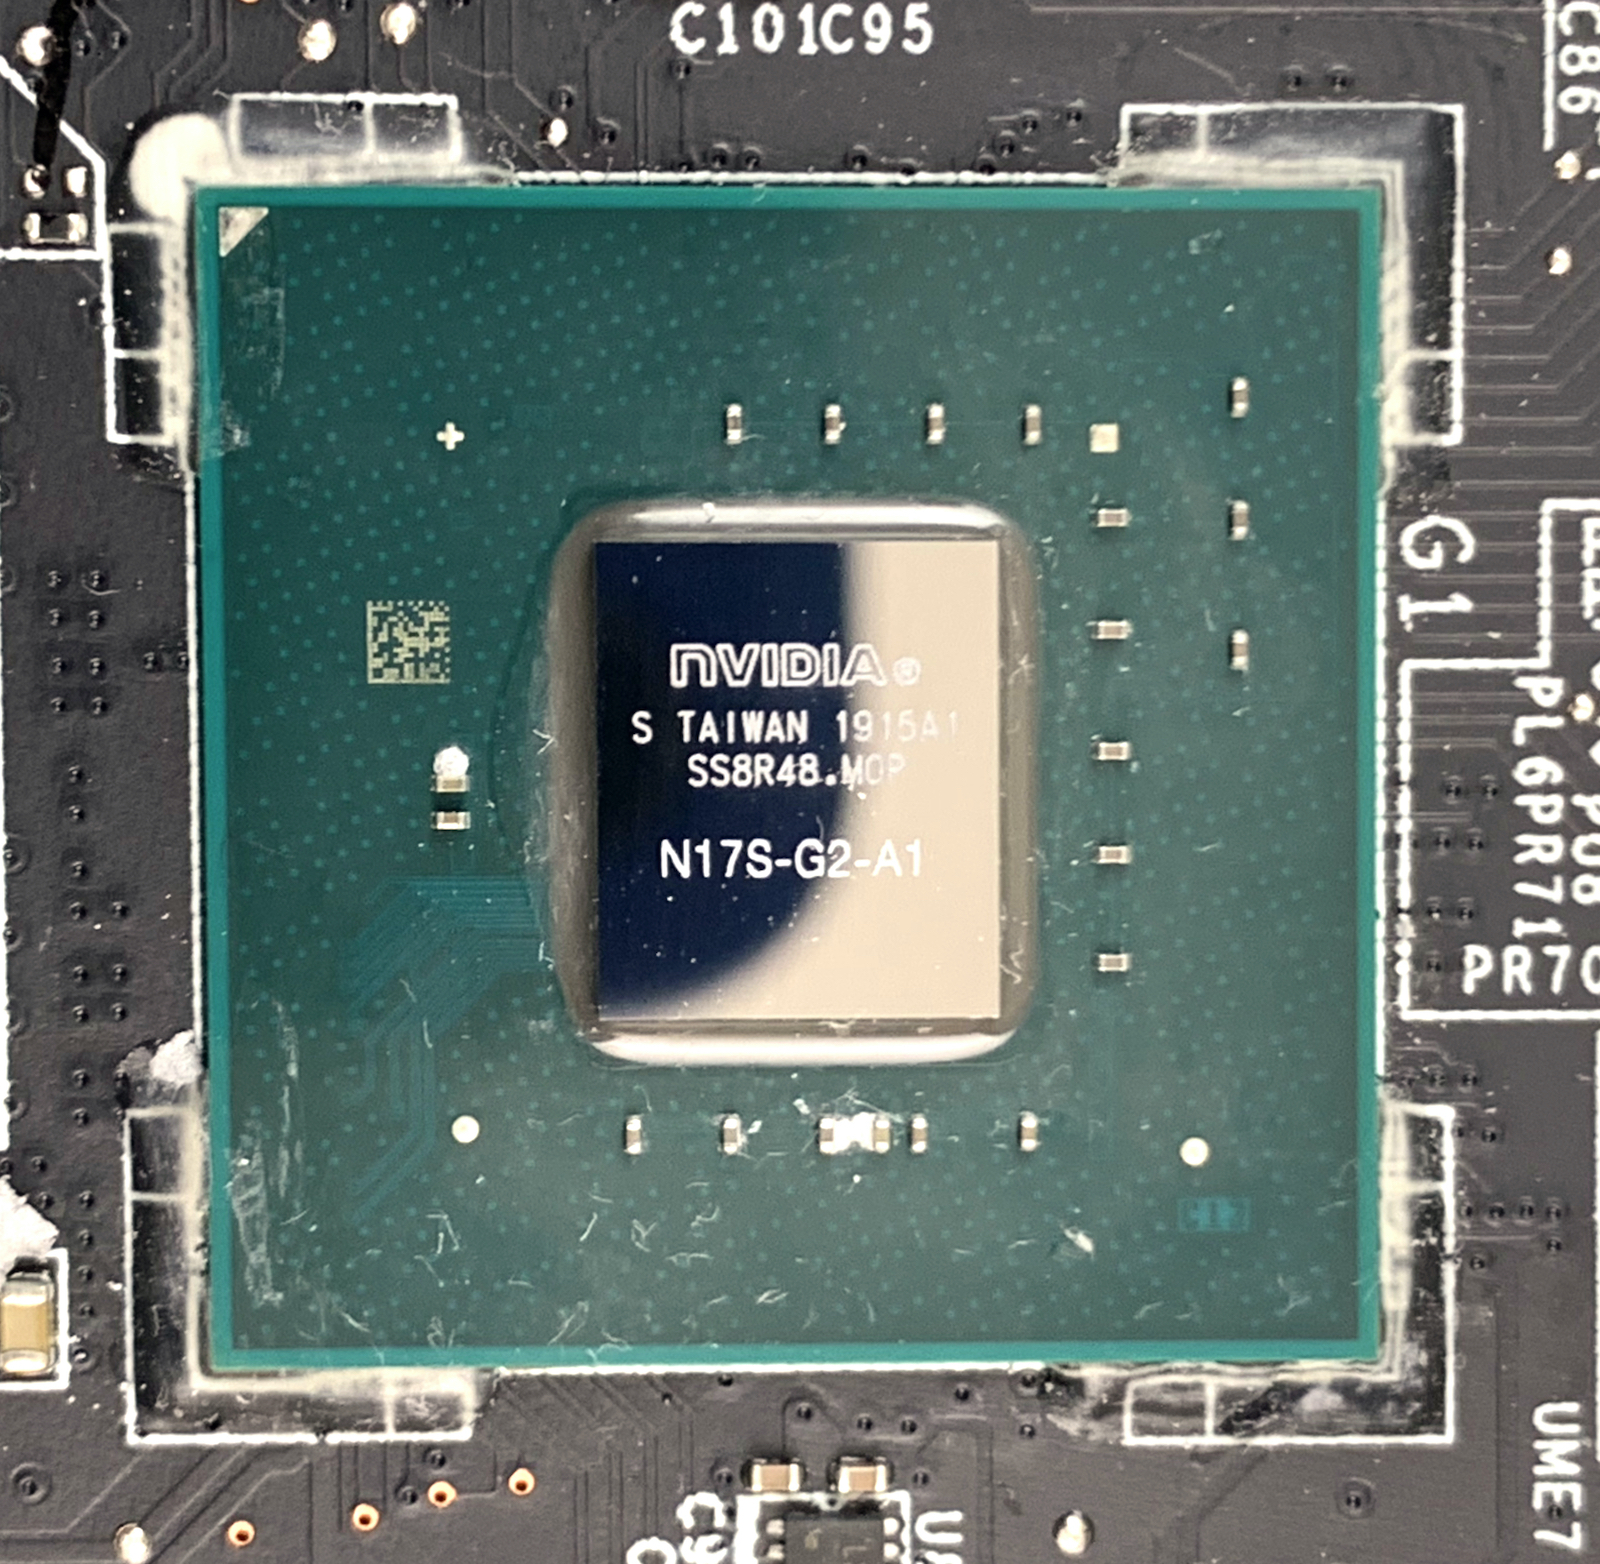
Nvidia GeForce MX250是专用于笔记本电脑的入门级移动图形卡。它与前代产品GeForce MX150 /台式机GeForce GT 1030基于相同的Pascal GP108芯片,但具有更高的频率。与MX150一样,MX250有两种版本,正常的25瓦版本(设备ID:1D13)和低功率的10瓦TDP(设备ID:1D25)和降低的性能(具有10W的MX150降低了32%频率)。 GDDR5内存接口现在还支持高达3.5 GHz = 7 GHz的有效速度(高于3 GHz)。
GP108芯片是三星(LPP)14 nm FinFET工艺制造,并提供了许多新功能,包括对DisplayPort 1.4,HDMI 2.0b,HDR的支持以及改进的H.265视频解编码和编码(PlayReady)。 3.0)。但是,由于需要至少3 GB的图形内存,因此无法运行带Netflix的4K HDR。与较大的Pascal芯片相比,GP108不支持用于VR和G-Sync的同时多投影(SMP)。完整的改进项目和新的Pascal台式机GPU可在我们专门的Pascal架构文章里找到。
由于提高了核心频率(25瓦版本的Boost高达+ 3%,并且内存速度更快),新的MX250应该比旧的MX150稍强。基准测试表明性能增加了5%。新游戏只能在低设置下流畅地运行(有关游戏和基准,请参阅MX150的页面)。
GeForce MX200 Series
| |||||||
| Codename | N17S-G2 | ||||||
| Architecture | Pascal | ||||||
| Pipelines | 384 - unified | ||||||
| TMUs | 32 | ||||||
| ROPs | 16 | ||||||
| Core Speed | 1518 - 1582 (Boost) MHz | ||||||
| Memory Speed | 7000 effective = 1502 MHz | ||||||
| Memory Bus Width | 64 Bit | ||||||
| Memory Type | GDDR5 | ||||||
| Max. Amount of Memory | 4 GB | ||||||
| Shared Memory | no | ||||||
| Memory Bandwidth | 48.1 GB/s | ||||||
| API | DirectX 12_1, OpenGL 4.5 | ||||||
| Power Consumption | 10/25 Watt | ||||||
| Man. Technology | 14 nm | ||||||
| PCIe | 3.0 | ||||||
| Features | Vulkan 1.1, OpenGL 4.6, OpenCL 1.2, GPU Boost 3.0, Multi Monitor, Nvidia Optimus | ||||||
| Date of Announcement | 20.02.2019 | ||||||
| Link to Manufacturer Page | www.geforce.com | ||||||
The following benchmarks stem from our benchmarks of review laptops. The performance depends on the used graphics memory, clock rate, processor, system settings, drivers, and operating systems. So the results don't have to be representative for all laptops with this GPU. For detailed information on the benchmark results, click on the fps number.


For more games that might be playable and a list of all games and graphics cards visit our Gaming List
HP Pavilion 14-ce3040ng: Intel Core i7-1065G7, 14.00", 1.6 kg
Review » 惠普Pavilion 14笔记本电脑评测:时尚的全能手,屏幕也很亮
Lenovo ThinkPad T590-20N4002VGE: Intel Core i7-8565U, 15.60", 1.9 kg
Review » 联想ThinkPad T590商务笔记本电脑评测:大而轻,屏幕差劲。
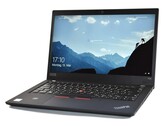
Lenovo ThinkPad T490-20N3S02L00: Intel Core i7-8565U, 14.00", 1.5 kg
Review » 联想ThinkPad T490(i7, MX250, 低功耗FHD)笔记本电脑评测
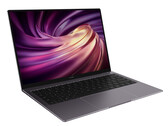
Huawei MateBook 14 KLV-W29: Intel Core i7-8565U, 14.00", 1.5 kg
Review » 华为Matebook 14 (i7-8565U, GeForce MX250) 笔记本电脑评测
HP 15s-du1031tx: Intel Core i7-10510U, 15.60", 1.8 kg
External Review » HP 15s-du1031tx
Huawei Matebook D 14, i5-10210U MX250: Intel Core i5-10210U, 14.00", 1.4 kg
External Review » Huawei Matebook D 14, i5-10210U MX250
Asus VivoBook S15 S533FL-BQ057T: Intel Core i7-10510U, 15.60", 1.8 kg
External Review » Asus VivoBook S15 S533FL-BQ057T
Dell Latitude 14 5411-WJ40N: Intel Core i7-10850H, 14.00", 1.5 kg
External Review » Dell Latitude 14 5411-WJ40N
Huawei MateBook X 2020 i5: Intel Core i5-10210U, 13.90", 1.3 kg
External Review » Huawei MateBook X 2020 i5
Asus VivoBook S14 S433FL-EB180T: Intel Core i7-10510U, 14.00", 1.5 kg
External Review » Asus VivoBook S14 S433FL-EB180T
HP EliteBook 850 G7, i7-10510U MX250: Intel Core i7-10510U, 15.60", 1.7 kg
External Review » HP EliteBook 850 G7, i7-10510U MX250
Asus VivoBook S14 S433FL-EB181: Intel Core i7-10510U, 14.00", 1.4 kg
External Review » Asus VivoBook S14 S433FL-EB181
Huawei MateBook 13 2020 MX250 i7: Intel Core i7-10510U, 13.00", 1.3 kg
External Review » Huawei MateBook 13 2020 MX250 i7
Xiaomi Mi Notebook 14, i5-10210U MX250: Intel Core i5-10210U, 14.00", 1.5 kg
External Review » Xiaomi Mi Notebook 14, i5-10210U MX250
Huawei MateBook 14 KLV-W29: Intel Core i7-8565U, 14.00", 1.5 kg
External Review » Huawei MateBook 14 KLV-W29
Acer TravelMate P6 TMP614-51TG-G2: Intel Core i7-10510U, 14.00", 1.2 kg
External Review » Acer TravelMate P6 TMP614-51TG-G2
Asus VivoBook S15 S533FL-BQ024T: Intel Core i7-10510U, 15.60", 1.8 kg
External Review » Asus VivoBook S15 S533FL-BQ024T
Asus ZenBook 13 UX334FLC-A3167T: Intel Core i7-10510U, 13.30", 1.2 kg
External Review » Asus ZenBook 13 UX334FLC-A3167T
HP Pavilion 15-cs3022ns: Intel Core i7-1065G7, 15.60", 1.9 kg
External Review » HP Pavilion 15-cs3022ns
Asus VivoBook S15 S533F-LBQ536T: Intel Core i5-10210U, 15.60", 1.8 kg
External Review » Asus VivoBook S15 S533F-LBQ536T
Acer Swift 3 SF314-58G-77JX: Intel Core i5-10210U, 14.00", 1.6 kg
External Review » Acer Swift 3 SF314-58G-77JX
MSI Modern 15 A10RB: Intel Core i7-10510U, 15.60", 1.6 kg
External Review » MSI Modern 15 A10RB
Huawei MateBook 13 2020 MX250: Intel Core i5-10210U, 13.00", 1.3 kg
External Review » Huawei MateBook 13 2020 MX250
Acer Aspire 5 A514-52G-7045: Intel Core i7-10510U, 14.00", 1.6 kg
External Review » Acer Aspire 5 A514-52G-7045
MSI Prestige 14 A10RB: Intel Core i7-10710U, 14.00", 1.3 kg
External Review » MSI Prestige 14 A10RB
MSI PS42 Modern 8RA-280XES: Intel Core i7-8565U, 14.00", 1.2 kg
External Review » MSI PS42 Modern 8RA-280XES
HP Pavilion 14-ce3013tx: Intel Core i7-1065G7, 14.00", 1.6 kg
External Review » HP Pavilion 14-ce3013tx
Asus ZenBook Duo UX481FL: Intel Core i7-10510U, 14.00", 1.8 kg
External Review » Asus ZenBook Duo UX481FL
Lenovo IdeaPad S540-15IML-81NG00A3GE: Intel Core i7-10510U, 15.60", 2 kg
External Review » Lenovo IdeaPad S540-15IML-81NG00A3GE
Huawei MateBook X Pro 2020 i7: Intel Core i7-10510U, 13.90", 1.3 kg
External Review » Huawei MateBook X Pro 2020 i7
HP Pavilion 15-cs2019ng: Intel Core i5-8265U, 15.60", 1.9 kg
External Review » HP Pavilion 15-cs2019ng
Dell Inspiron 14 7490-D0R43: Intel Core i7-10510U, 14.00", 1.3 kg
External Review » Dell Inspiron 14 7490-D0R43
Asus VivoBook S14 S432FL-EB074T: Intel Core i5-10210U, 14.00", 1.5 kg
External Review » Asus VivoBook S14 S432FL-EB074T
Asus VivoBook S14 S433FL-EB008T: Intel Core i5-10210U, 14.00", 1.5 kg
External Review » Asus VivoBook S14 S433FL-EB008T
Asus VivoBook S15 S532FL-BQ049T: Intel Core i5-8265U, 15.60", 1.8 kg
External Review » Asus VivoBook S15 S532FL-BQ049T
Asus VivoBook S14 S433FL: Intel Core i7-10510U, 14.00", 1.4 kg
External Review » Asus VivoBook S14 S433FL-EB029T
MSI Modern 14 A10RB: Intel Core i7-10710U, 14.00", 1.2 kg
External Review » MSI Modern 14 A10RB
HP Pavilion 14-ce3005ns: Intel Core i7-1065G7, 14.00", 1.6 kg
External Review » HP Pavilion 14-ce3005ns
Acer Swift 5 Pro SF514-54GT-54PK: Intel Core i5-1035G1, 14.00", 1 kg
External Review » Acer Swift 5 Pro SF514-54GT-54PK
Asus VivoBook A512FL, i5 10210U, MX250: Intel Core i5-10210U, 15.60", 1.7 kg
External Review » Asus VivoBook A512FL, i5 10210U, MX250
Asus VivoBook S15 S532FL-BN184T: Intel Core i7-10510U, 15.60", 1.8 kg
External Review » Asus VivoBook S15 S532FL-BN184T
Lenovo IdeaPad S540-14IWL: Intel Core i5-8265U, 14.00", 1.4 kg
External Review » Lenovo IdeaPad S540-14IWL
Asus ZenBook 14 UX434FLC-A5131R: Intel Core i7-10510U, 14.00", 1.3 kg
External Review » Asus ZenBook 14 UX434FLC-A5131R
Asus ZenBook 14 UX431FL-AM049T: Intel Core i7-10510U, 14.00", 1.4 kg
External Review » Asus ZenBook 14 UX431FL-AM049T
MSI Modern 14 A10RB-663XES: Intel Core i7-10510U, 14.00", 1.2 kg
External Review » MSI Modern 14 A10RB-663XES
Acer Swift 5 SF514-54GT-762S: Intel Core i7-1065G7, 14.00", 1 kg
External Review » Acer Swift 5 SF514-54GT-762S
Xiaomi RedmiBook 13, i5-10210U: Intel Core i5-10210U, 13.30", 1.2 kg
External Review » Xiaomi RedmiBook 13, i5-10210U
Acer Aspire 5 A515-54G-54PC: Intel Core i5-10210U, 15.60", 1.9 kg
External Review » Acer Aspire 5 A515-54G-54PC
MSI Modern 14 A10RB-665XES: Intel Core i7-10510U, 14.00", 1.2 kg
External Review » MSI Modern 14 A10RB-665XES
Lenovo Ideapad S540-15IWL-81NE0040GE: Intel Core i7-8565U, 15.60", 2 kg
External Review » Lenovo Ideapad S540-15IWL-81NE0040GE
Asus Zenbook Pro Duo UX481FL-BM044T: Intel Core i7-10510U, 14.00", 1.5 kg
External Review » Asus Zenbook Pro Duo UX481FL-BM044T
Asus ZenBook 13 UX334FL-A4137T: Intel Core i7-8565U, 13.30", 1.2 kg
External Review » Asus ZenBook 13 UX334FL-A4137T
Lenovo Yoga S740-14IIL-81RS0016GE: Intel Core i7-1065G7, 14.00", 1.4 kg
External Review » Lenovo Yoga S740-14IIL-81RS0016GE
Asus ZenBook Duo UX481FL-BM039R: Intel Core i7-10510U, 14.00", 1.5 kg
External Review » Asus ZenBook Duo UX481FL-BM039R
Dell Vostro 14 5490: Intel Core i7-10510U, 14.00", 1.5 kg
External Review » Dell Vostro 14 5490, i7-10510U, MX250
Acer TravelMate P6 TMP614-51TG-792V: Intel Core i7-8565U, 14.00", 1.2 kg
External Review » Acer TravelMate P6 TMP614-51TG-792V
HP Pavilion x360 14-dh0226ng: Intel Core i7-8565U, 14.00", 1.6 kg
External Review » HP Pavilion x360 14-dh0226ng
Asus VivoBook 14 X412FL-EB151T: Intel Core i5-8265U, 14.00", 1.5 kg
External Review » Asus VivoBook 14 X412FL-EB151T
Acer Aspire 3 A317-51G-7604: Intel Core i7-10510U, 17.30", 2.7 kg
External Review » Acer Aspire 3 A317-51G-7604
Asus VivoBook S15 S512FL-BQ279T: Intel Core i7-8565U, 15.60", 1.8 kg
External Review » Asus VivoBook S15 S512FL-BQ279T
Asus VivoBook S15 S532FL-BN010T: Intel Core i7-8565U, 15.60", 1.8 kg
External Review » Asus VivoBook S15 S532FL-BN010T
Xiaomi RedmiBook 14 2019, i7-8565U: Intel Core i7-8565U, 14.00", 1.5 kg
External Review » Xiaomi RedmiBook 14 2019, i7-8565U
Acer Swift 5 SF514-54GT-70SY: Intel Core i7-1065G7, 14.00", 1 kg
External Review » Acer Swift 5 SF514-54GT-70SY
Asus Zenbook 14 UX434FL-A6015T: Intel Core i5-8265U, 14.00", 1.6 kg
External Review » Asus Zenbook 14 UX434FL-A6015T
Acer Aspire 5 A514-52G-516T: Intel Core i5-10210U, 14.00", 1.6 kg
External Review » Acer Aspire 5 A514-52G-516T
Acer Swift 3 SF314-56G-79D1: Intel Core i7-8565U, 14.00", 1.6 kg
External Review » Acer Swift 3 SF314-56G-79D1
Asus ZenBook 14 UX431FL-AN012T: Intel Core i7-8565U, 14.00", 1.5 kg
External Review » Asus ZenBook 14 UX431FL-AN012T
Dell Inspiron 15 7590 2-in-1: Intel Core i7-8565U, 15.60", 2 kg
External Review » Dell Inspiron 15 7590 2-in-1
Asus VivoBook S15 S532F: Intel Core i7-8565U, 15.60", 1.8 kg
External Review » Asus VivoBook S15 S532F
Asus VivoBook S15 S532FL-BN011T: Intel Core i5-8265U, 15.60", 1.8 kg
External Review » Asus VivoBook S15 S532FL-BN011T
HP Envy 13-aq0003ng: Intel Core i7-8565U, 13.30", 1.2 kg
External Review » HP Envy 13-aq0003ng
Lenovo Ideapad S340-15IWL-81N800CPGE: Intel Core i5-8265U, 15.60", 1.8 kg
External Review » Lenovo Ideapad S340-15IWL-81N800CPGE
Asus VivoBook 15 A512FL: Intel Core i5-8265U, 15.60", 1.8 kg
External Review » Asus VivoBook 15 A512FL
Asus VivoBook 15 X512FL-EJ205T: Intel Core i7-8565U, 15.60", 1.8 kg
External Review » Asus VivoBook 15 X512FL-EJ205T
Acer Aspire 5 A515-54G-7895: Intel Core i7-8565U, 15.60", 1.8 kg
External Review » Acer Aspire 5 A515-54G-7895
Asus ZenBook 14 UX434FL, i7-8565U: Intel Core i7-8565U, 14.00", 1.3 kg
External Review » Asus ZenBook 14 UX434FL, i7-8565U
Lenovo Ideapad S540-15IWL-81NE003XGE: Intel Core i5-8265U, 15.60", 2 kg
External Review » Lenovo Ideapad S540-15IWL-81NE003XGE
Asus ZenBook Edition 30 UX334FL, i7-8565U: Intel Core i7-8565U, 13.30", 1.3 kg
External Review » Asus ZenBook Edition 30 UX334FL, i7-8565U
Asus VivoBook S14 S431FL, i7-8565U: Intel Core i7-8565U, 14.00", 1.4 kg
External Review » Asus VivoBook S14 S431FL, i7-8565U
Asus VivoBook S15 S531FL, i7-8565U: Intel Core i7-8565U, 15.60", 1.8 kg
External Review » Asus VivoBook S15 S531FA, i7-8565U
Asus ZenBook Pro Duo UX481: Intel Core i7-9750H, 14.00", 1.8 kg
External Review » Asus ZenBook Pro Duo UX481
HP Envy 13-aq0005ng: Intel Core i7-8565U, 13.30", 1.2 kg
External Review » HP Envy 13-aq0005ng
Huawei MateBook X Pro 2019, i7-8565U: Intel Core i7-8565U, 13.90", 1.3 kg
External Review » Huawei MateBook X Pro 2019, i7-8565U
Huawei MateBook 14-KLV-W29B: Intel Core i7-8565U, 14.00", 1.5 kg
External Review » Huawei MateBook 14-KLV-W29B
Huawei MateBook X Pro 2019, i5-8265U: Intel Core i5-8265U, 13.90", 1.3 kg
External Review » Huawei MateBook X Pro 2019, i5-8265U
Huawei MateBook 14, i5 (KLV-W19): Intel Core i5-8265U, 14.00", 1.5 kg
External Review » Huawei MateBook 14, i5 (KLV-W19)
» Comparison of GPUs
Detailed list of all laptop GPUs sorted by class and performance.
» Benchmark List
Sort and restrict laptop GPUs based on performance in synthetic benchmarks.
» Notebook Gaming List
Playable games for each graphics card and their average FPS results.
* Approximate position of the graphics adapter
» Notebookcheck多媒体笔记本电脑Top 10排名
» Notebookcheck游戏笔记本电脑Top 10排名
» Notebookcheck低价办公/商务笔记本电脑Top 10排名
» Notebookcheck高端办公/商务笔记本电脑Top 10排名
» Notebookcheck工作站笔记本电脑Top 10排名
» Notebookcheck亚笔记本电脑Top 10排名
» Notebookcheck超级本产品Top 10排名
» Notebookcheck变形本产品Top 10排名
» Notebookcheck平板电脑Top 10排名
» Notebookcheck智能手机Top 10排名
» Notebookcheck评测过最出色的笔记本电脑屏幕
» Notebookcheck售价500欧元以下笔记本电脑Top 10排名
» Notebookcheck售价300欧元以下笔记本电脑Top 10排名