Notebookcheck Logo

Intel HD Graphics 4600

Intel HD Graphics 4600

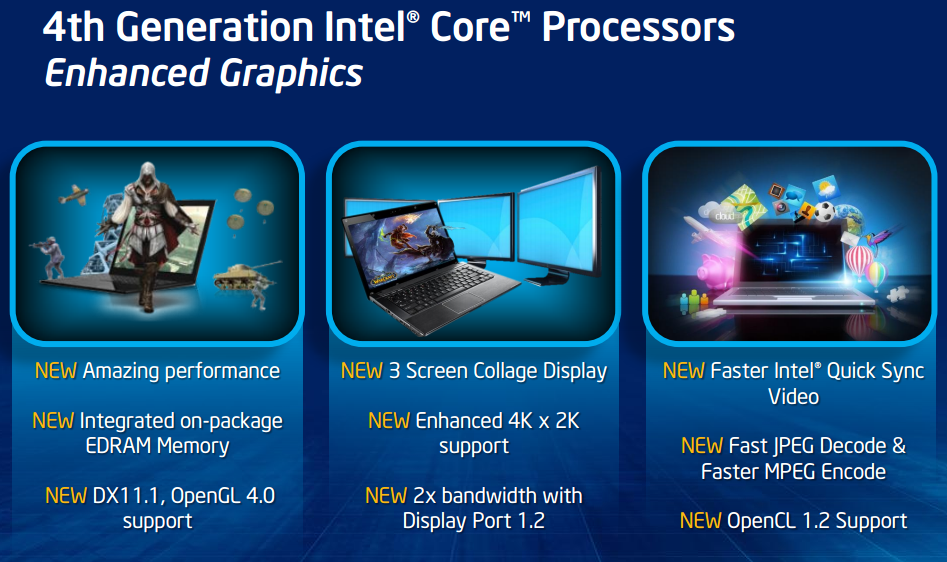
英特尔HD Graphics4600(GT2)是一个处理器的图形卡,包括在2013年(第四代核心)的Haswell处理器。 Turbo Boost技术,可以自动超频使用的基准时钟。根据不同的处理器型号,基地和涡轮增压的时钟速率可以有很大的不同,导致在不同的图形性能。图形单元的确切功能还是一个未知数。它已被证实,但HD 4600支持DirectX11.1的OpenCL1.2和OpenGL 4.0的。 HD 4600还具有改进的4K视频解码器,和快速的快速同步编码器。高清显卡4600,预计将有20 EUS(HD 4000:16个执行单元),这应该提高性能,相比HD 4000约20%。这将是前等中档卡的GeForce GT 525M范围内。由于3D三栅极的22nm生产工艺,应该是比较低的功耗。全包(包括处理器和内存控制器)的TDP变化之间的15 W到57 W的消费类笔记本的CPU。

HD Graphics Series

HD Graphics P530 24 @ 0.35 - 1.05 GHz64/128 Bit
HD Graphics 5600 24 @ 0.3 - 1.05 GHz64/128 Bit
HD Graphics 6000 48 @ 0.3 - 1 GHz64/128 Bit
HD Graphics 4600 20 @ 0.2 - 1.35 GHz64/128 Bit
HD Graphics 5500 24 @ 0.3 - 0.95 GHz64/128 Bit
HD Graphics 5000 40 @ 0.2 - 1.1 GHz64/128 Bit
HD Graphics 4400 20 @ 0.2 - 1.1 GHz64/128 Bit
HD Graphics 5300 24 @ 0.1 - 0.9 GHz64/128 Bit
HD Graphics 4000 16 @ 0.35 - 1.35 GHz64/128 Bit
HD Graphics (Broadwell) 12 @ 0.1 - 0.85 GHz64/128 Bit
HD Graphics 4200 20 @ 0.2 - 0.85 GHz64/128 Bit
HD Graphics (Skylake) 12 @ 0.3 - 0.8 GHz64/128 Bit
HD Graphics 405 (Braswell) 16 @ 0.32 - 0.7 GHz64/128 Bit
HD Graphics (Braswell) 16 @ 0.32 - 0.7 GHz64/128 Bit
HD Graphics 400 (Braswell) 12 @ 0.32 - 0.64 GHz64/128 Bit
HD Graphics (Haswell) 10 @ 0.2 - 1 GHz64/128 Bit
HD Graphics (Cherry Trail) 16 @ 0.2 - 0.6 GHz64/128 Bit
HD Graphics 3000 12 @ 0.35 - 1.35 GHz64/128 Bit
HD Graphics 2500 6 @ 0.65 - 1.15 GHz64/128 Bit
HD Graphics (Ivy Bridge) 6 @ 0.35 - 1.1 GHz64/128 Bit
HD Graphics 2000 6 @ 0.85 - 1.35 GHz64/128 Bit
HD Graphics (Sandy Bridge) 6 @ 0.35 - 1.1 GHz64/128 Bit
HD Graphics (Bay Trail) 4 @ 0.31 - 0.9 GHz32/64/128 Bit
CodenameHaswell GT2
ArchitectureGen. 7.5 Haswell
Pipelines20 - unified
Core Speed200 - 1350 (Boost) MHz
Memory Bus Width64/128 Bit
Shared Memoryyes
APIDirectX 11.1, Shader 5.0, OpenGL 4.0
technology22 nm
FeaturesQuickSync
Date of Announcement01.06.2013
CPU in HD Graphics 4600GPU Base SpeedGPU Boost / Turbo
Intel Core i7-4790K4 x 4000 MHz, 88 W350 MHz1250 MHz
Intel Core i7-47904 x 3600 MHz, 84 W350 MHz1200 MHz
Intel Core i7-4770K4 x 3500 MHz, 84 W400 MHz1200 MHz
min. - max.200 - 400 MHz900 - 1350 MHz

Benchmarks

Performance Rating - 3DMark 11 + Fire Strike + Time Spy
0.3 pt (1%)
AMD Radeon HD 8180
0.06605 -77%
...
0.2592 -10%
Intel HD Graphics 4400
0.2592 -10%
0.2592 -10%
0.2606 -10%
AMD Radeon R4 (Stoney Ridge)
0.2656 -8%
0.2756 -5%
0.2767 -4%
Intel HD Graphics 510
0.2829 -2%
0.2838 -2%
Intel HD Graphics 4600
0.2895
0.2938 1%
0.302 4%
AMD Radeon HD 7640G + HD 7610M Dual Graphics
0.302 4%
Intel UHD Graphics 610
0.3022 4%
Intel HD Graphics 515
0.315 9%
0.3207 11%
Intel HD Graphics 5000
0.3259 13%
0.3262 13%
0.3275 13%
...
21.1 7188%
max:
33.3 11403%
0%
100%
3DMark - 3DMark Ice Storm Unlimited Graphics
min: 42224     avg: 42243     median: 42242.5 (5%)     max: 42261 Points
3DMark - 3DMark Ice Storm Extreme Graphics
min: 20937     avg: 25956     median: 22583 (3%)     max: 34347 Points
3DMark - 3DMark Cloud Gate Score
min: 3322     avg: 5276     median: 5040.5 (5%)     max: 7233 Points
3DMark - 3DMark Cloud Gate Graphics
min: 3892     avg: 5865     median: 5613 (1%)     max: 7536 Points
3DMark - 3DMark Fire Strike Standard Score
min: 432     avg: 650     median: 592.5 (1%)     max: 904 Points
3DMark - 3DMark Fire Strike Standard Graphics
min: 499     avg: 703     median: 635.5 (1%)     max: 978 Points
3DMark - 3DMark Ice Storm Graphics
min: 31725     avg: 47455     median: 48631 (6%)     max: 64426 Points
3DMark 11 - 3DM11 Performance Score
min: 655     avg: 1060     median: 1041 (1%)     max: 1464 Points
3DMark 11 - 3DM11 Performance GPU
min: 572     avg: 926     median: 910.5 (1%)     max: 1258 Points
171.8 -81%
...
AMD Radeon R4 (Stoney Ridge)
861 -7%
868 -6%
887 -4%
AMD Radeon HD 8610G
889 -4%
892 -4%
901 -3%
921 -1%
Intel UHD Graphics 610
923 0%
924 0%
Intel HD Graphics 4600
926
943 2%
944 2%
948 2%
977 6%
979 6%
982 6%
990 7%
990 7%
993 7%
...
59943 6373%
max:
106023 11350%
0%
100%
3DMark Vantage
3DM Vant. Perf. total +
3DMark Vantage - 3DM Vant. Perf. total
min: 3077     avg: 4802     median: 5203 (2%)     max: 6304 Points
3DM Vant. Perf. GPU no PhysX +
3DMark Vantage - 3DM Vant. Perf. GPU no PhysX
min: 2504     avg: 3860     median: 4132 (2%)     max: 5041 Points
ATI Radeon HD 3200
62 -98%
...
3677 -5%
3679 -5%
NVIDIA GeForce 9800M GTS
3700 -4%
NVIDIA GeForce 9800M GT
3725 -3%
AMD Radeon HD 8550G
3741 -3%
3750 -3%
3752 -3%
3804 -1%
3858 0%
Intel HD Graphics 4600
3860
3866 0%
NVIDIA GeForce GT 720M
3868 0%
3881 1%
3968 3%
3969 3%
3995 3%
4005 4%
AMD Radeon R5 M335
4032 4%
NVIDIA GeForce 9800M GTX
4123 7%
...
132443 3331%
max:
170928 4328%
0%
100%
3DMark 2001SE - 3DMark 2001 - Standard
38441 Points (40%)
3DMark 03 - 3DMark 03 - Standard
min: 18916     avg: 21326     median: 22200 (12%)     max: 22861 Points
3DMark 05 - 3DMark 05 - Standard
min: 13616     avg: 15058     median: 15760 (17%)     max: 15797 Points
Intel Graphics Media Accelerator (GMA) 500
133.4 -99%
...
NVIDIA GeForce GTS 250M
14733 -2%
NVIDIA GeForce GTX 260M
14773 -2%
14777 -2%
AMD Radeon HD 6570M
14855 -1%
NVIDIA GeForce 9800M GT
14869 -1%
AMD Radeon R7 M260
14924 -1%
ATI Mobility Radeon HD 4830
14938 -1%
NVIDIA GeForce 8800M GTX
14952 -1%
15011 0%
Intel HD Graphics 4600
15058
15064 0%
15249 1%
15284 2%
15365 2%
ATI Mobility Radeon HD 4850
15419 2%
15484 3%
15492 3%
AMD Radeon R7 M340
15629 4%
NVIDIA Quadro FX 3700M
15759 5%
...
61850 311%
max:
87172 479%
0%
100%
3DMark 06 3DMark 06 - Standard 1280x1024 +
3DMark 06
min: 4468     avg: 6795     median: 7362 (10%)     max: 8819 Points
Unigine Heaven 3.0 - Unigine Heaven 3.0 DX 11
min: 13.5     avg: 14.4     median: 14.4 (5%)     max: 15.2 fps
Unigine Heaven 3.0 - Unigine Heaven 3.0 OpenGL
min: 15.2     avg: 15.5     median: 15.5 (7%)     max: 15.8 fps
Unigine Heaven 2.1 - Heaven 2.1 high
15.3 fps (3%)
0.6 -96%
...
14 -8%
14.07 -8%
14.1 -8%
14.45 -6%
AMD Radeon R7 (Carrizo)
14.7 -4%
14.8 -3%
14.9 -3%
NVIDIA GeForce GT 720M
15.1 -1%
15.23 0%
Intel HD Graphics 4600
15.3
AMD Radeon R5 M335
15.3 0%
AMD Radeon R6 M340DX
15.3 0%
15.4 1%
15.4 1%
15.5 1%
15.5 1%
AMD FirePro M4100
15.6 2%
15.9 4%
16.2 6%
...
532 3377%
0%
100%
SPECviewperf 11
specvp11 snx-01 +
SPECviewperf 11 - specvp11 snx-01
min: 2.26     avg: 2.4     median: 2.4 (1%)     max: 2.64 fps
specvp11 tcvis-02 +
SPECviewperf 11 - specvp11 tcvis-02
min: 2.77     avg: 3.3     median: 3.3 (2%)     max: 3.9 fps
specvp11 sw-02 +
SPECviewperf 11 - specvp11 sw-02
min: 11.97     avg: 13.3     median: 13.4 (10%)     max: 14.48 fps
specvp11 proe-05 +
SPECviewperf 11 - specvp11 proe-05
min: 2.26     avg: 2.5     median: 2.5 (3%)     max: 2.69 fps
specvp11 maya-03 +
SPECviewperf 11 - specvp11 maya-03
min: 10.22     avg: 14.8     median: 15.2 (11%)     max: 18.57 fps
specvp11 lightwave-01 +
SPECviewperf 11 - specvp11 lightwave-01
min: 14.77     avg: 17.8     median: 18.2 (20%)     max: 20.05 fps
specvp11 ensight-04 +
SPECviewperf 11 - specvp11 ensight-04
min: 1.94     avg: 2.3     median: 2.4 (1%)     max: 2.47 fps
specvp11 catia-03 +
SPECviewperf 11 - specvp11 catia-03
6.6 fps (3%)
SPECviewperf 12
specvp12 sw-03 +
SPECviewperf 12 - specvp12 sw-03
2 fps (1%)
specvp12 snx-02 +
SPECviewperf 12 - specvp12 snx-02
2.6 fps (0%)
specvp12 showcase-01 +
SPECviewperf 12 - specvp12 showcase-01
11.8 fps (3%)
specvp12 mediacal-01 +
SPECviewperf 12 - specvp12 mediacal-01
2.1 fps (1%)
specvp12 maya-04 +
SPECviewperf 12 - specvp12 maya-04
10.9 fps (3%)
specvp12 energy-01 +
SPECviewperf 12 - specvp12 energy-01
14.9 fps (13%)
specvp12 creo-01 +
SPECviewperf 12 - specvp12 creo-01
2.4 fps (1%)
Windows 7 Experience Index - Win7 Gaming graphics
min: 6.5     avg: 6.6     median: 6.5 (82%)     max: 6.7 Points
Windows 7 Experience Index - Win7 Graphics
min: 5     avg: 5.5     median: 5.2 (66%)     max: 6.7 Points
Cinebench R10 Cinebench R10 Shading (32bit) +
Cinebench R10 - Cinebench R10 Shading (32bit)
min: 5784     avg: 7238     median: 7168.5 (5%)     max: 9402 points
Cinebench R11.5 Cinebench R11.5 OpenGL 64 Bit +
Cinebench R11.5 - Cinebench R11.5 OpenGL 64 Bit
min: 12.85     avg: 20.3     median: 20.7 (7%)     max: 33.19 fps
Cinebench R15
Cinebench R15 OpenGL 64 Bit +
Cinebench R15 - Cinebench R15 OpenGL 64 Bit
min: 17.03     avg: 20.9     median: 18.8 (1%)     max: 33.96 fps
Cinebench R15 OpenGL Ref. Match 64 Bit +
Cinebench R15 - Cinebench R15 OpenGL Ref. Match 64 Bit
min: 63.3     avg: 92.9     median: 98 (98%)     max: 99.6 %
GFXBench (DX / GLBenchmark) 2.7
GFXBench T-Rex HD Offscreen C24Z16 +
GFXBench (DX / GLBenchmark) 2.7 - GFXBench T-Rex HD Offscreen C24Z16
78 fps (1%)
LuxMark v2.0 64Bit - LuxMark v2.0 Room GPU
min: 166     avg: 197     median: 185 (1%)     max: 252 Samples/s
LuxMark v2.0 64Bit - LuxMark v2.0 Sala GPU
min: 262     avg: 305.5     median: 284.5 (0%)     max: 391 Samples/s
ComputeMark v2.1 - ComputeMark v2.1 Result
min: 665     avg: 741     median: 767 (1%)     max: 816 points
Power Consumption - Furmark Stress Test Power Consumption - external Monitor *
97 Watt (14%)
Power Consumption - The Witcher 3 Power Consumption - external Monitor *
90 Watt (13%)
- Range of benchmark values for this graphics card
- Average benchmark values for this graphics card
* Smaller numbers mean a higher performance

Game Benchmarks

The following benchmarks stem from our benchmarks of review laptops. The performance depends on the used graphics memory, clock rate, processor, system settings, drivers, and operating systems. So the results don't have to be representative for all laptops with this GPU. For detailed information on the benchmark results, click on the fps number.

New World

New World

2021
low 1280x720
6.6  fps    + Compare + 📈 Graph
» The benchmarks indicate that the game is not playable in the tested settings.
low 1280x720
27.7  fps    + Compare + 📈 Graph
med. 1920x1080
13.8  fps    + Compare + 📈 Graph
» The benchmarks indicate that the game is not playable in the tested settings.
Additional Benchmarks
Low Preset 1920x1080
15.7
Days Gone

Days Gone

2021
low 1280x720
7.1 (!)  fps    + Compare + 📈 Graph
» The benchmarks indicate that the game is not playable in the tested settings.
low 1280x720
14.3  fps    + Compare + 📈 Graph
ultra 1920x1080
8.7  fps    + Compare + 📈 Graph
» The benchmarks indicate that the game is not playable in the tested settings.
low 1280x720
11  fps    + Compare + 📈 Graph
» The benchmarks indicate that the game is not playable in the tested settings.
low 1280x720
8.3  fps    + Compare + 📈 Graph
» The benchmarks indicate that the game is not playable in the tested settings.
low 1280x720
8.7  fps    + Compare
» The benchmarks indicate that the game is not playable in the tested settings.
low 1280x720
9.7  fps    + Compare
» The benchmarks indicate that the game is not playable in the tested settings.
med. 1920x1080
5.6  fps    + Compare
» The benchmarks indicate that the game is not playable in the tested settings.
low 1280x720
11.6  fps    + Compare
» The benchmarks indicate that the game is not playable in the tested settings.
FIFA 20

FIFA 20

2019
low 1280x720
32.1  fps    + Compare
» The benchmarks indicate that the game is not playable in the tested settings.
low 1280x720
9.3  fps    + Compare
» The benchmarks indicate that the game is not playable in the tested settings.
Control

Control

2019
low 1280x720
10.4  fps    + Compare
» The benchmarks indicate that the game is not playable in the tested settings.
F1 2019

F1 2019

2019
low 1280x720
15  fps    + Compare
» The benchmarks indicate that the game is not playable in the tested settings.
low 1280x720
15.9  fps    + Compare
» The benchmarks indicate that the game is not playable in the tested settings.
Anno 1800

Anno 1800

2019
low 1280x720
14.7  fps    + Compare
» The benchmarks indicate that the game is not playable in the tested settings.
low 1280x720
12  fps    + Compare
» The benchmarks indicate that the game is not playable in the tested settings.
low 1280x720
23.5  fps    + Compare
» The benchmarks indicate that the game is not playable in the tested settings.
Anthem

Anthem

2019
low 1280x720
6  fps    + Compare
» The benchmarks indicate that the game is not playable in the tested settings.
low 1280x720
9  fps    + Compare
» The benchmarks indicate that the game is not playable in the tested settings.
low 1280x720
5  fps    + Compare
» The benchmarks indicate that the game is not playable in the tested settings.
low 1280x720
16.8  fps    + Compare
» The benchmarks indicate that the game is not playable in the tested settings.
low 1280x720
10.5  fps    + Compare
» The benchmarks indicate that the game is not playable in the tested settings.
low 1280x720
18.7  fps    + Compare
med. 1920x1080
7.9  fps    + Compare
» The benchmarks indicate that the game is not playable in the tested settings.
low 1280x720
12  fps    + Compare
» The benchmarks indicate that the game is not playable in the tested settings.
low 1280x720
32.1  fps    + Compare
» The benchmarks indicate that the game is not playable in the tested settings.
low 1280x720
10.1  fps    + Compare
» The benchmarks indicate that the game is not playable in the tested settings.
Hitman 2

Hitman 2

2018
low 1280x720
8.2  fps    + Compare
» The benchmarks indicate that the game is not playable in the tested settings.
low 1280x720
13.7  fps    + Compare
» The benchmarks indicate that the game is not playable in the tested settings.
low 1280x720
6  fps    + Compare
» The benchmarks indicate that the game is not playable in the tested settings.
low 1280x720
7  fps    + Compare
» The benchmarks indicate that the game is not playable in the tested settings.
FIFA 19

FIFA 19

2018
low 1280x720
45.7 (!)  fps    + Compare
» With all tested laptops playable in detail settings low.
low 1280x720
11  fps    + Compare
» The benchmarks indicate that the game is not playable in the tested settings.
F1 2018

F1 2018

2018
low 1280x720
15  fps    + Compare
» The benchmarks indicate that the game is not playable in the tested settings.
low 1280x720
9.1  fps    + Compare
» The benchmarks indicate that the game is not playable in the tested settings.
low 1280x720
15.2  fps    + Compare
» The benchmarks indicate that the game is not playable in the tested settings.
Far Cry 5

Far Cry 5

2018
low 1280x720
9  fps    + Compare
» The benchmarks indicate that the game is not playable in the tested settings.
World of Tanks enCore

World of Tanks enCore

2018
low 1366x768
146.4  fps    + Compare
med. 1920x1080
14.6  fps    + Compare
» With all tested laptops playable in detail settings low.
low 1280x720
20.8  fps    + Compare
med. 1920x1080
13.6  fps    + Compare
» The benchmarks indicate that the game is not playable in the tested settings.
low 1280x720
11.7  fps    + Compare
» The benchmarks indicate that the game is not playable in the tested settings.
low 1280x720
9.6  fps    + Compare
» The benchmarks indicate that the game is not playable in the tested settings.
Fortnite

Fortnite

2018
low 1280x720
39.6  fps    + Compare
med. 1920x1080
12.4  fps    + Compare
» With all tested laptops playable in detail settings low.
low 1280x720
16.3  fps    + Compare
» The benchmarks indicate that the game is not playable in the tested settings.
low 1280x720
21.5  fps    + Compare
» The benchmarks indicate that the game is not playable in the tested settings.
low 1280x720
7  fps    + Compare
» The benchmarks indicate that the game is not playable in the tested settings.
Destiny 2

Destiny 2

2017
low 1280x720
13.7  fps    + Compare
» The benchmarks indicate that the game is not playable in the tested settings.
ELEX

ELEX

2017
low 1280x720
10.4  fps    + Compare
» The benchmarks indicate that the game is not playable in the tested settings.
low 1280x720
9.2  fps    + Compare
» The benchmarks indicate that the game is not playable in the tested settings.
low 1280x720
10  fps    + Compare
med. 1920x1080
7  fps    + Compare
» The benchmarks indicate that the game is not playable in the tested settings.
FIFA 18

FIFA 18

2017
low 1280x720
59.2  fps    + Compare
med. 1920x1080
30.4  fps    + Compare
» With all tested laptops playable in detail settings low.
low 1280x720
9.6  fps    + Compare
» The benchmarks indicate that the game is not playable in the tested settings.
F1 2017

F1 2017

2017
low 1280x720
19  fps    + Compare
med. 1920x1080
13  fps    + Compare
» The benchmarks indicate that the game is not playable in the tested settings.
low 1280x720
17.5  fps    + Compare
» The benchmarks indicate that the game is not playable in the tested settings.
low 1280x720
70  fps    + Compare
med. 1366x768
65.3  fps    + Compare
high 1920x1080
30  fps    + Compare
» With all tested laptops playable in detail settings med..
Dirt 4

Dirt 4

2017
low 1280x720
25.8 30.9 ~ 28 fps    + Compare
» The benchmarks indicate that the game is not playable in the tested settings.
Additional Benchmarks
Medium Preset 4xAF 1366x768
14.2
low 1280x720
43.6 70.8 ~ 57 fps    + Compare
med. 1920x1080
15.3 24.7 ~ 20 fps    + Compare
high 1920x1080
15.9  fps    + Compare
» With all tested laptops playable in detail settings low.
Additional Benchmarks
Performance 1920x1080
36.9
Prey

Prey

2017
low 1280x720
16.7 23.9 ~ 20 fps    + Compare
med. 1920x1080
6.5 9.3 ~ 8 fps    + Compare
» The benchmarks indicate that the game is not playable in the tested settings.
Additional Benchmarks
Medium Preset 4xAF FXAA 1366x768
17.4
low 1280x720
14.3 15.2 ~ 15 fps    + Compare
» The benchmarks indicate that the game is not playable in the tested settings.
Additional Benchmarks
Medium / On (100 % Gameplay Resolution) MediumAA 1366x768
10.8
low 1280x720
0 (!) 11.6 ~ 6 fps    + Compare
Additional Benchmarks
Medium Preset (Resolution Scale Mode off) FXAA 1366x768
0 (!)
low 1280x720
9.4 11.3 ~ 10 fps    + Compare
» The benchmarks indicate that the game is not playable in the tested settings.
Additional Benchmarks
Medium Preset FXAA 1366x768
6.8
For Honor

For Honor

2017
low 1280x720
11.1  fps    + Compare
» The benchmarks indicate that the game is not playable in the tested settings.
low 1280x720
29.5 32.6 ~ 31 fps    + Compare
med. 1920x1080
13.5 14 ~ 14 fps    + Compare
» The benchmarks indicate that the game is not playable in the tested settings.
Additional Benchmarks
Medium / Off FXAA 1366x768
24.3
low 1280x720
0 (!) 9.9 ~ 5 fps    + Compare
med. 1366x768
0 (!) 8.3 ~ 4 fps    + Compare
low 1280x720
0 (!)  fps    + Compare
med. 1366x768
0 (!)  fps    + Compare
low 1280x720
0 (!) 16.4 ~ 8 fps    + Compare
med. 1366x768
0 (!) 13.9 ~ 7 fps    + Compare
» The benchmarks indicate that the game is not playable in the tested settings.
low 1280x720
25.9 30 ~ 28 fps    + Compare
med. 1366x768
15.8 18.7 ~ 17 fps    + Compare
high 1920x1080
6.6  fps    + Compare
» The benchmarks indicate that the game is not playable in the tested settings.
Additional Benchmarks
Medium / Disabled 4xAF 1920x1080
11
low 1280x720
69.3 71.1 ~ 70 fps    + Compare
med. 1366x768
37.9 47 ~ 42 fps    + Compare
high 1920x1080
11 18.9 ~ 15 fps    + Compare
ultra 1920x1080
8 11.1 ~ 10 fps    + Compare
» With all tested laptops playable in detail settings med..
Additional Benchmarks
Medium Preset 1920x1080
25.1
low 1280x720
18 24.2 ~ 21 fps    + Compare
med. 1366x768
11.8 15 ~ 13 fps    + Compare
high 1920x1080
5.2  fps    + Compare
» The benchmarks indicate that the game is not playable in the tested settings.
Additional Benchmarks
Medium Preset FXAA 1920x1080
8.9
low 1024x768
24.2 30.9 ~ 28 fps    + Compare
med. 1366x768
7.1 10 ~ 9 fps    + Compare
» The benchmarks indicate that the game is not playable in the tested settings.
Mafia 3

Mafia 3

2016
low 1280x720
5.8 7.8 ~ 7 fps    + Compare
» The benchmarks indicate that the game is not playable in the tested settings.
FIFA 17

FIFA 17

2016
low 1280x720
55 59.1 ~ 57 fps    + Compare
med. 1366x768
42.2 43 ~ 43 fps    + Compare
high 1920x1080
22  fps    + Compare
» With all tested laptops playable in detail settings med..
low 1280x720
9.4 11.1 ~ 10 fps    + Compare
med. 1366x768
7.6  fps    + Compare
» The benchmarks indicate that the game is not playable in the tested settings.
low 1280x720
0 (!) 12 ~ 6 fps    + Compare
med. 1366x768
0 (!)  fps    + Compare
high 1920x1080
0 (!)  fps    + Compare
ultra 1920x1080
0 (!)  fps    + Compare
4K 3840x2160
0 (!)  fps    + Compare
» The benchmarks indicate that the game is not playable in the tested settings.
Additional Benchmarks
Medium 4x AF Off AA 1920x1080
0 (!)
low 1280x720
15.7 21.3 ~ 19 fps    + Compare
med. 1366x768
9.9 12.2 ~ 11 fps    + Compare
» The benchmarks indicate that the game is not playable in the tested settings.
Overwatch

Overwatch

2016
low 1280x720
34.7 42.3 ~ 39 fps    + Compare
med. 1366x768
23.4 24.8 ~ 24 fps    + Compare
» With most tested laptops playable in detail settings low.
Additional Benchmarks
Medium (Render Scale 100 %) 2xAF FXAA 1920x1080
14.6
low 1280x768
10.3  fps    + Compare
» The benchmarks indicate that the game is not playable in the tested settings.
low 1280x720
14.3 16.5 (!) ~ 15 fps    + Compare
med. 1366x768
10.1  fps    + Compare
» The benchmarks indicate that the game is not playable in the tested settings.
low 1280x720
8.7 9.7 ~ 9 fps    + Compare
med. 1366x768
6.1 10.4 ~ 8 fps    + Compare
» The benchmarks indicate that the game is not playable in the tested settings.
low 1280x720
10.8 14 ~ 12 fps    + Compare
med. 1366x768
9.3  fps    + Compare
» The benchmarks indicate that the game is not playable in the tested settings.
low 1280x720
11 15 ~ 13 fps    + Compare
med. 1920x1080
5 7 ~ 6 fps    + Compare
» The benchmarks indicate that the game is not playable in the tested settings.
Additional Benchmarks
Low Preset 1920x1080
8
XCOM 2

XCOM 2

2016
low 1280x720
11.3 16.8 ~ 14 fps    + Compare
med. 1920x1080
5.1  fps    + Compare
» The benchmarks indicate that the game is not playable in the tested settings.
Additional Benchmarks
Low Preset TrilinearAF 1920x1080
7.1
low 1024x768
15 15.5 ~ 15 fps    + Compare
med. 1366x768
8.9 9.7 ~ 9 fps    + Compare
» The benchmarks indicate that the game is not playable in the tested settings.
low 1024x768
18.9 25.7 ~ 22 fps    + Compare
med. 1366x768
12 14.6 ~ 13 fps    + Compare
high 1920x1080
7.8  fps    + Compare
» The benchmarks indicate that the game is not playable in the tested settings.
low 1024x768
16.2 19.3 ~ 18 fps    + Compare
med. 1366x768
12.3 15.1 ~ 14 fps    + Compare
high 1920x1080
6.8  fps    + Compare
» The benchmarks indicate that the game is not playable in the tested settings.
low 1024x768
21.5 30.8 ~ 26 fps    + Compare
med. 1366x768
12.6 16.8 ~ 15 fps    + Compare
high 1920x1080
6.1 7.9 ~ 7 fps    + Compare
» The benchmarks indicate that the game is not playable in the tested settings.
low 1024x768
6.5 7.1 (!) ~ 7 fps    + Compare
med. 1366x768
4.6 (!)  fps    + Compare
» The benchmarks indicate that the game is not playable in the tested settings.
Fallout 4

Fallout 4

2015
low 1280x720
15.8 19.8 ~ 18 fps    + Compare
med. 1366x768
9.4 12.4 ~ 11 fps    + Compare
high 1920x1080
5.4 6.8 ~ 6 fps    + Compare
» The benchmarks indicate that the game is not playable in the tested settings.
low 1024x768
20.7 26.1 ~ 23 fps    + Compare
med. 1366x768
11.7 15 ~ 13 fps    + Compare
» The benchmarks indicate that the game is not playable in the tested settings.
Anno 2205

Anno 2205

2015
low 1024x768
12.8 14.4 ~ 14 fps    + Compare
med. 1366x768
5.2 6.5 ~ 6 fps    + Compare
high 1920x1080
3 3.7 ~ 3 fps    + Compare
» The benchmarks indicate that the game is not playable in the tested settings.
FIFA 16

FIFA 16

2015
low 1280x720
41.1 77.1 ~ 59 fps    + Compare
high 1366x768
24.6 37.4 ~ 31 fps    + Compare
ultra 1920x1080
14.8 20.3 ~ 18 fps    + Compare
» With all tested laptops playable in detail settings low.
low 1366x768
41.6  fps    + Compare
med. 1366x768
29.5  fps    + Compare
high 1920x1080
14.4  fps    + Compare
ultra 1920x1080
11  fps    + Compare
» With all tested laptops playable in detail settings low.
low 1024x768
29.9 45.1 ~ 38 fps    + Compare
med. 1366x768
19.2 28.2 ~ 24 fps    + Compare
high 1920x1080
6.4 9.9 ~ 8 fps    + Compare
» With most tested laptops playable in detail settings low.
Mad Max

Mad Max

2015
med. 1366x768
13.2 19.2 ~ 16 fps    + Compare
high 1920x1080
5.7 8.3 ~ 7 fps    + Compare
ultra 1920x1080
3.9 7.2 ~ 6 fps    + Compare
» The benchmarks indicate that the game is not playable in the tested settings.
low 1280x720
99.4  fps    + Compare
med. 1366x768
62.1  fps    + Compare
high 1920x1080
21.8  fps    + Compare
» With all tested laptops playable in detail settings med..
low 1280x720
11 12 ~ 12 fps    + Compare
med. 1366x768
9 10 ~ 10 fps    + Compare
high 1920x1080
4  fps    + Compare
» The benchmarks indicate that the game is not playable in the tested settings.
low 1024x768
10.7 13.1 ~ 12 fps    + Compare
med. 1366x768
6.6 8.4 ~ 8 fps    + Compare
high 1920x1080
3.8  fps    + Compare
» The benchmarks indicate that the game is not playable in the tested settings.
low 1024x768
77.7 125.8 ~ 102 fps    + Compare
med. 1366x768
20.3 25.3 ~ 23 fps    + Compare
high 1920x1080
12.5 12.7 ~ 13 fps    + Compare
ultra 1920x1080
12.5 12.5 ~ 13 fps    + Compare
» With all tested laptops playable in detail settings low.
GTA V

GTA V

2015
low 1024x768
19.4 33.3 ~ 26 fps    + Compare
med. 1366x768
16.5 29.4 ~ 23 fps    + Compare
high 1920x1080
4.3 5.7 ~ 5 fps    + Compare
ultra 1920x1080
2.1  fps    + Compare
» The benchmarks indicate that the game is not playable in the tested settings.
low 1024x768
29.8 32.1 ~ 31 fps    + Compare
med. 1366x768
21.3 22.1 ~ 22 fps    + Compare
high 1920x1080
9.2 9.9 ~ 10 fps    + Compare
ultra 1920x1080
5.3  fps    + Compare
» The benchmarks indicate that the game is not playable in the tested settings.
Evolve

Evolve

2015
low 1024x768
11.9 14.7 ~ 13 fps    + Compare
med. 1366x768
8.6 11 ~ 10 fps    + Compare
» The benchmarks indicate that the game is not playable in the tested settings.
The Crew

The Crew

2014
low 1280x720
16.8 29 ~ 23 fps    + Compare
med. 1366x768
12.8 20.1 ~ 16 fps    + Compare
high 1920x1080
10.2  fps    + Compare
ultra 1920x1080
5.3  fps    + Compare
» The benchmarks indicate that the game is not playable in the tested settings.
low 1024x768
22.1  fps    + Compare
med. 1366x768
14.5  fps    + Compare
high 1920x1080
5.8  fps    + Compare
ultra 1920x1080
3.8  fps    + Compare
» The benchmarks indicate that the game is not playable in the tested settings.
Far Cry 4

Far Cry 4

2014
low 1024x768
17.9 19.9 ~ 19 fps    + Compare
med. 1366x768
12 14.3 ~ 13 fps    + Compare
high 1920x1080
5.6 7 ~ 6 fps    + Compare
ultra 1920x1080
5.3  fps    + Compare
» The benchmarks indicate that the game is not playable in the tested settings.
low 1024x768
7 8.5 ~ 8 fps    + Compare
med. 1366x768
4.6 5.4 ~ 5 fps    + Compare
» The benchmarks indicate that the game is not playable in the tested settings.
low 1024x768
29.1 33.4 ~ 31 fps    + Compare
med. 1366x768
14.4 17.4 ~ 16 fps    + Compare
high 1920x1080
7.9 10.1 ~ 9 fps    + Compare
ultra 1920x1080
4.4  fps    + Compare
» The benchmarks indicate that the game is not playable in the tested settings.
low 1024x768
34.3 37 ~ 36 fps    + Compare
med. 1366x768
13 13.7 ~ 13 fps    + Compare
high 1920x1080
8.4 8.9 ~ 9 fps    + Compare
ultra 1920x1080
7.4  fps    + Compare
» With most tested laptops playable in detail settings low.
F1 2014

F1 2014

2014
low 1024x768
42 81 ~ 62 fps    + Compare
med. 1366x768
30 54 ~ 42 fps    + Compare
high 1920x1080
19 28 ~ 24 fps    + Compare
ultra 1920x1080
12 13 ~ 13 fps    + Compare
» With most tested laptops playable in detail settings med..
low 1024x768
13.2 16.9 ~ 15 fps    + Compare
med. 1366x768
8.9 11.8 ~ 10 fps    + Compare
high 1920x1080
6.7  fps    + Compare
» The benchmarks indicate that the game is not playable in the tested settings.
low 1024x768
12.5 13.4 ~ 13 fps    + Compare
med. 1366x768
8.2 9.2 ~ 9 fps    + Compare
high 1920x1080
4.4  fps    + Compare
ultra 1920x1080
4.2  fps    + Compare
» The benchmarks indicate that the game is not playable in the tested settings.
low 1024x768
29.7 42 ~ 36 fps    + Compare
med. 1366x768
19.5 26 ~ 23 fps    + Compare
high 1920x1080
9.9 13.4 ~ 12 fps    + Compare
ultra 1920x1080
6.8 8.8 ~ 8 fps    + Compare
» With most tested laptops playable in detail settings low.
low 1280x720
18 26.8 ~ 22 fps    + Compare
med. 1344x756
12 17.4 ~ 15 fps    + Compare
» The benchmarks indicate that the game is not playable in the tested settings.
Fifa 15

Fifa 15

2014
low 1280x720
39 52.3 ~ 46 fps    + Compare
high 1366x768
25.6 36 ~ 31 fps    + Compare
ultra 1920x1080
16.1 20.9 ~ 19 fps    + Compare
» With all tested laptops playable in detail settings low.
Sims 4

Sims 4

2014
low 1024x768
130.4 139.8 146.3 ~ 139 fps    + Compare
med. 1366x768
28.4 32.5 40.3 ~ 34 fps    + Compare
high 1920x1080
13.6 18.8 ~ 16 fps    + Compare
ultra 1920x1080
9.5 12.4 ~ 11 fps    + Compare
» With all tested laptops playable in detail settings low.
low 1024x768
20.5 41.8 ~ 31 fps    + Compare
med. 1366x768
14 23.8 ~ 19 fps    + Compare
high 1920x1080
5.7 8.3 ~ 7 fps    + Compare
ultra 1920x1080
6.4  fps    + Compare
» The benchmarks indicate that the game is not playable in the tested settings.
low 1024x768
79.7 80.9 98.4 119.5 ~ 95 fps    + Compare
med. 1366x768
12.6 28 36.6 45.8 ~ 31 fps    + Compare
high 1920x1080
13.3 17.2 19.7 ~ 17 fps    + Compare
ultra 1920x1080
12.5 12.5 12.5 ~ 13 fps    + Compare
» With all tested laptops playable in detail settings low.
low 1024x768
24.4  fps    + Compare
med. 1366x768
14.1  fps    + Compare
high 1920x1080
3.6  fps    + Compare
» The benchmarks indicate that the game is not playable in the tested settings.
low 1280x720
36.4 42.3 ~ 39 fps    + Compare
med. 1280x720
33.6 37.2 ~ 35 fps    + Compare
high 1920x1080
14.1 14.2 ~ 14 fps    + Compare
» With all tested laptops playable in detail settings low.
low 1024x768
56.9 60.8 ~ 59 fps    + Compare
med. 1366x768
21.8 31.3 ~ 27 fps    + Compare
high 1366x768
13.6 19.3 ~ 16 fps    + Compare
ultra 1920x1080
9.3  fps    + Compare
» With all tested laptops playable in detail settings low.
Titanfall

Titanfall

2014
low 1024x768
39.6 46.4 ~ 43 fps    + Compare
med. 1366x768
20.8 23.3 ~ 22 fps    + Compare
high 1366x768
13.3 14.4 ~ 14 fps    + Compare
ultra 1920x1080
9.1  fps    + Compare
» With all tested laptops playable in detail settings low.
Thief

Thief

2014
low 1024x768
13.6 13.7 14.3 14.9 16.2 16.5 19.1 21.3 ~ 16 fps    + Compare
med. 1366x768
8 8 8.2 9.1 9.3 9.3 11 12.2 ~ 9 fps    + Compare
high 1366x768
5.1 7.3 7.5 7.5 9.1 9.9 ~ 8 fps    + Compare
ultra 1920x1080
4.8  fps    + Compare
» The benchmarks indicate that the game is not playable in the tested settings.
low 1024x768
24.8  fps    + Compare
med. 1366x768
18.4  fps    + Compare
high 1366x768
8.9  fps    + Compare
ultra 1920x1080
4.7  fps    + Compare
» The benchmarks indicate that the game is not playable in the tested settings.
low 1024x768
35.5 51.2 ~ 43 fps    + Compare
med. 1366x768
21 28.8 ~ 25 fps    + Compare
high 1366x768
8.1 12.1 ~ 10 fps    + Compare
ultra 1920x1080
9.4  fps    + Compare
» With all tested laptops playable in detail settings low.
low 1024x768
14.3 20.1 ~ 17 fps    + Compare
med. 1366x768
11.4 15.4 ~ 13 fps    + Compare
high 1366x768
8.8 12.7 ~ 11 fps    + Compare
» The benchmarks indicate that the game is not playable in the tested settings.
low 1024x768
40.8  fps    + Compare
med. 1366x768
27.4  fps    + Compare
high 1366x768
10.1  fps    + Compare
ultra 1920x1080
5.2  fps    + Compare
» With all tested laptops playable in detail settings low.
low 1024x768
36.6  fps    + Compare
med. 1366x768
24.8  fps    + Compare
high 1366x768
15.3  fps    + Compare
ultra 1920x1080
5.5  fps    + Compare
» With all tested laptops playable in detail settings low.
low 1024x768
56  fps    + Compare
med. 1366x768
32  fps    + Compare
high 1366x768
15  fps    + Compare
ultra 1920x1080
7  fps    + Compare
» With all tested laptops playable in detail settings low.
F1 2013

F1 2013

2013
low 1024x768
40 50 90 ~ 60 fps    + Compare
med. 1366x768
26 31 52 ~ 36 fps    + Compare
high 1366x768
22 25 36 ~ 28 fps    + Compare
ultra 1920x1080
12 14 ~ 13 fps    + Compare
» With most tested laptops playable in detail settings med..
Fifa 14

Fifa 14

2013
low 1024x768
112 226 ~ 169 fps    + Compare
med. 1366x768
64.5 85.8 116.4 ~ 89 fps    + Compare
high 1366x768
41.9 49.4 86 ~ 59 fps    + Compare
ultra 1920x1080
48  fps    + Compare
» With all tested laptops playable in detail settings ultra.
low 1024x768
32 35.4 35.9 52.1 ~ 39 fps    + Compare
med. 1366x768
23 24 26.7 39 ~ 28 fps    + Compare
high 1366x768
18 18.8 27.7 ~ 22 fps    + Compare
ultra 1920x1080
6 8.1 ~ 7 fps    + Compare
» With most tested laptops playable in detail settings low.
low 1280x720
21.1 30.9 ~ 26 fps    + Compare
med. 1366x768
15.7 22.4 ~ 19 fps    + Compare
high 1366x768
10.9  fps    + Compare
ultra 1920x1080
6.3  fps    + Compare
» The benchmarks indicate that the game is not playable in the tested settings.
low 1024x768
39.8  fps    + Compare
med. 1366x768
17.1  fps    + Compare
high 1366x768
9.7  fps    + Compare
ultra 1920x1080
6.6  fps    + Compare
» With all tested laptops playable in detail settings low.
low 1024x768
52.1  fps    + Compare
» With all tested laptops playable in detail settings low.
Dota 2

Dota 2

2013
low 1024x768
41.5 72.3 74.5 98.3 ~ 72 fps    + Compare
med. 1366x768
26.5 30.3 47 59.7 ~ 41 fps    + Compare
ultra 1920x1080
14.4 23.9 24.4 ~ 21 fps    + Compare
» With most tested laptops playable in detail settings med..
low 1024x768
14.7 15 ~ 15 fps    + Compare
med. 1366x768
11 11.4 ~ 11 fps    + Compare
high 1366x768
6 6.6 ~ 6 fps    + Compare
ultra 1920x1080
2.9  fps    + Compare
» The benchmarks indicate that the game is not playable in the tested settings.
GRID 2

GRID 2

2013
low 1024x768
50 54.2 56.4 63.7 84.5 ~ 62 fps    + Compare
med. 1366x768
27 29.3 29.8 34.6 43.9 ~ 33 fps    + Compare
high 1366x768
18.7 19.7 22.7 23 25.3 ~ 22 fps    + Compare
ultra 1920x1080
12.5  fps    + Compare
» With all tested laptops playable in detail settings low.
low 1024x768
16 34 34 ~ 28 fps    + Compare
med. 1366x768
12 23.3 23.7 ~ 20 fps    + Compare
high 1366x768
8 13.2 13.2 ~ 11 fps    + Compare
ultra 1920x1080
4 6.5 6.6 ~ 6 fps    + Compare
» The benchmarks indicate that the game is not playable in the tested settings.
low 1280x720
23 24.1 27.2 28.2 29.3 30 34.7 35.2 40.7 43 44 46 52.4 57 ~ 37 fps    + Compare
med. 1366x768
12 12.6 14.2 14.6 15 15.9 16.6 16.9 19.6 20.7 22.2 22.3 24.4 25.7 ~ 18 fps    + Compare
high 1366x768
10.5 11.7 11.9 12 12.3 13.4 13.8 16.1 17.5 17.7 18.7 20.5 21.8 ~ 15 fps    + Compare
ultra 1920x1080
5.3 6.6 7 12.2 ~ 8 fps    + Compare
» With most tested laptops playable in detail settings low.
low 1024x768
253  fps    + Compare
med. 1366x768
52  fps    + Compare
high 1366x768
33  fps    + Compare
ultra 1920x1080
11  fps    + Compare
» With all tested laptops playable in detail settings med..
SimCity

SimCity

2013
low 1024x768
50.2 97.6 ~ 74 fps    + Compare
med. 1366x768
15.2 21.7 ~ 18 fps    + Compare
high 1366x768
15  fps    + Compare
ultra 1920x1080
7  fps    + Compare
» With all tested laptops playable in detail settings low.
low 1024x768
32.9 36.3 39.6 40.6 40.9 41.6 42.3 46.2 48.3 52.3 52.6 53 57.6 64.8 65.8 66.5 72.9 74.4 ~ 52 fps    + Compare
med. 1366x768
16.8 19.5 19.9 20.1 20.2 20.3 20.3 21.9 22.9 23.8 23.9 24.1 26.8 30.4 30.4 32.1 32.5 34.5 ~ 24 fps    + Compare
high 1366x768
8.9 10.3 10.8 11.2 11.2 11.5 12.2 12.3 12.8 13 13 13 14.6 15.2 17.2 17.6 18.2 19.7 ~ 13 fps    + Compare
ultra 1920x1080
0 (!) 4.3 8.5 ~ 4 fps    + Compare
» With most tested laptops playable in detail settings low.
Crysis 3

Crysis 3

2013
low 1024x768
16.8 30.4 ~ 24 fps    + Compare
med. 1366x768
19.3  fps    + Compare
high 1366x768
13.5  fps    + Compare
ultra 1920x1080
4.7  fps    + Compare
» The benchmarks indicate that the game is not playable in the tested settings.
low 1024x768
101.2  fps    + Compare
med. 1366x768
41.9  fps    + Compare
high 1366x768
31.4  fps    + Compare
ultra 1920x1080
17.4  fps    + Compare
» With all tested laptops playable in detail settings med..
Far Cry 3

Far Cry 3

2012
low 1024x768
38.1  fps    + Compare
med. 1366x768
23.4  fps    + Compare
» With all tested laptops playable in detail settings low.
med. 1366x768
14.9  fps    + Compare
» The benchmarks indicate that the game is not playable in the tested settings.
low 1024x768
19.4 21.2 ~ 20 fps    + Compare
med. 1366x768
13 14.5 ~ 14 fps    + Compare
high 1366x768
5.4 9.2 ~ 7 fps    + Compare
» The benchmarks indicate that the game is not playable in the tested settings.
low 1024x768
62  fps    + Compare
med. 1366x768
40.9  fps    + Compare
high 1366x768
17.5  fps    + Compare
ultra 1920x1080
10.6  fps    + Compare
» With all tested laptops playable in detail settings med..
low 1024x768
34.7  fps    + Compare
med. 1366x768
24.1  fps    + Compare
» The benchmarks indicate that the game is not playable in the tested settings.
low 1024x768
24.6  fps    + Compare
med. 1366x768
16.3  fps    + Compare
» The benchmarks indicate that the game is not playable in the tested settings.
low 1024x768
25.9 57.9 ~ 42 fps    + Compare
med. 1366x768
20.7 43.8 ~ 32 fps    + Compare
high 1366x768
18.1 38.5 ~ 28 fps    + Compare
ultra 1920x1080
19.7  fps    + Compare
» With most tested laptops playable in detail settings low.
low 1024x768
186.9  fps    + Compare
med. 1366x768
99.2  fps    + Compare
high 1366x768
49 55.5 ~ 52 fps    + Compare
ultra 1920x1080
26 28.3 ~ 27 fps    + Compare
» With all tested laptops playable in detail settings high.
low 1024x768
30.1 45.5 ~ 38 fps    + Compare
med. 1366x768
21.2 32.8 ~ 27 fps    + Compare
high 1366x768
9.7 12.6 ~ 11 fps    + Compare
ultra 1920x1080
6.5  fps    + Compare
» With most tested laptops playable in detail settings low.
low 1024x768
19.4  fps    + Compare
» The benchmarks indicate that the game is not playable in the tested settings.
med. 1366x768
49.9  fps    + Compare
high 1366x768
26.6  fps    + Compare
» With all tested laptops playable in detail settings med..
low 1024x768
45.1 72 72.9 78 82.2 ~ 70 fps    + Compare
med. 1366x768
28.6 45.1 46 50.3 51 ~ 44 fps    + Compare
high 1366x768
23.2 38 38.8 42 42.6 ~ 37 fps    + Compare
ultra 1920x1080
13.9 24 24 26 26.5 ~ 23 fps    + Compare
» With most tested laptops playable in detail settings high.
low 1024x768
0 (!) 29.7 ~ 15 fps    + Compare
med. 1366x768
18.1  fps    + Compare
» The benchmarks indicate that the game is not playable in the tested settings.
low 1280x720
32.1  fps    + Compare
high 1366x768
22.4  fps    + Compare
» The benchmarks indicate that the game is not playable in the tested settings.
Alan Wake

Alan Wake

2012
low 1024x768
18.5  fps    + Compare
» The benchmarks indicate that the game is not playable in the tested settings.
Anno 2070

Anno 2070

2011
low 1024x768
47.6 55 59 66.1 77.1 92.3 ~ 66 fps    + Compare
med. 1366x768
20.6 25.5 27.4 28.3 35.1 42.1 ~ 30 fps    + Compare
high 1366x768
15.4 16.3 16.7 17.6 21.7 25.4 ~ 19 fps    + Compare
ultra 1920x1080
11.4  fps    + Compare
» With all tested laptops playable in detail settings low.
low 1280x720
29.3 31.9 33 48 51.1 ~ 39 fps    + Compare
med. 1366x768
14 15 15.5 23 24.2 ~ 18 fps    + Compare
high 1366x768
8 8.4 13 13.8 ~ 11 fps    + Compare
ultra 1920x1080
4 7.3 ~ 6 fps    + Compare
» With most tested laptops playable in detail settings low.
low 1024x768
141.9  fps    + Compare
med. 1366x768
63.1  fps    + Compare
high 1366x768
27.5  fps    + Compare
» With all tested laptops playable in detail settings med..
low 1024x768
20.4 32.4 35 ~ 29 fps    + Compare
med. 1366x768
14 22.7 23.7 ~ 20 fps    + Compare
high 1366x768
18 18.6 ~ 18 fps    + Compare
ultra 1920x1080
6.7 7 ~ 7 fps    + Compare
» The benchmarks indicate that the game is not playable in the tested settings.
low 1024x768
66  fps    + Compare
med. 1366x768
47  fps    + Compare
» With all tested laptops playable in detail settings med..
low 1024x768
84.7  fps    + Compare
high 1366x768
36.9  fps    + Compare
» With all tested laptops playable in detail settings high.
Dirt 3

Dirt 3

2011
med. 1024x768
61.3  fps    + Compare
high 1360x768
27.9  fps    + Compare
» With all tested laptops playable in detail settings med..
Total War: Shogun 2

Total War: Shogun 2

2011
low 1024x768
0 (!) 66.1 137.9 ~ 68 fps    + Compare
med. 1280x720
0 (!)  fps    + Compare
ultra 1920x1080
0 (!)  fps    + Compare
Additional Benchmarks
CPU 1280x1024
13.3
Civilization 5

Civilization 5

2010
low 1024x768
55.8  fps    + Compare
» With all tested laptops playable in detail settings low.
Mafia 2

Mafia 2

2010
med. 1024x768
34.5  fps    + Compare
high 1360x768
27.9  fps    + Compare
» The benchmarks indicate that the game is not playable in the tested settings.
low 1024x768
142.7 198 ~ 170 fps    + Compare
med. 1360x768
38.6 48 ~ 43 fps    + Compare
high 1360x768
26  fps    + Compare
ultra 1920x1080
14  fps    + Compare
» With all tested laptops playable in detail settings med..
low 800x600
40.1  fps    + Compare
med. 1360x768
20.6 24.5 ~ 23 fps    + Compare
high 1600x900
12.1 16.5 ~ 14 fps    + Compare
ultra 1920x1080
9  fps    + Compare
» With all tested laptops playable in detail settings low.
low 1024x768
96.7  fps    + Compare
med. 1366x768
74.3  fps    + Compare
high 1366x768
56.5  fps    + Compare
» With all tested laptops playable in detail settings high.
Resident Evil 5

Resident Evil 5

2009
low 800x600
175  fps    + Compare
high 1360x768
39.9  fps    + Compare
ultra 1920x1080
17.6  fps    + Compare
» With all tested laptops playable in detail settings high.
Trackmania Nations Forever

Trackmania Nations Forever

2008
high 1024x768
65.9  fps    + Compare
ultra 1920x1080
31.2  fps    + Compare
» With all tested laptops playable in detail settings high.
Crysis - GPU Benchmark

Crysis - GPU Benchmark

2007
med. 1024x768
50.5  fps    + Compare
high 1024x768
27.7  fps    + Compare
» With all tested laptops playable in detail settings med..
Crysis - CPU Benchmark

Crysis - CPU Benchmark

2007
med. 1024x768
46.4  fps    + Compare
high 1024x768
24.6  fps    + Compare
» With all tested laptops playable in detail settings med..
World of Warcraft

World of Warcraft

2005
low 800x600
100.1  fps    + Compare
med. 1024x768
56.6 69 ~ 63 fps    + Compare
high 1280x1024
11.2 34 ~ 23 fps    + Compare
ultra 1920x1080
10  fps    + Compare
» With all tested laptops playable in detail settings med..
lowmed.highultraQHD4K
New World6.56
Monster Hunter Stories 227.713.8
Days Gone7.11
Mass Effect Legendary Edition14.38.65
Yakuza Like a Dragon11
Mafia Definitive Edition8.26
Hunt Showdown8.7
Escape from Tarkov9.7
Star Wars Jedi Fallen Order5.6
Need for Speed Heat11.6
FIFA 2032.1
Borderlands 39.3
Control10.4
F1 201915
Total War: Three Kingdoms15.9
Anno 180014.7
The Division 212
Dirt Rally 2.023.5
Anthem6
Far Cry New Dawn9
Metro Exodus5
Apex Legends16.8
Just Cause 410.5
Darksiders III18.77.9
Battlefield V12
Farming Simulator 1932.1
Fallout 7610.1
Hitman 28.2
Call of Duty Black Ops 413.7
Assassin´s Creed Odyssey6
Forza Horizon 47
FIFA 1945.7
Shadow of the Tomb Raider11
F1 201815
Monster Hunter World9.1
The Crew 215.2
Far Cry 59
World of Tanks enCore146.414.6
X-Plane 11.1120.813.6
Kingdom Come: Deliverance11.7
Final Fantasy XV Benchmark9.6
Fortnite39.612.4
Need for Speed Payback16.3
Call of Duty WWII21.5
Assassin´s Creed Origins7
Destiny 213.7
ELEX10.4
The Evil Within 29.2
Middle-earth: Shadow of War107
FIFA 1859.230.4
Ark Survival Evolved9.6
F1 20171913
Playerunknown's Battlegrounds (PUBG)17.5
Team Fortress 27065.330
Dirt 428
Rocket League572015.9
Prey208
Warhammer 40.000: Dawn of War III15
Mass Effect Andromeda6
Ghost Recon Wildlands10
For Honor11.1
Resident Evil 73114
Watch Dogs 254
Dishonored 200
Call of Duty Infinite Warfare87
Titanfall 228176.6
Farming Simulator 1770421510
Battlefield 121135.2
Civilization VI289
Mafia 37
FIFA 17574322
Deus Ex Mankind Divided107.6
No Man's Sky6
Mirror's Edge Catalyst1911
Overwatch3924
Ashes of the Singularity10.3
Need for Speed 20161510.1
Hitman 201698
The Division129.3
Far Cry Primal136
XCOM 2145.1
Rise of the Tomb Raider159
Rainbow Six Siege22137.8
Just Cause 318146.8
Star Wars Battlefront26157
Assassin's Creed Syndicate74.6
Fallout 418116
Call of Duty: Black Ops 32313
Anno 22051463
FIFA 16593118
World of Warships41.629.514.411
Metal Gear Solid V38248
Mad Max1676
Dota 2 Reborn99.462.121.8
Batman: Arkham Knight12104
The Witcher 31283.8
Dirt Rally102231313
GTA V262352.1
Battlefield Hardline3122105.3
Evolve1310
The Crew231610.25.3
Dragon Age: Inquisition22.114.55.83.8
Far Cry 4191365.3
Assassin's Creed Unity85
Call of Duty: Advanced Warfare311694.4
Civilization: Beyond Earth361397.4
F1 201462422413
The Evil Within15106.7
Ryse: Son of Rome1394.44.2
Alien: Isolation3623128
Middle-earth: Shadow of Mordor2215
Fifa 15463119
Sims 4139341611
Risen 3: Titan Lords311976.4
GRID: Autosport95311713
Watch Dogs24.414.13.6
Wolfenstein: The New Order393514
The Elder Scrolls Online5927169.3
Titanfall4322149.1
Thief16984.8
Assassin´s Creed IV: Black Flag24.818.48.94.7
X-Plane 10.254325109.4
Need for Speed: Rivals171311
Call of Duty: Ghosts40.827.410.15.2
Battlefield 436.624.815.35.5
Batman: Arkham Origins5632157
F1 201360362813
Fifa 14169895948
Total War: Rome II3928227
Saints Row IV261910.96.3
The Bureau: XCOM Declassified39.817.19.76.6
Splinter Cell: Blacklist52.1
Dota 2724121
Company of Heroes 2151162.9
GRID 262332212.5
Metro: Last Light2820116
BioShock Infinite3718158
StarCraft II: Heart of the Swarm253523311
SimCity7418157
Tomb Raider5224134
Crysis 32419.313.54.7
Dead Space 3101.241.931.417.4
Far Cry 338.123.4
Assassin´s Creed III14.9
Hitman: Absolution20147
Call of Duty: Black Ops 26240.917.510.6
Need for Speed: Most Wanted34.724.1
Medal of Honor: Warfighter24.616.3
Dishonored42322819.7
Counter-Strike: GO186.999.25227
Sleeping Dogs3827116.5
Max Payne 319.4
Dirt Showdown49.926.6
Diablo III70443723
Risen 2: Dark Waters1518.1
Mass Effect 332.122.4
Alan Wake18.5
Anno 207066301911.4
The Elder Scrolls V: Skyrim3918116
CoD: Modern Warfare 3141.963.127.5
Battlefield 32920187
Batman: Arkham City6647
Deus Ex Human Revolution84.736.9
Dirt 361.327.9
Total War: Shogun 26800
Civilization 555.8
Mafia 234.527.9
StarCraft 2170432614
Metro 203340.123149
Battlefield: Bad Company 296.774.356.5
Resident Evil 517539.917.6
Trackmania Nations Forever65.931.2
Crysis - GPU Benchmark50.527.7
Crysis - CPU Benchmark46.424.6
World of Warcraft100.1632310
< 30 fps
< 60 fps
< 120 fps
≥ 120 fps
100
38
19
8
80
23
8
70
11
1
54
2


For more games that might be playable and a list of all games and graphics cards visit our Gaming List

v1.26
log 14. 09:24:01

#0 no ids found in url (should be separated by "_") +0s ... 0s

#1 not redirecting to Ajax server +0s ... 0s

#2 did not recreate cache, as it is less than 5 days old! Created at Sat, 13 Apr 2024 05:44:32 +0200 +0.001s ... 0.001s

#3 no comparison url found in template nbc.compare_page_1 needed +0.064s ... 0.065s

#4 no comparison url found in template nbc.compare_page_1 needed +0s ... 0.065s

#5 no comparison url found in template nbc.compare_page_1 needed +0s ... 0.065s

#6 no comparison url found in template nbc.compare_page_1 needed +0s ... 0.066s

#7 no comparison url found in template nbc.compare_page_1 needed +0s ... 0.066s

#8 no comparison url found in template nbc.compare_page_1 needed +0s ... 0.066s

#9 no comparison url found in template nbc.compare_page_1 needed +0s ... 0.066s

#10 no comparison url found in template nbc.compare_page_1 needed +0s ... 0.066s

#11 no comparison url found in template nbc.compare_page_1 needed +0s ... 0.066s

#12 no comparison url found in template nbc.compare_page_1 needed +0s ... 0.066s

#13 no comparison url found in template nbc.compare_page_1 needed +0s ... 0.066s

#14 no comparison url found in template nbc.compare_page_1 needed +0s ... 0.067s

#15 no comparison url found in template nbc.compare_page_1 needed +0s ... 0.067s

#16 no comparison url found in template nbc.compare_page_1 needed +0s ... 0.067s

#17 no comparison url found in template nbc.compare_page_1 needed +0s ... 0.067s

#18 no comparison url found in template nbc.compare_page_1 needed +0s ... 0.067s

#19 no comparison url found in template nbc.compare_page_1 needed +0s ... 0.067s

#20 no comparison url found in template nbc.compare_page_1 needed +0s ... 0.068s

#21 no comparison url found in template nbc.compare_page_1 needed +0s ... 0.068s

#22 no comparison url found in template nbc.compare_page_1 needed +0s ... 0.069s

#23 no comparison url found in template nbc.compare_page_1 needed +0s ... 0.069s

#24 no comparison url found in template nbc.compare_page_1 needed +0s ... 0.069s

#25 composed specs +0s ... 0.069s

#26 did output specs +0s ... 0.069s

#27 start showIntegratedCPUs +0s ... 0.069s

#28 getting avg benchmarks for device 3567 +0.053s ... 0.122s

#29 got single benchmarks 3567 +0.083s ... 0.205s

#30 got avg benchmarks for devices +0s ... 0.205s

#31 min, max, avg, median took s +1.031s ... 1.237s

#32 before gaming benchmark output +0s ... 1.237s

#33 Got 808 rows for game benchmarks. +0.039s ... 1.275s

#34 composed SQL query for gamebenchmarks +0s ... 1.275s

#35 got data and put it in $dataArray +0.129s ... 1.405s

#36 benchmarks composed for output. +4.772s ... 6.177s

#37 no comparison url found in template nbc.compare_page_1 needed +0.007s ... 6.184s

#38 return log +0s ... 6.184s

Notebook reviews with Intel HD Graphics 4600 graphics card

富士通 Lifebook E544 笔记本电脑简短评测

富士通 Lifebook E544 笔记本电脑简短评测

可靠。 可靠性经常是一台商务笔记本电脑的关键所在。富士通的Lifebook E544系列以700欧元(约5181人民币)的售价提供了全面的表现。请阅读我们的测试也了解它的硬件配置、输入设备、安全标准是否可以令人满意,达到优秀的水平。...
Intel Core i5-4210M | Intel HD Graphics 4600 | 14.00" | 2.1 kg
富士通 Lifebook E554 笔记本电脑简短评测

富士通 Lifebook E554 笔记本电脑简短评测

孰能无过。 Lifebook E554是一款主要面向企业用户的笔记本电脑产品。它600到1000欧元(约4432到7402人民币)的售价对个人用户来说也有一定的吸引力。我们正在测试的是它的顶配机型。它为用户提供了充足的运算性能,IPS屏幕,固态硬盘,3G模组,和优秀的电池续航。...
Intel Core i5-4210M | Intel HD Graphics 4600 | 15.60" | 2.3 kg
联想 ThinkPad L440 20AT004QGE 笔记本电脑简短评测 更新

联想 ThinkPad L440 20AT004QGE 笔记本电脑简短评测 更新

加强版。 L系列是ThinkPad世界的低价入门级产品线。它提供了舒适的打字体验,丰富的接口,包括一个拓展坞接口,还有坚固的经典机身。联想现在为这款设备配备了固态硬盘和HD+分辨率屏幕。这能够帮助L440成为实惠型专业笔记本中的佼佼者吗?...
Intel Core i5-4300M | Intel HD Graphics 4600 | 14.00" | 2.1 kg
富士通 LifeBook T734 变形本简短评测

富士通 LifeBook T734 变形本简短评测

复古商务。 通用性和便携性是这款富士通最新笔记本的重要特点。手写笔和多点触控成为了新的输入方式,3G网络则提供了必要的便携性。不过这并不足以给它带来出色的成绩。...
Intel Core i5-4200M | Intel HD Graphics 4600 | 12.50" | 2 kg
东芝 Portégé R30-A-15C 笔记本电脑简短评测

东芝 Portégé R30-A-15C 笔记本电脑简短评测

野心。 全高清磨砂屏幕,高速固态硬盘,拓展坞接口,轻薄,长续航时间——东芝把它们组合成了完美的办公笔记本产品吗?...
Intel Core i7-4600M | Intel HD Graphics 4600 | 13.30" | 1.4 kg

Fujitsu LifeBook E744: Intel Core i5-4200M, 14.00", 1.8 kg
  External Review » Fujitsu LifeBook E744

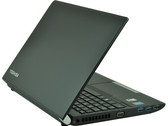
Toshiba Portege R30-A-17H: Intel Core i3-4100M, 13.30", 1.5 kg
  External Review » Toshiba Portege R30-A-17H

Asus ASUSPRO Advanced B451JA-WO076G: Intel Core i5-4210M, 14.00", 2.2 kg
  External Review » Asus ASUSPRO Advanced B451JA-WO076G

Toshiba Portege R30-A-17R: Intel Core i5-4210M, 13.30", 1.5 kg
  External Review » Toshiba Portege R30-A-17R

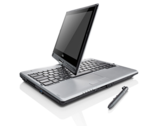
Fujitsu LifeBook T734: Intel Core i5-4200M, 12.50", 2 kg
  External Review » Fujitsu LifeBook T734

MSI CR70 2M: Intel Core i3-4100M, 17.30", 2.7 kg
  External Review » MSI CR70 2M

Medion Akoya E6241-MD98562: Intel Core i3-4100M, 15.60", 2.4 kg
  External Review » Medion Akoya E6241-MD98562

Lenovo ThinkPad L540-20AU002QGE: Intel Core i5-4330M, 15.60", 2.5 kg
  External Review » Lenovo ThinkPad L540-20AU002QGE

Fujitsu Lifebook E544: Intel Core i5-4210M, 14.00", 2.1 kg
  External Review » Fujitsu Lifebook E544

Fujitsu LifeBook A544: Intel Core i5-4200M, 15.60", 2.2 kg
  External Review » Fujitsu LifeBook A544

Fujitsu LifeBook E554: Intel Core i5-4210M, 15.60", 2.3 kg
  External Review » Fujitsu LifeBook E554

Asus K750JA: Intel Core i7-4700HQ, 17.30", 3.1 kg
  External Review » Asus K750JA

HP ProBook 640-F1Q08ES: Intel Core i7-4702MQ, 14.00", 2 kg
  External Review » HP ProBook 640-F1Q08ES

HP ProBook 450 G1: Intel Core i5-4200M, 15.60", 2.3 kg
  External Review » HP ProBook 450 G1

Toshiba Portege R30-A-15C: Intel Core i7-4600M, 13.30", 1.4 kg
  External Review » Toshiba Portege R30-A-15C

Lenovo G510-59416358: Intel Core i5-4200M, 15.60", 2.5 kg
  External Review » Lenovo G510

Samsung 940X5J-K01US: Intel Core i5-4200U, 15.60", 1.8 kg
  External Review » Samsung 940X5J-K01US

Please share our article, every link counts!

» Comparison of GPUs
Detailed list of all laptop GPUs sorted by class and performance.

» Benchmark List
Sort and restrict laptop GPUs based on performance in synthetic benchmarks.

» Notebook Gaming List
Playable games for each graphics card and their average FPS results.

Class 1

GeForce RTX 2080 Super Mobile

Class 2

M1 Max 32-Core GPU *
GeForce RTX 2070 Super Mobile
M1 Max 24-Core GPU *
Quadro RTX 5000 Max-Q
Radeon RX 5700M *
GeForce GTX 1080 Mobile
Quadro RTX 4000 (Laptop)
M1 Pro 16-Core GPU *
Radeon PRO W6600M *
GeForce RTX 2070 Super Max-Q
Quadro RTX 4000 Max-Q *
M1 Pro 14-Core GPU *
Quadro P5200
Quadro RTX 3000 Max-Q *
Quadro P4200
Quadro P5000 Max-Q *
GeForce GTX 980 (Laptop)
Quadro P4000
Quadro P4000 Max-Q
Quadro P3200
Radeon RX 580X (Laptop) *
Radeon RX 580 (Laptop)
Radeon Pro 5300M
Radeon RX 5300M
Quadro P3000 Max-Q *
Quadro T2000 Max-Q *
Radeon Pro WX 7100 *
Radeon RX 570X (Laptop) *
Radeon RX 570 (Laptop) *
Radeon RX 470 (Laptop) *
Quadro T1000 Max-Q *

Class 3

Vega M GH
Quadro M5000M
GeForce GTX 1050 Ti Mobile
Radeon 680M
Quadro P2000
Quadro P2000 Max-Q
Quadro M4000M
T500 Laptop GPU *
Radeon R9 M395X
GeForce GTX 1050 Ti Max-Q *
Radeon Pro Vega 16
WX Vega M GL
Radeon R9 M485X
Quadro M3000M
FirePro W7170M
Radeon R9 M395
GeForce GTX 1050 Max-Q *
Radeon 660M
Radeon Pro WX 4150 *
Radeon RX 560X (Laptop)
Radeon RX 560 (Laptop)
Radeon RX 460 (Laptop)
Quadro P1000
Radeon R9 M390
Xe MAX
Radeon Pro 560X
Radeon Pro 560
Radeon Pro 460
Radeon Pro WX 4130 *
GeForce GTX 960M
Quadro P620 *
Radeon RX 550X (Laptop)
Radeon Pro WX 3200 *
Radeon Pro 555X
Radeon Pro 555
Radeon Pro 455
Quadro P600
Quadro M2000M
Radeon RX 540X *
Radeon Pro WX 2100 *
Radeon Pro WX 3100 *
GeForce GTX 950M
Radeon Pro 450
Radeon 630
Radeon 540X *
Radeon R9 M385X
Quadro P520
Quadro M1000M
GeForce 945M
Quadro P500 *
Iris Plus Graphics G7 (Ice Lake 64 EU) *
Vega 10 *
Iris Pro Graphics 580
FirePro W5170M *
Radeon R9 M370X
Vega 9
FirePro W5130M
UHD Graphics Xe G4 48EUs *
UHD Graphics 32EUs
UHD Graphics Xe 32EUs (Tiger Lake-H) *
UHD Graphics 750
Vega 7
Radeon R7 M465
Iris Pro Graphics 6200
Vega 8
GeForce 940M
Iris Plus Graphics G4 (Ice Lake 48 EU)
Quadro M600M
FirePro W4190M
Radeon R9 M375
Radeon R7 M445
Iris Plus Graphics 650
Iris Graphics 550
Radeon 625
Vega 6 *
Iris Plus Graphics 640
Iris Graphics 540
UHD Graphics 24EUs (Alder Lake-N) *
Radeon R7 M360
GeForce 920M
Radeon 620
Radeon R7 M340
Radeon 610
Radeon 610M *
Vega 6 *
UHD Graphics G1 (Ice Lake 32 EU)
UHD Graphics Xe 16EUs (Tiger Lake-H) *
HD Graphics 530
Radeon R5 (Bristol Ridge)
Adreno 690 *
Adreno 685 *
Adreno 680 *
Radeon R5 M330
GeForce 910M
HD Graphics 520

Class 4

UHD Graphics 730
Radeon R5 M320 *
Radeon R5 M315 *
Radeon R5 M420 *
Vega 2 *
UHD Graphics 617
UHD Graphics 615
HD Graphics 515
UHD Graphics 610
HD Graphics 510
UHD Graphics 605
Radeon R4 (Stoney Ridge)
Radeon R2 (Stoney Ridge)
HD Graphics (Broadwell)
UHD Graphics 600
HD Graphics (Braswell)

Class 5

* Approximate position of the graphics adapter