Notebookcheck Logo

NVIDIA GeForce RTX 4050 Laptop GPU

NVIDIA NVIDIA GeForce RTX 4050 Laptop GPU

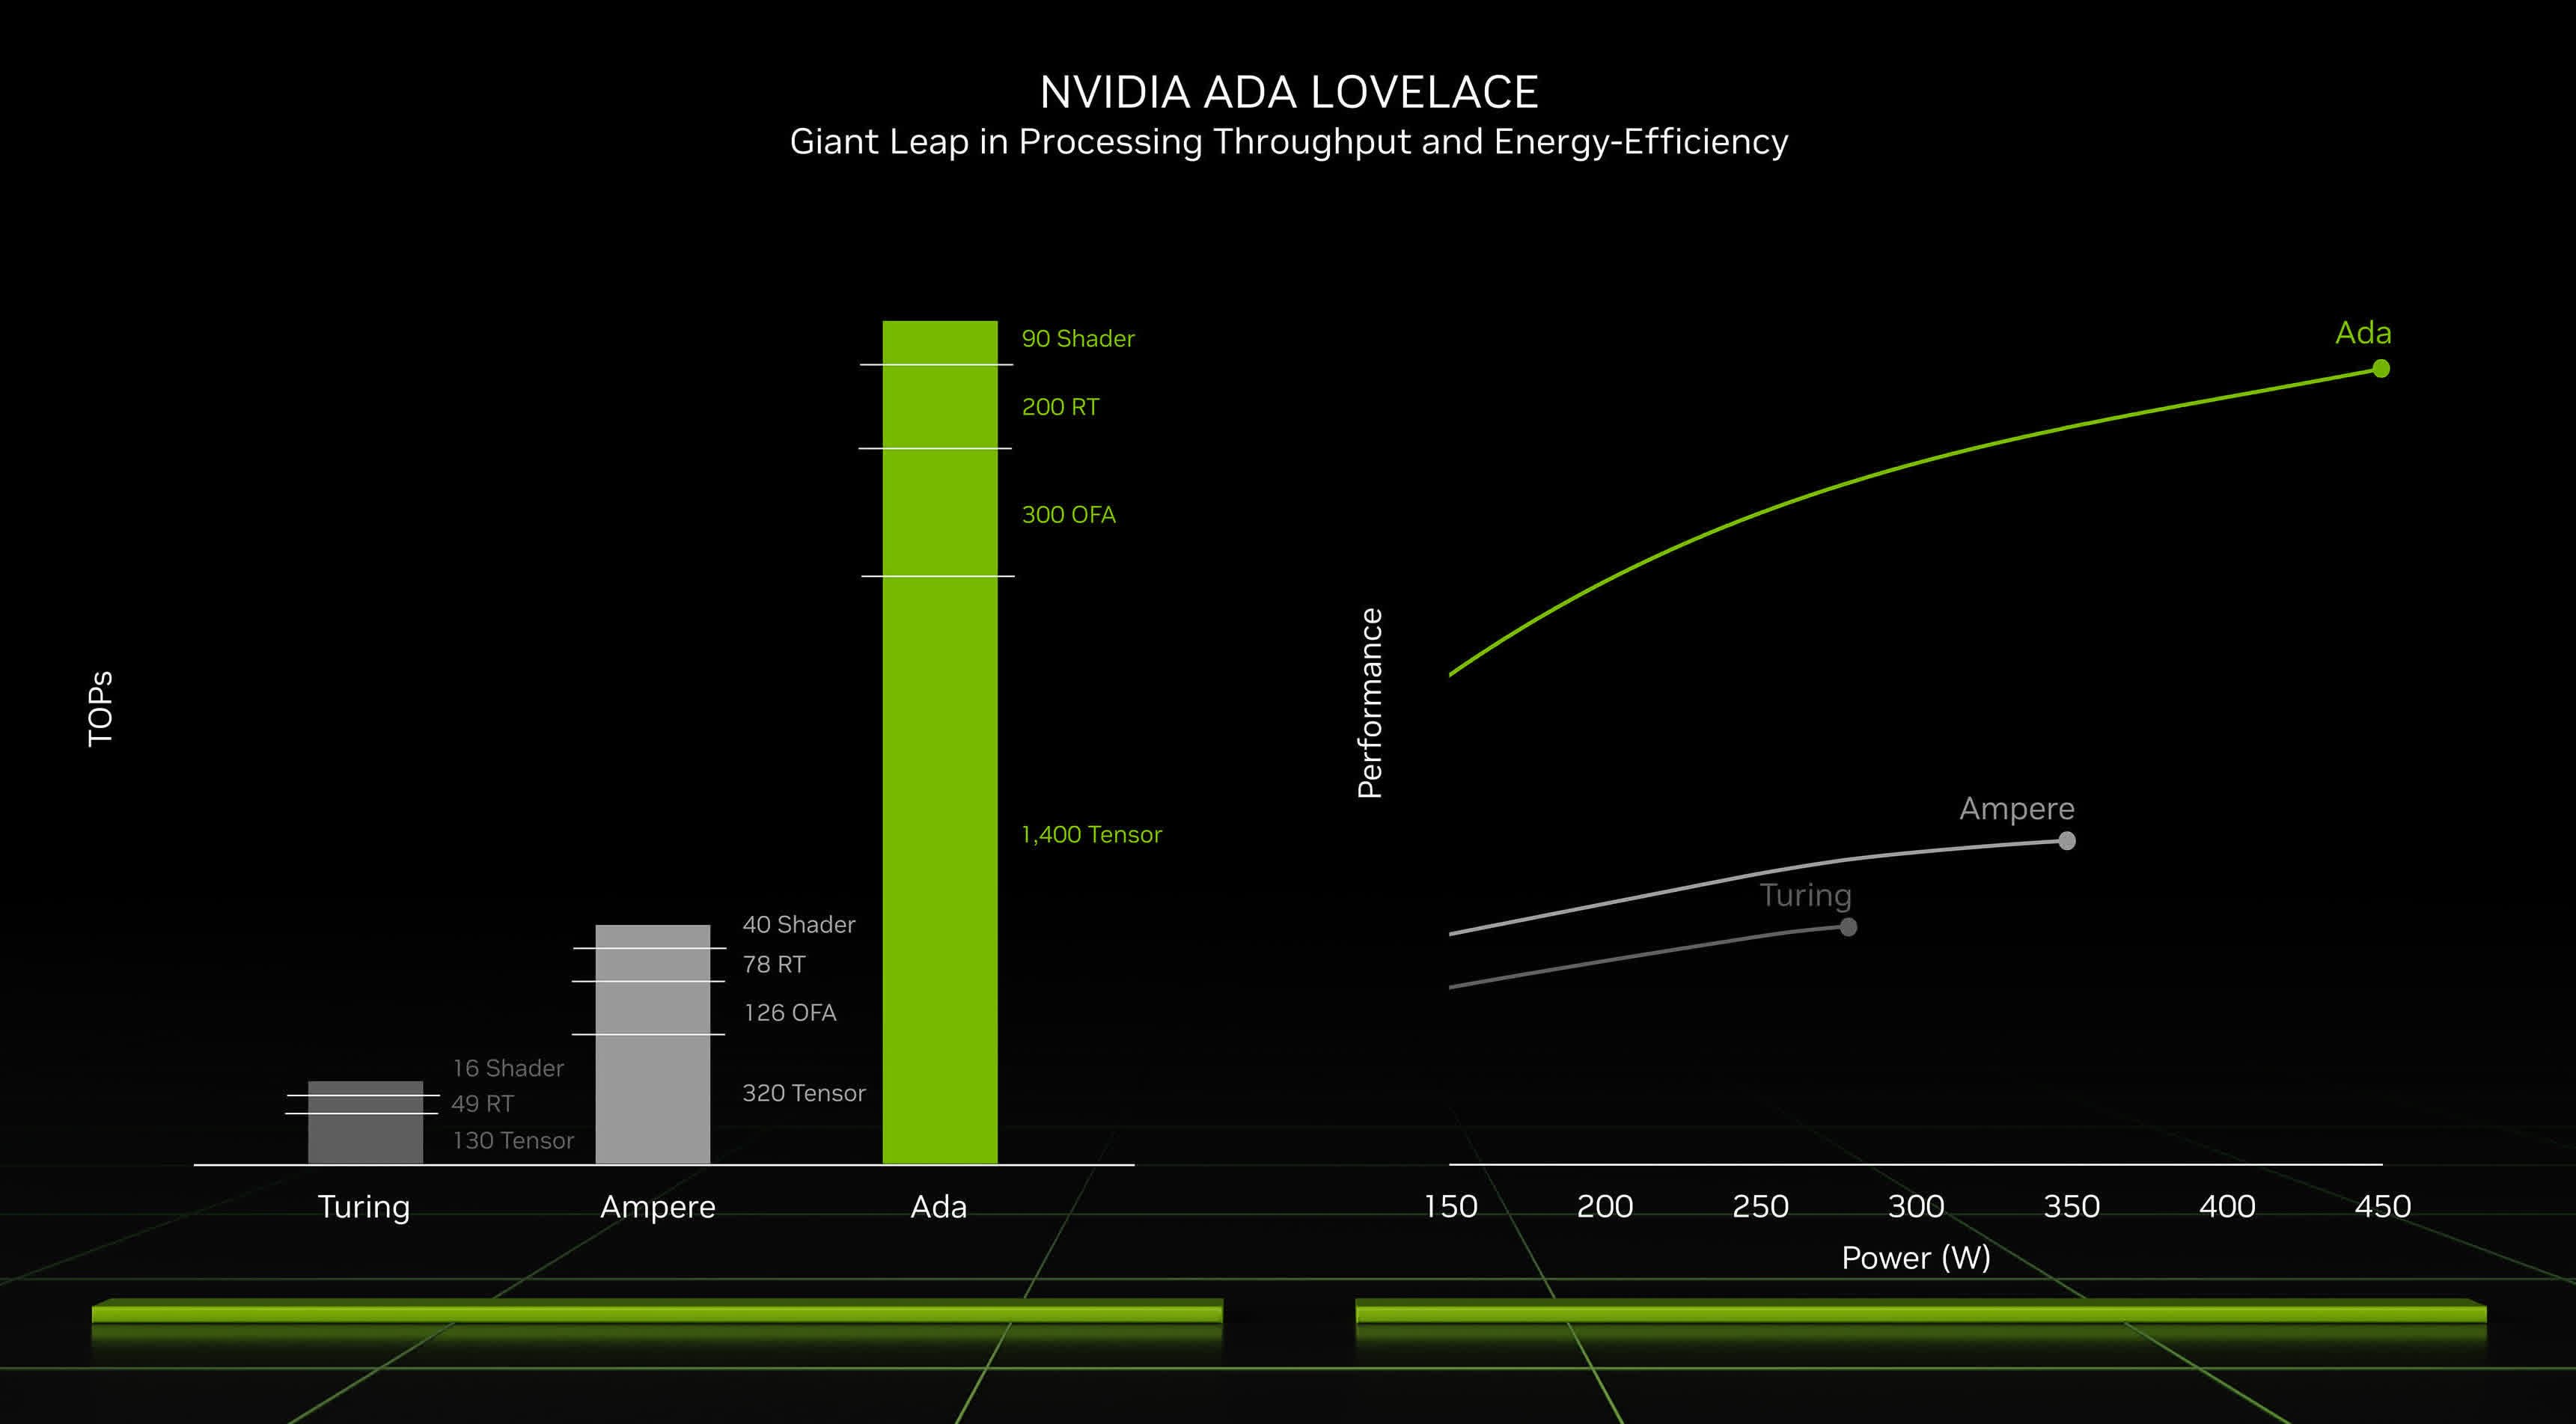
NVIDIA GeForce RTX 4050 笔记本电脑 GPU(代号 GN21-X2)是一款中端笔记本电脑 GPU。它基于AD107芯片并采用Ada Lovelace架构。 RTX 4050 笔记本电脑提供 2560 个着色器,并使用 6 GB GDDR6 专用图形内存,时钟速度为 16 Gbps(有效)和 96 位内存总线。 TGP(总显卡功率)可配置为 35 至 115 瓦(+ CPU 的 10-25 瓦动态增强),从而实现不同的性能水平。升压时钟取决于 TGP 设置,范围为 1605 MHz(35 瓦)至 2370 MHz(115 瓦)。因此,性能也很大程度上取决于笔记本电脑和 TDP 设置。

在我们的基准测试中,RTX 4050 略落后于旧款移动 RTX 3060,但明显比移动 RTX 3050 Ti 更快。因此,它最适合在高至超高设置下进行 1920x1080 游戏,具体取决于游戏(请参阅下面的基准)。

RTX 4050 提供 80 个张量核心,因此支持 DLSS 3,包括对支持的游戏产生重大影响的帧生成。然而,光线追踪核心的使用量将会减少,因为 RTX 4050 无法为要求较高的游戏中的高细节设置和光线追踪提供足够的性能。

AD107芯片由台积电5nm工艺制造(4N工艺)。

GeForce RTX 4000 Laptop GPU Series

NVIDIA GeForce RTX 4090 Laptop GPU 9728 @ 2.04 GHz256 Bit @ 20000 MHz
NVIDIA GeForce RTX 4080 Laptop GPU 7424 @ 1.86 - 2.28 GHz192 Bit @ 20000 MHz
NVIDIA GeForce RTX 4070 Laptop GPU 4608 @ 1.61 - 2.18 GHz128 Bit @ 16000 MHz
NVIDIA GeForce RTX 4060 Laptop GPU 3072 @ 2.37 GHz128 Bit @ 16000 MHz
NVIDIA GeForce RTX 4050 Laptop GPU 2560 @ 2.37 GHz96 Bit @ 16000 MHz
CodenameGN21-X2
ArchitectureAda Lovelace
Pipelines2560 - unified
TMUs80
ROPs32
Raytracing Cores20
Tensor / AI Cores80
Core Speed2370 (Boost) MHz
Theoretical Performance9 TFLOPS FP32, 0.14 TFLOPS FP64
CacheL2: 12 MB
Memory Speed16000 effective = 2000 MHz
Memory Bus Width96 Bit
Memory TypeGDDR6
Max. Amount of Memory6 GB
Shared Memoryno
Memory Bandwidth192 GB/s
APIDirectX 12 Ultimate, Shader 6.7, OpenGL 4.6, OpenCL 3.0, Vulkan 1.3
Power Consumption115 Watt (35 - 115 Watt TGP)
technology5 nm
PCIe4.0 x16
Displays4 Displays (max.), HDMI 2.1, DisplayPort 1.4a
Notebook Sizelarge
Date of Announcement03.01.2023
Link to Manufacturer Pagewww.nvidia.com
PredecessorGeForce RTX 3050 4GB Laptop GPU

Benchmarks

Performance Rating - 3DMark 11 + Fire Strike + Time Spy
10.1 pt (30%)
AMD Radeon HD 8180
0.06605 -99%
...
NVIDIA Quadro P5200
8.41 -17%
8.49 -16%
NVIDIA Quadro RTX 5000 Max-Q
9.02 -11%
9.29 -8%
9.39 -7%
9.43 -7%
NVIDIA GeForce RTX 2070 Super Max-Q
9.51 -6%
9.7 -4%
NVIDIA GeForce GTX 1080 Mobile
9.75 -3%
NVIDIA GeForce RTX 4050 Laptop GPU
10.1
10.5 4%
10.7 6%
11 9%
11.6 15%
11.6 15%
11.6 15%
11.6 15%
11.8 17%
12 19%
...
21.1 109%
max:
33.3 230%
0%
100%
3DMark - 3DMark Time Spy Score
min: 5395     avg: 7975     median: 8555.5 (25%)     max: 9236 Points
3DMark - 3DMark Time Spy Graphics
min: 5107     avg: 7763     median: 8225.5 (22%)     max: 9040 Points
Intel UHD Graphics 605
113 -99%
...
NVIDIA Quadro P5200
6422 -17%
6745 -13%
NVIDIA Quadro RTX 4000 Max-Q
6764 -13%
NVIDIA GeForce GTX 1080 Mobile
6867 -12%
7129 -8%
NVIDIA Quadro RTX 4000 (Laptop)
7284 -6%
NVIDIA Quadro RTX 5000 Max-Q
7432 -4%
NVIDIA GeForce RTX 2070 Super Max-Q
7445 -4%
7651 -1%
NVIDIA GeForce RTX 4050 Laptop GPU
7763
7864 1%
7903 2%
8057 4%
8155 5%
8210 6%
NVIDIA GeForce RTX 2070 Super Mobile
8238 6%
8316 7%
8334 7%
8700 12%
...
19434 150%
max:
36485 370%
0%
100%
3DMark - 3DMark Ice Storm Unlimited Graphics
min: 544225     avg: 552112     median: 552112 (63%)     max: 559999 Points
3DMark - 3DMark Ice Storm Extreme Graphics
min: 306885     avg: 330453     median: 330452 (42%)     max: 354020 Points
3DMark - 3DMark Cloud Gate Score
min: 25240     avg: 50084     median: 52806.5 (56%)     max: 65111 Points
3DMark - 3DMark Cloud Gate Graphics
min: 51138     avg: 126241     median: 136776 (36%)     max: 161152 Points
3DMark - 3DMark Fire Strike Standard Score
min: 12382     avg: 18429     median: 19609.5 (35%)     max: 21537 Points
3DMark - 3DMark Fire Strike Standard Graphics
min: 13591     avg: 21045     median: 22194 (25%)     max: 24007 Points
3DMark - 3DMark Ice Storm Graphics
min: 150943     avg: 301370     median: 303129 (36%)     max: 433961 Points
3DMark - 3DMark Wild Life Unlimited
min: 46236     avg: 50214     median: 50213.5 (25%)     max: 54191 Points
3DMark - 3DMark Wild Life Extreme Unlimited
min: 9394     avg: 13655     median: 13488 (16%)     max: 16529 Points
3DMark - 3DMark Night Raid
min: 41436     avg: 45517     median: 44735 (42%)     max: 51162 Points
3DMark - 3DMark Night Raid Graphics Score
min: 68530     avg: 87295     median: 90323.5 (35%)     max: 100002 Points
3DMark 11 - 3DM11 Performance Score
min: 13881     avg: 25107     median: 27008 (37%)     max: 29150 Points
3DMark 11 - 3DM11 Performance GPU
min: 13339     avg: 28539     median: 30513.5 (26%)     max: 32642 Points
171.8 -99%
...
NVIDIA Quadro RTX 4000 (Laptop)
25371 -11%
25737 -10%
25775 -10%
25897 -9%
NVIDIA Quadro RTX 5000 Max-Q
26602 -7%
26816 -6%
NVIDIA GeForce RTX 2070 Super Max-Q
27104 -5%
27852 -2%
NVIDIA GeForce GTX 1080 Mobile
28106 -2%
NVIDIA GeForce RTX 4050 Laptop GPU
28539
28692 1%
28847 1%
NVIDIA GeForce RTX 2070 Super Mobile
29416 3%
29663 4%
30077 5%
31142 9%
32331 13%
32662 14%
32846 15%
...
59943 110%
max:
106023 272%
0%
100%
3DMark Vantage
3DM Vant. Perf. total +
3DM Vant. Perf. GPU no PhysX +
3DMark Vantage - 3DM Vant. Perf. GPU no PhysX
88394 Points (50%)
3DMark 06 3DMark 06 - Standard 1280x1024 +
3DMark 06
min: 43233     avg: 48996     median: 50886 (66%)     max: 52966 Points
Blender - Blender 3.3 Classroom CUDA *
min: 47     avg: 56.7     median: 52 (8%)     max: 175 Seconds
Blender - Blender 3.3 Classroom OPTIX *
min: 25     avg: 29     median: 28 (10%)     max: 37 Seconds
Blender - Blender 3.3 Classroom HIP *
345 Seconds (28%)
SPECviewperf 13 specvp13 sw-04 +
SPECviewperf 13 - specvp13 sw-04
93.4 fps (25%)
specvp13 snx-03 +
SPECviewperf 13 - specvp13 snx-03
21 fps (2%)
specvp13 showcase-02 +
SPECviewperf 13 - specvp13 showcase-02
78.3 fps (17%)
specvp13 medical-02 +
SPECviewperf 13 - specvp13 medical-02
59.9 fps (13%)
specvp13 maya-05 +
SPECviewperf 13 - specvp13 maya-05
253.7 fps (29%)
specvp13 energy-02 +
SPECviewperf 13 - specvp13 energy-02
31.8 fps (10%)
specvp13 creo-02 +
SPECviewperf 13 - specvp13 creo-02
173 fps (25%)
specvp13 catia-05 +
SPECviewperf 13 - specvp13 catia-05
124.6 fps (14%)
specvp13 3dsmax-06 +
SPECviewperf 13 - specvp13 3dsmax-06
164.7 fps (29%)
SPECviewperf 2020 specvp2020 solidworks-05 1080p +
SPECviewperf 2020 - specvp2020 solidworks-05 1080p
min: 177.8     avg: 184     median: 186 (36%)     max: 188.3 fps
specvp2020 snx-04 1080p +
SPECviewperf 2020 - specvp2020 snx-04 1080p
min: 18.3     avg: 20.3     median: 20.7 (3%)     max: 21.4 fps
specvp2020 medical-03 1080p +
SPECviewperf 2020 - specvp2020 medical-03 1080p
min: 25.7     avg: 28.3     median: 28.6 (29%)     max: 30.1 fps
specvp2020 maya-06 1080p +
SPECviewperf 2020 - specvp2020 maya-06 1080p
min: 281.4     avg: 307.3     median: 307 (45%)     max: 333.9 fps
specvp2020 energy-03 1080p +
SPECviewperf 2020 - specvp2020 energy-03 1080p
min: 28.2     avg: 29.2     median: 29 (23%)     max: 30.7 fps
specvp2020 creo-03 1080p +
SPECviewperf 2020 - specvp2020 creo-03 1080p
min: 79.3     avg: 87.3     median: 87.8 (43%)     max: 94.5 fps
specvp2020 catia-06 1080p +
SPECviewperf 2020 - specvp2020 catia-06 1080p
min: 47.9     avg: 49.3     median: 49.4 (32%)     max: 50.7 fps
specvp2020 3dsmax-07 1080p +
SPECviewperf 2020 - specvp2020 3dsmax-07 1080p
min: 76.2     avg: 78.2     median: 78.4 (36%)     max: 79.7 fps
specvp2020 solidworks-05 4k +
SPECviewperf 2020 - specvp2020 solidworks-05 4k
73.4 fps (22%)
specvp2020 snx-04 4k +
specvp2020 medical-03 4k +
SPECviewperf 2020 - specvp2020 medical-03 4k
9.2 fps (9%)
specvp2020 maya-06 4k +
specvp2020 energy-03 4k +
specvp2020 creo-03 4k +
specvp2020 catia-06 4k +
SPECviewperf 2020 - specvp2020 catia-06 4k
27.9 fps (18%)
specvp2020 3dsmax-07 4k +
SPECviewperf 2020 - specvp2020 3dsmax-07 4k
52.2 fps (22%)
Cinebench R10 Cinebench R10 Shading (32bit) +
Cinebench R10 - Cinebench R10 Shading (32bit)
min: 14167     avg: 16109     median: 16035 (11%)     max: 18124 points
Cinebench R11.5 Cinebench R11.5 OpenGL 64 Bit +
Cinebench R11.5 - Cinebench R11.5 OpenGL 64 Bit
min: 102.32     avg: 147.9     median: 159.9 (55%)     max: 169.44 fps
Cinebench R15
Cinebench R15 OpenGL 64 Bit +
Cinebench R15 - Cinebench R15 OpenGL 64 Bit
min: 141.3     avg: 196.1     median: 192 (11%)     max: 270 fps
Cinebench R15 OpenGL Ref. Match 64 Bit +
Cinebench R15 - Cinebench R15 OpenGL Ref. Match 64 Bit
99.6 % (100%)
GFXBench - GFXBench 5.0 4K Aztec Ruins High Tier Offscreen
90 fps (37%)
GFXBench - GFXBench 5.0 Aztec Ruins High Tier Offscreen
208 fps (38%)
3.3 -98%
...
Apple M3 10-Core GPU
118.5 -43%
Apple M1 Pro 14-Core GPU
147 -29%
NVIDIA Quadro RTX 5000 Max-Q
153 -26%
161.4 -22%
Apple M1 Pro 16-Core GPU
166 -20%
178.7 -14%
181.1 -13%
185.4 -11%
187 -10%
NVIDIA GeForce RTX 4050 Laptop GPU
208
210.6 1%
219.7 6%
Apple M1 Max 24-Core GPU
240 15%
242.3 16%
248.5 19%
261.5 26%
288.5 39%
Apple M1 Max 32-Core GPU
309.4 49%
326.1 57%
...
536 158%
0%
100%
GFXBench - GFXBench 5.0 Aztec Ruins Normal Tier Offscreen
568 fps (42%)
GFXBench - GFXBench Car Chase Offscreen
470 fps (53%)
GFXBench 3.1 - GFXBench Manhattan ES 3.1 Offscreen
592 fps (13%)
GFXBench 3.0 - GFXBench 3.0 Manhattan Offscreen
801 fps (47%)
GFXBench (DX / GLBenchmark) 2.7
GFXBench T-Rex HD Offscreen C24Z16 +
GFXBench (DX / GLBenchmark) 2.7 - GFXBench T-Rex HD Offscreen C24Z16
2143 fps (17%)
Basemark GPU 1.2 - Basemark GPU 1.2 Vulkan Official Medium Offscreen 1080
min: 61.3     avg: 218.4     median: 228 (1%)     max: 884 fps
Basemark GPU 1.2 - Basemark GPU 1.2 Vulkan Official High Offscreen 2160
min: 3.64     avg: 7.2     median: 3.6 (1%)     max: 17.9 fps
Geekbench 6.2 - Geekbench 6.2 GPU OpenCL
min: 60815     avg: 78903     median: 80921 (23%)     max: 86892 points
Geekbench 6.2 - Geekbench 6.2 GPU Vulkan
min: 4454     avg: 47132     median: 34832.5 (11%)     max: 82430 points
LuxMark v2.0 64Bit - LuxMark v2.0 Room GPU
2967 Samples/s (13%)
ComputeMark v2.1 - ComputeMark v2.1 Result
16302 points (18%)
Power Consumption - Furmark Stress Test Power Consumption - external Monitor *
min: 54.3     avg: 125.2     median: 127.8 (18%)     max: 276 Watt
0153045607590105120135150165180195210225240255270285Tooltip
Power Consumption - The Witcher 3 Power Consumption - external Monitor *
min: 61.9     avg: 125.1     median: 134 (19%)     max: 244 Watt
0153045607590105120135150165180195210225240Tooltip
Power Consumption - Witcher 3 Power Consumption *
min: 65.6     avg: 127.7     median: 129.5 (28%)     max: 265 Watt
020406080100120140160180200220240260280300Tooltip
Power Consumption - Witcher 3 ultra Power Efficiency
min: 0.2415     avg: 0.6     median: 0.6 (60%)     max: 0.845 fps per Watt
Power Consumption - Witcher 3 ultra Power Efficiency - external Monitor
min: 0.2623     avg: 0.6     median: 0.6 (51%)     max: 0.874 fps per Watt
Emissions Witcher 3 Fan Noise +
Emissions - Witcher 3 Fan Noise
min: 32.1     avg: 46.2     median: 46 (74%)     max: 55.4 dB(A)
Clock Speed - GPU Clock Witcher 3 ultra
min: 2340     avg: 2451     median: 2415 (95%)     max: 2550 MHz
- Range of benchmark values for this graphics card
- Average benchmark values for this graphics card
* Smaller numbers mean a higher performance

Game Benchmarks

The following benchmarks stem from our benchmarks of review laptops. The performance depends on the used graphics memory, clock rate, processor, system settings, drivers, and operating systems. So the results don't have to be representative for all laptops with this GPU. For detailed information on the benchmark results, click on the fps number.

Dragon's Dogma 2

Dragon's Dogma 2

2024
low 1920x1080
62.2  fps    + Compare + 📈 Graph
high 1920x1080
52.9  fps    + Compare + 📈 Graph
QHD 2560x1440
36  fps    + Compare
4K 3840x2160
18.4  fps    + Compare + 📈 Graph
3840x2160
19.5  fps    + Compare + 📈 Graph
» With all tested laptops playable in detail settings high.
Horizon Forbidden West

Horizon Forbidden West

2024
med. 1920x1080
75.7  fps    + Compare + 📈 Graph
high 1920x1080
51.9  fps    + Compare + 📈 Graph
ultra 1920x1080
45  fps    + Compare + 📈 Graph
QHD 2560x1440
31.6  fps    + Compare + 📈 Graph
4K 3840x2160
18.6  fps    + Compare + 📈 Graph
3840x2160
22.1  fps    + Compare + 📈 Graph
» With all tested laptops playable in detail settings ultra.
Alone in the Dark

Alone in the Dark

2024
low 1920x1080
173  fps    + Compare
med. 1920x1080
157  fps    + Compare
high 1920x1080
137  fps    + Compare
ultra 1920x1080
54  fps    + Compare
QHD 2560x1440
31  fps    + Compare
4K 3840x2160
7  fps    + Compare
3840x2160
20  fps    + Compare
» With all tested laptops playable in detail settings ultra.
Last Epoch

Last Epoch

2024
med. 1920x1080
148.4  fps    + Compare + 📈 Graph
high 1920x1080
122.8  fps    + Compare + 📈 Graph
ultra 1920x1080
90.4  fps    + Compare + 📈 Graph
QHD 2560x1440
48.2  fps    + Compare + 📈 Graph
4K 3840x2160
25.6  fps    + Compare + 📈 Graph
» With all tested laptops playable in detail settings ultra.
Skull & Bones

Skull & Bones

2024
med. 1920x1080
93  fps    + Compare
high 1920x1080
76  fps    + Compare
ultra 1920x1080
57  fps    + Compare
QHD 2560x1440
42  fps    + Compare
4K 3840x2160
21  fps    + Compare
3840x2160
37  fps    + Compare
» With all tested laptops playable in detail settings ultra.
Helldivers 2

Helldivers 2

2024
low 1920x1080
106.5  fps    + Compare + 📈 Graph
med. 1920x1080
82.2  fps    + Compare + 📈 Graph
high 1920x1080
74.4  fps    + Compare + 📈 Graph
ultra 1920x1080
72.1  fps    + Compare + 📈 Graph
QHD 2560x1440
44.5  fps    + Compare + 📈 Graph
4K 3840x2160
17.8  fps    + Compare + 📈 Graph
» With all tested laptops playable in detail settings ultra.
Enshrouded

Enshrouded

2024
med. 1920x1080
45.8 58.6 ~ 52 fps    + Compare + 📈 Graph
high 1920x1080
45.1 47.2 ~ 46 fps    + Compare + 📈 Graph
ultra 1920x1080
37.3 37.7 ~ 38 fps    + Compare + 📈 Graph
QHD 2560x1440
28  fps    + Compare + 📈 Graph
4K 3840x2160
16.2  fps    + Compare + 📈 Graph
3840x2160
26.5  fps    + Compare + 📈 Graph
» With all tested laptops playable in detail settings ultra.
Palworld

Palworld

2024
med. 1920x1080
93.3 99.1 ~ 96 fps    + Compare + 📈 Graph
high 1920x1080
72.5 76.3 ~ 74 fps    + Compare + 📈 Graph
ultra 1920x1080
71.9 74.9 ~ 73 fps    + Compare + 📈 Graph
QHD 2560x1440
50.6  fps    + Compare + 📈 Graph
4K 3840x2160
26  fps    + Compare + 📈 Graph
3840x2160
36.3  fps    + Compare + 📈 Graph
» With all tested laptops playable in detail settings ultra.
Prince of Persia The Lost Crown

Prince of Persia The Lost Crown

2024
med. 1920x1080
352 358 ~ 355 fps    + Compare + 📈 Graph
high 1920x1080
350 357 ~ 354 fps    + Compare + 📈 Graph
ultra 1920x1080
349 353 ~ 351 fps    + Compare + 📈 Graph
QHD 2560x1440
290  fps    + Compare
4K 3840x2160
127.1  fps    + Compare + 📈 Graph
» With all tested laptops playable in detail settings ultra.
Ready or Not

Ready or Not

2023
med. 1920x1080
148.3 198.1 ~ 173 fps    + Compare + 📈 Graph
high 1920x1080
134.2 155.4 ~ 145 fps    + Compare + 📈 Graph
ultra 1920x1080
95.1 107.1 ~ 101 fps    + Compare + 📈 Graph
QHD 2560x1440
56.6  fps    + Compare + 📈 Graph
4K 3840x2160
26  fps    + Compare + 📈 Graph
3840x2160
53.6  fps    + Compare + 📈 Graph
» With all tested laptops playable in detail settings ultra.
The Finals

The Finals

2023
med. 1920x1080
130.2 154.7 ~ 142 fps    + Compare + 📈 Graph
high 1920x1080
113.7 133.5 ~ 124 fps    + Compare + 📈 Graph
ultra 1920x1080
91.8 99.2 ~ 96 fps    + Compare + 📈 Graph
QHD 2560x1440
54.6  fps    + Compare + 📈 Graph
4K 3840x2160
27.3  fps    + Compare + 📈 Graph
3840x2160
40.6  fps    + Compare + 📈 Graph
» With all tested laptops playable in detail settings ultra.
Additional Benchmarks
Epic Preset + Epic RTX Global Illumination 1920x1080
96.8
Avatar Frontiers of Pandora

Avatar Frontiers of Pandora

2023
med. 1920x1080
53 55 ~ 54 fps    + Compare
high 1920x1080
46 47 ~ 47 fps    + Compare
ultra 1920x1080
35 35 ~ 35 fps    + Compare
QHD 2560x1440
23  fps    + Compare
4K 3840x2160
11  fps    + Compare
3840x2160
21  fps    + Compare
» With all tested laptops playable in detail settings high.
Call of Duty Modern Warfare 3 2023

Call of Duty Modern Warfare 3 2023

2023
low 1920x1080
73  fps    + Compare
med. 1920x1080
65 118 ~ 92 fps    + Compare
high 1920x1080
48 85 ~ 67 fps    + Compare
ultra 1920x1080
45 80 ~ 63 fps    + Compare
QHD 2560x1440
29 53 ~ 41 fps    + Compare
4K 3840x2160
32  fps    + Compare
3840x2160
37  fps    + Compare
» With all tested laptops playable in detail settings ultra.
EA Sports WRC

EA Sports WRC

2023
med. 1920x1080
71.2 79 ~ 75 fps    + Compare + 📈 Graph
high 1920x1080
66.6 72.9 ~ 70 fps    + Compare + 📈 Graph
ultra 1920x1080
61 67.3 ~ 64 fps    + Compare + 📈 Graph
QHD 2560x1440
42.9  fps    + Compare + 📈 Graph
4K 3840x2160
22  fps    + Compare + 📈 Graph
3840x2160
38.2  fps    + Compare + 📈 Graph
» With all tested laptops playable in detail settings ultra.
Alan Wake 2

Alan Wake 2

2023
low 1920x1080
58.9  fps    + Compare + 📈 Graph
med. 1920x1080
48  fps    + Compare + 📈 Graph
high 1920x1080
46.7  fps    + Compare + 📈 Graph
QHD 2560x1440
26.4  fps    + Compare + 📈 Graph
4K 3840x2160
13.8  fps    + Compare + 📈 Graph
3840x2160
2.4  fps    + Compare + 📈 Graph
» With all tested laptops playable in detail settings high.
Additional Benchmarks
High Preset + High Ray Tracing 1920x1080
21.6
Lords of the Fallen

Lords of the Fallen

2023
med. 1920x1080
54.1 62.9 ~ 59 fps    + Compare + 📈 Graph
high 1920x1080
38.6 45.9 ~ 42 fps    + Compare + 📈 Graph
ultra 1920x1080
27.3 32.1 ~ 30 fps    + Compare + 📈 Graph
QHD 2560x1440
21.2  fps    + Compare + 📈 Graph
4K 3840x2160
8.9  fps    + Compare + 📈 Graph
3840x2160
20.4  fps    + Compare + 📈 Graph
» With all tested laptops playable in detail settings high.
Total War Pharaoh

Total War Pharaoh

2023
med. 1920x1080
147 212 ~ 180 fps    + Compare
high 1920x1080
84.1 128 ~ 106 fps    + Compare
ultra 1920x1080
59.7 101 ~ 80 fps    + Compare
QHD 2560x1440
66.6  fps    + Compare
4K 3840x2160
32.3  fps    + Compare
» With all tested laptops playable in detail settings ultra.
Assassin's Creed Mirage

Assassin's Creed Mirage

2023
med. 1920x1080
89 107 ~ 98 fps    + Compare
high 1920x1080
84 97 ~ 91 fps    + Compare
ultra 1920x1080
63 70 ~ 67 fps    + Compare
QHD 2560x1440
53  fps    + Compare
4K 3840x2160
28  fps    + Compare
3840x2160
39  fps    + Compare
» With all tested laptops playable in detail settings ultra.
EA Sports FC 24

EA Sports FC 24

2023
med. 1920x1080
163.8  fps    + Compare + 📈 Graph
high 1920x1080
144  fps    + Compare + 📈 Graph
ultra 1920x1080
132.5  fps    + Compare + 📈 Graph
QHD 2560x1440
100.9  fps    + Compare + 📈 Graph
4K 3840x2160
56.8  fps    + Compare + 📈 Graph
» With all tested laptops playable in detail settings ultra.
Counter-Strike 2

Counter-Strike 2

2023
med. 1920x1080
127 204 ~ 166 fps    + Compare + 📈 Graph
high 1920x1080
112.4 142.6 ~ 128 fps    + Compare + 📈 Graph
ultra 1920x1080
80.9 110.2 ~ 96 fps    + Compare + 📈 Graph
QHD 2560x1440
79  fps    + Compare + 📈 Graph
4K 3840x2160
40.6  fps    + Compare + 📈 Graph
» With all tested laptops playable in detail settings ultra.
Cyberpunk 2077 2.0 Phantom Liberty

Cyberpunk 2077 2.0 Phantom Liberty

2023
low 1920x1080
67.2 74.2 79.3 ~ 74 fps    + Compare
med. 1920x1080
50.1 54.3 63.3 88.6 ~ 64 fps    + Compare
high 1920x1080
42.4 45.7 53.5 75 ~ 54 fps    + Compare
ultra 1920x1080
35.8 39.4 46 67.3 ~ 47 fps    + Compare
QHD 2560x1440
20.6 23.3 27.5 40.6 ~ 28 fps    + Compare
4K 3840x2160
17.5  fps    + Compare
3840x2160
8.3  fps    + Compare
» With all tested laptops playable in detail settings ultra.
Additional Benchmarks
Low Preset (FSR off) 1280x720
83.1
Ray Tracing Ultra Preset (DLSS off) 1920x1080
27.2
15.2
Steam Deck 1280x720
83.6
Ultra Preset (FSR on) 1920x1080
56
Lies of P

Lies of P

2023
low 1920x1080
158.7  fps    + Compare + 📈 Graph
med. 1920x1080
132.8 137.1 138.5 ~ 136 fps    + Compare + 📈 Graph
high 1920x1080
113.3 117.7 118.5 ~ 117 fps    + Compare + 📈 Graph
ultra 1920x1080
101.4 104.2 105.7 ~ 104 fps    + Compare + 📈 Graph
QHD 2560x1440
69 69.2 ~ 69 fps    + Compare + 📈 Graph
4K 3840x2160
34.2  fps    + Compare + 📈 Graph
3840x2160
53  fps    + Compare + 📈 Graph
» With all tested laptops playable in detail settings ultra.
Additional Benchmarks
Low Preset 1280x720
211
The Crew Motorfest

The Crew Motorfest

2023
low 1920x1080
60  fps    + Compare
med. 1920x1080
60 60 60 ~ 60 fps    + Compare
high 1920x1080
60 60 60 ~ 60 fps    + Compare
ultra 1920x1080
59 59 59 ~ 59 fps    + Compare
QHD 2560x1440
46 47 ~ 47 fps    + Compare
4K 3840x2160
25  fps    + Compare
» With all tested laptops playable in detail settings ultra.
Additional Benchmarks
Low Preset 1280x720
60
Starfield

Starfield

2023
low 1920x1080
63.8  fps    + Compare + 📈 Graph
med. 1920x1080
53.6 54.5 55.9 ~ 55 fps    + Compare + 📈 Graph
high 1920x1080
41.7 42.5 43.7 ~ 43 fps    + Compare + 📈 Graph
ultra 1920x1080
35.7 36.3 37.3 ~ 36 fps    + Compare + 📈 Graph
QHD 2560x1440
27.8 28.9 ~ 28 fps    + Compare + 📈 Graph
4K 3840x2160
17.4  fps    + Compare + 📈 Graph
» With all tested laptops playable in detail settings ultra.
Additional Benchmarks
Low Preset 1280x720
87.4
low 1920x1080
102.8  fps    + Compare + 📈 Graph
med. 1920x1080
100.4 103.8 105.2 ~ 103 fps    + Compare + 📈 Graph
high 1920x1080
96.7 98.9 99.8 ~ 98 fps    + Compare + 📈 Graph
ultra 1920x1080
79 87.1 87.8 ~ 85 fps    + Compare + 📈 Graph
QHD 2560x1440
61.4 61.8 ~ 62 fps    + Compare + 📈 Graph
4K 3840x2160
29.2  fps    + Compare + 📈 Graph
» With all tested laptops playable in detail settings ultra.
Additional Benchmarks
Low Preset 1280x720
105.8
low 1920x1080
54.9 55.6 ~ 55 fps    + Compare + 📈 Graph
high 1920x1080
47.3 49 ~ 48 fps    + Compare + 📈 Graph
ultra 1920x1080
36.4 42.4 ~ 39 fps    + Compare + 📈 Graph
QHD 2560x1440
24.5 28 ~ 26 fps    + Compare + 📈 Graph
» With all tested laptops playable in detail settings ultra.
Additional Benchmarks
Low 1280x720
87.1
85.4
low 1920x1080
127.9  fps    + Compare + 📈 Graph
med. 1920x1080
104.3 114.3 121.7 ~ 113 fps    + Compare + 📈 Graph
high 1920x1080
97.5 104.1 113 ~ 105 fps    + Compare + 📈 Graph
ultra 1920x1080
81.1 83.3 94.2 ~ 86 fps    + Compare + 📈 Graph
QHD 2560x1440
62.7 62.8 ~ 63 fps    + Compare + 📈 Graph
4K 3840x2160
33.4  fps    + Compare + 📈 Graph
» With all tested laptops playable in detail settings ultra.
Additional Benchmarks
Low Preset 1280x720
175.2
low 1920x1080
73.4 84.9 95.6 ~ 85 fps    + Compare + 📈 Graph
med. 1920x1080
56 71.4 78.5 84.4 85.9 ~ 75 fps    + Compare + 📈 Graph
high 1920x1080
49.8 64 66.8 71.3 71.9 ~ 65 fps    + Compare + 📈 Graph
ultra 1920x1080
48.3 63.1 65.8 69.3 71 ~ 64 fps    + Compare + 📈 Graph
QHD 2560x1440
32.4 42.5 44 49.8 ~ 42 fps    + Compare + 📈 Graph
4K 3840x2160
24  fps    + Compare + 📈 Graph
3840x2160
40.6  fps    + Compare + 📈 Graph
» With all tested laptops playable in detail settings ultra.
Additional Benchmarks
Low Preset 1280x720
148.9
low 1920x1080
80.7  fps    + Compare + 📈 Graph
med. 1920x1080
67.1 67.7 70.6 ~ 68 fps    + Compare + 📈 Graph
high 1920x1080
40.2 48.5 49.4 ~ 46 fps    + Compare + 📈 Graph
ultra 1920x1080
32.9 41.6 45.8 ~ 40 fps    + Compare + 📈 Graph
QHD 2560x1440
31.4 33.6 ~ 33 fps    + Compare + 📈 Graph
4K 3840x2160
15.6  fps    + Compare + 📈 Graph
» With most tested laptops playable in detail settings ultra.
Additional Benchmarks
Very Low Preset 1280x720
96.6
Very High Preset + Very High Raytracing TAA 1920x1080
25.6
29.3
Very High Preset + Very High Raytracing + DLSS Quality + FG 3840x2160
6
F1 23

F1 23

2023
low 1920x1080
102.9 145.5 197 197.9 217 228 231 232 259 262 ~ 207 fps    + Compare
med. 1920x1080
113.5 137 188.7 190 194.8 200 208 210 214 215 222 235 ~ 194 fps    + Compare
high 1920x1080
93.5 93.7 133.2 139.8 140.7 143 150.7 156.2 158.4 158.9 164.5 165 165.2 ~ 143 fps    + Compare
ultra 1920x1080
25.7 27.3 39.5 39.7 40.5 42 44.1 44.5 44.9 45.3 48.2 50.5 51.1 60.8 ~ 43 fps    + Compare
QHD 2560x1440
16.7 16.7 25.6 30 31 34.1 34.8 36.9 38.1 38.5 40.8 ~ 31 fps    + Compare
4K 3840x2160
14  fps    + Compare
3840x2160
21  fps    + Compare
» With most tested laptops playable in detail settings ultra.
Additional Benchmarks
Ultra Low Preset TAA 1280x720
269
271
196.1
279
209
242
224
215
Diablo 4

Diablo 4

2023
low 1920x1080
204  fps    + Compare + 📈 Graph
med. 1920x1080
181.6  fps    + Compare + 📈 Graph
high 1920x1080
160  fps    + Compare + 📈 Graph
ultra 1920x1080
134.2  fps    + Compare + 📈 Graph
QHD 2560x1440
86.6  fps    + Compare + 📈 Graph
4K 3840x2160
43.1  fps    + Compare + 📈 Graph
3840x2160
56.9  fps    + Compare + 📈 Graph
» With all tested laptops playable in detail settings ultra.
low 1920x1080
60.6 63 99.2 ~ 74 fps    + Compare + 📈 Graph
med. 1920x1080
54.6 56 58 85.8 86.3 ~ 68 fps    + Compare + 📈 Graph
high 1920x1080
51.6 53 53.6 56 60 62.9 65.9 ~ 58 fps    + Compare + 📈 Graph
ultra 1920x1080
48.4 49 49.4 50.7 52 53 56 ~ 51 fps    + Compare + 📈 Graph
QHD 2560x1440
30.4 31 32.5 35 ~ 32 fps    + Compare + 📈 Graph
4K 3840x2160
15.8  fps    + Compare + 📈 Graph
» With all tested laptops playable in detail settings ultra.
Additional Benchmarks
Low Preset 1280x720
101.2
92.1
Epic Preset + Ray Tracing 1920x1080
41.3
39.5
42
38.6
Dead Island 2

Dead Island 2

2023
low 1920x1080
196 201 ~ 199 fps    + Compare + 📈 Graph
med. 1920x1080
171.7 171.8 192.8 ~ 179 fps    + Compare + 📈 Graph
high 1920x1080
125.9 133.1 142.3 ~ 134 fps    + Compare + 📈 Graph
ultra 1920x1080
90.9 120.6 133.5 ~ 115 fps    + Compare + 📈 Graph
QHD 2560x1440
61.8 76.5 ~ 69 fps    + Compare + 📈 Graph
4K 3840x2160
40.8  fps    + Compare + 📈 Graph
» With all tested laptops playable in detail settings ultra.
Additional Benchmarks
Low Preset Low TAA 1280x720
201
226
The Last of Us

The Last of Us

2023
low 1920x1080
82.2 93 ~ 88 fps    + Compare + 📈 Graph
med. 1920x1080
53.4 67.4 69.4 74.8 ~ 66 fps    + Compare + 📈 Graph
high 1920x1080
44.6 56.2 56.8 61.6 ~ 55 fps    + Compare + 📈 Graph
ultra 1920x1080
0 (!) 35.7 42.8 50.2 ~ 32 fps    + Compare + 📈 Graph
QHD 2560x1440
23.4 31.9 ~ 28 fps    + Compare + 📈 Graph
4K 3840x2160
6.7  fps    + Compare + 📈 Graph
» With all tested laptops playable in detail settings ultra.
Additional Benchmarks
Low Preset 1280x720
102.9
132.7
low 1920x1080
81  fps    + Compare + 📈 Graph
med. 1920x1080
57.7 88.6 88.9 ~ 78 fps    + Compare + 📈 Graph
high 1920x1080
53.4 80.9 82.6 ~ 72 fps    + Compare + 📈 Graph
ultra 1920x1080
0 (!) 36.8 53.9 ~ 30 fps    + Compare + 📈 Graph
QHD 2560x1440
0 (!) 23.8 ~ 12 fps    + Compare + 📈 Graph
4K 3840x2160
0 (!)  fps    + Compare
» With all tested laptops playable in detail settings ultra.
Additional Benchmarks
Prioritize Performance Preset 1280x720
118.1
low 1920x1080
116.4  fps    + Compare
med. 1920x1080
106.2 127 161 ~ 131 fps    + Compare
high 1920x1080
70.2 79 114 ~ 88 fps    + Compare
ultra 1920x1080
68.7 79.7 113 ~ 87 fps    + Compare
QHD 2560x1440
55.7 82.5 ~ 69 fps    + Compare
4K 3840x2160
45.4  fps    + Compare
» With all tested laptops playable in detail settings ultra.
Additional Benchmarks
Minimum Settings 1280x720
133.3
med. 1920x1080
68.9 78.8 ~ 74 fps    + Compare + 📈 Graph
high 1920x1080
63.5 74.5 75 76 ~ 72 fps    + Compare + 📈 Graph
ultra 1920x1080
61.9 70 73 76 ~ 70 fps    + Compare + 📈 Graph
QHD 2560x1440
42.4 56 ~ 49 fps    + Compare + 📈 Graph
4K 3840x2160
24.5  fps    + Compare + 📈 Graph
» With all tested laptops playable in detail settings ultra.
low 1920x1080
95 169.9 ~ 132 fps    + Compare + 📈 Graph
med. 1920x1080
76.1 124 131.9 ~ 111 fps    + Compare + 📈 Graph
high 1920x1080
47.8 72 76.8 ~ 66 fps    + Compare + 📈 Graph
ultra 1920x1080
37.8 57.1 58.4 ~ 51 fps    + Compare + 📈 Graph
QHD 2560x1440
28.2 43.4 43.5 ~ 38 fps    + Compare + 📈 Graph
4K 3840x2160
24.6  fps    + Compare + 📈 Graph
» With all tested laptops playable in detail settings ultra.
Additional Benchmarks
Low Preset 1280x720
99.9
189.8
Returnal

Returnal

2023
low 1920x1080
59 64 66 ~ 63 fps    + Compare
med. 1920x1080
57 63 66 87 ~ 68 fps    + Compare
high 1920x1080
52 59 63 79 ~ 63 fps    + Compare
ultra 1920x1080
44 52 53 68 ~ 54 fps    + Compare
QHD 2560x1440
34 49 ~ 42 fps    + Compare
4K 3840x2160
26  fps    + Compare
» With all tested laptops playable in detail settings ultra.
Additional Benchmarks
Low Preset 1280x720
64
Epic Preset + Epic Ray-Tracing 1920x1080
33
low 1920x1080
84 92 122 ~ 99 fps    + Compare + 📈 Graph
med. 1920x1080
49.4 64 74 74.2 105.9 109 ~ 79 fps    + Compare + 📈 Graph
high 1920x1080
44.8 53.1 59 59.6 64 67 89 93.6 ~ 66 fps    + Compare + 📈 Graph
ultra 1920x1080
39 49 51.1 51.9 52 53 53 77.3 ~ 53 fps    + Compare + 📈 Graph
QHD 2560x1440
23.9 35 58.4 ~ 39 fps    + Compare + 📈 Graph
4K 3840x2160
22.3  fps    + Compare + 📈 Graph
» With all tested laptops playable in detail settings ultra.
Additional Benchmarks
Low Preset Low TAA 1280x720
122.2
Ultra Preset + Full Ray Tracing High TAA 1920x1080
21.9
25.6
low 1920x1080
47.9 67 ~ 57 fps    + Compare + 📈 Graph
med. 1920x1080
47.7 64 ~ 56 fps    + Compare + 📈 Graph
high 1920x1080
40.2 55 ~ 48 fps    + Compare + 📈 Graph
ultra 1920x1080
39.8 54 ~ 47 fps    + Compare + 📈 Graph
QHD 2560x1440
25.1 35 ~ 30 fps    + Compare + 📈 Graph
4K 3840x2160
17  fps    + Compare
» With all tested laptops playable in detail settings ultra.
Additional Benchmarks
Low Preset TAA 1280x720
67
low 1920x1080
106 113.4 ~ 110 fps    + Compare + 📈 Graph
med. 1920x1080
76 82.5 ~ 79 fps    + Compare + 📈 Graph
high 1920x1080
43 68 ~ 56 fps    + Compare + 📈 Graph
ultra 1920x1080
38.1 59 ~ 49 fps    + Compare + 📈 Graph
QHD 2560x1440
23.8 37 ~ 30 fps    + Compare + 📈 Graph
4K 3840x2160
17  fps    + Compare
» With all tested laptops playable in detail settings ultra.
Additional Benchmarks
Low Preset / Off 1280x720
161.5
RT Ultra Preset / On FXAA 1920x1080
21
16.4
low 1920x1080
104.9  fps    + Compare + 📈 Graph
med. 1920x1080
78.1 138.3 ~ 108 fps    + Compare + 📈 Graph
high 1920x1080
65.3 111.9 ~ 89 fps    + Compare + 📈 Graph
ultra 1920x1080
57.3 87.1 ~ 72 fps    + Compare + 📈 Graph
QHD 2560x1440
35.7 50.8 ~ 43 fps    + Compare + 📈 Graph
4K 3840x2160
22.9  fps    + Compare + 📈 Graph
» With all tested laptops playable in detail settings ultra.
Additional Benchmarks
Low Preset 1280x720
138
low 1920x1080
74 119 137 ~ 110 fps    + Compare
med. 1920x1080
62.5 96 97 ~ 85 fps    + Compare
high 1920x1080
59.3 60 93.3 ~ 71 fps    + Compare
ultra 1920x1080
41.4 59 63.1 ~ 55 fps    + Compare
QHD 2560x1440
29.5 42 46.7 ~ 39 fps    + Compare
4K 3840x2160
21  fps    + Compare
» With all tested laptops playable in detail settings ultra.
Additional Benchmarks
Low Preset (without FSR Upscaling) 1280x720
74.4
145.9
Ultra Preset (without FSR Upscaling) + Full Ray-Tracing 1920x1080
44
31
49.9
low 1920x1080
51.2  fps    + Compare + 📈 Graph
med. 1920x1080
42.8 104.3 ~ 74 fps    + Compare + 📈 Graph
high 1920x1080
37 74.4 ~ 56 fps    + Compare + 📈 Graph
ultra 1920x1080
28.9 66.8 ~ 48 fps    + Compare + 📈 Graph
QHD 2560x1440
26.7 42.2 ~ 34 fps    + Compare + 📈 Graph
4K 3840x2160
18.8  fps    + Compare + 📈 Graph
» With most tested laptops playable in detail settings ultra.
Additional Benchmarks
Low Preset 1280x720
54
low 1920x1080
72.9 112 ~ 92 fps    + Compare + 📈 Graph
med. 1920x1080
67.1 101 ~ 84 fps    + Compare + 📈 Graph
high 1920x1080
56.9 96 ~ 76 fps    + Compare + 📈 Graph
ultra 1920x1080
51.5 85 ~ 68 fps    + Compare + 📈 Graph
QHD 2560x1440
42.5 53 ~ 48 fps    + Compare + 📈 Graph
4K 3840x2160
26  fps    + Compare
» With all tested laptops playable in detail settings ultra.
Additional Benchmarks
Very Low Preset 1280x720
106.2
Very High Preset + Ray-Tracing TAA 1920x0180
44
28.5
low 1920x1080
79 128 ~ 104 fps    + Compare
med. 1920x1080
73 101 109 ~ 94 fps    + Compare
high 1920x1080
56 75 81 ~ 71 fps    + Compare
ultra 1920x1080
54 70 77 ~ 67 fps    + Compare
QHD 2560x1440
36 47 53 ~ 45 fps    + Compare
4K 3840x2160
31  fps    + Compare
3840x2160
50  fps    + Compare
» With all tested laptops playable in detail settings ultra.
Additional Benchmarks
Basic Quality Preset T2X SMAA 1280x720
83
low 1920x1080
75.1 76.6 ~ 76 fps    + Compare + 📈 Graph
med. 1920x1080
71.1 73.2 ~ 72 fps    + Compare + 📈 Graph
high 1920x1080
67.2 67.5 ~ 67 fps    + Compare + 📈 Graph
ultra 1920x1080
62.6 64.2 ~ 63 fps    + Compare + 📈 Graph
QHD 2560x1440
39.1  fps    + Compare + 📈 Graph
» With all tested laptops playable in detail settings ultra.
low 1920x1080
58.6  fps    + Compare + 📈 Graph
med. 1920x1080
49 57.2 ~ 53 fps    + Compare + 📈 Graph
high 1920x1080
42.8 48.8 ~ 46 fps    + Compare + 📈 Graph
ultra 1920x1080
36.3 41.6 ~ 39 fps    + Compare + 📈 Graph
QHD 2560x1440
27.5 29.3 ~ 28 fps    + Compare + 📈 Graph
4K 3840x2160
16.1  fps    + Compare + 📈 Graph
» With all tested laptops playable in detail settings ultra.
Additional Benchmarks
Low Preset 1280x720
64.9
FIFA 23

FIFA 23

2022
QHD 2560x1440
94.3  fps    + Compare + 📈 Graph
low 1920x1080
91  fps    + Compare + 📈 Graph
med. 1920x1080
68.8 108.1 ~ 88 fps    + Compare + 📈 Graph
high 1920x1080
57 87.6 ~ 72 fps    + Compare + 📈 Graph
ultra 1920x1080
44.6 67.4 ~ 56 fps    + Compare + 📈 Graph
QHD 2560x1440
28.5 42.3 ~ 35 fps    + Compare + 📈 Graph
4K 3840x2160
10.6  fps    + Compare + 📈 Graph
» With all tested laptops playable in detail settings ultra.
Additional Benchmarks
Low Preset 1280x720
126
F1 22

F1 22

2022
low 1920x1080
100.9 135.3 156.5 157.9 159.4 169.5 182.4 191.2 192.7 207 210 214 214 215 217 232 233 237 244 ~ 193 fps    + Compare
med. 1920x1080
101.8 127.4 146.6 149 149.6 159.2 184.3 191.4 193.1 194.4 197.2 198.1 199.8 203 207 223 224 234 ~ 182 fps    + Compare
high 1920x1080
94.4 97.5 100.8 116.8 124.6 133.6 147.2 149 150.8 151.3 152.1 152.3 154.4 161.2 163.2 166.8 167.3 172.3 174.7 ~ 144 fps    + Compare
ultra 1920x1080
10.9 33.3 36.2 40.7 42 42.6 44.2 47.5 48.4 48.5 51.3 52.5 52.6 52.9 53.8 54.1 54.7 55 55 55.7 56.4 ~ 47 fps    + Compare
QHD 2560x1440
6.6 23.1 25.1 26.7 26.9 27.1 29.6 29.9 31 31.7 32.3 33.2 33.9 ~ 27 fps    + Compare
4K 3840x2160
15.9  fps    + Compare
» With most tested laptops playable in detail settings ultra.
Additional Benchmarks
Ultra Low Preset 16xAF TAA 1280x720
254
364
225
197
290
232
315
232
288
258
308
281
175.1
med. 1920x1080
219  fps    + Compare + 📈 Graph
high 1920x1080
204  fps    + Compare + 📈 Graph
ultra 1920x1080
183.9  fps    + Compare + 📈 Graph
QHD 2560x1440
116.7  fps    + Compare + 📈 Graph
4K 3840x2160
54.5  fps    + Compare + 📈 Graph
» With all tested laptops playable in detail settings ultra.
med. 1920x1080
138.2  fps    + Compare + 📈 Graph
high 1920x1080
136.9  fps    + Compare + 📈 Graph
ultra 1920x1080
135.1  fps    + Compare + 📈 Graph
QHD 2560x1440
80  fps    + Compare + 📈 Graph
4K 3840x2160
36.1  fps    + Compare + 📈 Graph
» With all tested laptops playable in detail settings ultra.
Additional Benchmarks
Highest Settings + Maximum Ray Tracing 1920x1080
51
low 1920x1080
104.5 135.1 169.2 183.3 ~ 148 fps    + Compare
med. 1920x1080
93.4 113.4 142.8 148.8 ~ 125 fps    + Compare
high 1920x1080
63.3 75.4 91.5 99.5 ~ 82 fps    + Compare
ultra 1920x1080
49.8 59.1 70.2 77.3 ~ 64 fps    + Compare
QHD 2560x1440
33.6 40.4 47.7 ~ 41 fps    + Compare
» With all tested laptops playable in detail settings ultra.
Additional Benchmarks
Lowest Preset (DX12) 1280x720
109.3
low 1920x1080
71 72 85 97.5 98 103 103.3 108 111.2 112.6 117 121.3 ~ 100 fps    + Compare
med. 1920x1080
54.7 56 60 72.8 74.4 77 82 83 85.3 85.5 86.1 105.9 106.4 ~ 79 fps    + Compare
high 1920x1080
48 52 53 60.7 62.2 65.5 67 71 72 72.9 72.9 78.7 82.2 91.3 ~ 68 fps    + Compare
ultra 1920x1080
44.4 49 50 57.4 57.8 61 64.1 65 66 66.1 67.8 70.1 71.8 79.4 ~ 62 fps    + Compare
QHD 2560x1440
27.2 30 31 32 36 37.7 38.5 40.4 41 43.1 ~ 36 fps    + Compare
4K 3840x2160
18  fps    + Compare
» With all tested laptops playable in detail settings ultra.
Additional Benchmarks
Low Preset 1280x720
67.4
121.3
140.1
109.5
111.1
Ray Tracing Ultra Preset (DLSS off) 1920x1080
27
15.8
24
65.6
24.2
Elex 2

Elex 2

2022
low 1920x1080
116.3  fps    + Compare + 📈 Graph
med. 1920x1080
115.7  fps    + Compare + 📈 Graph
high 1920x1080
103.4  fps    + Compare + 📈 Graph
ultra 1920x1080
81.4  fps    + Compare + 📈 Graph
» With all tested laptops playable in detail settings ultra.
Additional Benchmarks
Low / Off 1280x720
118
low 1920x1080
155.8 206.2 ~ 181 fps    + Compare
med. 1920x1080
141.1 171.4 ~ 156 fps    + Compare
high 1920x1080
130.1 140.9 ~ 136 fps    + Compare
ultra 1920x1080
109.8 113.2 ~ 112 fps    + Compare
QHD 2560x1440
91  fps    + Compare
» With all tested laptops playable in detail settings ultra.
Additional Benchmarks
Low Preset 1280x720
210.5
157.6
low 1920x1080
88 122.1 ~ 105 fps    + Compare
med. 1920x1080
74 75.2 ~ 75 fps    + Compare
high 1920x1080
62 62.4 ~ 62 fps    + Compare
QHD 2560x1440
41  fps    + Compare
4K 3840x2160
21  fps    + Compare
» With all tested laptops playable in detail settings high.
Additional Benchmarks
Low Quality 1280x720
146
High Quality Raytracing 1920x1080
27.2
low 1920x1080
139 208 ~ 174 fps    + Compare
med. 1920x1080
115 166 ~ 141 fps    + Compare
high 1920x1080
111 159 ~ 135 fps    + Compare
ultra 1920x1080
89 125 ~ 107 fps    + Compare
QHD 2560x1440
56  fps    + Compare
» With all tested laptops playable in detail settings ultra.
Additional Benchmarks
Ultra Low Preset (with Fixed Resolution Quality) 1280x720
188
308
low 1920x1080
113.7 121 ~ 117 fps    + Compare + 📈 Graph
med. 1920x1080
86.8 93.3 102 ~ 94 fps    + Compare + 📈 Graph
high 1920x1080
71.1 74.7 81 ~ 76 fps    + Compare + 📈 Graph
ultra 1920x1080
50.1 52.8 55 ~ 53 fps    + Compare + 📈 Graph
QHD 2560x1440
42.3 44 ~ 43 fps    + Compare + 📈 Graph
4K 3840x2160
28  fps    + Compare
» With all tested laptops playable in detail settings ultra.
med. 1920x1080
122.8  fps    + Compare + 📈 Graph
high 1920x1080
104.6  fps    + Compare + 📈 Graph
ultra 1920x1080
85.9  fps    + Compare + 📈 Graph
» With all tested laptops playable in detail settings ultra.
Additional Benchmarks
Low Preset 1920x1080
143.6
low 1280x720
119 230 ~ 175 fps    + Compare
med. 1920x1080
68 162 ~ 115 fps    + Compare
high 1920x1080
69 146 ~ 108 fps    + Compare
ultra 1920x1080
42 55 ~ 49 fps    + Compare
QHD 2560x1440
36 47 ~ 42 fps    + Compare
» With all tested laptops playable in detail settings ultra.
Additional Benchmarks
Low Preset 1920x1080
83
186
low 1280x720
138 164 ~ 151 fps    + Compare
med. 1920x1080
72 131 ~ 102 fps    + Compare
high 1920x1080
67 107 ~ 87 fps    + Compare
ultra 1920x1080
63 96 ~ 80 fps    + Compare
QHD 2560x1440
44  fps    + Compare
» With all tested laptops playable in detail settings ultra.
Additional Benchmarks
Low Preset 1920x1080
80
155
low 1280x720
144  fps    + Compare
med. 1920x1080
120  fps    + Compare
high 1920x1080
119  fps    + Compare
ultra 1920x1080
113  fps    + Compare
» With all tested laptops playable in detail settings ultra.
Additional Benchmarks
Low Preset 1920x1080
123
Ultra Preset + Ultra Ray-Tracing 1920x1080
59
low 1280x720
332  fps    + Compare + 📈 Graph
med. 1920x1080
221  fps    + Compare + 📈 Graph
high 1920x1080
166.1  fps    + Compare + 📈 Graph
ultra 1920x1080
155.3  fps    + Compare + 📈 Graph
» With all tested laptops playable in detail settings ultra.
Additional Benchmarks
Low Preset (DX12) 1920x1080
266
Far Cry 6

Far Cry 6

2021
low 1280x720
153.2 166 ~ 160 fps    + Compare + 📈 Graph
med. 1920x1080
125.3 133 ~ 129 fps    + Compare + 📈 Graph
high 1920x1080
107.3 114 ~ 111 fps    + Compare + 📈 Graph
ultra 1920x1080
76.7 82 93.1 ~ 84 fps    + Compare + 📈 Graph
QHD 2560x1440
58  fps    + Compare
» With all tested laptops playable in detail settings ultra.
Additional Benchmarks
Low Graphics Quality 1920x1080
140.9
Ultra Graphics Quality + HD Textures + DXR TAA 1920x1080
48
low 1280x720
161.5  fps    + Compare + 📈 Graph
med. 1920x1080
98.3 137.7 ~ 118 fps    + Compare + 📈 Graph
high 1920x1080
86.7 131.6 ~ 109 fps    + Compare + 📈 Graph
QHD 2560x1440
63.2 97.2 ~ 80 fps    + Compare + 📈 Graph
» With all tested laptops playable in detail settings high.
Additional Benchmarks
Low Preset 1920x1080
116.7
157.3
F1 2021

F1 2021

2021
low 1280x720
132.5 283 309 323 377 ~ 285 fps    + Compare
med. 1920x1080
119.7 191.5 245 260 263 291 292 ~ 237 fps    + Compare
high 1920x1080
111.5 157.7 194.5 203 209 219 222 ~ 188 fps    + Compare
ultra 1920x1080
70.7 87.2 105.4 106.5 109.7 110.3 119.5 ~ 101 fps    + Compare
QHD 2560x1440
56.2 62.1 74 74.3 76.1 ~ 69 fps    + Compare
4K 3840x2160
38  fps    + Compare
» With all tested laptops playable in detail settings ultra.
low 1280x720
150.1  fps    + Compare + 📈 Graph
ultra 1920x1080
135.1  fps    + Compare + 📈 Graph
» With all tested laptops playable in detail settings ultra.
Hitman 3

Hitman 3

2021
low 1280x720
193.9  fps    + Compare
med. 1920x1080
111.4  fps    + Compare
high 1920x1080
101  fps    + Compare
ultra 1920x1080
94.2  fps    + Compare
QHD 2560x1440
60.1  fps    + Compare
» With all tested laptops playable in detail settings ultra.
Additional Benchmarks
Minimum Settings 1920x1080
123.3
low 1280x720
171  fps    + Compare
med. 1920x1080
112  fps    + Compare
high 1920x1080
101  fps    + Compare
ultra 1920x1080
93  fps    + Compare
» With all tested laptops playable in detail settings ultra.
low 1280x720
184  fps    + Compare
med. 1920x1080
117  fps    + Compare
high 1920x1080
92  fps    + Compare
ultra 1920x1080
70  fps    + Compare
» With all tested laptops playable in detail settings ultra.
low 1280x720
121.3 138 ~ 130 fps    + Compare + 📈 Graph
med. 1920x1080
116.3 120 ~ 118 fps    + Compare + 📈 Graph
high 1920x1080
105 107 ~ 106 fps    + Compare + 📈 Graph
ultra 1920x1080
49 54.9 ~ 52 fps    + Compare + 📈 Graph
QHD 2560x1440
32.8 37 ~ 35 fps    + Compare + 📈 Graph
4K 3840x2160
26  fps    + Compare
» With all tested laptops playable in detail settings ultra.
Additional Benchmarks
Ultra Preset + Ultra Ray Tracing (DX12) 1920x1080
18
17.8
low 1280x720
242 291 ~ 267 fps    + Compare + 📈 Graph
med. 1920x1080
121.1 182.7 ~ 152 fps    + Compare + 📈 Graph
high 1920x1080
49.5 75.1 ~ 62 fps    + Compare + 📈 Graph
ultra 1920x1080
41.6 62 ~ 52 fps    + Compare + 📈 Graph
QHD 2560x1440
28.6 42.2 ~ 35 fps    + Compare + 📈 Graph
» With all tested laptops playable in detail settings ultra.
low 1280x720
107.2 115.7 ~ 111 fps    + Compare + 📈 Graph
med. 1920x1080
57.6 85.9 ~ 72 fps    + Compare + 📈 Graph
high 1920x1080
40.5 65.1 ~ 53 fps    + Compare + 📈 Graph
ultra 1920x1080
30.6 47.2 ~ 39 fps    + Compare + 📈 Graph
QHD 2560x1440
22.9 35 ~ 29 fps    + Compare + 📈 Graph
» With most tested laptops playable in detail settings ultra.
Additional Benchmarks
Low-End TAAAA 1920x1080
76.2
114
low 1280x720
170  fps    + Compare
med. 1920x1080
131  fps    + Compare
high 1920x1080
114  fps    + Compare
ultra 1920x1080
98  fps    + Compare
QHD 2560x1440
72  fps    + Compare
4K 3840x2160
39  fps    + Compare
» With all tested laptops playable in detail settings ultra.
low 1280x720
174.8 195.9 ~ 185 fps    + Compare + 📈 Graph
med. 1920x1080
140.5 145.2 ~ 143 fps    + Compare + 📈 Graph
high 1920x1080
132 134.1 ~ 133 fps    + Compare + 📈 Graph
ultra 1920x1080
128.8 129.5 ~ 129 fps    + Compare + 📈 Graph
QHD 2560x1440
88.6  fps    + Compare + 📈 Graph
» With all tested laptops playable in detail settings ultra.
low 1280x720
268.5 341.6 ~ 305 fps    + Compare
med. 1920x1080
141.8 204.1 ~ 173 fps    + Compare
high 1920x1080
95.2 133.9 ~ 115 fps    + Compare
ultra 1920x1080
64.8 96.7 ~ 81 fps    + Compare
QHD 2560x1440
44.8  fps    + Compare
» With all tested laptops playable in detail settings ultra.
low 1280x720
228 391 ~ 310 fps    + Compare + 📈 Graph
med. 1920x1080
135.6 234 ~ 185 fps    + Compare + 📈 Graph
high 1920x1080
124.7 208 ~ 166 fps    + Compare + 📈 Graph
ultra 1920x1080
114.3 160.9 ~ 138 fps    + Compare + 📈 Graph
QHD 2560x1440
82.5 102.4 ~ 92 fps    + Compare + 📈 Graph
» With all tested laptops playable in detail settings ultra.
low 1280x720
171  fps    + Compare
med. 1920x1080
139  fps    + Compare
high 1920x1080
96  fps    + Compare
ultra 1920x1080
73  fps    + Compare
QHD 2560x1440
50  fps    + Compare
4K 3840x2160
26  fps    + Compare
» With all tested laptops playable in detail settings ultra.
Control

Control

2019
med. 1920x1080
100  fps    + Compare
high 1920x1080
74  fps    + Compare
QHD 2560x1440
48  fps    + Compare
4K 3840x2160
24  fps    + Compare
» With all tested laptops playable in detail settings high.
low 1280x720
130  fps    + Compare
med. 1920x1080
83  fps    + Compare
high 1920x1080
69  fps    + Compare
ultra 1920x1080
53  fps    + Compare
QHD 2560x1440
35  fps    + Compare
» With all tested laptops playable in detail settings ultra.
low 1280x720
199  fps    + Compare
med. 1920x1080
109  fps    + Compare
high 1920x1080
82  fps    + Compare
ultra 1920x1080
64  fps    + Compare
QHD 2560x1440
50  fps    + Compare
4K 3840x2160
45  fps    + Compare
» With all tested laptops playable in detail settings ultra.
Additional Benchmarks
Ultra Quality DXR 16xAF 1920x1080
54
low 1280x720
215  fps    + Compare
med. 1920x1080
102 150 ~ 126 fps    + Compare
high 1920x1080
95 134 ~ 115 fps    + Compare
ultra 1920x1080
86 116 ~ 101 fps    + Compare
QHD 2560x1440
60 73 ~ 67 fps    + Compare
4K 3840x2160
33  fps    + Compare
» With all tested laptops playable in detail settings ultra.
Strange Brigade

Strange Brigade

2018
low 1280x720
239 277 299 309 321 321 326 355 355 391 396 402 403 417 429 447 449 467 475 476 481 ~ 383 fps    + Compare
med. 1920x1080
130 150.5 153.5 158 167.9 171.1 187.4 189.5 191.9 194.8 197.1 202 203 204 205 206 207 209 211 211 211 213 214 214 218 221 ~ 194 fps    + Compare
high 1920x1080
105 117 120.1 127 134.9 137.4 142.6 145.3 151.6 155.2 159 159.4 164.7 166.5 167.6 168.3 169.3 171 171.4 171.8 171.8 171.9 173 174.8 174.8 175.4 177 178 ~ 157 fps    + Compare
ultra 1920x1080
21.2 92 100.2 103.9 113 117 121.3 123.1 124.8 125.1 132 135.2 137 139.1 141.7 144 144.1 145.1 146.8 146.9 146.9 147 147.2 147.7 148.7 149.2 149.3 149.4 151.2 152 152.8 153 156.6 ~ 133 fps    + Compare
QHD 2560x1440
11.7 61 72.7 77 78 79.8 81.2 83.5 83.7 94.9 95.5 96.3 97.2 100 100.7 ~ 81 fps    + Compare
4K 3840x2160
53  fps    + Compare
» With most tested laptops playable in detail settings ultra.
Far Cry 5

Far Cry 5

2018
low 1280x720
97 108 131 132 146 147 148 151 155 156 166 170 172 174 197 ~ 150 fps    + Compare + 📈 Graph
med. 1920x1080
73 85 87 89 93 93 111 114 114 122 125 128 131 135 135 136 140 141 146 ~ 116 fps    + Compare + 📈 Graph
high 1920x1080
51 74 80 81 88 95 103 105 107 108 110 118 122 123 126 126 128 131 131 133 135 ~ 108 fps    + Compare + 📈 Graph
ultra 1920x1080
50 71 76 76 80 87 94 99 102 102 104 109 113 116 119 119 119 121 123 124 127 ~ 101 fps    + Compare + 📈 Graph
QHD 2560x1440
47 51 53 56 58 64 68 69 79 83 86 87 88 ~ 68 fps    + Compare + 📈 Graph
4K 3840x2160
43  fps    + Compare
» With all tested laptops playable in detail settings ultra.
Additional Benchmarks
Low Preset TAA 1920x1080
151
98
153
148
127
148
147
149
134
142
low 1280x720
77.8 100.6 103.5 109.8 110.3 113 113.2 114.3 114.4 115.3 121.5 122.4 124.3 128.5 138.1 139.9 141.6 143.6 144.7 146.6 148.5 149.2 152.4 152.9 153 153.1 153.9 157.2 158.8 159.2 159.9 161 165.2 ~ 135 fps    + Compare
med. 1920x1080
76 84 86.2 86.7 88.2 94.5 97 98.4 101.1 101.4 101.6 104.2 105.1 106 121.4 121.8 122.4 122.9 124 124.7 125.1 128.6 130.6 132.7 134.6 134.7 138.8 139.5 139.6 139.8 142.3 144.9 147.6 ~ 117 fps    + Compare
high 1920x1080
65 69.7 70.7 77 77.1 77.8 79 79.3 79.7 79.8 81.3 81.3 81.4 81.5 81.5 97 97.6 97.8 98.2 98.2 98.6 100.2 100.9 103.2 104.4 106.1 106.5 108.4 108.5 110 110.2 110.3 111.4 113.1 117 ~ 93 fps    + Compare
4K 3840x2160
83.2 97.9 108.6 ~ 97 fps    + Compare
» With all tested laptops playable in detail settings high.
low 1280x720
47.8 99.2 105 123.3 130.2 132.7 142.6 166.8 167 178.9 180.2 183 183.5 186.9 187.4 187.5 188 190.5 192.9 212 214 215 ~ 164 fps    + Compare
med. 1920x1080
20 70.8 77.2 77.5 77.8 82.7 85.7 94.5 104.3 105.1 107.2 110.5 112.7 114.1 115.5 116.2 116.2 116.9 118.6 118.6 120.3 120.3 120.7 121.2 122.3 122.4 122.4 122.9 ~ 104 fps    + Compare
high 1920x1080
15.5 52.3 56.2 56.7 56.9 58.5 59.9 65.1 68.6 71.1 75.6 76.5 76.9 79.2 80.3 81 81.5 82 82.4 82.6 82.8 83.5 83.5 83.6 84 84.1 84.6 84.6 84.8 85 85.2 86.1 86.3 122.3 ~ 76 fps    + Compare
QHD 2560x1440
9.9 38 40.7 41 41.5 41.6 47.4 48.6 49.6 53.6 58.2 58.5 58.9 59.7 60 60 60.9 62 62.3 ~ 50 fps    + Compare
4K 3840x2160
22.5 33.3 ~ 28 fps    + Compare
» With most tested laptops playable in detail settings high.
low 1280x720
113.7 119.7 137.4 142 144.4 144.5 147.6 148 151 153.7 159.4 159.7 161.8 162.2 162.7 166.8 169.6 170 171.3 172.1 175 175.1 175.9 177.6 178.8 180 180.9 181.5 182.3 192.6 193.2 196.3 ~ 164 fps    + Compare
med. 1366x768
100.1 112 118.5 124.2 127.2 134.2 134.9 136.5 138.7 139.4 141.1 141.8 143.6 147.6 151.7 152.5 152.7 153.7 156.1 157.1 157.8 158.1 159.7 160.3 162.5 163.4 165.6 166.1 167.9 176.1 178.3 181.6 ~ 149 fps    + Compare
high 1920x1080
79.2 95.2 101.7 116.5 119.6 127 129 130 130.7 132.1 132.6 135.1 136.5 139.8 140.1 141.3 141.4 142.8 146.5 147.9 150.3 150.5 150.5 154.1 155 156.3 156.4 158.9 159 169.1 171.1 175.8 191.8 ~ 141 fps    + Compare
ultra 1920x1080
73.5 88.2 103.6 106.4 107.1 115.8 120.3 121.8 122.5 123.1 123.9 123.9 125.2 126 126.8 127.2 129.1 131.9 135.3 138.6 139.1 140.2 142.5 142.5 143.9 145 146.8 147 148 148.8 160.7 161.7 162.2 175.6 ~ 132 fps    + Compare
4K 3840x2160
69.7 101.2 106.6 115.2 ~ 98 fps    + Compare
» With all tested laptops playable in detail settings ultra.
low 1024x768
230 268.5 286.5 299 307.8 309 356 365 369 382.6 390 393.7 395 405.1 410.2 465 ~ 352 fps    + Compare + 📈 Graph
med. 1366x768
157 168.5 184.1 209.6 219 251.2 253.3 258 262.4 265.3 271.1 278.6 282 283 286 286 293 319 ~ 252 fps    + Compare + 📈 Graph
high 1920x1080
87 96 98 107.1 120.1 121 121.7 123 138.7 149.7 150.9 154.4 155 156.2 160.2 160.9 161 164 164.7 165 166 167.6 170 171 175 177 ~ 145 fps    + Compare + 📈 Graph
ultra 1920x1080
18.5 52.4 54.5 59.5 60.1 61 62.7 64 66 67.7 71 71.9 73 74.7 76.6 76.7 78 78 80 80.1 80.5 81 81 82.2 83 83.4 83.8 83.9 84 84.5 84.9 85 85.6 86 88 89 89 94.7 ~ 75 fps    + Compare + 📈 Graph
QHD 2560x1440
39 46 56.1 59.2 60.3 61.3 ~ 54 fps    + Compare + 📈 Graph
4K 3840x2160
44.7 50 ~ 47 fps    + Compare + 📈 Graph
» With most tested laptops playable in detail settings ultra.
Additional Benchmarks
Ultra Graphics & Postprocessing (HBAO+) 3840x2160
30
Medium Graphics & Postprocessing 1920x1080
193
134.4
180.5
187.6
165.7
190
GTA V

GTA V

2015
low 1024x768
163.6 171.3 182.1 182.2 183.4 183.5 183.7 184.8 184.8 185.6 185.9 186.6 186.7 ~ 182 fps    + Compare
med. 1366x768
119.9 156 161.4 161.7 162.2 166.5 168.6 172.4 176.4 176.6 177.3 178 179.1 179.7 180 180.1 180.2 180.6 180.9 184.2 185.1 ~ 172 fps    + Compare
high 1920x1080
106 132.9 133.2 135.3 142.4 142.8 143.6 153.1 158.2 160.7 161.5 161.6 162.4 163.2 167.8 168.6 168.9 169.1 171.1 172.4 172.7 174.6 175.8 176.3 177.3 ~ 158 fps    + Compare
ultra 1920x1080
14.9 53.5 55.9 60.6 62.7 65.3 67.6 72.7 74.3 76.7 78.4 78.7 81.9 83.5 86.9 88.8 89 89.1 90.7 92.2 92.4 93.2 93.7 94.2 94.5 96.5 96.6 96.8 97.7 101.7 ~ 81 fps    + Compare
QHD 2560x1440
8.2 44.3 46.5 48.1 50.5 55.7 57.3 57.7 58.3 63 64.1 65.1 66 66 67.5 ~ 55 fps    + Compare
4K 3840x2160
63.5  fps    + Compare
» With most tested laptops playable in detail settings ultra.
Additional Benchmarks
Highest Settings possible 16xAF 4xMSAA + FXAA 3840x2160
26.9
Normal/Off 4xAF 1920x1080
179.7
181.2
185.2
164.8
161.4
180.6
174.2
154.9
177.2
177.9
179.2
178.7
179.1
174.3
170.2
158.4
Lowest Settings possible 1920x1080
186.3
183.3
182.9
185.9
178.1
166.6
184.7
177.3
163.1
182.9
181.3
180.3
184.3
162.7
lowmed.highultraQHD4K
Dragon's Dogma 262.252.93618.4
Horizon Forbidden West75.751.94531.618.6
Alone in the Dark17315713754317
Last Epoch148.4122.890.448.225.6
Skull & Bones9376574221
Helldivers 2106.582.274.472.144.517.8
Enshrouded5246382816.2
Palworld96747350.626
Prince of Persia The Lost Crown355354351290127.1
Ready or Not17314510156.626
The Finals1421249654.627.3
Avatar Frontiers of Pandora5447352311
Call of Duty Modern Warfare 3 2023739267634132
EA Sports WRC75706442.922
Alan Wake 258.94846.726.413.8
Lords of the Fallen59423021.28.9
Total War Pharaoh1801068066.632.3
Assassin's Creed Mirage9891675328
EA Sports FC 24163.8144132.5100.956.8
Counter-Strike 2166128967940.6
Cyberpunk 2077 2.0 Phantom Liberty746454472817.5
Lies of P158.71361171046934.2
The Crew Motorfest606060594725
Starfield63.85543362817.4
Armored Core 6102.810398856229.2
Immortals of Aveum55483926
Atlas Fallen127.9113105866333.4
Baldur's Gate 3857565644224
Ratchet & Clank Rift Apart80.76846403315.6
F1 23207194143433114
Diablo 4204181.6160134.286.643.1
Star Wars Jedi Survivor746858513215.8
Dead Island 21991791341156940.8
The Last of Us88665532286.65
Resident Evil 4 Remake8178723012
Company of Heroes 3116.413188876945.4
Sons of the Forest7472704924.5
Atomic Heart13211166513824.6
Returnal636863544226
Hogwarts Legacy997966533922.3
Dead Space Remake575648473017
The Witcher 3 v4.001107956493017
High On Life104.910889724322.9
The Callisto Protocol1108571553921
Need for Speed Unbound51.27456483418.8
Spider-Man Miles Morales928476684826
Call of Duty Modern Warfare 2 20221049471674531
Uncharted Legacy of Thieves Collection7672676339.1
A Plague Tale Requiem58.65346392816.1
FIFA 2394.3
The Quarry918872563510.6
F1 22193182144472715.9
Vampire Bloodhunt219204183.9116.754.5
Ghostwire Tokyo138.2136.9135.18036.1
Tiny Tina's Wonderlands148125826441
Cyberpunk 2077 1.61007968623618
Elex 2116.3115.7103.481.4
GRID Legends18115613611291
Dying Light 210575624121
Rainbow Six Extraction17414113510756
God of War1179476534328
Halo Infinite122.8104.685.9
Forza Horizon 51751151084942
Riders Republic151102878044
Guardians of the Galaxy144120119113
Back 4 Blood332221166.1155.3
Far Cry 61601291118458
Alan Wake Remastered161.511810980
F1 20212852371881016938
Mass Effect Legendary Edition150.1135.1
Hitman 3193.9111.410194.260.1
Immortals Fenyx Rising17111210193
Assassin´s Creed Valhalla1841179270
Watch Dogs Legion130118106523526
Crysis Remastered267152625235
Flight Simulator 202011172533929
Horizon Zero Dawn170131114987239
Death Stranding18514313312988.6
Gears Tactics3051731158144.8
Doom Eternal31018516613892
Borderlands 317113996735026
Control100744824
The Division 213083695335
Metro Exodus19910982645045
Shadow of the Tomb Raider2151261151016733
Strange Brigade3831941571338153
Far Cry 51501161081016843
X-Plane 11.111351179397
Final Fantasy XV Benchmark164104765028
Dota 2 Reborn16414914113298
The Witcher 3352252145755447
GTA V182172158815563.5
< 30 fps
< 60 fps
< 120 fps
≥ 120 fps

5
27
39

7
46
35

17
50
23

31
42
11
12
48
22
1
44
19
3
1

For more games that might be playable and a list of all games and graphics cards visit our Gaming List

v1.26
log 25. 15:15:49

#0 no ids found in url (should be separated by "_") +0s ... 0s

#1 not redirecting to Ajax server +0s ... 0s

#2 did not recreate cache, as it is less than 5 days old! Created at Thu, 25 Apr 2024 05:40:10 +0200 +0.001s ... 0.001s

#3 no comparison url found in template nbc.compare_page_1 needed +0.063s ... 0.064s

#4 no comparison url found in template nbc.compare_page_1 needed +0s ... 0.064s

#5 no comparison url found in template nbc.compare_page_1 needed +0s ... 0.064s

#6 no comparison url found in template nbc.compare_page_1 needed +0s ... 0.065s

#7 composed specs +0.001s ... 0.066s

#8 did output specs +0s ... 0.066s

#9 start showIntegratedCPUs +0s ... 0.066s

#10 getting avg benchmarks for device 11457 +0.029s ... 0.095s

#11 got single benchmarks 11457 +0.163s ... 0.259s

#12 got avg benchmarks for devices +0s ... 0.259s

#13 min, max, avg, median took s +1.254s ... 1.512s

#14 before gaming benchmark output +0.001s ... 1.513s

#15 Got 1815 rows for game benchmarks. +0.582s ... 2.096s

#16 composed SQL query for gamebenchmarks +0s ... 2.096s

#17 got data and put it in $dataArray +0.074s ... 2.17s

#18 benchmarks composed for output. +4.999s ... 7.169s

#19 no comparison url found in template nbc.compare_page_1 needed +0.012s ... 7.181s

#20 return log +0s ... 7.181s

Notebook reviews with NVIDIA GeForce RTX 4050 Laptop GPU graphics card

戴尔 XPS 14 2024 评测--配备全球最慢 RTX 4050 的多媒体笔记本电脑

戴尔 XPS 14 2024 评测--配备全球最慢 RTX 4050 的多媒体笔记本电脑

戴尔推出了 XPS 14,这是一款全新的多媒体笔记本电脑,我们测试了其配备 OLED 面板和GeForce RTX 4050 笔记本电脑的高端版本。该设备售价近 3000 美元,价格不菲,尤其是在性能方面,您不应该抱太高的期望。...
Intel Core Ultra 7 155H | NVIDIA GeForce RTX 4050 Laptop GPU | 14.50" | 1.8 kg
三星Galaxy Book4 Ultra 评测--配备 120 Hz OLED 和 RTX 4050 的多媒体笔记本电脑

三星Galaxy Book4 Ultra 评测--配备 120 Hz OLED 和 RTX 4050 的多媒体笔记本电脑

16 英寸Galaxy Book4 Ultra 多媒体笔记本电脑是三星对Apple MacBook Pro 16 的回应。除了 120 Hz 高分辨率 AMOLED 面板外,它还配备了当前的酷睿 Ultra 处理器以及GeForce RTX 4050 笔记本电脑。不过,Ultra 的价格并不便宜。...
Intel Core Ultra 7 155H | NVIDIA GeForce RTX 4050 Laptop GPU | 16.00" | 1.8 kg
惠普 Spectre x360 16 可折叠电脑评测:现在配备 55 WGeForce RTX 4050 显卡

惠普 Spectre x360 16 可折叠电脑评测:现在配备 55 WGeForce RTX 4050 显卡

GeForce RTX 4050 GPU 比集成的 Arc 8 配置更胜一筹。然而,CPU 节流错误阻碍了 dGPU 配置的进一步提升。
Intel Core Ultra 7 155H | NVIDIA GeForce RTX 4050 Laptop GPU | 16.00" | 2 kg
惠普 Victus 15 游戏笔记本电脑评测:Raptor Lake 和 Ada Lovelace

惠普 Victus 15 游戏笔记本电脑评测:Raptor Lake 和 Ada Lovelace

任何正在寻找 1000 美元价位游戏笔记本电脑的人可能都已经接触过惠普的 Victus 系列。我们测试了最新的 15 英寸机型,并与竞争对手进行了比较。...
Intel Core i5-13500H | NVIDIA GeForce RTX 4050 Laptop GPU | 15.60" | 2.3 kg
戴尔 G15 5530 评测:暗影灰色 RTX 4050 游戏笔记本电脑

戴尔 G15 5530 评测:暗影灰色 RTX 4050 游戏笔记本电脑

对于 G15 5530,戴尔一反设备轻薄化的趋势,为这款 15 英寸笔记本电脑配备了相当笨重的机身。我们将 G15 与其他 RTX 4050 游戏笔记本电脑进行了比较,看看这款价值 1,000 欧元(1,090 美元)的机型是否物有所值。...
Intel Core i5-13450HX | NVIDIA GeForce RTX 4050 Laptop GPU | 15.60" | 2.7 kg

Acer Nitro V 15 ANV15-51-582S: Intel Core i5-13420H, 15.60", 2.1 kg
  Review » 宏碁 Nitro V 15 ANV15-51 评测:配备 RTX 4050 的经济型游戏笔记本电脑

Medion Erazer Crawler E40 - MD 62518: Intel Core i5-13500H, 15.60", 2.3 kg
  Review » Medion Erazer Crawler E40 笔记本电脑评测:经济实惠的游戏玩家,RTX 4050 性能卓越

Asus VivoBook Pro 16 K6602VU: Intel Core i9-13900H, 16.00", 1.9 kg
  Review » 华硕 VivoBook Pro 16 (2023) 笔记本电脑评测:酷睿 i9-13900H、RTX 4050 和 3.2K OLED 是业余创作者的好兆头

Acer Predator Helios Neo 16 NH.QLTEG.002: Intel Core i5-13500HX, 16.00", 2.6 kg
  Review » 掠夺者 Helios Neo 16 笔记本电脑评测:宏碁创造了游戏奇美拉

Lenovo LOQ 15IRH8 Core i7: Intel Core i7-13620H, 15.60", 2.4 kg
  Review » 联想LOQ 15酷睿i7评测:经济实惠的Legion 替代品,带来英特尔与 AMD 的难题

SCHENKER XMG Apex 15 (Late 23): AMD Ryzen 7 7840HS, 15.60", 2.2 kg
  Review » XMG Apex 15(23 晚)评测:配备 RTX 4050、运行时间出色的游戏笔记本电脑

HP Victus 16-r0076TX: Intel Core i5-13500HX, 16.10", 2.3 kg
  Review » 惠普 Victus 16 笔记本电脑评测:1080p 游戏利器,妥协不多

Acer Nitro 16 AN16-41-R7YE: AMD Ryzen 5 7535HS, 16.00", 2.6 kg
  Review » 宏碁 Nitro 16 AN16-41 评测:经济实惠的游戏笔记本电脑,配备 RTX 4050,运行时间长

Lenovo Slim Pro 9i 16IRP8: Intel Core i9-13905H, 16.00", 2.2 kg
  Review » 联想 Slim Pro 9i 16IRP8 笔记本电脑评测:Apple MacBook Pro 16 的替代品

Lenovo Legion Pro 5 16ARX8 (R5 7645HX, RTX 4050): AMD Ryzen 5 7645HX, 16.00", 2.5 kg
  Review » 联想Legion Pro 5 16ARX8 评测:配备 RTX 4050 的游戏笔记本电脑,外形出色

Lenovo LOQ 15APH8: AMD Ryzen 7 7840HS, 15.60", 2.5 kg
  Review » 联想 LOQ 15 Ryzen 7 7840HS 笔记本电脑评测:不要称它为Legion

Acer Predator Triton 14 PT14-51: Intel Core i7-13700H, 14.00", 1.7 kg
  Review » Acer Predator Triton 14 评论:配备明亮显示屏和 RTX 4050 的 14 英寸游戏笔记本电脑

Lenovo Yoga Pro 9-14IRP G8: Intel Core i7-13705H, 14.50", 1.7 kg
  Review » Yoga Pro 9i 14 评测:配备 AdobeRGB Mini-LED 面板的联想最佳多媒体笔记本电脑

SCHENKER XMG Focus 15 (E23): Intel Core i9-13900HX, 15.60", 2.4 kg
  Review » 申克 XMG Focus 15 (E23) 经济型游戏笔记本电脑评测:比Pro 15性能更强,价格更低

MSI Stealth 14 Studio A13V: Intel Core i7-13700H, 14.00", 1.7 kg
  Review » 微星Stealth 14 Studio评测--昂贵的游戏笔记本,却做了太多妥协

Acer Swift X SFX14-71G: Intel Core i7-13700H, 14.50", 1.5 kg
  Review » 宏碁Swift X 14 2023 OLED评测--配备RTX 4050的多媒体笔记本电脑仅在纸面上令人印象深刻

Acer Nitro 5 AN517-55-5552: Intel Core i5-12500H, 17.30", 3 kg
  Review » Acer Nitro 5 AN517回顾:一个拥有安静的RTX4050的游戏笔记本

Asus TUF A15 FA507: AMD Ryzen 7 7735HS, 15.60", 2.2 kg
  Review » 华硕TUF游戏A15笔记本评测--拥有RTX4050和144Hz屏幕的预算玩家

Medion Erazer Scout E20: Intel Core i7-13700H, 17.30", 2.8 kg
  Review » Medion Erazer Scout E20回顾:经济实惠的FHD游戏笔记本,配备RTX 4050

Lenovo Yoga Pro 7 14IRH G8: Intel Core i7-13700H, 14.50", 1.5 kg
  Review » 联想Yoga Pro 7 14 G8笔记本回顾: GeForce RTX 4050笔记本为3K显示屏提供120赫兹的动力

Gigabyte Aero 14 OLED BMF: Intel Core i7-13700H, 14.00", 1.4 kg
  Review » Gigabyte Aero 14 OLED BMF笔记本电脑评测:带有真彩色显示屏的紧凑型工作室笔记本

Samsung Galaxy Book3 Ultra 16: Intel Core i7-13700H, 16.00", 1.8 kg
  Review » 三星Galaxy Book3 Ultra 16评论:耐用的16英寸超极本与RTX 4050

MSI Katana 15 B12VEK: Intel Core i7-12650H, 15.60", 2.3 kg
  Review » 微星Katana 15笔记本电脑回顾:拥有RTX 4050和Alder Lake CPU的预算游戏机

Asus TUF Gaming A16 FA607J: Intel Core i7-13650HX, 16.00", 2.3 kg
  External Review » Asus TUF Gaming A16 FA607J

MSI Katana 15 AI B8VE: AMD Ryzen 7 8845HS, 15.60", 2.3 kg
  External Review » MSI Katana 15 AI B8VE

Lenovo LOQ 15IRX9, i5-13450HX: Intel Core i5-13450HX, 15.60", 2.4 kg
  External Review » Lenovo LOQ 15IRX9, i5-13450HX

HP Spectre x360 16 RTX 4050: Intel Core Ultra 7 155H, 16.00", 2 kg
  External Review » HP Spectre x360 16 RTX 4050

Acer Predator Triton 14 PT14-51: Intel Core i7-13700H, 14.00", 1.7 kg
  External Review » Acer Predator Triton 14 PT14-51

HP Victus 15-fa1000na: Intel Core i5-12500H, 15.60", 2.3 kg
  External Review » HP Victus 15-fa1000na

Samsung Galaxy Book4 Ultra: Intel Core Ultra 7 155H, 16.00", 1.8 kg
  External Review » Samsung Galaxy Book4 Ultra

HP Omen Transcend 14-fb0000: Intel Core Ultra 7 155H, 14.00", 1.6 kg
  External Review » HP Omen Transcend 14-fb0000

Acer Nitro 5 AN515-58, i7-12650H RTX 4050: Intel Core i7-12650H, 15.60", 2.5 kg
  External Review » Acer Nitro 5 AN515-58, i7-12650H RTX 4050

Dell XPS 14 2024 OLED: Intel Core Ultra 7 155H, 14.50", 1.8 kg
  External Review » Dell XPS 14 2024 OLED

Acer Swift X SFX16-61G-R0SU: AMD Ryzen 7 7840HS, 16.00", 2 kg
  External Review » Acer Swift X SFX16-61G-R0SU

Acer Nitro 17 AN17-51: Intel Core i5-13500H, 17.30", 3 kg
  External Review » Acer Nitro 17 AN17-51

Acer Nitro V 15 ANV15-51, i7-13620H: Intel Core i7-13620H, 15.60", 2.1 kg
  External Review » Acer Nitro V 15 ANV15-51, i7-13620H

HP Omen 16-wd0000: Intel Core i5-13420H, 16.10", 2.4 kg
  External Review » HP Omen 16-wd0000

Asus ROG Zephyrus G14 GA402NU: AMD Ryzen 7 7735HS, 14.00", 1.7 kg
  External Review » Asus ROG Zephyrus G14 GA402NU

Acer Nitro V 15 ANV15-51: Intel Core i5-13420H, 15.60", 2.1 kg
  External Review » Acer Nitro V 15 ANV15-51

Asus VivoBook Pro 16 OLED K6602V: Intel Core i9-13900H, 16.00", 1.9 kg
  External Review » Asus VivoBook Pro 16 OLED K6602V

HP Victus 16-s0152ng: AMD Ryzen 5 7640HS, 16.10", 2.3 kg
  External Review » HP Victus 16-s0152ng

Acer Nitro 5 AN517-55: Intel Core i5-12500H, 17.30", 3 kg
  External Review » Acer Nitro 5 AN517-55

Asus ROG Strix G16 G614JU, i7-13650HX: Intel Core i7-13650HX, 16.00", 2.5 kg
  External Review » Asus ROG Strix G16 G614JU, i7-13650HX

HP Victus 16-s0000ng: AMD Ryzen 7 7840HS, 16.10", 2.3 kg
  External Review » HP Victus 16-s0000ng

Lenovo Yoga Pro 9-14IRP G8: Intel Core i7-13705H, 14.50", 1.7 kg
  External Review » Lenovo Yoga Pro 9-14IRP G8

Lenovo Slim Pro 9 14IRP8: Intel Core i7-13705H, 14.50", 1.7 kg
  External Review » Lenovo Slim Pro 9 14IRP8

HP Victus 15-fa1000ng: Intel Core i5-13420H, 15.60", 2.3 kg
  External Review » HP Victus 15-fa1000ng

Acer Swift X SFX16-61G: AMD Ryzen 9 7940HS, 16.00", 2 kg
  External Review » Acer Swift X SFX16-61G

MSI Cyborg 15 A12VE, i5-12450H: Intel Core i5-12450H, 15.60", 2 kg
  External Review » MSI Cyborg 15 A12VE, i5-12450H

Acer Nitro 16 AN16-51: Intel Core i7-13700H, 16.00", 2.7 kg
  External Review » Acer Nitro 16 AN16-51

Lenovo Legion Slim 5 16IRH8, i7-13700H RTX 4050: Intel Core i7-13700H, 16.00", 2.4 kg
  External Review » Lenovo Legion Slim 5 16IRH8, i7-13700H RTX 4050

Asus Vivobook 16X K3605ZU: Intel Core i7-12650H, 16.00", 1.8 kg
  External Review » Asus Vivobook 16X K3605ZU

Lenovo LOQ 15APH8: AMD Ryzen 7 7840HS, 15.60", 2.5 kg
  External Review » Lenovo LOQ 15APH8

Lenovo Slim Pro 9i 16IRP8: Intel Core i9-13905H, 16.00", 2.2 kg
  External Review » Lenovo Slim Pro 9i 16IRP8

Lenovo LOQ 15IRH8 Core i7: Intel Core i7-13620H, 15.60", 2.4 kg
  External Review » Lenovo LOQ 15IRH8, i7-13620H RTX 4050

HP Victus 16-r0000ng: Intel Core i7-13700H, 16.10", 2.3 kg
  External Review » HP Victus 16-r0000ng

Acer Nitro 16 AN16-41, R5 7640HS RTX 4050: AMD Ryzen 5 7640HS, 16.00", 2.7 kg
  External Review » Acer Nitro 16 AN16-41, R5 7640HS RTX 4050

MSI Cyborg 15 A13VE: Intel Core i7-13620H, 15.60", 2 kg
  External Review » MSI Cyborg 15 A13VE

Lenovo LOQ 16IRH8, i7-13620H RTX 4050: Intel Core i7-13620H, 16.00", 2.6 kg
  External Review » Lenovo LOQ 16IRH8, i7-13620H RTX 4050

Dell XPS 15 9530 RTX 4050: Intel Core i7-13700H, 15.60", 1.9 kg
  External Review » Dell XPS 15 9530 RTX 4050

Dell G15 5530, i5-13450HX RTX 4050: Intel Core i5-13450HX, 15.60", 2.7 kg
  External Review » Dell G15 5530, i5-13450HX RTX 4050

Acer Nitro 17 AN17-41-R6L9: AMD Ryzen 7 7840HS, 17.30", 3 kg
  External Review » Acer Nitro 17 AN17-41-R6L9

Lenovo LOQ 15IRH8, i5-13420H: Intel Core i5-13420H, 15.60", 2.4 kg
  External Review » Lenovo LOQ 15IRH8, i5-13420H

Acer Nitro 5 AN515-58, i5-12500H RTX 4050: Intel Core i5-12500H, 15.60", 2.5 kg
  External Review » Acer Nitro 5 AN515-58, i5-12500H RTX 4050

Dell G15 5530, RTX 4050: Intel Core i7-13650HX, 15.60", 2.8 kg
  External Review » Dell G15 5530, RTX 4050

HP Victus 16-r0076TX: Intel Core i5-13500HX, 16.10", 2.3 kg
  External Review » HP Victus 16-r0076TX

Asus ROG Flow Z13 GZ301VU: Intel Core i9-13900H, 13.40", 1.2 kg
  External Review » Asus ROG Flow Z13 GZ301VU

Asus VivoBook Pro 15 OLED K6502VU: Intel Core i9-13900H, 15.60", 1.8 kg
  External Review » Asus VivoBook Pro 15 OLED K6502VU

Gigabyte G5 MF: Intel Core i5-12500H, 15.60", 1.9 kg
  External Review » Gigabyte G5 MF

MSI Bravo 15 C7V: AMD Ryzen 7 7735HS, 15.60", 2.3 kg
  External Review » MSI Bravo 15 C7V

Asus ZenBook Pro 14 Duo UX8402VU: Intel Core i9-13900H, 14.50", 1.8 kg
  External Review » Asus ZenBook Pro 14 Duo UX8402VU

Asus TUF Gaming F15 FX507VU: Intel Core i7-13700H, 15.60", 2.2 kg
  External Review » Asus TUF Gaming F15 FX507VU

Medion Erazer Crawler E40: Intel Core i5-13500H, 15.60", 2.3 kg
  External Review » Medion Erazer Crawler E40

Asus TUF Gaming A15 FA507NU: AMD Ryzen 7 7735HS, 15.60", 2.2 kg
  External Review » Asus TUF Gaming A15 FA507NU

MSI Stealth 14 Studio A13VE: Intel Core i7-13700H, 14.00", 1.7 kg
  External Review » MSI Stealth 14 Studio A13VE

Lenovo Legion Pro 5 16IRX8, i5-13500HX RTX 4050: Intel Core i5-13500HX, 16.00", 2.6 kg
  External Review » Lenovo Legion Pro 5 16IRX8, i5-13500HX RTX 4050

Acer Swift X SFX14-71G: Intel Core i7-13700H, 14.50", 1.5 kg
  External Review » Acer Swift X SFX14-71G

Acer Nitro 16 AN16-41, R5 7535HS RTX 4050: AMD Ryzen 5 7535HS, 16.00", 2.7 kg
  External Review » Acer Nitro 16 AN16-41, R5 7535HS RTX 4050

Lenovo Yoga Pro 7 14IRH G8: Intel Core i7-13700H, 14.50", 1.5 kg
  External Review » Lenovo Yoga Pro 7 14IRH G8

MSI Cyborg 15 A12VE, i7-12650H: Intel Core i7-12650H, 15.60", 2 kg
  External Review » MSI Cyborg 15 A12VE, i7-12650H

Lenovo Ideapad Gaming 3 15ARH7, R5 7535HS RTX 4050: AMD Ryzen 5 7535HS, 15.60", 2.3 kg
  External Review » Lenovo Ideapad Gaming 3 15ARH7, R5 7535HS RTX 4050

MSI Cyborg 15 A12VE: Intel Core i7-12650H, 15.60", 2 kg
  External Review » MSI Cyborg 15 A12VE

Lenovo Yoga Pro 9i 16 2023: Intel Core i7-13705H, 16.00", 2.2 kg
  External Review » Lenovo Yoga Pro 9i 16 2023

Acer Predator Helios Neo 16 PHN16-71: Intel Core i5-13500HX, 16.00", 2.6 kg
  External Review » Acer Predator Helios Neo 16 PHN16-71

Asus ROG Strix G16 G614JU: Intel Core i5-13450HX, 16.00", 2.5 kg
  External Review » Asus ROG Strix G16 G614JU

MSI Prestige 16 Studio A13VE: Intel Core i7-13700H, 16.00", 2.1 kg
  External Review » MSI Prestige 16 Studio A13VE

SCHENKER XMG Focus 15 (E23): Intel Core i9-13900HX, 15.60", 2.4 kg
  External Review » Schenker XMG Focus 15 (E23)

Asus TUF Gaming F15 FX507ZU: Intel Core i7-12700H, 15.60", 2.2 kg
  External Review » Asus TUF Gaming F15 FX507ZU

MSI Katana 15 B13VEK: Intel Core i7-13620H, 15.60", 2.3 kg
  External Review » MSI Katana 15 B13VEK

MSI GF63 Thin 12VE-066US: Intel Core i7-12650H, 15.60", 1.9 kg
  External Review » MSI GF63 Thin 12VE-066US

Asus TUF Gaming A17 FA707NU-HX032W: AMD Ryzen 7 7735HS, 17.30", 2.6 kg
  External Review » Asus TUF Gaming A17 FA707NU-HX032W

Alienware x14 R2 2023: Intel Core i7-13620H, 14.00", 1.9 kg
  External Review » Alienware x14 R2 2023

MSI GF63 Thin 12VE: Intel Core i5-12450H, 15.60", 1.9 kg
  External Review » MSI GF63 Thin 12VE

Lenovo LOQ 15IRH8: Intel Core i7-13700H, 15.60", 2.4 kg
  External Review » Lenovo LOQ 15IRH8

MSI Katana 15 B12VEK: Intel Core i7-12650H, 15.60", 2.3 kg
  External Review » MSI Katana 15 B12VEK

Gigabyte Aero 14 OLED BMF: Intel Core i7-13700H, 14.00", 1.4 kg
  External Review » Gigabyte Aero 14 OLED BMF

Samsung Galaxy Book3 Ultra 16: Intel Core i7-13700H, 16.00", 1.8 kg
  External Review » Samsung Galaxy Book3 Ultra 16

Please share our article, every link counts!

» Comparison of GPUs
Detailed list of all laptop GPUs sorted by class and performance.

» Benchmark List
Sort and restrict laptop GPUs based on performance in synthetic benchmarks.

» Notebook Gaming List
Playable games for each graphics card and their average FPS results.

Class 1

GeForce RTX 2080 Super Mobile

Class 2

M1 Max 32-Core GPU *
GeForce RTX 2070 Super Mobile
M1 Max 24-Core GPU *
Quadro RTX 5000 Max-Q
Radeon RX 5700M *
GeForce GTX 1080 Mobile
Quadro RTX 4000 (Laptop)
M1 Pro 16-Core GPU *
Radeon PRO W6600M *
GeForce RTX 2070 Super Max-Q
Quadro RTX 4000 Max-Q *
M1 Pro 14-Core GPU *
Quadro P5200
Quadro RTX 3000 Max-Q *
Quadro P4200
Quadro P5000 Max-Q *
GeForce GTX 980 (Laptop)
Quadro P4000
Quadro P4000 Max-Q
Quadro P3200
Radeon RX 580X (Laptop) *
Radeon RX 580 (Laptop)
Radeon Pro 5300M
Radeon RX 5300M
Quadro P3000 Max-Q *
Quadro T2000 Max-Q *
Radeon Pro WX 7100 *
Radeon RX 570X (Laptop) *
Radeon RX 570 (Laptop) *
Radeon RX 470 (Laptop) *
Quadro T1000 Max-Q *

Class 3

Vega M GH
Quadro M5000M
GeForce GTX 1050 Ti Mobile
Radeon 680M
Quadro P2000
Quadro P2000 Max-Q
Quadro M4000M
T500 Laptop GPU *
Radeon R9 M395X
GeForce GTX 1050 Ti Max-Q *
Radeon Pro Vega 16
WX Vega M GL
Radeon R9 M485X
Quadro M3000M
FirePro W7170M
Radeon R9 M395
GeForce GTX 1050 Max-Q *
Radeon 660M
Radeon Pro WX 4150 *
Radeon RX 560X (Laptop)
Radeon RX 560 (Laptop)
Radeon RX 460 (Laptop)
Quadro P1000
Radeon R9 M390
Xe MAX
Radeon Pro 560X
Radeon Pro 560
Radeon Pro 460
Radeon Pro WX 4130 *
GeForce GTX 960M
Quadro P620 *
Radeon RX 550X (Laptop)
Radeon Pro WX 3200 *
Radeon Pro 555X
Radeon Pro 555
Radeon Pro 455
Quadro P600
Quadro M2000M
Radeon RX 540X *
Radeon Pro WX 2100 *
Radeon Pro WX 3100 *
GeForce GTX 950M
Radeon Pro 450
Radeon 630
Radeon 540X *
Radeon R9 M385X
Quadro P520
Quadro M1000M
GeForce 945M
Quadro P500 *
Iris Plus Graphics G7 (Ice Lake 64 EU) *
Vega 10 *
Iris Pro Graphics 580
FirePro W5170M *
Radeon R9 M370X
Vega 9
FirePro W5130M
UHD Graphics Xe G4 48EUs *
UHD Graphics 32EUs
UHD Graphics Xe 32EUs (Tiger Lake-H) *
UHD Graphics 750
Vega 7
Radeon R7 M465
Iris Pro Graphics 6200
Vega 8
GeForce 940M
Iris Plus Graphics G4 (Ice Lake 48 EU)
Quadro M600M
FirePro W4190M
Radeon R9 M375
Radeon R7 M445
Iris Plus Graphics 650
Iris Graphics 550
Radeon 625
Vega 6 *
Iris Plus Graphics 640
Iris Graphics 540
UHD Graphics 24EUs (Alder Lake-N) *
Radeon R7 M360
GeForce 920M
Radeon 620
Radeon R7 M340
Radeon 610
Radeon 610M *
Vega 6 *
UHD Graphics G1 (Ice Lake 32 EU)
UHD Graphics Xe 16EUs (Tiger Lake-H) *
HD Graphics 530
Radeon R5 (Bristol Ridge)
Adreno 690 *
Adreno 685 *
Adreno 680 *
Radeon R5 M330
GeForce 910M
HD Graphics 520

Class 4

UHD Graphics 730
Radeon R5 M320 *
Radeon R5 M315 *
Radeon R5 M420 *
Vega 2 *
Xclipse 530
UHD Graphics 617
UHD Graphics 615
HD Graphics 515
UHD Graphics 610
HD Graphics 510
UHD Graphics 605
Radeon R4 (Stoney Ridge)
Radeon R2 (Stoney Ridge)
HD Graphics (Broadwell)
UHD Graphics 600
HD Graphics (Braswell)

Class 5

* Approximate position of the graphics adapter

> Notebookcheck中文版(NBC中国) > FAQ / 小提示/ 技术参数 > 移动显示芯片——基准测试成绩列表 > NVIDIA NVIDIA GeForce RTX 4050 Laptop GPU
Klaus Hinum (Update: 2023-11-23)