Notebookcheck Logo

NVIDIA GeForce MX350

NVIDIA GeForce MX350

Nvidia GeForce MX350是专用于笔记本电脑的入门级移动图形卡。它于2020年2月发布,基于与用于笔记本电脑的Nvidia GeForce GTX 1050相同的GP107 Pascal芯片和640个着色器。内存总线被切成一半为64位(GDDR5)。

但是,第一批基准测试显示性能稍逊于GTX 1050,与GTX 960M相当。 Nvidia在产品页面上指出,MX350在i7-1065G7中提供的性能是Intel Iris Plus Graphics G7的2.5倍(而MX330为2倍)。因此,像The Division 2,Metro Exodus或Rage 2这样要求苛刻的2019年游戏只能在可接受的最低细节设置下运行。要求不高的游戏,例如FIFA 20,应该可以在高设置甚至1080p的条件下正常运行。但是,这始终也取决于所使用的处理器和内存。请参阅下面的详细游戏基准。

GP107-670-A1芯片采用三星14 nm FinFET工艺制造,并提供了许多新功能,包括DisplayPort 1.4(就绪),HDMI 2.0b,HDR,同时多投影(SMP)以及改进了H.265视频解码和编码(PlayReady 3.0)。完整的改进清单和新的Pascal台式机GPU可在我们专用的Pascal架构结构文章中找到。

在新的Nvidia驱动程序驱动程序中,GeForce MX350的硬件ID为1C94。

我们测试中的功耗低于平均GTX 1050(甚至是Max-Q版本),并且与较旧的MX图形卡相似(如25 W的TGP所示)。因此,GPU适用于轻薄型笔记本电脑。

GeForce MX300 Series

GeForce MX450 896 @ 1.4 - 1.58 GHz64 Bit @ 10000 MHz
GeForce MX350 640 @ 1.35 - 1.47 GHz64 Bit @ 7000 MHz
GeForce MX330 384 @ 1.53 - 1.59 GHz64 Bit @ 7000 MHz
CodenameN17S-G5 / GP107-670-A1
ArchitecturePascal
Pipelines640 - unified
TMUs40
ROPs16
Core Speed1354 - 1468 (Boost) MHz
Memory Speed7000 effective = 1752 MHz
Memory Bus Width64 Bit
Memory TypeGDDR5
Shared Memoryno
Memory Bandwidth56.1 GB/s
APIDirectX 12_1, OpenGL 4.6
Power Consumption25 Watt
Transistor Count3.3 Billion
Die Size 132 mm²
technology14 nm
PCIe3.0
DisplaysHDMI 2.0b, DisplayPort 1.4
FeaturesVulkan 1.1, OpenGL 4.6, OpenCL 1.2, GPU Boost 3.0, Multi Monitor, Optimus, PCIe 3.0, GameWorks
Date of Announcement20.02.2020
Link to Manufacturer Pagewww.nvidia.com

Benchmarks

Performance Rating - 3DMark 11 + Fire Strike + Time Spy
2 pt (6%)
AMD Radeon HD 8180
0.06605 -97%
...
NVIDIA GeForce GTX 860M
1.778 -11%
1.827 -8%
1.844 -7%
NVIDIA Quadro P600
1.86 -7%
NVIDIA GeForce GT 755M SLI
1.87 -6%
1.887 -5%
NVIDIA Quadro M2000M
1.894 -5%
NVIDIA T500 Laptop GPU
1.924 -3%
NVIDIA GeForce GTX 960M
1.967 -1%
NVIDIA GeForce MX350
1.991
NVIDIA Quadro P620
2.13 7%
2.14 7%
2.14 7%
2.15 8%
AMD Radeon 660M
2.16 8%
NVIDIA Quadro K5100M
2.18 9%
NVIDIA Quadro P1000
2.18 9%
AMD Radeon HD 8970M
2.3 16%
NVIDIA GeForce GTX 765M SLI
2.31 16%
...
21.1 960%
max:
33.3 1573%
0%
100%
3DMark - 3DMark Time Spy Score
min: 1219     avg: 1465     median: 1491 (4%)     max: 1752 Points
3DMark - 3DMark Time Spy Graphics
min: 1123     avg: 1322     median: 1335.5 (4%)     max: 1595 Points
Intel UHD Graphics 605
113 -91%
...
AMD Radeon Pro 555
1078 -18%
AMD Radeon Pro 455
1118 -15%
1136 -14%
NVIDIA GeForce GTX 960M
1148 -13%
1156 -13%
NVIDIA Quadro P600
1162 -12%
1170 -11%
unknown
1257 -5%
1281 -3%
NVIDIA GeForce MX350
1322
AMD Radeon Pro 560
1376 4%
NVIDIA Quadro P620
1388 5%
NVIDIA Quadro P1000
1395 6%
AMD Radeon 660M
1466 11%
1494 13%
AMD Radeon Pro 560X
1614 22%
NVIDIA GeForce GTX 1050 Max-Q
1615 22%
1672 26%
1724 30%
...
19434 1370%
max:
36485 2660%
0%
100%
3DMark - 3DMark Ice Storm Unlimited Graphics
min: 77510     avg: 229394     median: 285166 (32%)     max: 306423 Points
3DMark - 3DMark Ice Storm Extreme Graphics
min: 67621     avg: 77658     median: 79699 (10%)     max: 85655 Points
3DMark - 3DMark Cloud Gate Score
min: 11700     avg: 15613     median: 16226 (17%)     max: 18419 Points
3DMark - 3DMark Cloud Gate Graphics
min: 23194     avg: 24858     median: 24744 (7%)     max: 26239 Points
3DMark - 3DMark Fire Strike Standard Score
min: 3615     avg: 3975     median: 3985 (7%)     max: 4196 Points
3DMark - 3DMark Fire Strike Standard Graphics
min: 3999     avg: 4390     median: 4371 (5%)     max: 4656 Points
3DMark - 3DMark Ice Storm Graphics
min: 80101     avg: 88743     median: 87118 (10%)     max: 97898 Points
3DMark - 3DMark Wild Life Unlimited
min: 9538     avg: 9739     median: 9837 (5%)     max: 9841 Points
3DMark - 3DMark Night Raid
min: 13630     avg: 13846     median: 13845.5 (13%)     max: 14061 Points
3DMark - 3DMark Night Raid Graphics Score
min: 17617     avg: 17916     median: 17916 (7%)     max: 18215 Points
3DMark 11 - 3DM11 Performance Score
min: 5099     avg: 6325     median: 6376 (9%)     max: 6781 Points
3DMark 11 - 3DM11 Performance GPU
min: 5191     avg: 6142     median: 6166 (5%)     max: 6540 Points
171.8 -97%
...
5542 -10%
NVIDIA GeForce GT 755M SLI
5673 -8%
5885 -4%
5910 -4%
NVIDIA Quadro P620
5939 -3%
5990 -2%
NVIDIA Quadro P1000
6033 -2%
NVIDIA GeForce GTX 775M
6071 -1%
6074 -1%
NVIDIA GeForce MX350
6142
6342 3%
AMD Radeon 660M
6358 4%
6407 4%
6422 5%
6638 8%
6736 10%
AMD Radeon Pro 460
6749 10%
AMD Radeon R9 M290X
6817 11%
AMD Radeon R9 M390
6819 11%
...
59943 876%
max:
106023 1626%
0%
100%
3DMark 06 3DMark 06 - Standard 1280x1024 +
3DMark 06
23907 Points (31%)
Unigine Valley 1.0 - Unigine Valley 1.0 DX
19.6 fps (6%)
SPECviewperf 12
specvp12 sw-03 +
SPECviewperf 12 - specvp12 sw-03
29.6 fps (7%)
specvp12 snx-02 +
SPECviewperf 12 - specvp12 snx-02
4.1 fps (1%)
specvp12 showcase-01 +
SPECviewperf 12 - specvp12 showcase-01
19 fps (4%)
specvp12 mediacal-01 +
SPECviewperf 12 - specvp12 mediacal-01
13.3 fps (3%)
specvp12 maya-04 +
SPECviewperf 12 - specvp12 maya-04
25.3 fps (7%)
specvp12 energy-01 +
SPECviewperf 12 - specvp12 energy-01
0.6 fps (1%)
specvp12 creo-01 +
SPECviewperf 12 - specvp12 creo-01
15.3 fps (6%)
specvp12 catia-04 +
SPECviewperf 12 - specvp12 catia-04
20.7 fps (3%)
specvp12 3dsmax-05 +
SPECviewperf 12 - specvp12 3dsmax-05
28.9 fps (5%)
SPECviewperf 13 specvp13 sw-04 +
SPECviewperf 13 - specvp13 sw-04
41.4 fps (11%)
specvp13 snx-03 +
specvp13 showcase-02 +
SPECviewperf 13 - specvp13 showcase-02
18.9 fps (4%)
specvp13 medical-02 +
SPECviewperf 13 - specvp13 medical-02
14.7 fps (3%)
specvp13 maya-05 +
SPECviewperf 13 - specvp13 maya-05
47.9 fps (5%)
specvp13 energy-02 +
SPECviewperf 13 - specvp13 energy-02
0.5 fps (0%)
specvp13 creo-02 +
SPECviewperf 13 - specvp13 creo-02
34.4 fps (5%)
specvp13 catia-05 +
SPECviewperf 13 - specvp13 catia-05
29.5 fps (3%)
specvp13 3dsmax-06 +
SPECviewperf 13 - specvp13 3dsmax-06
28.6 fps (5%)
Cinebench R10 Cinebench R10 Shading (32bit) +
Cinebench R10 - Cinebench R10 Shading (32bit)
6839 points (5%)
Cinebench R15
Cinebench R15 OpenGL 64 Bit +
Cinebench R15 - Cinebench R15 OpenGL 64 Bit
min: 97.5     avg: 116.7     median: 110 (6%)     max: 140 fps
Cinebench R15 OpenGL Ref. Match 64 Bit +
Cinebench R15 - Cinebench R15 OpenGL Ref. Match 64 Bit
99.6 % (100%)
LuxMark v2.0 64Bit - LuxMark v2.0 Room GPU
458 Samples/s (2%)
LuxMark v2.0 64Bit - LuxMark v2.0 Sala GPU
1582 Samples/s (3%)
ComputeMark v2.1 - ComputeMark v2.1 Result
3661 points (4%)
Power Consumption - Furmark Stress Test Power Consumption - external Monitor *
min: 33.9     avg: 50     median: 51.7 (7%)     max: 58.6 Watt
05101520253035404550556065Tooltip
Power Consumption - The Witcher 3 Power Consumption - external Monitor *
min: 45     avg: 49.2     median: 50.1 (7%)     max: 51.5 Watt
051015202530354045505560Tooltip
Power Consumption - Witcher 3 Power Consumption *
min: 46     avg: 53     median: 54 (12%)     max: 59 Watt
051015202530354045505560Tooltip
Power Consumption - Witcher 3 ultra Power Efficiency
min: 0.278     avg: 0.3     median: 0.3 (31%)     max: 0.3326 fps per Watt
Power Consumption - Witcher 3 ultra Power Efficiency - external Monitor
min: 0.2834     avg: 0.3     median: 0.3 (27%)     max: 0.3333 fps per Watt
Emissions Witcher 3 Fan Noise +
Emissions - Witcher 3 Fan Noise
min: 35.7     avg: 41.3     median: 42.2 (68%)     max: 43.9 dB(A)
Clock Speed - GPU Clock Witcher 3 ultra
min: 1314     avg: 1404     median: 1403.5 (55%)     max: 1493 MHz
Clock Speed - GPU Clock Speed Furmark
min: 987     avg: 1164     median: 1164 (46%)     max: 1341 MHz
- Range of benchmark values for this graphics card
- Average benchmark values for this graphics card
* Smaller numbers mean a higher performance

Game Benchmarks

The following benchmarks stem from our benchmarks of review laptops. The performance depends on the used graphics memory, clock rate, processor, system settings, drivers, and operating systems. So the results don't have to be representative for all laptops with this GPU. For detailed information on the benchmark results, click on the fps number.

Ready or Not

Ready or Not

2023
low 1920x1080
41.5  fps    + Compare + 📈 Graph
med. 1920x1080
37  fps    + Compare + 📈 Graph
high 1920x1080
32  fps    + Compare + 📈 Graph
ultra 1920x1080
14.7  fps    + Compare + 📈 Graph
» With all tested laptops playable in detail settings med..
The Finals

The Finals

2023
low 1920x1080
31.5  fps    + Compare + 📈 Graph
med. 1920x1080
22.4  fps    + Compare + 📈 Graph
high 1920x1080
17  fps    + Compare + 📈 Graph
ultra 1920x1080
12.8  fps    + Compare + 📈 Graph
» The benchmarks indicate that the game is not playable in the tested settings.
Additional Benchmarks
Low Preset 1280x720
54.8
Avatar Frontiers of Pandora

Avatar Frontiers of Pandora

2023
low 1920x1080
3.5  fps    + Compare
» The benchmarks indicate that the game is not playable in the tested settings.
Additional Benchmarks
Low Preset TAA 1280x720
6.2
EA Sports WRC

EA Sports WRC

2023
low 1920x1080
10.1 (!)  fps    + Compare + 📈 Graph
» The benchmarks indicate that the game is not playable in the tested settings.
Additional Benchmarks
Ultra Low Preset LowAA 1280x720
39.8 (!)
Lords of the Fallen

Lords of the Fallen

2023
low 1920x1080
7.7  fps    + Compare + 📈 Graph
» The benchmarks indicate that the game is not playable in the tested settings.
Additional Benchmarks
Low Preset 1280x720
12
Total War Pharaoh

Total War Pharaoh

2023
low 1920x1080
67.9  fps    + Compare
med. 1920x1080
44  fps    + Compare
high 1920x1080
23  fps    + Compare
ultra 1920x1080
18.4  fps    + Compare
» With all tested laptops playable in detail settings med..
Additional Benchmarks
Low Preset 1280x720
117.7
Assassin's Creed Mirage

Assassin's Creed Mirage

2023
low 1920x1080
17  fps    + Compare
» The benchmarks indicate that the game is not playable in the tested settings.
Additional Benchmarks
Low Preset (Adaptive Quality Off) 1280x720
25
EA Sports FC 24

EA Sports FC 24

2023
low 1920x1080
32.4  fps    + Compare + 📈 Graph
» The benchmarks indicate that the game is not playable in the tested settings.
Additional Benchmarks
Low Preset 1280x720
48.3
Counter-Strike 2

Counter-Strike 2

2023
low 1920x1080
65.6  fps    + Compare + 📈 Graph
med. 1920x1080
50  fps    + Compare + 📈 Graph
high 1920x1080
30.5  fps    + Compare + 📈 Graph
ultra 1920x1080
16.5  fps    + Compare + 📈 Graph
» With all tested laptops playable in detail settings med..
Additional Benchmarks
Low Preset 1280x720
72.4
Lies of P

Lies of P

2023
low 1920x1080
21.8  fps    + Compare + 📈 Graph
med. 1920x1080
18.8  fps    + Compare + 📈 Graph
high 1920x1080
18.6  fps    + Compare + 📈 Graph
ultra 1920x1080
11.2  fps    + Compare + 📈 Graph
» The benchmarks indicate that the game is not playable in the tested settings.
Additional Benchmarks
Low Preset 1280x720
35.2
Starfield

Starfield

2023
low 1920x1080
12.6  fps    + Compare + 📈 Graph
med. 1920x1080
5.1  fps    + Compare + 📈 Graph
» The benchmarks indicate that the game is not playable in the tested settings.
Additional Benchmarks
Low Preset 1280x720
18.2
low 1920x1080
18.9  fps    + Compare + 📈 Graph
med. 1920x1080
14.9  fps    + Compare + 📈 Graph
high 1920x1080
9.9  fps    + Compare + 📈 Graph
» The benchmarks indicate that the game is not playable in the tested settings.
Additional Benchmarks
Low Preset 1280x720
40.7
low 1920x1080
4  fps    + Compare + 📈 Graph
» The benchmarks indicate that the game is not playable in the tested settings.
Additional Benchmarks
Low 1280x720
4.1
low 1920x1080
10.9  fps    + Compare + 📈 Graph
med. 1920x1080
10.5  fps    + Compare + 📈 Graph
» The benchmarks indicate that the game is not playable in the tested settings.
Additional Benchmarks
Low Preset 1280x720
21.7
low 1920x1080
18.8  fps    + Compare + 📈 Graph
med. 1920x1080
14.4  fps    + Compare + 📈 Graph
high 1920x1080
10.5  fps    + Compare + 📈 Graph
» The benchmarks indicate that the game is not playable in the tested settings.
Additional Benchmarks
Low Preset 1280x720
30.1
F1 23

F1 23

2023
low 1920x1080
26.4  fps    + Compare
med. 1920x1080
20.8  fps    + Compare
high 1920x1080
14.2  fps    + Compare
ultra 1920x1080
8.4  fps    + Compare
» The benchmarks indicate that the game is not playable in the tested settings.
Additional Benchmarks
Ultra Low Preset TAA 1280x720
67
Diablo 4

Diablo 4

2023
low 1920x1080
35.2  fps    + Compare + 📈 Graph
med. 1920x1080
31  fps    + Compare + 📈 Graph
high 1920x1080
26.6  fps    + Compare + 📈 Graph
ultra 1920x1080
20.9  fps    + Compare + 📈 Graph
» With all tested laptops playable in detail settings low.
Additional Benchmarks
Low Preset 1280x720
62.6
low 1920x1080
9.3  fps    + Compare + 📈 Graph
» The benchmarks indicate that the game is not playable in the tested settings.
Additional Benchmarks
Low Preset 1280x720
16.5
Dead Island 2

Dead Island 2

2023
low 1920x1080
40.3  fps    + Compare + 📈 Graph
med. 1920x1080
35.4  fps    + Compare + 📈 Graph
high 1920x1080
21  fps    + Compare + 📈 Graph
ultra 1920x1080
14.8  fps    + Compare + 📈 Graph
» With all tested laptops playable in detail settings med..
Additional Benchmarks
Low Preset Low TAA 1280x720
72.6
The Last of Us

The Last of Us

2023
low 1920x1080
7.9  fps    + Compare + 📈 Graph
» The benchmarks indicate that the game is not playable in the tested settings.
Additional Benchmarks
Low Preset 1280x720
13.6
low 1920x1080
18.4  fps    + Compare + 📈 Graph
med. 1920x1080
5.5  fps    + Compare + 📈 Graph
» The benchmarks indicate that the game is not playable in the tested settings.
Additional Benchmarks
Prioritize Performance Preset 1280x720
22.9
low 1920x1080
16  fps    + Compare
» The benchmarks indicate that the game is not playable in the tested settings.
Additional Benchmarks
Minimum Settings 1280x720
23.6
low 1920x1080
26.2  fps    + Compare + 📈 Graph
med. 1920x1080
13.8  fps    + Compare + 📈 Graph
high 1920x1080
12.8  fps    + Compare + 📈 Graph
» The benchmarks indicate that the game is not playable in the tested settings.
Additional Benchmarks
Ultra Low Preset 1280x720
36.5
low 1920x1080
30.9  fps    + Compare + 📈 Graph
med. 1920x1080
23.9  fps    + Compare + 📈 Graph
high 1920x1080
6.9  fps    + Compare + 📈 Graph
» The benchmarks indicate that the game is not playable in the tested settings.
Additional Benchmarks
Low Preset 1280x720
50.8
Returnal

Returnal

2023
low 1920x1080
6  fps    + Compare
» The benchmarks indicate that the game is not playable in the tested settings.
Additional Benchmarks
Low Preset 1280x720
12
low 1920x1080
15.3  fps    + Compare + 📈 Graph
med. 1920x1080
8.2  fps    + Compare + 📈 Graph
» The benchmarks indicate that the game is not playable in the tested settings.
Additional Benchmarks
Low Preset Low TAA 1280x720
27.3
low 1920x1080
8.9  fps    + Compare + 📈 Graph
» The benchmarks indicate that the game is not playable in the tested settings.
Additional Benchmarks
Low Preset TAA 1280x720
18.9
low 1920x1080
33.8  fps    + Compare + 📈 Graph
med. 1920x1080
24.6  fps    + Compare + 📈 Graph
high 1920x1080
7.4  fps    + Compare + 📈 Graph
» The benchmarks indicate that the game is not playable in the tested settings.
Additional Benchmarks
Low Preset / Off 1280x720
55.6
low 1920x1080
21.9  fps    + Compare + 📈 Graph
med. 1920x1080
14  fps    + Compare + 📈 Graph
» The benchmarks indicate that the game is not playable in the tested settings.
Additional Benchmarks
Low Preset 1280x720
33.1
low 1920x1080
30.1  fps    + Compare
med. 1920x1080
15.7  fps    + Compare
high 1920x1080
10  fps    + Compare
» The benchmarks indicate that the game is not playable in the tested settings.
Additional Benchmarks
Low Preset (without FSR Upscaling) 1280x720
47.1
low 1920x1080
18.3  fps    + Compare + 📈 Graph
med. 1920x1080
14.2  fps    + Compare + 📈 Graph
» The benchmarks indicate that the game is not playable in the tested settings.
Additional Benchmarks
Low Preset 1280x720
28.2
low 1920x1080
30  fps    + Compare
med. 1920x1080
20  fps    + Compare
high 1920x1080
14  fps    + Compare
» The benchmarks indicate that the game is not playable in the tested settings.
Additional Benchmarks
Basic Quality Preset T2X SMAA 1280x720
51
low 1920x1080
5.5 6.9 ~ 6 fps    + Compare + 📈 Graph
» The benchmarks indicate that the game is not playable in the tested settings.
low 1920x1080
16.7  fps    + Compare + 📈 Graph
med. 1920x1080
13.1  fps    + Compare + 📈 Graph
high 1920x1080
8.4  fps    + Compare + 📈 Graph
» The benchmarks indicate that the game is not playable in the tested settings.
Additional Benchmarks
Low Preset 1280x720
24.5
low 1920x1080
23.5  fps    + Compare + 📈 Graph
med. 1920x1080
16.7  fps    + Compare + 📈 Graph
high 1920x1080
11.1  fps    + Compare + 📈 Graph
» The benchmarks indicate that the game is not playable in the tested settings.
Additional Benchmarks
Low Preset 1280x720
34.1
F1 22

F1 22

2022
low 1920x1080
39.8  fps    + Compare
med. 1920x1080
32.4  fps    + Compare
high 1920x1080
20.3  fps    + Compare
ultra 1920x1080
14.4  fps    + Compare
» With all tested laptops playable in detail settings low.
Additional Benchmarks
Ultra Low Preset 16xAF TAA 1280x720
88
low 1920x1080
72.5  fps    + Compare + 📈 Graph
med. 1920x1080
43.9  fps    + Compare + 📈 Graph
high 1920x1080
35.2  fps    + Compare + 📈 Graph
ultra 1920x1080
21.3  fps    + Compare + 📈 Graph
» With all tested laptops playable in detail settings high.
Additional Benchmarks
Low Preset 1280x720
103.1
low 1920x1080
18.1  fps    + Compare + 📈 Graph
med. 1920x1080
16.7  fps    + Compare + 📈 Graph
high 1920x1080
14.8  fps    + Compare + 📈 Graph
ultra 1920x1080
13.6  fps    + Compare + 📈 Graph
» The benchmarks indicate that the game is not playable in the tested settings.
low 1920x1080
21.6  fps    + Compare
med. 1920x1080
14.2  fps    + Compare
high 1920x1080
8.1  fps    + Compare
» The benchmarks indicate that the game is not playable in the tested settings.
Additional Benchmarks
Lowest Preset (DX12) 1280x720
62.2
low 1920x1080
16.1  fps    + Compare
med. 1920x1080
11.2  fps    + Compare
high 1920x1080
6.4  fps    + Compare
ultra 1920x1080
5.5  fps    + Compare
» The benchmarks indicate that the game is not playable in the tested settings.
Additional Benchmarks
Low Preset 1280x720
26.1
Elex 2

Elex 2

2022
low 1920x1080
14.4  fps    + Compare + 📈 Graph
» The benchmarks indicate that the game is not playable in the tested settings.
Additional Benchmarks
Low / Off 1280x720
25.8
low 1920x1080
45.2  fps    + Compare
med. 1920x1080
31.2  fps    + Compare
high 1920x1080
25.1  fps    + Compare
ultra 1920x1080
17.7  fps    + Compare
» With all tested laptops playable in detail settings low.
Additional Benchmarks
Low Preset 1280x720
63.6
low 1920x1080
22.6  fps    + Compare + 📈 Graph
med. 1920x1080
21.2  fps    + Compare + 📈 Graph
high 1920x1080
14.8  fps    + Compare + 📈 Graph
» The benchmarks indicate that the game is not playable in the tested settings.
Additional Benchmarks
Low Preset 1280x720
46
low 1920x1080
35  fps    + Compare
med. 1920x1080
21  fps    + Compare
high 1920x1080
18  fps    + Compare
» The benchmarks indicate that the game is not playable in the tested settings.
Additional Benchmarks
Ultra Low Preset (with Fixed Resolution Quality) 1280x720
75
low 1920x1080
19.6  fps    + Compare + 📈 Graph
med. 1920x1080
15  fps    + Compare + 📈 Graph
» The benchmarks indicate that the game is not playable in the tested settings.
Additional Benchmarks
Low Preset 1280x720
31.8
low 1280x720
114.1  fps    + Compare + 📈 Graph
med. 1920x1080
45.7  fps    + Compare + 📈 Graph
high 1920x1080
32.4  fps    + Compare + 📈 Graph
ultra 1920x1080
20.5  fps    + Compare + 📈 Graph
» With all tested laptops playable in detail settings med..
Additional Benchmarks
Low Preset 1920x1080
80.7
low 1280x720
66  fps    + Compare
med. 1920x1080
25  fps    + Compare
high 1920x1080
16  fps    + Compare
ultra 1920x1080
7  fps    + Compare
» With all tested laptops playable in detail settings low.
Additional Benchmarks
Low Preset 1920x1080
35
low 1280x720
42  fps    + Compare
med. 1920x1080
21  fps    + Compare
high 1920x1080
15  fps    + Compare
» With all tested laptops playable in detail settings low.
Additional Benchmarks
Low Preset 1920x1080
29
low 1280x720
99.6  fps    + Compare + 📈 Graph
med. 1920x1080
37.2  fps    + Compare + 📈 Graph
high 1920x1080
29.2  fps    + Compare + 📈 Graph
ultra 1920x1080
26.5  fps    + Compare + 📈 Graph
» With all tested laptops playable in detail settings med..
Additional Benchmarks
Low Preset (DX12) 1920x1080
63.8
Far Cry 6

Far Cry 6

2021
low 1280x720
37.1  fps    + Compare + 📈 Graph
med. 1920x1080
17.4  fps    + Compare + 📈 Graph
high 1920x1080
10.9  fps    + Compare + 📈 Graph
ultra 1920x1080
8.5  fps    + Compare + 📈 Graph
» With all tested laptops playable in detail settings low.
Additional Benchmarks
Low Graphics Quality 1920x1080
21.9
Deathloop

Deathloop

2021
med. 1920x1080
8.2  fps    + Compare + 📈 Graph
high 1920x1080
6.6  fps    + Compare + 📈 Graph
ultra 1920x1080
6.4  fps    + Compare + 📈 Graph
» The benchmarks indicate that the game is not playable in the tested settings.
Additional Benchmarks
Low Preset 1920x1080
10
F1 2021

F1 2021

2021
med. 1920x1080
45  fps    + Compare
high 1920x1080
31  fps    + Compare
» With all tested laptops playable in detail settings med..
Additional Benchmarks
Ultra Low Preset 1920x1080
71
med. 1920x1080
62.8  fps    + Compare + 📈 Graph
high 1920x1080
56.8  fps    + Compare + 📈 Graph
QHD 2560x1440
44.1  fps    + Compare + 📈 Graph
4K 3840x2160
26.9  fps    + Compare + 📈 Graph
» With all tested laptops playable in detail settings high.
Additional Benchmarks
Low Preset 1920x1080
72.7
Days Gone

Days Gone

2021
med. 1920x1080
25.8  fps    + Compare + 📈 Graph
high 1920x1080
23.5  fps    + Compare + 📈 Graph
ultra 1920x1080
12.1  fps    + Compare + 📈 Graph
QHD 2560x1440
9.2  fps    + Compare + 📈 Graph
» The benchmarks indicate that the game is not playable in the tested settings.
Additional Benchmarks
Low Preset 1920x1080
34
low 1280x720
83.8  fps    + Compare + 📈 Graph
ultra 1920x1080
44  fps    + Compare + 📈 Graph
QHD 2560x1440
28.3  fps    + Compare + 📈 Graph
4K 3840x2160
13.3  fps    + Compare + 📈 Graph
» With all tested laptops playable in detail settings ultra.
med. 1920x1080
13.9  fps    + Compare + 📈 Graph
high 1920x1080
13.7  fps    + Compare + 📈 Graph
» The benchmarks indicate that the game is not playable in the tested settings.
Additional Benchmarks
Prioritize Performance Preset 1920x1080
16.8
Outriders

Outriders

2021
med. 1920x1080
25.7  fps    + Compare + 📈 Graph
high 1920x1080
21.5  fps    + Compare + 📈 Graph
ultra 1920x1080
16.3  fps    + Compare + 📈 Graph
» The benchmarks indicate that the game is not playable in the tested settings.
Additional Benchmarks
Low Preset 1920x1080
35.2
Hitman 3

Hitman 3

2021
low 1280x720
47.4  fps    + Compare
med. 1920x1080
21.9 22.9 ~ 22 fps    + Compare
high 1920x1080
18.5 18.7 ~ 19 fps    + Compare
ultra 1920x1080
16.4 16.7 ~ 17 fps    + Compare
» With all tested laptops playable in detail settings low.
Additional Benchmarks
Minimum Settings 1920x1080
31.9
31.8
low 1280x720
19 23.3 23.8 ~ 22 fps    + Compare + 📈 Graph
med. 1920x1080
10.3 10.5 10.9 ~ 11 fps    + Compare + 📈 Graph
high 1920x1080
6.9 7 7.1 ~ 7 fps    + Compare + 📈 Graph
ultra 1920x1080
5.9  fps    + Compare + 📈 Graph
» The benchmarks indicate that the game is not playable in the tested settings.
Additional Benchmarks
Low Preset 1920x1080
15.2
low 1280x720
38 38 41 47 ~ 41 fps    + Compare
med. 1920x1080
14 17 19 ~ 17 fps    + Compare
high 1920x1080
10 10 15 ~ 12 fps    + Compare
ultra 1920x1080
9 13 ~ 11 fps    + Compare
» With all tested laptops playable in detail settings low.
low 1280x720
58.3 62.7 ~ 61 fps    + Compare + 📈 Graph
med. 1920x1080
20.2 20.7 ~ 20 fps    + Compare + 📈 Graph
high 1920x1080
20.1 20.5 ~ 20 fps    + Compare + 📈 Graph
ultra 1920x1080
16.9 18 ~ 17 fps    + Compare + 📈 Graph
» With all tested laptops playable in detail settings low.
low 1280x720
43 45.9 ~ 44 fps    + Compare + 📈 Graph
med. 1920x1080
14.4 14.9 ~ 15 fps    + Compare + 📈 Graph
high 1920x1080
9.8 13.4 ~ 12 fps    + Compare + 📈 Graph
» With all tested laptops playable in detail settings low.
low 1280x720
17 19 22 ~ 19 fps    + Compare
med. 1920x1080
11 13 14 ~ 13 fps    + Compare
high 1920x1080
6 6 8 ~ 7 fps    + Compare
» The benchmarks indicate that the game is not playable in the tested settings.
Dirt 5

Dirt 5

2020
low 1280x720
44.5 48.9 ~ 47 fps    + Compare
med. 1920x1080
14.7 15.2 ~ 15 fps    + Compare
high 1920x1080
7.2 8.6 ~ 8 fps    + Compare
» With all tested laptops playable in detail settings low.
low 1280x720
29.2 33 35.7 36 ~ 33 fps    + Compare + 📈 Graph
med. 1920x1080
16.8 18.4 20 ~ 18 fps    + Compare + 📈 Graph
high 1920x1080
12.7 13.7 15 ~ 14 fps    + Compare + 📈 Graph
ultra 1920x1080
6.3  fps    + Compare + 📈 Graph
» The benchmarks indicate that the game is not playable in the tested settings.
FIFA 21

FIFA 21

2020
low 1280x720
150  fps    + Compare + 📈 Graph
med. 1920x1080
95.4  fps    + Compare + 📈 Graph
high 1920x1080
88.3  fps    + Compare + 📈 Graph
ultra 1920x1080
80.1  fps    + Compare + 📈 Graph
» With all tested laptops playable in detail settings ultra.
low 1280x720
103 142 ~ 123 fps    + Compare + 📈 Graph
med. 1920x1080
60 60.4 ~ 60 fps    + Compare + 📈 Graph
high 1920x1080
49.5 52.9 ~ 51 fps    + Compare + 📈 Graph
ultra 1920x1080
25.2 45.9 ~ 36 fps    + Compare + 📈 Graph
» With most tested laptops playable in detail settings ultra.
low 1280x720
45.3 49.6 ~ 47 fps    + Compare + 📈 Graph
med. 1920x1080
21.1 21.8 ~ 21 fps    + Compare + 📈 Graph
high 1920x1080
18.9 20.2 ~ 20 fps    + Compare + 📈 Graph
» With all tested laptops playable in detail settings low.
low 1280x720
67.4 69.7 71.6 107 ~ 79 fps    + Compare + 📈 Graph
med. 1920x1080
10.6 12.6 12.8 ~ 12 fps    + Compare + 📈 Graph
high 1920x1080
3.8 8.1 10.6 ~ 7 fps    + Compare + 📈 Graph
» With all tested laptops playable in detail settings low.
low 1280x720
76.2 81.5 ~ 79 fps    + Compare + 📈 Graph
med. 1920x1080
28.4 30.4 ~ 29 fps    + Compare + 📈 Graph
high 1920x1080
9.2 15.1 ~ 12 fps    + Compare + 📈 Graph
ultra 1920x1080
11.7  fps    + Compare + 📈 Graph
» With all tested laptops playable in detail settings low.
low 1280x720
36.1 36.3 45.1 ~ 39 fps    + Compare + 📈 Graph
med. 1920x1080
14.6 15.7 26.5 ~ 19 fps    + Compare + 📈 Graph
high 1920x1080
8.9 11 15.2 ~ 12 fps    + Compare + 📈 Graph
ultra 1920x1080
3.6 10 ~ 7 fps    + Compare + 📈 Graph
» With all tested laptops playable in detail settings low.
Additional Benchmarks
Low-End TAAAA 1920x1080
36.7
low 1280x720
29 33 ~ 31 fps    + Compare
med. 1920x1080
14 18 ~ 16 fps    + Compare
high 1920x1080
12 14 ~ 13 fps    + Compare
ultra 1920x1080
10 11 ~ 11 fps    + Compare
» The benchmarks indicate that the game is not playable in the tested settings.
low 1280x720
40 40.3 ~ 40 fps    + Compare
med. 1920x1080
18.4 20.5 ~ 19 fps    + Compare
high 1920x1080
17.4 18.7 ~ 18 fps    + Compare
ultra 1920x1080
17.1 18.1 ~ 18 fps    + Compare
» With all tested laptops playable in detail settings low.
F1 2020

F1 2020

2020
low 1280x720
98.7 102 ~ 100 fps    + Compare
med. 1920x1080
48.3 49 ~ 49 fps    + Compare
high 1920x1080
33 36 ~ 35 fps    + Compare
ultra 1920x1080
20 20.3 ~ 20 fps    + Compare
» With all tested laptops playable in detail settings med..
Valorant

Valorant

2020
low 1280x720
151  fps    + Compare
med. 1920x1080
129  fps    + Compare
high 1920x1080
116  fps    + Compare
» With all tested laptops playable in detail settings high.
low 1280x720
128 141.5 ~ 135 fps    + Compare
med. 1920x1080
48 52.1 ~ 50 fps    + Compare
high 1920x1080
30.1 32.7 ~ 31 fps    + Compare
ultra 1920x1080
19.3 21.7 ~ 21 fps    + Compare
» With all tested laptops playable in detail settings med..
low 1280x720
40.2  fps    + Compare
» With all tested laptops playable in detail settings low.
low 1280x720
59.1 59.1 ~ 59 fps    + Compare
med. 1920x1080
25.7 25.8 ~ 26 fps    + Compare
high 1920x1080
21.2 21.6 ~ 21 fps    + Compare
» With all tested laptops playable in detail settings low.
low 1280x720
73.9 77.9 ~ 76 fps    + Compare
med. 1920x1080
35.2 36.5 ~ 36 fps    + Compare
high 1920x1080
31.6 36.8 ~ 34 fps    + Compare
ultra 1920x1080
22.1 28 ~ 25 fps    + Compare
» With all tested laptops playable in detail settings med..
low 1280x720
27 42.1 ~ 35 fps    + Compare
med. 1920x1080
16.7 19.2 ~ 18 fps    + Compare
» The benchmarks indicate that the game is not playable in the tested settings.
med. 1920x1080
26.2 36.9 ~ 32 fps    + Compare
high 1920x1080
19.4 28.3 ~ 24 fps    + Compare
ultra 1920x1080
16.8 24 ~ 20 fps    + Compare
» The benchmarks indicate that the game is not playable in the tested settings.
low 1280x720
46.5 51.5 ~ 49 fps    + Compare
med. 1920x1080
26.2 29.2 ~ 28 fps    + Compare
high 1920x1080
22.8 24.9 ~ 24 fps    + Compare
ultra 1920x1080
20 21.7 ~ 21 fps    + Compare
» With all tested laptops playable in detail settings low.
low 1280x720
50.3 54.7 ~ 53 fps    + Compare
med. 1920x1080
31.4 32.6 ~ 32 fps    + Compare
high 1920x1080
21.2 22.3 ~ 22 fps    + Compare
ultra 1920x1080
17.3 19.2 ~ 18 fps    + Compare
» With all tested laptops playable in detail settings low.
GRID 2019

GRID 2019

2019
low 1280x720
59.4 71.9 ~ 66 fps    + Compare
med. 1920x1080
26.4 28 ~ 27 fps    + Compare
high 1920x1080
17.8 26.2 ~ 22 fps    + Compare
ultra 1920x1080
15.5  fps    + Compare
» With all tested laptops playable in detail settings low.
low 1280x720
42 44 ~ 43 fps    + Compare
med. 1920x1080
19 19 ~ 19 fps    + Compare
high 1920x1080
15 18 ~ 17 fps    + Compare
ultra 1920x1080
6  fps    + Compare
» With all tested laptops playable in detail settings low.
FIFA 20

FIFA 20

2019
low 1280x720
104  fps    + Compare
med. 1920x1080
70.8  fps    + Compare
high 1920x1080
46.3  fps    + Compare
ultra 1920x1080
33.5  fps    + Compare
» With all tested laptops playable in detail settings high.
low 1280x720
65.9 68.2 ~ 67 fps    + Compare
med. 1920x1080
26.3 27.3 ~ 27 fps    + Compare
high 1920x1080
16.9 17 ~ 17 fps    + Compare
ultra 1920x1080
12.6 14.7 ~ 14 fps    + Compare
» With all tested laptops playable in detail settings low.
Additional Benchmarks
Very Low Overall Quality (DX11) 1920x1080
43.5
Control

Control

2019
low 1280x720
51.6 53.2 ~ 52 fps    + Compare
med. 1920x1080
16.9 18.1 ~ 18 fps    + Compare
high 1920x1080
11.8 12.7 ~ 12 fps    + Compare
» With all tested laptops playable in detail settings low.
F1 2019

F1 2019

2019
low 1280x720
85 110 110 ~ 102 fps    + Compare
med. 1920x1080
38 49 49 ~ 45 fps    + Compare
high 1920x1080
28 37 39 ~ 35 fps    + Compare
ultra 1920x1080
17 31 33 ~ 27 fps    + Compare
» With all tested laptops playable in detail settings med..
low 1280x720
79.8 91.9 ~ 86 fps    + Compare
med. 1920x1080
22.2 30.1 ~ 26 fps    + Compare
high 1920x1080
11.9  fps    + Compare
ultra 1920x1080
6.7  fps    + Compare
» With all tested laptops playable in detail settings low.
Rage 2

Rage 2

2019
low 1280x720
44 46.2 ~ 45 fps    + Compare
med. 1920x1080
16.2 17.5 ~ 17 fps    + Compare
high 1920x1080
14.7 15.6 ~ 15 fps    + Compare
ultra 1920x1080
14.1 15.3 ~ 15 fps    + Compare
» With all tested laptops playable in detail settings low.
Anno 1800

Anno 1800

2019
low 1280x720
58.4 79.4 ~ 69 fps    + Compare
med. 1920x1080
30.3 35.5 ~ 33 fps    + Compare
high 1920x1080
18.5 20.7 ~ 20 fps    + Compare
ultra 1920x1080
9.2 11 ~ 10 fps    + Compare
» With all tested laptops playable in detail settings low.
low 1280x720
53 57 ~ 55 fps    + Compare
med. 1920x1080
27 28 ~ 28 fps    + Compare
high 1920x1080
20 22 ~ 21 fps    + Compare
ultra 1920x1080
11 13 ~ 12 fps    + Compare
» With all tested laptops playable in detail settings low.
low 1280x720
114 116.4 ~ 115 fps    + Compare
med. 1920x1080
40.3 41.8 ~ 41 fps    + Compare
high 1920x1080
33.6 35.8 ~ 35 fps    + Compare
ultra 1920x1080
15.5 20.9 ~ 18 fps    + Compare
» With all tested laptops playable in detail settings med..
low 1280x720
55 56 ~ 56 fps    + Compare + 📈 Graph
med. 1920x1080
28 28 ~ 28 fps    + Compare + 📈 Graph
high 1920x1080
25 26 ~ 26 fps    + Compare + 📈 Graph
ultra 1920x1080
22 23 ~ 23 fps    + Compare + 📈 Graph
» With all tested laptops playable in detail settings low.
low 1280x720
34.8 39.1 ~ 37 fps    + Compare
med. 1920x1080
14.5 14.9 ~ 15 fps    + Compare
high 1920x1080
12 12 ~ 12 fps    + Compare
ultra 1920x1080
8.6 8.8 ~ 9 fps    + Compare
» With most tested laptops playable in detail settings low.
low 1280x720
76.6 94 ~ 85 fps    + Compare
med. 1920x1080
33.1 40.6 ~ 37 fps    + Compare
high 1920x1080
28.4 32.6 ~ 31 fps    + Compare
ultra 1920x1080
25.2 27.4 ~ 26 fps    + Compare
» With most tested laptops playable in detail settings med..
low 1280x720
55.2  fps    + Compare
med. 1920x1080
35.3  fps    + Compare
high 1920x1080
26.2  fps    + Compare
ultra 1920x1080
23.3  fps    + Compare
» With all tested laptops playable in detail settings med..
low 1280x720
129  fps    + Compare
med. 1920x1080
38.3  fps    + Compare
high 1920x1080
30.7  fps    + Compare
ultra 1920x1080
25.3  fps    + Compare
» With all tested laptops playable in detail settings med..
low 1280x720
73.7 73.7 ~ 74 fps    + Compare
med. 1920x1080
37.2 37.6 ~ 37 fps    + Compare
high 1920x1080
29.7 29.9 ~ 30 fps    + Compare
ultra 1920x1080
23.2 24 ~ 24 fps    + Compare
» With all tested laptops playable in detail settings med..
low 1280x720
158.7 192 ~ 175 fps    + Compare
med. 1920x1080
81.9 88.6 ~ 85 fps    + Compare
high 1920x1080
49.1 52.6 ~ 51 fps    + Compare
ultra 1920x1080
35.1 38.5 ~ 37 fps    + Compare
» With all tested laptops playable in detail settings ultra.
Hitman 2

Hitman 2

2018
low 1280x720
53.3  fps    + Compare
med. 1920x1080
26.5  fps    + Compare
high 1920x1080
19.8  fps    + Compare
ultra 1920x1080
17.4  fps    + Compare
» With all tested laptops playable in detail settings low.
low 1280x720
48 49 ~ 49 fps    + Compare
med. 1920x1080
22 22 ~ 22 fps    + Compare
high 1920x1080
12 15 ~ 14 fps    + Compare
ultra 1920x1080
8  fps    + Compare
» With all tested laptops playable in detail settings low.
low 1280x720
88  fps    + Compare
med. 1920x1080
37  fps    + Compare
high 1920x1080
26  fps    + Compare
ultra 1920x1080
19  fps    + Compare
» With all tested laptops playable in detail settings med..
low 1280x720
54.3 60 65 68 ~ 62 fps    + Compare
med. 1920x1080
22 22.7 24 24 ~ 23 fps    + Compare
high 1920x1080
15 17 18 ~ 17 fps    + Compare
ultra 1920x1080
11 12 14 ~ 12 fps    + Compare
» With all tested laptops playable in detail settings low.
Additional Benchmarks
Lowest Preset 1920x1080
43
Strange Brigade

Strange Brigade

2018
low 1280x720
90.9 92.7 94.4 ~ 93 fps    + Compare
med. 1920x1080
31.7 32.3 35 ~ 33 fps    + Compare
high 1920x1080
24.6 25 27.2 ~ 26 fps    + Compare
ultra 1920x1080
18.8 18.9 20.1 ~ 19 fps    + Compare
» With all tested laptops playable in detail settings low.
low 1280x720
56.7  fps    + Compare
med. 1920x1080
23.6  fps    + Compare
high 1920x1080
21.1  fps    + Compare
ultra 1920x1080
16.8  fps    + Compare
» With all tested laptops playable in detail settings low.
Far Cry 5

Far Cry 5

2018
low 1280x720
58 58 58 59 59 59 64 ~ 59 fps    + Compare + 📈 Graph
med. 1920x1080
24 25 26 27 28 29 30 ~ 27 fps    + Compare + 📈 Graph
high 1920x1080
22 22 22 23 23 24 25 ~ 23 fps    + Compare + 📈 Graph
ultra 1920x1080
20 20 21 21 22 22 ~ 21 fps    + Compare + 📈 Graph
» With all tested laptops playable in detail settings low.
Additional Benchmarks
Low Preset TAA 1920x1080
34
34
32
World of Tanks enCore

World of Tanks enCore

2018
low 1366x768
346.8  fps    + Compare
med. 1920x1080
103.8  fps    + Compare
ultra 1920x1080
39.8  fps    + Compare
» With all tested laptops playable in detail settings ultra.
low 1280x720
49.1 49.1 55.9 58.9 61 62.5 66.7 71.7 74.4 74.5 77.8 79.7 81.9 90.8 ~ 68 fps    + Compare
med. 1920x1080
35.5 43.5 50 51 52 56.2 56.8 57 58.1 59.3 62.7 63 65.1 72.3 ~ 56 fps    + Compare
high 1920x1080
30.2 36.5 36.7 41.3 45.4 46.1 48.1 51.4 51.4 52.1 53.9 56.1 59.1 63.7 ~ 48 fps    + Compare
4K 3840x2160
29.4  fps    + Compare
» With most tested laptops playable in detail settings high.
low 1280x720
61.1  fps    + Compare
med. 1920x1080
26.3  fps    + Compare
high 1920x1080
23  fps    + Compare
ultra 1920x1080
15.1  fps    + Compare
» With all tested laptops playable in detail settings low.
low 1280x720
36.5 43.3 46.3 48.6 49.2 ~ 45 fps    + Compare
med. 1920x1080
20.4 21.4 23 23.2 23.9 ~ 22 fps    + Compare
high 1920x1080
10.7 13.6 14.5 14.9 15.1 ~ 14 fps    + Compare
» With all tested laptops playable in detail settings low.
Fortnite

Fortnite

2018
low 1280x720
113 138.8 ~ 126 fps    + Compare
med. 1920x1080
77 87.8 ~ 82 fps    + Compare
high 1920x1080
42.7 43.8 ~ 43 fps    + Compare
ultra 1920x1080
26.8 27 ~ 27 fps    + Compare
» With all tested laptops playable in detail settings high.
low 1280x720
188 220 ~ 204 fps    + Compare
med. 1920x1080
95.1 105.8 ~ 100 fps    + Compare
high 1920x1080
66.6 74.4 ~ 71 fps    + Compare
» With all tested laptops playable in detail settings high.
Additional Benchmarks
Performance 1920x1080
168.8
148
Overwatch

Overwatch

2016
low 1280x720
192.2  fps    + Compare
med. 1366x768
143.9  fps    + Compare
high 1920x1080
64  fps    + Compare
ultra 1920x1080
42.5  fps    + Compare
» With all tested laptops playable in detail settings ultra.
Additional Benchmarks
Medium (Render Scale 100 %) 2xAF FXAA 1920x1080
83.7
low 1280x720
102.8 107.3 112.8 113 116 119.1 119.4 124 126 128 130 138 139 145 ~ 123 fps    + Compare
med. 1366x768
93.8 94.6 97.3 98 103 106.2 112 114.9 115 119 120 120 124 130 ~ 111 fps    + Compare
high 1920x1080
64.1 73.9 77.6 78.7 80.4 82.7 82.8 83.3 84.1 84.1 84.8 85.2 85.2 88.4 ~ 81 fps    + Compare
ultra 1920x1080
52.3 65.8 66.6 67.2 73.4 74 75.6 76.1 76.3 76.3 76.3 76.9 77.3 80.6 ~ 72 fps    + Compare
4K 3840x2160
29.7  fps    + Compare
» With all tested laptops playable in detail settings ultra.
low 1024x768
54.9 64.3 69.7 79.6 80.2 80.3 80.5 80.7 81.5 84.7 85.3 86 ~ 77 fps    + Compare + 📈 Graph
med. 1366x768
35.2 41.9 42 42.3 42.4 46.2 46.5 46.7 46.9 47.2 48.6 49.7 51.9 ~ 45 fps    + Compare + 📈 Graph
high 1920x1080
20.6 22.8 22.9 24.7 27 27.1 27.4 27.5 27.5 27.8 28.3 28.5 29.9 ~ 26 fps    + Compare + 📈 Graph
ultra 1920x1080
10.1 14 15 15.1 15.3 15.6 15.7 15.8 16.4 16.7 17.1 17.5 ~ 15 fps    + Compare + 📈 Graph
» With all tested laptops playable in detail settings med..
Additional Benchmarks
Medium Graphics & Postprocessing 1920x1080
32.7
34.5
GTA V

GTA V

2015
low 1024x768
141 146 156 ~ 148 fps    + Compare
med. 1366x768
115 136.4 137.3 ~ 130 fps    + Compare
high 1920x1080
45.8 47 49.5 ~ 47 fps    + Compare
ultra 1920x1080
9.1 22.2 23.7 ~ 18 fps    + Compare
» With all tested laptops playable in detail settings high.
Additional Benchmarks
Normal/Off 4xAF 1920x1080
108.7
69
Lowest Settings possible 1920x1080
108.5
86.9
low 1280x720
218.2 222.6 ~ 220 fps    + Compare
med. 1366x768
132.4 135 ~ 134 fps    + Compare
high 1366x768
110.6 111.4 ~ 111 fps    + Compare
ultra 1920x1080
43.2 43.4 ~ 43 fps    + Compare
» With all tested laptops playable in detail settings ultra.
low 1024x768
252  fps    + Compare
med. 1366x768
228.4  fps    + Compare
high 1366x768
204.9  fps    + Compare
ultra 1920x1080
120.1  fps    + Compare
» With all tested laptops playable in detail settings ultra.
lowmed.highultraQHD4K
Ready or Not41.5373214.7
The Finals31.522.41712.8
Avatar Frontiers of Pandora3.5
EA Sports WRC10.1
Lords of the Fallen7.68
Total War Pharaoh67.9442318.4
Assassin's Creed Mirage17
EA Sports FC 2432.4
Counter-Strike 265.65030.516.5
Lies of P21.818.818.611.2
Starfield12.65.08
Armored Core 618.914.99.89
Immortals of Aveum4
Atlas Fallen10.910.5
Baldur's Gate 318.814.410.5
F1 2326.420.814.28.39
Diablo 435.23126.620.9
Star Wars Jedi Survivor9.32
Dead Island 240.335.42114.8
The Last of Us7.86
Resident Evil 4 Remake18.45.45
Company of Heroes 316
Sons of the Forest26.213.812.8
Atomic Heart30.923.96.89
Returnal6
Hogwarts Legacy15.38.16
Dead Space Remake8.88
The Witcher 3 v4.0033.824.67.42
High On Life21.914
The Callisto Protocol30.115.710
Need for Speed Unbound18.314.2
Call of Duty Modern Warfare 2 2022302014
Uncharted Legacy of Thieves Collection6
A Plague Tale Requiem16.713.18.41
The Quarry23.516.711.1
F1 2239.832.420.314.4
Vampire Bloodhunt72.543.935.221.3
Ghostwire Tokyo18.116.714.813.6
Tiny Tina's Wonderlands21.614.28.1
Cyberpunk 2077 1.616.111.26.425.46
Elex 214.4
GRID Legends45.231.225.117.7
Elden Ring22.621.214.8
Rainbow Six Extraction352118
God of War19.615
Farming Simulator 22114.145.732.420.5
Forza Horizon 56625167
Riders Republic422115
Back 4 Blood99.637.229.226.5
Far Cry 637.117.410.98.48
Deathloop8.176.626.4
F1 20214531
Monster Hunter Stories 262.856.844.126.9
Days Gone25.823.512.19.17
Mass Effect Legendary Edition83.84428.313.3
Resident Evil Village13.913.7
Outriders25.721.516.3
Hitman 347.4221917
Cyberpunk 2077 1.0221175.86
Immortals Fenyx Rising41171211
Yakuza Like a Dragon61202017
Call of Duty Black Ops Cold War441512
Assassin´s Creed Valhalla19137
Dirt 547158
Watch Dogs Legion3318146.34
FIFA 2115095.488.380.1
Star Wars Squadrons123605136
Mafia Definitive Edition472120
Serious Sam 479127
Crysis Remastered79291211.7
Flight Simulator 20203919127
Horizon Zero Dawn31161311
Death Stranding40191818
F1 2020100493520
Valorant151129116
Gears Tactics135503121
Doom Eternal40.2
Hunt Showdown592621
Escape from Tarkov76363425
Red Dead Redemption 23518
Star Wars Jedi Fallen Order322420
Need for Speed Heat49282421
Call of Duty Modern Warfare 201953322218
GRID 201966272215.5
Ghost Recon Breakpoint4319176
FIFA 2010470.846.333.5
Borderlands 367271714
Control521812
F1 2019102453527
Total War: Three Kingdoms862611.96.7
Rage 245171515
Anno 180069332010
The Division 255282112
Dirt Rally 2.0115413518
Far Cry New Dawn56282623
Metro Exodus3715129
Apex Legends85373126
Just Cause 455.235.326.223.3
Darksiders III12938.330.725.3
Battlefield V74373024
Farming Simulator 19175855137
Hitman 253.326.519.817.4
Assassin´s Creed Odyssey4922148
Forza Horizon 488372619
Shadow of the Tomb Raider62231712
Strange Brigade93332619
Monster Hunter World56.723.621.116.8
Far Cry 559272321
World of Tanks enCore346.8103.839.8
X-Plane 11.1168564829.4
Kingdom Come: Deliverance61.126.32315.1
Final Fantasy XV Benchmark452214
Fortnite126824327
Rocket League20410071
Overwatch192.2143.96442.5
Dota 2 Reborn123111817229.7
The Witcher 377452615
GTA V1481304718
BioShock Infinite22013411143
Counter-Strike: GO252228.4204.9120.1
< 30 fps
< 60 fps
< 120 fps
≥ 120 fps
32
40
27
14
64
27
9
5
69
20
6
1
61
7
2
1
2
1

4


For more games that might be playable and a list of all games and graphics cards visit our Gaming List

v1.26
log 24. 11:02:58

#0 no ids found in url (should be separated by "_") +0s ... 0s

#1 not redirecting to Ajax server +0s ... 0s

#2 did not recreate cache, as it is less than 5 days old! Created at Mon, 22 Apr 2024 05:40:21 +0200 +0.001s ... 0.001s

#3 no comparison url found in template nbc.compare_page_1 needed +0.084s ... 0.085s

#4 no comparison url found in template nbc.compare_page_1 needed +0s ... 0.086s

#5 composed specs +0s ... 0.086s

#6 did output specs +0s ... 0.086s

#7 start showIntegratedCPUs +0s ... 0.086s

#8 getting avg benchmarks for device 9980 +0.03s ... 0.115s

#9 got single benchmarks 9980 +0.077s ... 0.192s

#10 got avg benchmarks for devices +0s ... 0.192s

#11 min, max, avg, median took s +0.903s ... 1.095s

#12 before gaming benchmark output +0s ... 1.096s

#13 Got 764 rows for game benchmarks. +0.084s ... 1.18s

#14 composed SQL query for gamebenchmarks +0s ... 1.18s

#15 got data and put it in $dataArray +0.083s ... 1.262s

#16 benchmarks composed for output. +4.098s ... 5.36s

#17 no comparison url found in template nbc.compare_page_1 needed +0.01s ... 5.37s

#18 return log +0s ... 5.37s

Notebook reviews with NVIDIA GeForce MX350 graphics card

联想V17 G2 ITL

联想V17 G2评论。17英寸笔记本电脑的MX350并不令人满意

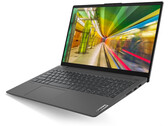
凭借其17英寸显示屏、Nvidia显卡和英特尔的Core i7 CPU,联想的V17 G2很适合办公和多媒体任务,包括简单的游戏。我们的审查显示,对于这款本来负担得起的笔记本电脑来说,顶级设备的额外溢价是否值得。...
Intel Core i7-1165G7 | NVIDIA GeForce MX350 | 17.30" | 2.2 kg
华硕Vivobook 15 K513EQ OLED笔记本电脑回顾。联想IdeaPad的替代品

华硕Vivobook 15 K513EQ OLED笔记本电脑回顾。联想IdeaPad的替代品

VivoBook 15 K513以其OLED显示屏、第11代英特尔CPU和独立的Nvidia显卡提供了一个惊人的性价比。虽然纸上谈兵,但一些边角料使它无法达到与ZenBook相同的水平。...
Intel Core i7-1165G7 | NVIDIA GeForce MX350 | 15.60" | 1.6 kg
小米NoteBook 14地平线版的评测。(图片来源:小米)

小米NoteBook 14地平线版笔记本电脑评测。削减成本的做法不妥当

通过Mi NoteBook 14 Horizon Edition,小米旨在降低有能力的多媒体笔记本电脑的入门点。虽然定价对于配备Nvidia MX350独立显卡的Core i7 Comet Lake设备来说似乎是正确的,但它也有几个妥协。它们是如何影响整体使用的呢?让我们拭目以待。...
Intel Core i7-10510U | NVIDIA GeForce MX350 | 14.00" | 1.4 kg
联想Yoga Slim 7 14笔记本电脑评测:用英伟达打败AMD

联想Yoga Slim 7 14笔记本电脑评测:用英伟达打败AMD

联想Yoga Slim 7提供14英寸版本,有AMD和Intel版本。 在此测试中,我们想确定采用Nvidia GPU的英特尔型号是否是更好的选择,还是采用Ryzen处理器的版本更好。...
Intel Core i7-1065G7 | NVIDIA GeForce MX350 | 14.00" | 1.4 kg
联想IdeaPad 5 15IIL05笔记本电脑评测:性能续航双丰收——感谢70-Wh的电池

联想IdeaPad 5 15IIL05笔记本电脑评测:性能续航双丰收——感谢70-Wh的电池

联想的15.6英寸笔记本电脑配备了Ice Lake Core i5处理器,8 GB RAM(双通道模式)和GeForce-MX350 GPU。 尽管拥有强大的硬件,IdeaPad的续航同样非常令人满意。 ...
Intel Core i5-1035G1 | NVIDIA GeForce MX350 | 15.60" | 1.7 kg

Acer Aspire 5 A514-54G, i3-1115G4 MX350: Intel Core i3-1115G4, 14.00", 1.7 kg
  External Review » Acer Aspire 5 A514-54G, i3-1115G4 MX350

Acer Aspire 5 A515-56G-78TR: Intel Core i7-1165G7, 15.60", 1.7 kg
  External Review » Acer Aspire 5 A515-56G-78TR

MSI Modern 14 B10RBSW-257XFR: Intel Core i7-10510U, 14.00", 1.3 kg
  External Review » MSI Modern 14 B10RBSW-257XFR

Lenovo V17 G2 ITL-82NX00EUGE: Intel Core i7-1165G7, 17.30", 2.2 kg
  External Review » Lenovo V17 G2 ITL-82NX00EUGE

Acer Aspire 5 A514-54G-743J: Intel Core i7-1165G7, 14.00", 1.7 kg
  External Review » Acer Aspire 5 A514-54G-743J

Dell Vostro 15 3510, i7-1165G7 MX350: Intel Core i7-1165G7, 15.60", 1.7 kg
  External Review » Dell Vostro 15 3510, i7-1165G7 MX350

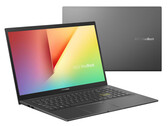
Asus Vivobook 15 K513EQ: Intel Core i7-1165G7, 15.60", 1.6 kg
  External Review » Asus Vivobook 15 K513EQ

Asus VivoBook 14 S433JQ-EB166: Intel Core i5-1035G1, 14.00", 1.5 kg
  External Review » Asus VivoBook 14 S433JQ-EB166

Asus VivoBook S14 S433JQ-EB166T: Intel Core i5-1035G1, 14.00", 1.4 kg
  External Review » Asus VivoBook S14 S433JQ-EB166T

Acer Aspire 5 A514-54G-58R8: Intel Core i5-1135G7, 14.00", 1.7 kg
  External Review » Acer Aspire 5 A514-54G-58R8

Asus VivoBook Ultra 14 K413EQ-EK115T: Intel Core i7-1165G7, 14.00"
  External Review » Asus VivoBook Ultra 14 K413EQ-EK115T

HP Pavilion 14-dv0006ns: Intel Core i5-1135G7, 14.00", 1.4 kg
  External Review » HP Pavilion 14-dv0006ns

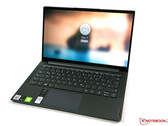
Acer Swift 5 SF514-55GT-72L0: Intel Core i7-1165G7, 14.00", 1.1 kg
  External Review » Acer Swift 5 SF514-55GT-72L0

Honor MagicBook Pro 10210U: Intel Core i5-10210U, 16.10", 1.7 kg
  External Review » Honor MagicBook Pro 10210U

Asus VivoBook S14 S433JQ-EB163: Intel Core i5-1035G1, 14.00", 1.4 kg
  External Review » Asus VivoBook S14 S433JQ-EB163

Acer Aspire 5 A515-56G-51YF: Intel Core i5-1135G7, 15.60", 1.7 kg
  External Review » Acer Aspire 5 A515-56G-51YF

Lenovo IdeaPad Slim 7 14IIL05-82A4000MUS: Intel Core i5-1035G1, 14.00", 1.5 kg
  External Review » Lenovo IdeaPad Slim 7 14IIL05-82A4000MUS

Lenovo Yoga Slim 7 14IIL05-82A10076GE: Intel Core i5-1035G1, 14.00", 1.5 kg
  External Review » Lenovo Yoga Slim 7 14IIL05-82A10076GE

MSI Modern 14 B10RBSW-064XES: Intel Core i7-10510U, 14.00", 1.3 kg
  External Review » MSI Modern 14 B10RBSW-064XES

Acer Swift 5 SF514-55GT-79BM: Intel Core i7-1165G7, 14.00", 1 kg
  External Review » Acer Swift 5 SF514-55GT-79BM

Asus VivoBook S15 S533EQ-BQ002T: Intel Core i7-1165G7, 15.60", 1.8 kg
  External Review » Asus VivoBook S15 S533EQ-BQ002T

Acer Book RS Porsche Design AP714-51GT-71A4: Intel Core i7-1165G7, 14.00", 1.3 kg
  External Review » Acer Book RS Porsche Design AP714-51GT-71A4

Lenovo Ideapad Slim 5 14IIL05: Intel Core i7-1065G7, 14.00", 1.6 kg
  External Review » Lenovo Ideapad Slim 5 14IIL05

Huawei MateBook 14 2020 Intel: Intel Core i7-10510U, 14.00", 1.5 kg
  External Review » Huawei MateBook 14 2020 Intel

HP Envy 13-ba0004ns: Intel Core i7-10510U, 13.30", 1.3 kg
  External Review » HP Envy 13-ba0004ns

Asus VivoBook S14 S433JQ i5-1035G1: Intel Core i5-1035G1, 14.00", 1.5 kg
  External Review » Asus VivoBook S14 S433JQ i5-1035G1

Lenovo Ideapad Slim 5i 15IIL05-81YK003SHH: Intel Core i7-1065G7, 15.60", 1.7 kg
  External Review » Lenovo Ideapad Slim 5i 15IIL05-81YK003SHH

Xiaomi RedmiBook 16 i7-1065G7, MX350: Intel Core i7-1065G7, 16.10", 1.8 kg
  External Review » Xiaomi RedmiBook 16 i7-1065G7, MX350

Huawei MateBook 14 KLVC-WFE9L: Intel Core i7-10510U, 14.00", 1.5 kg
  External Review » Huawei MateBook 14 KLVC-WFE9L

Huawei MateBook 14 (2020): Intel Core i5-10210U, 14.00", 1.5 kg
  External Review » Huawei MateBook 14 (2020)

Asus ZenBook 14 Q407IQ: AMD Ryzen 5 4500U, 14.00", 1.2 kg
  External Review » Asus ZenBook 14 Q407IQ

Lenovo IdeaPad 5 15IIL05: Intel Core i5-1035G1, 15.60", 1.7 kg
  External Review » Lenovo IdeaPad 5 15IIL05

Lenovo Yoga Slim 7-14IIL05: Intel Core i7-1065G7, 14.00", 1.4 kg
  External Review » Lenovo Yoga Slim 7-14IIL05

HP Envy 13-ba0005ns: Intel Core i7-10510U, 13.30", 1.3 kg
  External Review » HP Envy 13-ba0005ns

Acer Swift 5 SF514-54GT-72NT: Intel Core i7-1065G7, 14.00", 1 kg
  External Review » Acer Swift 5 SF514-54GT-72NT

Acer Aspire A514-53G-55A8: Intel Core i5-1035G1, 14.00", 1.6 kg
  External Review » Acer Aspire A514-53G-55A8

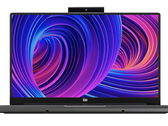
Xiaomi Mi NoteBook 14 Horizon Edition: Intel Core i7-10510U, 14.00", 1.4 kg
  External Review » Xiaomi Mi NoteBook 14 Horizon, i7-10510U

Acer Swift 3 SF313-52G-54JU: Intel Core i5-1035G1, 13.50", 1.2 kg
  External Review » Acer Swift 3 SF313-52G-54JU

Asus ZenBook 14 UM433IQ-A5026T: AMD Ryzen 7 4700U, 14.00", 1.2 kg
  External Review » Asus ZenBook 14 UM433IQ-A5026T

Please share our article, every link counts!

» Comparison of GPUs
Detailed list of all laptop GPUs sorted by class and performance.

» Benchmark List
Sort and restrict laptop GPUs based on performance in synthetic benchmarks.

» Notebook Gaming List
Playable games for each graphics card and their average FPS results.

Class 1

GeForce RTX 2080 Super Mobile

Class 2

M1 Max 32-Core GPU *
GeForce RTX 2070 Super Mobile
M1 Max 24-Core GPU *
Quadro RTX 5000 Max-Q
Radeon RX 5700M *
GeForce GTX 1080 Mobile
Quadro RTX 4000 (Laptop)
M1 Pro 16-Core GPU *
Radeon PRO W6600M *
GeForce RTX 2070 Super Max-Q
Quadro RTX 4000 Max-Q *
M1 Pro 14-Core GPU *
Quadro P5200
Quadro RTX 3000 Max-Q *
Quadro P4200
Quadro P5000 Max-Q *
GeForce GTX 980 (Laptop)
Quadro P4000
Quadro P4000 Max-Q
Quadro P3200
Radeon RX 580X (Laptop) *
Radeon RX 580 (Laptop)
Radeon Pro 5300M
Radeon RX 5300M
Quadro P3000 Max-Q *
Quadro T2000 Max-Q *
Radeon Pro WX 7100 *
Radeon RX 570X (Laptop) *
Radeon RX 570 (Laptop) *
Radeon RX 470 (Laptop) *
Quadro T1000 Max-Q *

Class 3

Vega M GH
Quadro M5000M
GeForce GTX 1050 Ti Mobile
Radeon 680M
Quadro P2000
Quadro P2000 Max-Q
Quadro M4000M
T500 Laptop GPU *
Radeon R9 M395X
GeForce GTX 1050 Ti Max-Q *
Radeon Pro Vega 16
WX Vega M GL
Radeon R9 M485X
Quadro M3000M
FirePro W7170M
Radeon R9 M395
GeForce GTX 1050 Max-Q *
Radeon 660M
Radeon Pro WX 4150 *
Radeon RX 560X (Laptop)
Radeon RX 560 (Laptop)
Radeon RX 460 (Laptop)
Quadro P1000
Radeon R9 M390
Xe MAX
Radeon Pro 560X
Radeon Pro 560
Radeon Pro 460
Radeon Pro WX 4130 *
GeForce GTX 960M
Quadro P620 *
Radeon RX 550X (Laptop)
Radeon Pro WX 3200 *
Radeon Pro 555X
Radeon Pro 555
Radeon Pro 455
Quadro P600
Quadro M2000M
Radeon RX 540X *
Radeon Pro WX 2100 *
Radeon Pro WX 3100 *
GeForce GTX 950M
Radeon Pro 450
Radeon 630
Radeon 540X *
Radeon R9 M385X
Quadro P520
Quadro M1000M
GeForce 945M
Quadro P500 *
Iris Plus Graphics G7 (Ice Lake 64 EU) *
Vega 10 *
Iris Pro Graphics 580
FirePro W5170M *
Radeon R9 M370X
Vega 9
FirePro W5130M
UHD Graphics Xe G4 48EUs *
UHD Graphics 32EUs
UHD Graphics Xe 32EUs (Tiger Lake-H) *
UHD Graphics 750
Vega 7
Radeon R7 M465
Iris Pro Graphics 6200
Vega 8
GeForce 940M
Iris Plus Graphics G4 (Ice Lake 48 EU)
Quadro M600M
FirePro W4190M
Radeon R9 M375
Radeon R7 M445
Iris Plus Graphics 650
Iris Graphics 550
Radeon 625
Vega 6 *
Iris Plus Graphics 640
Iris Graphics 540
UHD Graphics 24EUs (Alder Lake-N) *
Radeon R7 M360
GeForce 920M
Radeon 620
Radeon R7 M340
Radeon 610
Radeon 610M *
Vega 6 *
UHD Graphics G1 (Ice Lake 32 EU)
UHD Graphics Xe 16EUs (Tiger Lake-H) *
HD Graphics 530
Radeon R5 (Bristol Ridge)
Adreno 690 *
Adreno 685 *
Adreno 680 *
Radeon R5 M330
GeForce 910M
HD Graphics 520

Class 4

UHD Graphics 730
Radeon R5 M320 *
Radeon R5 M315 *
Radeon R5 M420 *
Vega 2 *
UHD Graphics 617
UHD Graphics 615
HD Graphics 515
UHD Graphics 610
HD Graphics 510
UHD Graphics 605
Radeon R4 (Stoney Ridge)
Radeon R2 (Stoney Ridge)
HD Graphics (Broadwell)
UHD Graphics 600
HD Graphics (Braswell)

Class 5

* Approximate position of the graphics adapter