


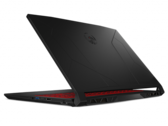
微星Bravo 15 B5DD笔记本电脑回顾。可怕的Radeon RX 5500M每美元性能
可以接受的是,预算游戏笔记本电脑不会给你最好的图形。然而,你还是要避免某些型号,因为相对于同价位的大多数其他产品,它们的GPU老化,性能差。
AMD Ryzen 5 5600H, Radeon RX 5500M, 15.6", 2.3 kg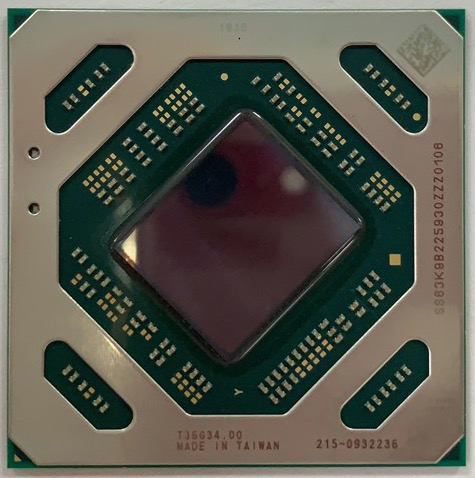
AMD Radeon RX 5500M(或RX 5500移动显卡)是基于Navi 14芯片(RDNA架构)的移动中端图形卡,该芯片采用现代7纳米工艺制造。它具有1,408个内核,时钟频率为1,645 MHz(最大Boost,最大游戏时钟为1448 MHz)和GDDR6图形内存(14 Gbps)。
Navi 14芯片使用了新的RDNA(Radeon DNA)微体系结构,它是GCN指令集的后继产品。它具有新的处理器设计,多级缓存层次结构和改进的渲染管线,并支持GDDR6内存。
根据AMD的说法,RX5500M的性能应介于Nvidia GeForce GTX 1660 Ti Max-Q和普通的GeForce GTX 1660 Ti之间。这意味着它适合在1080p画质下运行大型游戏。 AMD指出5500M的性能应达到台式机Radeon 5500的4.6 TFLOPS(理论值),而台式机Radeon 5500的性能应达到5.2(+ 12%)。在我们的MSI Alpha 15游戏基准中,RX 5500M平均而言它比旧GTX 1060(移动版)慢一些,因此在GTX 1650和GTX 1660 Ti Max-Q之间。
该芯片的TDP为85瓦,比频率较低的Radeon RX5300M高20瓦。在游戏中,芯片的功耗介于64到105瓦之间(使用HWInfo64记录的Ghost Recon)。在MSI Alpha 15中,功耗明显高于GTX 1060和GTX 1660 Ti Max-Q,仅略低于正常的台式机GTX 1660 Ti(在The Witcher 3中使用外部监视器测量)。
Radeon RX 5000M Series
| |||||||||||||
| Codename | Navi 14 / R19M-E85 | ||||||||||||
| Architecture | Navi / RDNA | ||||||||||||
| Pipelines | 1408 - unified | ||||||||||||
| Core Speed | 1327 - 1645 (Boost) MHz | ||||||||||||
| Memory Speed | 14000 MHz | ||||||||||||
| Memory Bus Width | 128 Bit | ||||||||||||
| Memory Type | GDDR6 | ||||||||||||
| Max. Amount of Memory | 4 GB | ||||||||||||
| Shared Memory | no | ||||||||||||
| API | DirectX 12, Shader 6.4, OpenGL 4.6 | ||||||||||||
| Power Consumption | 85 Watt | ||||||||||||
| Transistor Count | 6.4 Billion | ||||||||||||
| Man. Technology | 7 nm | ||||||||||||
| Features | DisplayPort 1.4 w/DFSC, HDMI 2.0b, Radeon Media Engine (H.264 4K150 decode, 4K90 encode / H.265 4K90 decode, 4K60 encode / VP9 4K90 decode) | ||||||||||||
| Notebook Size | medium sized | ||||||||||||
| Date of Announcement | 29.09.2019 | ||||||||||||
| Link to Manufacturer Page | www.amd.com | ||||||||||||
The following benchmarks stem from our benchmarks of review laptops. The performance depends on the used graphics memory, clock rate, processor, system settings, drivers, and operating systems. So the results don't have to be representative for all laptops with this GPU. For detailed information on the benchmark results, click on the fps number.


For more games that might be playable and a list of all games and graphics cards visit our Gaming List
MSI Bravo 15 B5DD-010US: AMD Ryzen 5 5600H, 15.60", 2.3 kg
External Review » MSI Bravo 15 B5DD-010US
HP Victus 16-e0053ns: AMD Ryzen 5 5600H, 16.10", 2.5 kg
External Review » HP Victus 16-e0053ns
HP Victus 16-e0017ns: AMD Ryzen 5 5600H, 16.10", 2.5 kg
External Review » HP Victus 16-e0017ns
MSI Bravo 15 B5DD-046ID: AMD Ryzen 7 5800H, 15.60", 2.4 kg
External Review » MSI Bravo 15 B5DD-046ID
HP Victus 16-e0048ns: AMD Ryzen 5 5600H, 16.10", 2.5 kg
External Review » HP Victus 16-e0048ns
HP Victus 16-e0352ng: AMD Ryzen 5 5600H, 16.10", 2.5 kg
External Review » HP Victus 16-e0352ng
MSI Bravo 15 B5DD-006XES: AMD Ryzen 5 5600H, 15.60", 2.4 kg
External Review » MSI Bravo 15 B5DD-006XES
MSI Bravo 15 B55DD-005XES: AMD Ryzen 7 5800H, 15.60", 2 kg
External Review » MSI Bravo 15 B55DD-005XES
MSI Bravo 15 A4DDR-219XES: AMD Ryzen 5 4600H, 15.60", 1.9 kg
External Review » MSI Bravo 15 A4DDR-219XES
MSI Bravo 15 A4DDR-217XES: AMD Ryzen 7 4800H, 15.60", 2 kg
External Review » MSI Bravo 15 A4DDR-217XES
MSI Bravo 17 A4DDK-002XES: AMD Ryzen 7 4800H, 17.30", 2.2 kg
External Review » MSI Bravo 17 A4DDK-002XES
MSI Bravo 17 A4DDR: AMD Ryzen 7 4800H, 17.30", 2.2 kg
External Review » MSI Bravo 17 A4DDR
MSI Bravo 15 A4DDR-023: AMD Ryzen 7 4800H, 15.60", 1.9 kg
External Review » MSI Bravo 15 A4DDR-023
MSI Bravo 17 A4DDR-021: AMD Ryzen 7 4800H, 17.30", 2.2 kg
External Review » MSI Bravo 17 A4DDR-021
MSI Bravo 15 A4DDR-007XES: AMD Ryzen 7 4800H, 15.60", 2 kg
External Review » MSI Bravo 15 A4DDR-007XES
MSI Bravo 15 A4DDR-016: AMD Ryzen 7 4800H, 15.60", 1.9 kg
External Review » MSI Bravo 15 A4DDR-016
MSI Bravo 17 A4DDR-009: AMD Ryzen 7 4800H, 17.30", 2.3 kg
External Review » MSI Bravo 17 A4DDR-009
MSI Alpha 15 A3DDK-007NL: AMD Ryzen 7 3750H, 15.60", 2.3 kg
External Review » MSI Alpha 15 A3DDK-007NL
MSI Alpha 15 A3DDK-001XES: AMD Ryzen 7 3750H, 15.60", 2.3 kg
External Review » MSI Alpha 15 A3DDK-001XES
MSI Alpha 15 A3DDK: AMD Ryzen 7 3750H, 15.60", 2.3 kg
External Review » MSI Alpha 15 A3DDK
» Comparison of GPUs
Detailed list of all laptop GPUs sorted by class and performance.
» Benchmark List
Sort and restrict laptop GPUs based on performance in synthetic benchmarks.
» Notebook Gaming List
Playable games for each graphics card and their average FPS results.
* Approximate position of the graphics adapter
» Notebookcheck多媒体笔记本电脑Top 10排名
» Notebookcheck游戏笔记本电脑Top 10排名
» Notebookcheck低价办公/商务笔记本电脑Top 10排名
» Notebookcheck高端办公/商务笔记本电脑Top 10排名
» Notebookcheck工作站笔记本电脑Top 10排名
» Notebookcheck亚笔记本电脑Top 10排名
» Notebookcheck超级本产品Top 10排名
» Notebookcheck变形本产品Top 10排名
» Notebookcheck平板电脑Top 10排名
» Notebookcheck智能手机Top 10排名
» Notebookcheck评测过最出色的笔记本电脑屏幕
» Notebookcheck售价500欧元以下笔记本电脑Top 10排名
» Notebookcheck售价300欧元以下笔记本电脑Top 10排名