Notebookcheck Logo

NVIDIA GeForce MX230

NVIDIA GeForce MX230

Nvidia GeForce MX230是一款入门级笔记本电脑独立显卡,具有(最有可能)基于Pascal架构的DirectX 12支持(FL 12_1)(而不是较旧的MX130的Maxwell)。类似于更强的MX250,MX230也基于GP108芯片。

特征

GP108芯片以三星(LPP)14 nm FinFET工艺制造,并提供了许多新功能,包括对DisplayPort 1.4,HDMI 2.0b,HDR的支持以及改进的H.265视频解编码和编码(PlayReady)。 3.0)。但是,由于需要至少3 GB的图形内存,带有Netflix的4K HDR无法运行。与较大的Pascal芯片相比,GP108不支持用于VR和G-Sync的同时多投影(SMP)。完整的改进项目和新的Pascal台式机GPU可在我们专用的Pascal体系结构文章中找到。

性能

得益于更新的Pascal架构,MX230明显比旧的GeForce MX130(基于Maxwell)强。 2019年硬件要求高的游戏只能以最低的分辨率和细节设置运行,并且可能会有些卡顿(例如,我们的基准测试中Anno 1800或Rage 2只能以低于30fps的帧率运行)。但是,要求较低的游戏(如《守望先锋》,《FIFA 19》或《火箭联盟》)可以在不卡顿的情况下以更高的细节和分辨率设置运行(请参见下面的基准测试)。

能耗

MX230是三星的14nm工艺,由于着色器数量少且只有64位内存总线,因此功耗非常低。因此,该芯片可以用于轻薄型笔记本电脑。在我们的功率测试中,性能较强的MX250的功率高上22%(Furmark负载),而较旧的MX130的功率则高上38%。UHD Graphics 620平的功耗只低了17%,而性能却要差得多。

GeForce MX200 Series

GeForce MX250 384 @ 1.52 - 1.58 GHz64 Bit @ 7000 MHz
GeForce MX230 256 @ 1.52 - 1.53 GHz64 Bit @ 7000 MHz
CodenameN17S-G0
ArchitecturePascal
Pipelines256 - unified
Core Speed1519 - 1531 (Boost) MHz
Memory Speed7000 MHz
Memory Bus Width64 Bit
Memory TypeGDDR5
Max. Amount of Memory4 GB
Shared Memoryno
APIDirectX 12_1, Shader 5.0, OpenGL 4.5
Transistor Count1.8 Billion
technology14 nm
FeaturesVulcan 1.1, GPU Boost 3.0, Optimus, PhysX, CUDA, GeForce Experience, GameWorks
Notebook Sizemedium sized
Date of Announcement20.02.2019
Link to Manufacturer Pagewww.geforce.com

Benchmarks

Performance Rating - 3DMark 11 + Fire Strike + Time Spy
1.1 pt (3%)
AMD Radeon HD 8180
0.06605 -94%
...
AMD FirePro M5100
1.06 -6%
1.062 -6%
1.067 -5%
1.068 -5%
NVIDIA GeForce 845M
1.076 -4%
AMD Radeon RX Vega 8 (Ryzen 2000/3000)
1.085 -3%
AMD Radeon R9 M370X
1.102 -2%
NVIDIA Quadro M600M
1.107 -2%
1.111 -1%
NVIDIA GeForce MX230
1.124
NVIDIA GeForce GTX 765M
1.129 0%
Intel UHD Graphics Xe 32EUs (Tiger Lake-H)
1.137 1%
AMD Radeon Pro WX 3100
1.217 8%
Intel Iris Plus Graphics G7 (Ice Lake 64 EU)
1.25 11%
AMD Radeon RX Vega 9
1.27 13%
AMD Radeon RX Vega 6 (Ryzen 4000/5000)
1.272 13%
1.274 13%
NVIDIA Quadro K3100M
1.274 13%
1.29 15%
...
21.1 1777%
max:
33.3 2863%
0%
100%
3DMark - 3DMark Time Spy Score
min: 786     avg: 851     median: 839.5 (2%)     max: 937 Points
3DMark - 3DMark Time Spy Graphics
min: 698     avg: 758     median: 748 (2%)     max: 837 Points
Intel UHD Graphics 605
113 -85%
...
614 -19%
NVIDIA Quadro M600M
631 -17%
Intel Iris Plus Graphics G4 (Ice Lake 48 EU)
639 -16%
650 -14%
Intel UHD Graphics Xe 32EUs (Tiger Lake-H)
670 -12%
AMD Radeon RX Vega 8 (Ryzen 2000/3000)
673 -11%
AMD Radeon RX Vega 10
724 -4%
733 -3%
Intel Iris Plus Graphics G7 (Ice Lake 64 EU)
744 -2%
NVIDIA GeForce MX230
758
Intel UHD Graphics Xe G4 48EUs
763 1%
787 4%
796 5%
AMD Radeon 540X
797 5%
Qualcomm Adreno 690
811 7%
AMD Radeon Pro WX 3100
820 8%
AMD Radeon RX Vega 6 (Ryzen 4000/5000)
821 8%
862 14%
AMD Radeon RX Vega 9
872 15%
...
19434 2464%
max:
36485 4713%
0%
100%
3DMark - 3DMark Ice Storm Unlimited Graphics
min: 163728     avg: 178637     median: 183041 (21%)     max: 189141 Points
3DMark - 3DMark Ice Storm Extreme Graphics
min: 35141     avg: 61903     median: 74932 (10%)     max: 75636 Points
3DMark - 3DMark Cloud Gate Score
min: 8886     avg: 10432     median: 10529.5 (11%)     max: 11659 Points
3DMark - 3DMark Cloud Gate Graphics
min: 13376     avg: 15921     median: 15796.5 (4%)     max: 17999 Points
3DMark - 3DMark Fire Strike Standard Score
min: 2041     avg: 2300     median: 2298.5 (4%)     max: 2531 Points
3DMark - 3DMark Fire Strike Standard Graphics
min: 2168     avg: 2479     median: 2467.5 (3%)     max: 2755 Points
3DMark - 3DMark Ice Storm Graphics
min: 49120     avg: 78716     median: 84971 (10%)     max: 95803 Points
3DMark 11 - 3DM11 Performance Score
min: 3316     avg: 3590     median: 3621.5 (5%)     max: 3720 Points
3DMark 11 - 3DM11 Performance GPU
min: 3180     avg: 3392     median: 3363.5 (3%)     max: 3582 Points
171.8 -95%
...
Intel UHD Graphics Xe 32EUs (Tiger Lake-H)
3180 -6%
Intel Iris Pro Graphics 580
3220 -5%
3238 -5%
3249 -4%
3261 -4%
Intel UHD Graphics Xe G4 48EUs
3288 -3%
NVIDIA GeForce 945M
3310 -2%
3313 -2%
AMD Radeon R9 M375
3314 -2%
NVIDIA GeForce MX230
3392
AMD Radeon RX Vega 8 (Ryzen 2000/3000)
3447 2%
3466 2%
AMD Radeon RX Vega 10
3483 3%
3535 4%
AMD Radeon R7 M275DX
3553 5%
3563 5%
3581 6%
3587 6%
NVIDIA Quadro K3100M
3588 6%
...
59943 1667%
max:
106023 3026%
0%
100%
3DMark 06 3DMark 06 - Standard 1280x1024 +
3DMark 06
18399 Points (24%)
Cinebench R10 Cinebench R10 Shading (32bit) +
Cinebench R10 - Cinebench R10 Shading (32bit)
min: 4095     avg: 5887     median: 6353 (5%)     max: 6748 points
Cinebench R11.5 Cinebench R11.5 OpenGL 64 Bit +
Cinebench R11.5 - Cinebench R11.5 OpenGL 64 Bit
64.7 fps (22%)
Cinebench R15
Cinebench R15 OpenGL 64 Bit +
Cinebench R15 - Cinebench R15 OpenGL 64 Bit
min: 79.7     avg: 84.3     median: 83.4 (5%)     max: 92.5 fps
Cinebench R15 OpenGL Ref. Match 64 Bit +
Cinebench R15 - Cinebench R15 OpenGL Ref. Match 64 Bit
99.6 % (100%)
GFXBench - GFXBench Car Chase Offscreen
45 fps (5%)
GFXBench 3.1 - GFXBench Manhattan ES 3.1 Offscreen
65 fps (1%)
GFXBench 3.0 - GFXBench 3.0 Manhattan Offscreen
91 fps (5%)
GFXBench (DX / GLBenchmark) 2.7
GFXBench T-Rex HD Offscreen C24Z16 +
GFXBench (DX / GLBenchmark) 2.7 - GFXBench T-Rex HD Offscreen C24Z16
176 fps (1%)
LuxMark v2.0 64Bit - LuxMark v2.0 Room GPU
583 Samples/s (3%)
LuxMark v2.0 64Bit - LuxMark v2.0 Sala GPU
1069 Samples/s (2%)
ComputeMark v2.1 - ComputeMark v2.1 Result
2018 points (2%)
Power Consumption - Furmark Stress Test Power Consumption - external Monitor *
33.8 Watt (5%)
Clock Speed - GPU Clock Speed Furmark
1300 MHz (52%)
- Range of benchmark values for this graphics card
- Average benchmark values for this graphics card
* Smaller numbers mean a higher performance

Game Benchmarks

The following benchmarks stem from our benchmarks of review laptops. The performance depends on the used graphics memory, clock rate, processor, system settings, drivers, and operating systems. So the results don't have to be representative for all laptops with this GPU. For detailed information on the benchmark results, click on the fps number.

GRID 2019

GRID 2019

2019
low 1280x720
46.8  fps    + Compare
med. 1920x1080
19.2  fps    + Compare
high 1920x1080
12.4  fps    + Compare
» With all tested laptops playable in detail settings low.
low 1280x720
28  fps    + Compare
med. 1920x1080
14  fps    + Compare
high 1920x1080
13  fps    + Compare
ultra 1920x1080
9  fps    + Compare
» The benchmarks indicate that the game is not playable in the tested settings.
FIFA 20

FIFA 20

2019
low 1280x720
73.1  fps    + Compare
med. 1920x1080
62.4  fps    + Compare
high 1920x1080
55.6  fps    + Compare
ultra 1920x1080
46.4  fps    + Compare
» With all tested laptops playable in detail settings ultra.
low 1280x720
39.6  fps    + Compare
med. 1920x1080
16  fps    + Compare
high 1920x1080
10.1  fps    + Compare
ultra 1920x1080
7.4  fps    + Compare
» With all tested laptops playable in detail settings low.
Control

Control

2019
low 1280x720
34.8  fps    + Compare
med. 1920x1080
11  fps    + Compare
high 1920x1080
7.5  fps    + Compare
» The benchmarks indicate that the game is not playable in the tested settings.
F1 2019

F1 2019

2019
low 1280x720
62  fps    + Compare
med. 1920x1080
25  fps    + Compare
high 1920x1080
20  fps    + Compare
ultra 1920x1080
12  fps    + Compare
» With all tested laptops playable in detail settings low.
low 1280x720
55.5 61 67.7 ~ 61 fps    + Compare
med. 1920x1080
12.3 16.6 19.2 ~ 16 fps    + Compare
high 1920x1080
5.8 7.9 9 ~ 8 fps    + Compare
ultra 1920x1080
3.5 4.9 5.1 ~ 5 fps    + Compare
» With all tested laptops playable in detail settings low.
Rage 2

Rage 2

2019
low 1280x720
24.5  fps    + Compare
med. 1920x1080
10.2  fps    + Compare
high 1920x1080
8  fps    + Compare
ultra 1920x1080
4.1  fps    + Compare
» The benchmarks indicate that the game is not playable in the tested settings.
Anno 1800

Anno 1800

2019
low 1280x720
24.4  fps    + Compare
med. 1920x1080
8.1  fps    + Compare
high 1920x1080
4.9  fps    + Compare
ultra 1920x1080
2.1  fps    + Compare
» The benchmarks indicate that the game is not playable in the tested settings.
low 1280x720
43  fps    + Compare
med. 1920x1080
13  fps    + Compare
high 1920x1080
10  fps    + Compare
ultra 1920x1080
6  fps    + Compare
» With all tested laptops playable in detail settings low.
low 1280x720
71  fps    + Compare
med. 1920x1080
22.9  fps    + Compare
high 1920x1080
17.5  fps    + Compare
ultra 1920x1080
10.4  fps    + Compare
» With all tested laptops playable in detail settings low.
Anthem

Anthem

2019
low 1280x720
22.7  fps    + Compare
med. 1920x1080
12.3  fps    + Compare
high 1920x1080
11.1  fps    + Compare
ultra 1920x1080
9.8  fps    + Compare
» The benchmarks indicate that the game is not playable in the tested settings.
low 1280x720
32  fps    + Compare
med. 1920x1080
15  fps    + Compare
high 1920x1080
13  fps    + Compare
ultra 1920x1080
12  fps    + Compare
» The benchmarks indicate that the game is not playable in the tested settings.
low 1280x720
25.9  fps    + Compare
med. 1920x1080
4.8  fps    + Compare
high 1920x1080
3.3  fps    + Compare
ultra 1920x1080
4.5  fps    + Compare
» The benchmarks indicate that the game is not playable in the tested settings.
low 1280x720
45.8  fps    + Compare
med. 1920x1080
17.8  fps    + Compare
high 1920x1080
14.4  fps    + Compare
ultra 1920x1080
12.4  fps    + Compare
» With all tested laptops playable in detail settings low.
low 1280x720
30.9  fps    + Compare
med. 1920x1080
17.4  fps    + Compare
high 1920x1080
12.7  fps    + Compare
ultra 1920x1080
10.9  fps    + Compare
» The benchmarks indicate that the game is not playable in the tested settings.
low 1280x720
69.3  fps    + Compare
med. 1920x1080
19.8  fps    + Compare
high 1920x1080
15.9  fps    + Compare
ultra 1920x1080
13.4  fps    + Compare
» With all tested laptops playable in detail settings low.
low 1280x720
38.3  fps    + Compare
med. 1920x1080
20.2  fps    + Compare
high 1920x1080
16  fps    + Compare
ultra 1920x1080
12  fps    + Compare
» With all tested laptops playable in detail settings low.
low 1280x720
122.3  fps    + Compare
med. 1920x1080
48.6  fps    + Compare
high 1920x1080
23.8  fps    + Compare
ultra 1920x1080
17.6  fps    + Compare
» With all tested laptops playable in detail settings med..
Hitman 2

Hitman 2

2018
low 1280x720
29.3  fps    + Compare
med. 1920x1080
13.4  fps    + Compare
high 1920x1080
10.7  fps    + Compare
ultra 1920x1080
9.9  fps    + Compare
» The benchmarks indicate that the game is not playable in the tested settings.
low 1280x720
36.8  fps    + Compare
med. 1920x1080
18.9  fps    + Compare
high 1920x1080
13.8  fps    + Compare
ultra 1920x1080
11.7  fps    + Compare
» With all tested laptops playable in detail settings low.
low 1280x720
26  fps    + Compare
med. 1920x1080
13  fps    + Compare
high 1920x1080
10  fps    + Compare
ultra 1920x1080
6  fps    + Compare
» The benchmarks indicate that the game is not playable in the tested settings.
low 1280x720
46  fps    + Compare
med. 1920x1080
21  fps    + Compare
high 1920x1080
16  fps    + Compare
ultra 1920x1080
12  fps    + Compare
» With all tested laptops playable in detail settings low.
FIFA 19

FIFA 19

2018
low 1280x720
80.5  fps    + Compare
med. 1920x1080
58.6  fps    + Compare
high 1920x1080
52.6  fps    + Compare
ultra 1920x1080
52.2  fps    + Compare
» With all tested laptops playable in detail settings ultra.
low 1280x720
32  fps    + Compare
med. 1920x1080
10  fps    + Compare
high 1920x1080
10 (!)  fps    + Compare
ultra 1920x1080
7 (!)  fps    + Compare
» The benchmarks indicate that the game is not playable in the tested settings.
F1 2018

F1 2018

2018
low 1280x720
48  fps    + Compare
med. 1920x1080
23  fps    + Compare
high 1920x1080
18  fps    + Compare
ultra 1920x1080
12  fps    + Compare
» With all tested laptops playable in detail settings low.
low 1280x720
34.1  fps    + Compare
med. 1920x1080
12.9  fps    + Compare
high 1920x1080
10.9  fps    + Compare
ultra 1920x1080
8.3  fps    + Compare
» The benchmarks indicate that the game is not playable in the tested settings.
Far Cry 5

Far Cry 5

2018
low 1280x720
31  fps    + Compare
med. 1920x1080
15  fps    + Compare
high 1920x1080
13  fps    + Compare
ultra 1920x1080
12  fps    + Compare
» The benchmarks indicate that the game is not playable in the tested settings.
World of Tanks enCore

World of Tanks enCore

2018
low 1366x768
235  fps    + Compare
med. 1920x1080
54.4  fps    + Compare
ultra 1920x1080
17.9  fps    + Compare
» With all tested laptops playable in detail settings med..
low 1280x720
48.4  fps    + Compare
med. 1920x1080
36.3  fps    + Compare
high 1920x1080
32.9  fps    + Compare
» With all tested laptops playable in detail settings med..
low 1280x720
31.5  fps    + Compare
med. 1920x1080
13.8  fps    + Compare
high 1920x1080
11.6  fps    + Compare
ultra 1920x1080
7  fps    + Compare
» The benchmarks indicate that the game is not playable in the tested settings.
low 1280x720
26  fps    + Compare
med. 1920x1080
11.4  fps    + Compare
high 1920x1080
7.4  fps    + Compare
» The benchmarks indicate that the game is not playable in the tested settings.
Fortnite

Fortnite

2018
low 1280x720
84.7  fps    + Compare
med. 1920x1080
33.2  fps    + Compare
high 1920x1080
19.5  fps    + Compare
ultra 1920x1080
15.6  fps    + Compare
» With all tested laptops playable in detail settings low.
Destiny 2

Destiny 2

2017
low 1280x720
44.9  fps    + Compare
med. 1920x1080
23.9  fps    + Compare
high 1920x1080
22  fps    + Compare
ultra 1920x1080
17.5  fps    + Compare
» With all tested laptops playable in detail settings low.
low 1280x720
50  fps    + Compare
med. 1920x1080
18  fps    + Compare
high 1920x1080
12  fps    + Compare
ultra 1920x1080
9  fps    + Compare
» With all tested laptops playable in detail settings low.
low 1280x720
58.5  fps    + Compare
med. 1920x1080
23.8  fps    + Compare
high 1920x1080
21  fps    + Compare
ultra 1920x1080
17.3  fps    + Compare
» With all tested laptops playable in detail settings low.
low 1280x720
96  fps    + Compare
med. 1366x768
91.4  fps    + Compare
high 1920x1080
68.8  fps    + Compare
ultra 1920x1080
62.9  fps    + Compare
» With all tested laptops playable in detail settings ultra.
low 1280x720
152.6  fps    + Compare
med. 1920x1080
77.7  fps    + Compare
high 1920x1080
72.7  fps    + Compare
» With all tested laptops playable in detail settings high.
Prey

Prey

2017
low 1280x720
90.9  fps    + Compare + 📈 Graph
med. 1920x1080
34.7  fps    + Compare
high 1920x1080
25.3  fps    + Compare
ultra 1920x1080
21.3  fps    + Compare
» With all tested laptops playable in detail settings low.
low 1280x720
35.5  fps    + Compare
med. 1920x1080
15.2  fps    + Compare
high 1920x1080
13  fps    + Compare
ultra 1920x1080
3.5  fps    + Compare
» With all tested laptops playable in detail settings low.
For Honor

For Honor

2017
low 1280x720
63  fps    + Compare
med. 1920x1080
21  fps    + Compare
high 1920x1080
18.7  fps    + Compare
ultra 1920x1080
15  fps    + Compare
» With all tested laptops playable in detail settings low.
low 1024x768
86  fps    + Compare
med. 1366x768
45.6  fps    + Compare
high 1920x1080
14.7  fps    + Compare
ultra 1920x1080
10.6  fps    + Compare
» With all tested laptops playable in detail settings med..
Overwatch

Overwatch

2016
low 1280x720
90 101 ~ 96 fps    + Compare
med. 1366x768
78.3 83 ~ 81 fps    + Compare + 📈 Graph
high 1920x1080
35.9 39.1 ~ 38 fps    + Compare
ultra 1920x1080
16.6 23 ~ 20 fps    + Compare
» With all tested laptops playable in detail settings high.
Doom

Doom

2016
low 1280x720
56.4  fps    + Compare
med. 1366x768
45.9  fps    + Compare
high 1920x1080
19.3  fps    + Compare
ultra 1920x1080
15.6  fps    + Compare
» With all tested laptops playable in detail settings med..
low 1280x768
18.4  fps    + Compare
med. 1920x1080
10.6  fps    + Compare
high 1920x1080
9  fps    + Compare
» The benchmarks indicate that the game is not playable in the tested settings.
low 1024x768
85.9  fps    + Compare
med. 1366x768
61.9  fps    + Compare
high 1920x1080
32.2  fps    + Compare
ultra 1920x1080
22.5  fps    + Compare
» With all tested laptops playable in detail settings med..
low 1366x768
101.2  fps    + Compare
med. 1366x768
84.1  fps    + Compare
high 1920x1080
52.8  fps    + Compare
ultra 1920x1080
33.2  fps    + Compare
» With all tested laptops playable in detail settings high.
low 1280x720
126.7  fps    + Compare
med. 1366x768
113  fps    + Compare
high 1920x1080
58  fps    + Compare
ultra 1920x1080
43.2  fps    + Compare
» With all tested laptops playable in detail settings ultra.
low 1280x720
44  fps    + Compare
med. 1366x768
38  fps    + Compare
high 1920x1080
16  fps    + Compare
ultra 1920x1080
11  fps    + Compare
» With all tested laptops playable in detail settings med..
low 1024x768
45.9 48.4 ~ 47 fps    + Compare + 📈 Graph
med. 1366x768
26.4 28.4 ~ 27 fps    + Compare
high 1920x1080
13.5 15.9 ~ 15 fps    + Compare
ultra 1920x1080
7.7 9.9 ~ 9 fps    + Compare + 📈 Graph
» With all tested laptops playable in detail settings low.
GTA V

GTA V

2015
low 1024x768
71.5  fps    + Compare
med. 1366x768
64.5  fps    + Compare
high 1920x1080
26.9  fps    + Compare
ultra 1920x1080
10.6  fps    + Compare
» With all tested laptops playable in detail settings med..
Sims 4

Sims 4

2014
low 1024x768
171.9  fps    + Compare
med. 1366x768
110  fps    + Compare
high 1920x1080
60.5  fps    + Compare
ultra 1920x1080
48.7  fps    + Compare
» With all tested laptops playable in detail settings ultra.
Thief

Thief

2014
low 1024x768
58.7  fps    + Compare
med. 1366x768
39.4  fps    + Compare
high 1366x768
35.6  fps    + Compare
ultra 1920x1080
18.3  fps    + Compare
» With all tested laptops playable in detail settings high.
low 1280x720
146.4 148.5 151.5 168.1 170.7 ~ 157 fps    + Compare
med. 1366x768
71.3 81.4 81.9 82.8 90.6 ~ 82 fps    + Compare
high 1366x768
61.8 70.2 72.7 79.2 79.8 ~ 73 fps    + Compare
ultra 1920x1080
26.2 27.4 28 31.2 31.2 ~ 29 fps    + Compare
» With all tested laptops playable in detail settings high.
low 1024x768
150.8  fps    + Compare
med. 1366x768
74.4  fps    + Compare
high 1366x768
55.4  fps    + Compare
ultra 1920x1080
26.1  fps    + Compare
» With all tested laptops playable in detail settings high.
low 1024x768
178.1  fps    + Compare
med. 1366x768
127.1  fps    + Compare
high 1366x768
90.7  fps    + Compare
ultra 1920x1080
64.9  fps    + Compare
» With all tested laptops playable in detail settings ultra.
low 1024x768
142.6  fps    + Compare
med. 1366x768
114.2  fps    + Compare
high 1366x768
96.1  fps    + Compare
ultra 1920x1080
52.6  fps    + Compare
» With all tested laptops playable in detail settings ultra.
low 1024x768
234.3  fps    + Compare
med. 1360x768
111.7  fps    + Compare
high 1360x768
85.9  fps    + Compare
ultra 1920x1080
41.4  fps    + Compare
» With all tested laptops playable in detail settings ultra.
lowmed.highultraQHD4K
GRID 201946.819.212.4
Ghost Recon Breakpoint2814139
FIFA 2073.162.455.646.4
Borderlands 339.61610.17.4
Control34.8117.5
F1 201962252012
Total War: Three Kingdoms611685
Rage 224.510.284.1
Anno 180024.48.14.92.1
The Division 24313106
Dirt Rally 2.07122.917.510.4
Anthem22.712.311.19.8
Far Cry New Dawn32151312
Metro Exodus25.94.83.34.5
Apex Legends45.817.814.412.4
Just Cause 430.917.412.710.9
Darksiders III69.319.815.913.4
Battlefield V38.320.21612
Farming Simulator 19122.348.623.817.6
Hitman 229.313.410.79.9
Call of Duty Black Ops 436.818.913.811.7
Assassin´s Creed Odyssey2613106
Forza Horizon 446211612
FIFA 1980.558.652.652.2
Shadow of the Tomb Raider3210107
F1 201848231812
Monster Hunter World34.112.910.98.3
Far Cry 531151312
World of Tanks enCore23554.417.9
X-Plane 11.1148.436.332.9
Kingdom Come: Deliverance31.513.811.67
Final Fantasy XV Benchmark2611.47.4
Fortnite84.733.219.515.6
Destiny 244.923.92217.5
Middle-earth: Shadow of War5018129
Playerunknown's Battlegrounds (PUBG)58.523.82117.3
Team Fortress 29691.468.862.9
Rocket League152.677.772.7
Prey90.934.725.321.3
Ghost Recon Wildlands35.515.2133.5
For Honor632118.715
Civilization VI8645.614.710.6
Overwatch96813820
Doom56.445.919.315.6
Ashes of the Singularity18.410.69
Rainbow Six Siege85.961.932.222.5
World of Warships101.284.152.833.2
Dota 2 Reborn126.71135843.2
Batman: Arkham Knight44381611
The Witcher 34727159
GTA V71.564.526.910.6
Sims 4171.911060.548.7
Thief58.739.435.618.3
BioShock Infinite157827329
Tomb Raider150.874.455.426.1
Counter-Strike: GO178.1127.190.764.9
Diablo III142.6114.296.152.6
StarCraft 2234.3111.785.941.4
< 30 fps
< 60 fps
< 120 fps
≥ 120 fps
9
24
15
10
34
10
13
1
41
9
7
43
7
2


For more games that might be playable and a list of all games and graphics cards visit our Gaming List

v1.26
log 16. 06:08:50

#0 no ids found in url (should be separated by "_") +0s ... 0s

#1 not redirecting to Ajax server +0s ... 0s

#2 did not recreate cache, as it is less than 5 days old! Created at Tue, 16 Apr 2024 05:39:00 +0200 +0.001s ... 0.001s

#3 no comparison url found in template nbc.compare_page_1 needed +0.061s ... 0.062s

#4 composed specs +0s ... 0.062s

#5 did output specs +0s ... 0.062s

#6 start showIntegratedCPUs +0s ... 0.062s

#7 getting avg benchmarks for device 9571 +0.023s ... 0.085s

#8 got single benchmarks 9571 +0.023s ... 0.107s

#9 got avg benchmarks for devices +0s ... 0.107s

#10 min, max, avg, median took s +0.489s ... 0.596s

#11 before gaming benchmark output +0s ... 0.596s

#12 Got 257 rows for game benchmarks. +0.022s ... 0.619s

#13 composed SQL query for gamebenchmarks +0s ... 0.619s

#14 got data and put it in $dataArray +0.039s ... 0.658s

#15 benchmarks composed for output. +2.258s ... 2.916s

#16 no comparison url found in template nbc.compare_page_1 needed +0.005s ... 2.921s

#17 return log +0s ... 2.921s

Notebook reviews with NVIDIA GeForce MX230 graphics card

Lenovo IdeaPad S340-14IWL

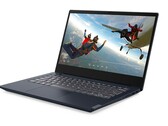
联想IdeaPad S340(i7-8565U,FHD)笔记本电脑评测

IdeaPad S340具有吸引人的设计和良好的硬件设备。 可选的独立MX显卡很不错,可提供更高的图形性能。 在这篇评测中,我们测评了配备Nvidia GeForce MX230的联想IdeaPad S340。...
Intel Core i7-8565U | NVIDIA GeForce MX230 | 14.00" | 1.6 kg

Lenovo Ideapad C340-15IML-81TL002EMH: Intel Core i7-10510U, 15.60", 2 kg
  External Review » Lenovo Ideapad C340-15IML-81TL002EMH

Acer TravelMate P2 TMP215-52G-NX.VLUEX.005: Intel Core i7-10510U, 15.60", 1.8 kg
  External Review » Acer TravelMate P2 TMP215-52G-NX.VLUEX.005

Lenovo Ideapad C340-14IML-81TK0022MJ: Intel Core i3-10110U, 14.00", 1.6 kg
  External Review » Lenovo Ideapad C340-14IML-81TK0022MJ

Dell Inspiron 14 3493-4KWCF: Intel Core i7-1065G7, 14.00", 1.8 kg
  External Review » Dell Inspiron 14 3493-4KWCF

Dell Vostro 15 3591 i5-1035G1, MX230: Intel Core i5-1035G1, 15.60", 2.2 kg
  External Review » Dell Vostro 15 3591 i5-1035G1, MX230

Acer Aspire 3 A315-55G-55WZ: Intel Core i5-10210U, 15.60", 1.9 kg
  External Review » Acer Aspire 3 A315-55G-55WZ

Acer Aspire 3 A315-55G-54BN: Intel Core i5-10210U, 15.60", 2 kg
  External Review » Acer Aspire 3 A315-55G-54BN

Lenovo Ideapad C340-15IWL-81N5004QGE: Intel Core i5-8265U, 15.60", 2 kg
  External Review » Lenovo Ideapad C340-15IWL-81N5004QGE

Dell Inspiron 15 5593, i5-1035G1: Intel Core i5-1035G1, 15.60", 1.8 kg
  External Review » Dell Inspiron 15 5593, i5-1035G1

Lenovo Ideapad L340-15IWL-81LG005GGE: Intel Core i7-8565U, 15.60", 2.1 kg
  External Review » Lenovo Ideapad L340-15IWL-81LG005GGE

Lenovo Ideapad L340-15IWL-88IPL301158: Intel Core i5-8265U, 15.60", 2.1 kg
  External Review » Lenovo Ideapad L340-15IWL-88IPL301158

Asus VivoBook 14 X412FJ-EB023T: Intel Core i5-8265U, 14.00", 1.5 kg
  External Review » Asus VivoBook 14 X412FJ-EB023T

Lenovo Ideapad S340-15IWL-81N8002UGE: Intel Core i5-8265U, 15.60", 1.8 kg
  External Review » Lenovo Ideapad S340-15IWL-81N8002UGE

Asus VivoBook 14 F412FJ-EB118T: Intel Core i5-8265U, 14.00", 1.5 kg
  External Review » Asus VivoBook 14 F412FJ-EB118T

Lenovo Ideapad S340-14IWL-81N70056GE: Intel Core i7-8565U, 14.00", 1.6 kg
  External Review » Lenovo Ideapad S340-14IWL-81N70056GE

Please share our article, every link counts!

» Comparison of GPUs
Detailed list of all laptop GPUs sorted by class and performance.

» Benchmark List
Sort and restrict laptop GPUs based on performance in synthetic benchmarks.

» Notebook Gaming List
Playable games for each graphics card and their average FPS results.

Class 1

GeForce RTX 2080 Super Mobile

Class 2

M1 Max 32-Core GPU *
GeForce RTX 2070 Super Mobile
M1 Max 24-Core GPU *
Quadro RTX 5000 Max-Q
Radeon RX 5700M *
GeForce GTX 1080 Mobile
Quadro RTX 4000 (Laptop)
M1 Pro 16-Core GPU *
Radeon PRO W6600M *
GeForce RTX 2070 Super Max-Q
Quadro RTX 4000 Max-Q *
M1 Pro 14-Core GPU *
Quadro P5200
Quadro RTX 3000 Max-Q *
Quadro P4200
Quadro P5000 Max-Q *
GeForce GTX 980 (Laptop)
Quadro P4000
Quadro P4000 Max-Q
Quadro P3200
Radeon RX 580X (Laptop) *
Radeon RX 580 (Laptop)
Radeon Pro 5300M
Radeon RX 5300M
Quadro P3000 Max-Q *
Quadro T2000 Max-Q *
Radeon Pro WX 7100 *
Radeon RX 570X (Laptop) *
Radeon RX 570 (Laptop) *
Radeon RX 470 (Laptop) *
Quadro T1000 Max-Q *

Class 3

Vega M GH
Quadro M5000M
GeForce GTX 1050 Ti Mobile
Radeon 680M
Quadro P2000
Quadro P2000 Max-Q
Quadro M4000M
T500 Laptop GPU *
Radeon R9 M395X
GeForce GTX 1050 Ti Max-Q *
Radeon Pro Vega 16
WX Vega M GL
Radeon R9 M485X
Quadro M3000M
FirePro W7170M
Radeon R9 M395
GeForce GTX 1050 Max-Q *
Radeon 660M
Radeon Pro WX 4150 *
Radeon RX 560X (Laptop)
Radeon RX 560 (Laptop)
Radeon RX 460 (Laptop)
Quadro P1000
Radeon R9 M390
Xe MAX
Radeon Pro 560X
Radeon Pro 560
Radeon Pro 460
Radeon Pro WX 4130 *
GeForce GTX 960M
Quadro P620 *
Radeon RX 550X (Laptop)
Radeon Pro WX 3200 *
Radeon Pro 555X
Radeon Pro 555
Radeon Pro 455
Quadro P600
Quadro M2000M
Radeon RX 540X *
Radeon Pro WX 2100 *
Radeon Pro WX 3100 *
GeForce GTX 950M
Radeon Pro 450
Radeon 630
Radeon 540X *
Radeon R9 M385X
Quadro P520
Quadro M1000M
GeForce 945M
Quadro P500 *
Iris Plus Graphics G7 (Ice Lake 64 EU) *
Vega 10 *
Iris Pro Graphics 580
FirePro W5170M *
Radeon R9 M370X
Vega 9
FirePro W5130M
UHD Graphics Xe G4 48EUs *
UHD Graphics 32EUs
UHD Graphics Xe 32EUs (Tiger Lake-H) *
UHD Graphics 750
Vega 7
Radeon R7 M465
Iris Pro Graphics 6200
Vega 8
GeForce 940M
Iris Plus Graphics G4 (Ice Lake 48 EU)
Quadro M600M
FirePro W4190M
Radeon R9 M375
Radeon R7 M445
Iris Plus Graphics 650
Iris Graphics 550
Radeon 625
Vega 6 *
Iris Plus Graphics 640
Iris Graphics 540
UHD Graphics 24EUs (Alder Lake-N) *
Radeon R7 M360
GeForce 920M
Radeon 620
Radeon R7 M340
Radeon 610
Radeon 610M *
Vega 6 *
UHD Graphics G1 (Ice Lake 32 EU)
UHD Graphics Xe 16EUs (Tiger Lake-H) *
HD Graphics 530
Radeon R5 (Bristol Ridge)
Adreno 690 *
Adreno 685 *
Adreno 680 *
Radeon R5 M330
GeForce 910M
HD Graphics 520

Class 4

UHD Graphics 730
Radeon R5 M320 *
Radeon R5 M315 *
Radeon R5 M420 *
Vega 2 *
UHD Graphics 617
UHD Graphics 615
HD Graphics 515
UHD Graphics 610
HD Graphics 510
UHD Graphics 605
Radeon R4 (Stoney Ridge)
Radeon R2 (Stoney Ridge)
HD Graphics (Broadwell)
UHD Graphics 600
HD Graphics (Braswell)

Class 5

* Approximate position of the graphics adapter