


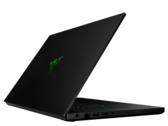
雷蛇灵刃15标准版(i7-8750H,GTX 1060 Max-Q)笔记本电脑评测
令人惊讶的是,雷蛇灵刃15标准版在一些方面甚至比高级版更好,并在售价上比高级版低了几千元。这篇评测将告诉你雷蛇是如何在适合的地方做出改动以打造这台更加实惠的灵刃15。
Intel Core i7-8750H, NVIDIA GeForce GTX 1060 Max-Q, 15.6", 2 kg
英伟达GeForce GTX 1060 Max-Q 是Pascal系列中的高端移动显卡。它专为轻薄型笔记本电脑而设计,比普通笔记本电脑GTX 1060慢10-15%左右。基本频率(1063-1265 MHz)也比常规GTX 1060(1506 MHz,至少少16%)低很多,睿频(1341-1480 MHz)也比1708 MHz低得多(至少少13%),但是,内存时钟频率是相同的。
时钟频率不是它与常规GTX 1060的唯一区别。Max-Q版本的驱动程序针对效能进行了优化(而不是性能;仅针对Max-Q模型),拥有1V的优化电压转换器,高端冷却方案以及40dB的风扇噪声限制(确保在任何时候可以调整的时钟频率)。
特点
GP106芯片采用台积电16nm FinFET制造,提供了DisplayPort 1.4(Ready),HDMI 2.0b,HDR,同时多投影(SMP)以及改进后的H.265视频解码和编码(PlayReady3.0)的功能。在我们关于Pascal架构的文章中,可以找到改进和功能的列表。
根据英伟达的说法,Max-Q设计方案的功耗明显低于普通的为普通笔记本电脑而配备的GTX 1060,功耗范围在60到70瓦之间(TGP)。
GeForce GTX 1000 Series
| ||||||||||||||||||||||||||||||||||||||||||||||||||||||||||||||||
| Codename | N17P-G1 Max-Q | |||||||||||||||||||||||||||||||||||||||||||||||||||||||||||||||
| Architecture | Pascal | |||||||||||||||||||||||||||||||||||||||||||||||||||||||||||||||
| Pipelines | 1280 - unified | |||||||||||||||||||||||||||||||||||||||||||||||||||||||||||||||
| Core Speed | 1063 - 1265 - 1341 - 1480 (Boost) MHz | |||||||||||||||||||||||||||||||||||||||||||||||||||||||||||||||
| Memory Speed | 8000 MHz | |||||||||||||||||||||||||||||||||||||||||||||||||||||||||||||||
| Memory Bus Width | 192 Bit | |||||||||||||||||||||||||||||||||||||||||||||||||||||||||||||||
| Memory Type | GDDR5 | |||||||||||||||||||||||||||||||||||||||||||||||||||||||||||||||
| Max. Amount of Memory | 6.144 MB | |||||||||||||||||||||||||||||||||||||||||||||||||||||||||||||||
| Shared Memory | no | |||||||||||||||||||||||||||||||||||||||||||||||||||||||||||||||
| API | DirectX 12_1, OpenGL 4.5 | |||||||||||||||||||||||||||||||||||||||||||||||||||||||||||||||
| Power Consumption | 60 - 70 Watt | |||||||||||||||||||||||||||||||||||||||||||||||||||||||||||||||
| Transistor Count | 4.4 Billion | |||||||||||||||||||||||||||||||||||||||||||||||||||||||||||||||
| Man. Technology | 16 nm | |||||||||||||||||||||||||||||||||||||||||||||||||||||||||||||||
| Features | Multi-Projection, VR Ready, G-SYNC, Vulkan, Multi Monitor | |||||||||||||||||||||||||||||||||||||||||||||||||||||||||||||||
| Notebook Size | large | |||||||||||||||||||||||||||||||||||||||||||||||||||||||||||||||
| Date of Announcement | 30.05.2017 | |||||||||||||||||||||||||||||||||||||||||||||||||||||||||||||||
The following benchmarks stem from our benchmarks of review laptops. The performance depends on the used graphics memory, clock rate, processor, system settings, drivers, and operating systems. So the results don't have to be representative for all laptops with this GPU. For detailed information on the benchmark results, click on the fps number.


| low | med. | high | ultra | QHD | 4K | |
|---|---|---|---|---|---|---|
| Far Cry 5 | 110 | 70 | 65 | 48 | 20 | |
| Kingdom Come: Deliverance | 85 | 62 | 54 | 40 | 12 | |
| Final Fantasy XV Benchmark | 91 | 53 | 38 | 14.6 | ||
| Fortnite | 178 | 132.6 | 115.7 | 72.8 | ||
| Star Wars Battlefront 2 | 135.5 | 93.4 | 81.5 | 62.2 | ||
| Need for Speed Payback | 117.9 | 89.1 | 78.5 | 66.6 | 23.8 | |
| Call of Duty WWII | 174.9 | 163.3 | 91.9 | 70.9 | 31.3 | |
| Assassin´s Creed Origins | 77 | 67 | 62 | 52 | 21 | |
| Destiny 2 | 94.7 | 85.4 | 71.4 | 17.6 | ||
| ELEX | 108.1 | 83.5 | 69.6 | 57.2 | 17 | |
| Middle-earth: Shadow of War | 128 | 82 | 62 | 47 | 22 | |
| FIFA 18 | 290.6 | 277.9 | 252.3 | 245.7 | 130 | |
| Ark Survival Evolved | 109 | 48 | 35.5 | 25.6 | 8.5 | |
| F1 2017 | 94 | 88 | 58 | 26 | ||
| Playerunknown's Battlegrounds (PUBG) | 141.9 | 92.5 | 85.6 | 63.3 | 12.9 | |
| Dirt 4 | 122 | 89 | 48 | 28.8 | ||
| Rocket League | 250 | 205 | 145 | 56.5 | ||
| Prey | 121 | 105 | 91 | 31 | ||
| Ghost Recon Wildlands | 65 | 58.7 | 33.2 | 19.4 | ||
| For Honor | 92.3 | 87.8 | 63.9 | 25.7 | ||
| Resident Evil 7 | 169 | 93 | 76.1 | 25.1 | ||
| Watch Dogs 2 | 101 | 56.8 | 39.4 | 18.9 | ||
| Dishonored 2 | 85.4 | 64.7 | 54.8 | 23.7 | ||
| Call of Duty Infinite Warfare | 124 | 91.6 | 81.7 | 34.6 | ||
| Titanfall 2 | 144 | 79 | 67.3 | 24.8 | ||
| Battlefield 1 | 154 | 76 | 67.8 | 25.3 | ||
| Mafia 3 | 55.7 | 38 | ||||
| FIFA 17 | 330 | 250 | 248 | 95.2 | ||
| Deus Ex Mankind Divided | 110.3 | 93 | 51 | 27 | 16 | |
| Mirror's Edge Catalyst | 130 | 66.4 | 59.6 | 20.5 | ||
| Overwatch | 299.2 | 266.2 | 165 | 103 | 50.3 | |
| Doom | 127 | 91.1 | 86.2 | 28.4 | ||
| Ashes of the Singularity | 75.8 | 61 | 53 | 21 | ||
| The Division | 127 | 61.9 | 48.8 | 22.1 | ||
| Far Cry Primal | 81 | 71 | 53 | 22 | ||
| Rise of the Tomb Raider | 173 | 124 | 69 | 56 | 24 | |
| Rainbow Six Siege | 224 | 126 | 102 | 37.3 | ||
| Star Wars Battlefront | 188 | 93 | 80.9 | 29.3 | ||
| Assassin's Creed Syndicate | 82.6 | 65.8 | 29.4 | 22.2 | ||
| Fallout 4 | 76 | 63 | 25.8 | |||
| Metal Gear Solid V | 60 | 60 | 42 | |||
| Batman: Arkham Knight | 129 | 77 | 51 | 26 | ||
| The Witcher 3 | 190 | 128 | 64 | 36 | 24 | |
| GTA V | 156.8 | 151.6 | 106.5 | 61.8 | 53.7 | |
| Middle-earth: Shadow of Mordor | 170.2 | 139.9 | 96.7 | 76.9 | ||
| Thief | 117.2 | 112 | 107.6 | 66 | ||
| Total War: Rome II | 53.7 | |||||
| Company of Heroes 2 | 68.9 | 65.7 | 63.4 | 40 | ||
| GRID 2 | 210.8 | 152.8 | 143.3 | 116.7 | ||
| Metro: Last Light | 69 | |||||
| BioShock Infinite | 272 | 222 | 199 | 102 | ||
| Tomb Raider | 308.4 | 277.7 | 170.5 | 115.6 | ||
| Hitman: Absolution | 105.8 | 101 | 88.7 | 70 | ||
| Guild Wars 2 | 45.7 | |||||
| Sleeping Dogs | 218.4 | 192.7 | 164.7 | 69.5 | ||
| Dirt 3 | 140.1 | 126.3 | 112.2 | 64.5 | ||
| low | med. | high | ultra | QHD | 4K | < 30 fps < 60 fps < 120 fps ≥ 120 fps | 12 17 | 3 21 27 | 8 36 9 | 3 19 28 2 | | 31 8 1 1 |
For more games that might be playable and a list of all games and graphics cards visit our Gaming List
MSI P65 Creator 8RE-028NL: Intel Core i7-8750H, 15.60", 1.8 kg
External Review » MSI P65 Creator 8RE-028NL
Asus Zephyrus M GM501GM-EI005T: Intel Core i7-8750H, 15.60", 2.5 kg
External Review » Asus Zephyrus M GM501GM-EI005T
Dell G3 15 3579-CN35713: Intel Core i7-8750H, 15.60", 2.5 kg
External Review » Dell G3 15 3579-CN35713
Dell G5 15 5587-M2NXM: Intel Core i5-8300H, 15.60", 2.9 kg
External Review » Dell G5 15 5587-M2NXM
MSI P65 8RE-042CZ: Intel Core i7-8750H, 15.60", 1.8 kg
External Review » MSI P65 8RE-042CZ
Razer Blade 15 Base Model: Intel Core i7-8750H, 15.60", 2 kg
External Review » Razer Blade 15 Base Model
Dell Vostro 15 7580: Intel Core i5-8300H, 15.60", 2.8 kg
External Review » Dell Vostro 15 7580
HP Gaming Pavilion 15-cx0005ng: Intel Core i7-8750H, 15.60", 2.3 kg
External Review » HP Gaming Pavilion 15-cx0005ng
Dell G7 15-7588: Intel Core i7-8750H, 15.60", 2.6 kg
External Review » Dell G7 15-7588
Dell G5 15 5587-M36TX: Intel Core i7-8750H, 15.60", 2.9 kg
External Review » Dell G5 15 5587-M36TX
Dell G5 15 5587-CN55802: Intel Core i5-8300H, 15.60", 2.7 kg
External Review » Dell G5 15 5587-CN55802
Dell Inspiron 15 7577-0098: Intel Core i7-7700HQ, 15.60", 2.7 kg
External Review » Dell Inspiron 15 7577-0098
Dell Inspiron 15 7000 7577: Intel Core i5-7300HQ, 15.60", 2.7 kg
External Review » Dell Inspiron 15 7000 7577
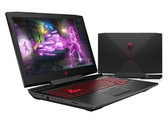
HP Omen 15-ce002ng: Intel Core i7-7700HQ, 15.60", 2.6 kg
External Review » HP Omen 15-ce002ng
» Comparison of GPUs
Detailed list of all laptop GPUs sorted by class and performance.
» Benchmark List
Sort and restrict laptop GPUs based on performance in synthetic benchmarks.
» Notebook Gaming List
Playable games for each graphics card and their average FPS results.
* Approximate position of the graphics adapter
» Notebookcheck多媒体笔记本电脑Top 10排名
» Notebookcheck游戏笔记本电脑Top 10排名
» Notebookcheck低价办公/商务笔记本电脑Top 10排名
» Notebookcheck高端办公/商务笔记本电脑Top 10排名
» Notebookcheck工作站笔记本电脑Top 10排名
» Notebookcheck亚笔记本电脑Top 10排名
» Notebookcheck超级本产品Top 10排名
» Notebookcheck变形本产品Top 10排名
» Notebookcheck平板电脑Top 10排名
» Notebookcheck智能手机Top 10排名
» Notebookcheck评测过最出色的笔记本电脑屏幕
» Notebookcheck售价500欧元以下笔记本电脑Top 10排名
» Notebookcheck售价300欧元以下笔记本电脑Top 10排名