Notebookcheck Logo

NVIDIA GeForce GT 335M

NVIDIA GeForce GT 335M

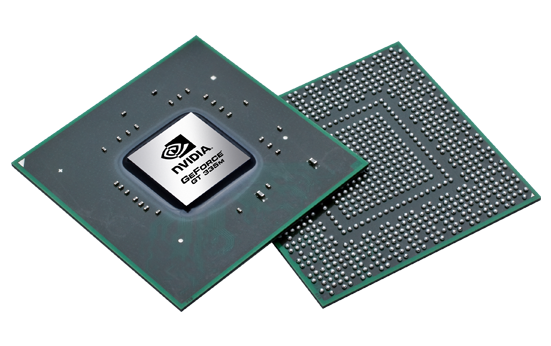
NVIDIA GeForce GT 335M(有时也被称为的GeForce G335M)是中产阶层的游戏笔记本电脑一台笔记本电脑的图形卡。它是基于GT215核心(例如GTS 350M),但功能只有72个着色器内核和24个纹理贴图单元。因此,GT 335M比GT 330M提供更多的着色,但由于较低的时钟速度,性能是不是要好得多。 GTS车型相比,GT 335M不支持GDDR5。的GT335M的3D性能,是中产阶层的Mobility Radeon HD 5650的水平上。因此,在2010年的所有比赛,GPU的速度不够快。要求苛刻的游戏,如“地铁2033”,“战地BC2或”孤岛危机“只运行在中低细节流利。 MW2或模拟人生3的义务,如呼叫要求不高的游戏可以发挥在高细节的设置(见下面的基准)。至于其他的GeForce®(精视™)300M卡,GT335M提供的PureVideo HD(VP4)的高清视频解码加速。这意味着,在GPU提供完整的解码的MPEG-1,MPEG-2,MPEG-4 ASP,VC-1/WMV9和H.264标准的视频。此外,CUDA,OpenCL的,和DirectX计算允许使用的核心通用计算(例如,视频编码)。

GeForce GT 300M Series

GeForce GT 335M 72 @ 0.45 GHz128 Bit @ 1066 MHz
GeForce GT 330M 48 @ 0.58 GHz128 Bit @ 1066 MHz
GeForce GT 325M 48 @ 0.45 GHz128 Bit @ 1066 MHz
GeForce GT 320M 24 @ 0.5 GHz128 Bit @ 790 MHz
CodenameN11P-GS1
ArchitectureGT200
Pipelines72 - unified
Core Speed450 MHz
Shader Speed1080 MHz
Memory Speed1066 MHz
Memory Bus Width128 Bit
Memory TypeDDR3, GDDR3
Max. Amount of Memory1024 MB
Shared Memoryno
APIDirectX 10.1, Shader 4.1
Man. Technology40 nm
FeaturesDirectX Compute Support (Windows 7), CUDA, OpenCL, HybridPower, PhysX, SLI, Powermizer 8.0, MXM 3.0 Type-B, 72 Shader, 24 Texture Mapping Units, 8 Render Output Units
Notebook Sizemedium sized
Date of Announcement07.01.2010
Information223 GFlops
Link to Manufacturer Pagewww.nvidia.com

Benchmarks

3DMark Vantage
3DM Vant. Perf. total +
3DMark Vantage - 3DM Vant. Perf. total
min: 2697     avg: 3015     median: 3106 (1%)     max: 3234 Points
3DM Vant. Perf. GPU no PhysX +
3DMark Vantage - 3DM Vant. Perf. GPU no PhysX
min: 2592     avg: 2624     median: 2633 (1%)     max: 2651 Points
ATI Radeon HD 3200
62 -98%
...
2322 -12%
2362 -10%
NVIDIA Quadro FX 2700M
2392 -9%
2441 -7%
NVIDIA GeForce 9700M GTS
2453 -7%
2478 -6%
2527 -4%
ATI Mobility Radeon HD 4670
2552 -3%
2593 -1%
NVIDIA GeForce GT 335M
2624
2674 2%
2711 3%
2731 4%
2800 7%
2801 7%
2803 7%
2865 9%
2914 11%
2927 12%
...
132443 4947%
max:
173912 6528%
0%
100%
Restrict / Search: Model: Max. age: years
3DMark 2001SE - 3DMark 2001 - Standard
min: 17887     avg: 18184     median: 18184 (19%)     max: 18481 Points
3DMark 03 - 3DMark 03 - Standard
min: 15146     avg: 17170     median: 16836.5 (9%)     max: 19526 Points
3DMark 05 - 3DMark 05 - Standard
min: 9798     avg: 12228     median: 13115 (14%)     max: 13782 Points
Intel Graphics Media Accelerator (GMA) 500
133.4 -99%
...
11469 -6%
NVIDIA Quadro FX 1700M
11550 -6%
Intel HD Graphics 520
11565 -5%
AMD Radeon HD 8550G
11672 -5%
NVIDIA GeForce 8800M GTS
11777 -4%
NVIDIA GeForce GT 240M
11811 -3%
11853 -3%
11878 -3%
Intel UHD Graphics 610
12054 -1%
NVIDIA GeForce GT 335M
12228
12278 0%
12418 2%
AMD Radeon HD 8650G
12469 2%
12505 2%
12573 3%
12578 3%
12591 3%
ATI Mobility Radeon HD 4650
12609 3%
ATI Mobility Radeon HD 4670
12614 3%
...
68868 463%
max:
87172 613%
0%
100%
Restrict / Search: Model: Max. age: years
3DMark 06 3DMark 06 - Standard 1366x768 +
3DMark 06
7700 Points (10%)
3DMark 06 - Standard 1280x1024 +
3DMark 06
min: 5958     avg: 6544     median: 6892 (9%)     max: 6950 Points
3DMark 06 - Standard 1280x800 +
3DMark 06
7520 Points (10%)
3DMark 06 - Standard 1280x768 +
3DMark 06
min: 6462     avg: 6995     median: 6973 (9%)     max: 7549 Points
Unigine Heaven 2.1 - Heaven 2.1 high
16.5 fps (3%)
Restrict / Search: Model: Max. age: years
Windows 7 Experience Index - Win7 Gaming graphics
min: 6.2     avg: 6.3     median: 6.2 (78%)     max: 6.5 Points
Windows 7 Experience Index - Win7 Graphics
min: 3.2     avg: 5     median: 4.5 (57%)     max: 6.5 Points
Cinebench R10 Cinebench R10 Shading (32bit) +
Cinebench R10 - Cinebench R10 Shading (32bit)
min: 2446     avg: 3580     median: 3790.5 (3%)     max: 4294 points
Cinebench R11.5 Cinebench R11.5 OpenGL 64 Bit +
Cinebench R11.5 - Cinebench R11.5 OpenGL 64 Bit
min: 16.12     avg: 17.2     median: 17.6 (6%)     max: 18.47 fps
- Range of benchmark values
red legend - Average benchmark values
* Smaller numbers mean a higher performance

Game Benchmarks

The following benchmarks stem from our benchmarks of review laptops. The performance depends on the used graphics memory, clock rate, processor, system settings, drivers, and operating systems. So the results don't have to be representative for all laptops with this GPU. For detailed information on the benchmark results, click on the fps number.

Fifa 11

Fifa 11

2010
low 800x600
308  fps    + Compare + 📈 Graph
med. 1024x768
153  fps    + Compare + 📈 Graph
high 1360x768
98.2  fps    + Compare + 📈 Graph
» With all tested laptops playable in detail settings high.
low 1024x768
164  fps    + Compare + 📈 Graph
med. 1360x768
45.4  fps    + Compare + 📈 Graph
high 1360x768
30.6  fps    + Compare + 📈 Graph
ultra 1920x1080
16.1  fps    + Compare + 📈 Graph
» With all tested laptops playable in detail settings med..
low 800x600
29.1  fps    + Compare
med. 1360x768
24  fps    + Compare
» The benchmarks indicate that the game is not playable in the tested settings.
low 1024x768
55  fps    + Compare
med. 1366x768
32.4 34.9 35.4 ~ 34 fps    + Compare + 📈 Graph
high 1366x768
24.2 24.3 24.4 ~ 24 fps    + Compare + 📈 Graph
» With all tested laptops playable in detail settings low.
low 800x600
65.2 123 ~ 94 fps    + Compare
med. 1024x768
36 38.6 39.4 42 ~ 39 fps    + Compare + 📈 Graph
high 1366x768
30.9 33.2 34.7 35.6 ~ 34 fps    + Compare + 📈 Graph
» With all tested laptops playable in detail settings med..
Risen

Risen

2009
low 800x600
51.6 61.9 ~ 57 fps    + Compare
med. 1024x768
29 29.4 33.6 ~ 31 fps    + Compare + 📈 Graph
high 1366x768
21.2 21.2 23.2 ~ 22 fps    + Compare + 📈 Graph
» With all tested laptops playable in detail settings low.
Need for Speed Shift

Need for Speed Shift

2009
med. 1024x768
23.5 31.2 32.3 ~ 29 fps    + Compare + 📈 Graph
high 1366x768
28.2 29.5 30.2 ~ 29 fps    + Compare + 📈 Graph
» The benchmarks indicate that the game is not playable in the tested settings.
Colin McRae: DIRT 2

Colin McRae: DIRT 2

2009
low 800x600
42.5 67.9 ~ 55 fps    + Compare
med. 1024x768
32.4 34.8 46.8 49.2 ~ 41 fps    + Compare
high 1360x768
26.8 30.2 31.7 33.1 ~ 30 fps    + Compare
» With most tested laptops playable in detail settings med..
Anno 1404

Anno 1404

2009
low 1024x768
51.7 57.8 107.8 ~ 72 fps    + Compare + 📈 Graph
ultra 1280x1024
23.5 24.8 24.8 ~ 24 fps    + Compare + 📈 Graph
» With all tested laptops playable in detail settings low.
F.E.A.R. 2

F.E.A.R. 2

2009
low 800x600
75.5 144.5 ~ 110 fps    + Compare
med. 1024x768
46.9 47.2 62.6 63.6 ~ 55 fps    + Compare + 📈 Graph
high 1280x1024
36.8 36.9 39.4 39.6 ~ 38 fps    + Compare + 📈 Graph
» With all tested laptops playable in detail settings high.
Far Cry 2

Far Cry 2

2008
low 640x480
51.2  fps    + Compare
high 1024x768
31.1  fps    + Compare
» With all tested laptops playable in detail settings low.
Crysis - GPU Benchmark

Crysis - GPU Benchmark

2007
low 1024x768
58.3 73.2 ~ 66 fps    + Compare
med. 1024x768
28 34.8 43.4 43.8 ~ 38 fps    + Compare
high 1024x768
22.5 22.7 24.9 25.2 26.1 ~ 24 fps    + Compare
» With most tested laptops playable in detail settings med..
Crysis - CPU Benchmark

Crysis - CPU Benchmark

2007
low 1024x768
71 84.6 ~ 78 fps    + Compare
med. 1024x768
26.9 30 42.6 42.9 ~ 36 fps    + Compare
high 1024x768
20.7 21.3 22.3 22.6 23.1 ~ 22 fps    + Compare
» With most tested laptops playable in detail settings med..
Call of Juarez Benchmark

Call of Juarez Benchmark

2006
high 1024x768
17.3  fps    + Compare
» The benchmarks indicate that the game is not playable in the tested settings.
lowmed.highultraQHD4K
Fifa 1130815398.2
StarCraft 216445.430.616.1
Metro 203329.124
Battlefield: Bad Company 2553424
CoD Modern Warfare 2943934
Risen573122
Need for Speed Shift2929
Colin McRae: DIRT 2554130
Anno 14047224
F.E.A.R. 21105538
Far Cry 251.231.1
Crysis - GPU Benchmark663824
Crysis - CPU Benchmark783622
Call of Juarez Benchmark17.3
lowmed.highultraQHD4K
< 30 fps
< 60 fps
< 120 fps
≥ 120 fps
1
4
5
2
2
8

1
6
5
1
2


For more games that might be playable and a list of all games and graphics cards visit our Gaming List

Amazon Logo
  • $84.99
    ASUS GeForce GT 730 2GB GDDR5 Low Profile Graphics Card for Silent HTPC Builds (with I/O Port Brackets)
  • $17.24
    NVIDIA GeForce GT 520M N12P-GV 1GB DDR3 MXM 3.0 VGA VIDEO CARD for Laptop
  • $82.99
    ASUS NVIDIA GeForce GT 730 Graphics Card (PCIe 2.0, 2GB GDDR5 Memory, 4X HDMI Ports, Single-Slot Design, Passive Cooling)
  • $11.49
    Laptop Graphics Video Card G98-730-U2 489548-001 Compatible Replacement Spare Part for Nvidia GeForce 9300M GS Mustang 256MB
  • $685.00
    HP Victus 15.6" Full HD 144Hz Gaming Laptop, Intel Core i5-12450H, NVIDIA GeForce RTX 3050,16GB RAM, 512GB PCIe SSD, Wi-Fi 6, Backlit Keyboard,Windows 11 Pro, Performance Blue

v1.35
log 13. 04:44:40

#0 ran 0s before starting gpusingle class +0s ... 0s

#1 no ids found in url (should be separated by "_") +0s ... 0s

#2 not redirecting to Ajax server +0s ... 0s

#3 did not recreate cache, as it is less than 5 days old! Created at Tue, 10 Mar 2026 11:04:42 +0100 +0.003s ... 0.003s

#4 no comparison url found in template nbc.compare_page_1 needed +0.015s ... 0.017s

#5 no comparison url found in template nbc.compare_page_1 needed +0s ... 0.018s

#6 no comparison url found in template nbc.compare_page_1 needed +0s ... 0.018s

#7 composed specs +0s ... 0.018s

#8 did output specs +0s ... 0.018s

#9 start showIntegratedCPUs +0s ... 0.018s

#10 getting avg benchmarks for device 1599 +0.016s ... 0.034s

#11 got single benchmarks 1599 +0.026s ... 0.06s

#12 got avg benchmarks for devices +0s ... 0.06s

#13 min, max, avg, median took s +0.492s ... 0.552s

#14 before gaming benchmark output +0s ... 0.552s

#15 Got 91 rows for game benchmarks. +0.006s ... 0.558s

#16 composed SQL query for gamebenchmarks +0s ... 0.558s

#17 got data and put it in $dataArray +0.007s ... 0.565s

#18 benchmarks composed for output. +0.123s ... 0.688s

#19 no comparison url found in template nbc.compare_page_1 needed +0.304s ... 0.992s

#20 return log +0s ... 0.992s

No reviews found.

Please share our article, every link counts!
Mail Logo

» Comparison of GPUs
Detailed list of all laptop GPUs sorted by class and performance.

» Benchmark List
Sort and restrict laptop GPUs based on performance in synthetic benchmarks.

» Notebook Gaming List
Playable games for each graphics card and their average FPS results.

Class 1

Class 2

GeForce RTX 2080 Super Mobile
RTX PRO 2000 Blackwell Generation Laptop
M5 Max 32-Core GPU *
M1 Max 32-Core GPU *
M1 Max 24-Core GPU *
GeForce RTX 2070 Super Mobile
Radeon 8050S
Quadro RTX 5000 Max-Q
Radeon RX 5700M *
Quadro RTX 4000 (Laptop)
GeForce GTX 1080 Mobile
M1 Pro 16-Core GPU *
Radeon PRO W6600M *
GeForce RTX 2070 Super Max-Q
RTX PRO 1000 Blackwell Generation Laptop *
M1 Pro 14-Core GPU *
Quadro RTX 4000 Max-Q
Quadro P5200
Quadro RTX 3000 Max-Q
Quadro P4200
Radeon 8040S *
Pro A60M *

Class 3

Quadro P5000 Max-Q *
Quadro P4000
Arc 140T
Quadro P4000 Max-Q
Quadro P3200
Radeon RX 580X (Laptop) *
Radeon RX 580 (Laptop)
Pro A30M
Radeon Pro 5300M
Radeon RX 5300M
Quadro P3000 Max-Q *
Quadro T2000 Max-Q
Radeon RX 570X (Laptop) *
Radeon RX 570 (Laptop) *
Quadro T1000 Max-Q *
Vega M GH
GeForce GTX 1050 Ti Mobile
GeForce GTX 1050 Ti Max-Q
Radeon 680M
Quadro P2000
Quadro P2000 Max-Q
T500 Laptop GPU
Arc 130T
Radeon Pro Vega 16
WX Vega M GL
GeForce GTX 1050 Max-Q
Radeon 660M
Radeon Pro WX 4150 *
Radeon RX 560X (Laptop)
Radeon RX 560 (Laptop)
Quadro P1000
Xe MAX
Radeon Pro 560X
Radeon Pro 560
Quadro P620
Radeon RX 550X (Laptop)
Radeon Pro WX 3200 *
Radeon Pro 555X
Radeon Pro 555
Quadro P600
Graphics 3-Core iGPU (Arrow Lake) *
Radeon Pro WX 2100 *
Radeon Pro WX 3100 *
Graphics 2-Core iGPU (Arrow Lake) *
Radeon 630
Quadro P520
Radeon RX 540X *
Radeon 540X *
Quadro P500 *
Vega 10
Vega 9
Iris Plus Graphics G7 (Ice Lake 64 EU) *
UHD Graphics 32EUs
UHD Graphics 750
Vega 7
UHD Graphics Xe 32EUs (Tiger Lake-H)
UHD Graphics Xe G4 48EUs
Vega 8
UHD Graphics 730
Iris Plus Graphics G4 (Ice Lake 48 EU)
Iris Plus Graphics 650
Radeon 625
Vega 6 *
Iris Plus Graphics 640
UHD Graphics 24EUs (Alder Lake-N) *
GeForce 920M
Radeon 620
Radeon 610
Radeon 610M *
Vega 6 *
UHD Graphics Xe 16EUs (Tiger Lake-H) *
UHD Graphics G1 (Ice Lake 32 EU)
Adreno 690 *
Adreno 685 *
Adreno 680 *
GeForce 910M

Class 4

* Approximate position of the graphics adapter