


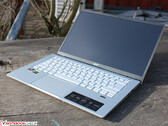
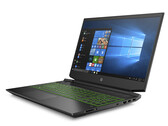
配备GTX1650的宏碁Swift X SFX14回顾: 斯威夫特Ryzen笔记本电脑
宏碁的14英寸笔记本具备了移动游戏超极本的条件。虽然2020年的图灵图形不是最新和最伟大的,但它在19毫米厚的外壳中与Ryzen 5000搭配,提供了适度的游戏能力。构建质量很扎实,显示效果也出奇的好。
AMD Ryzen 5 5500U, NVIDIA GeForce GTX 1650 Mobile, 14", 1.4 kg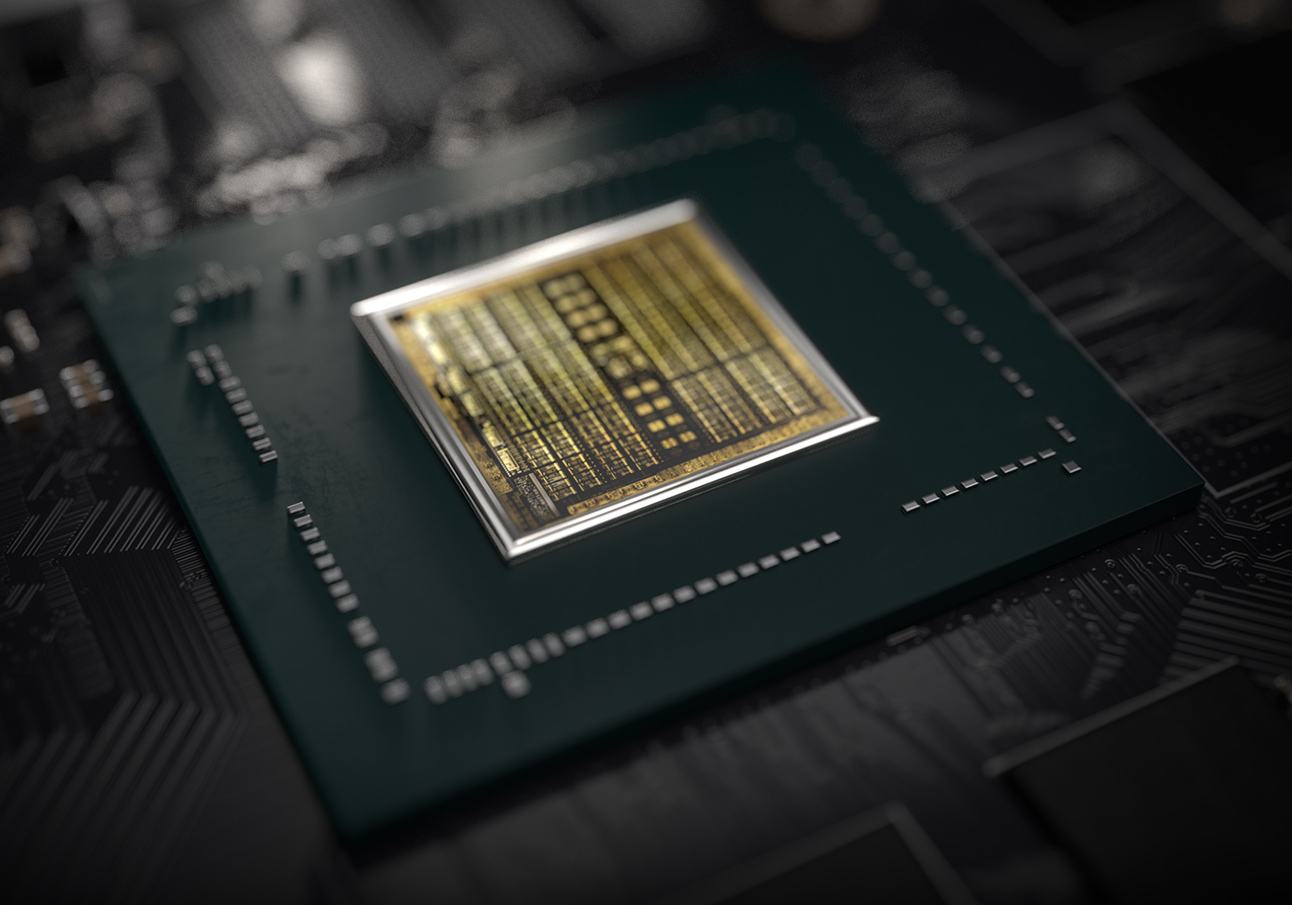
用于笔记本电脑的Nvidia GeForce GTX 1650是基于Turing架构(TU117芯片)的移动图形卡。与更快的RTX 2000 GPU(例如RTX 2060)相比,1650没有集成Raytracing或Tensor内核。性能应该比旧的GeForce GTX 1050 Ti强一点。与台式机版本相比,笔记本版GTX1650的TU117芯片有1024个着色器。
Turing一代不仅为RTX卡引入了光追,而且还优化了内核和缓存的体系结构。根据Nvidia的说法,CUDA内核现在可以同时执行浮点和整数运算,以提高现代游戏中计算繁重的工作负载的性能。此外,对缓存进行了重新设计(新的统一内存体系结构的缓存是Pascal的两倍)。与Pascal相比,这使得每个时钟指令增加50%,能耗提高40%。
与较大的Turing芯片(例如GTX 1660 Ti的TU116和RTX系列)相比,TU117不包括新的NVENC编码器,而是较旧的类似于Pascal和Volta中使用的编码器。
Nvidia将笔记本电脑1650的功耗定为50瓦TGP(总图形功率),比1650的Max-Q版本高15瓦。TU117芯片采用12nm FFN台积电工艺。
GeForce GTX 1600 Series
| ||||||||||||||||||||||||||||||||||
| Codename | N18P-G0, N18P-G61 | |||||||||||||||||||||||||||||||||
| Architecture | Turing | |||||||||||||||||||||||||||||||||
| Pipelines | 1024 - unified | |||||||||||||||||||||||||||||||||
| TMUs | 56 | |||||||||||||||||||||||||||||||||
| ROPs | 32 | |||||||||||||||||||||||||||||||||
| Core Speed | 1380 - 1560 (Boost) MHz | |||||||||||||||||||||||||||||||||
| Memory Speed | 12000 effective = 1500 MHz | |||||||||||||||||||||||||||||||||
| Memory Bus Width | 128 Bit | |||||||||||||||||||||||||||||||||
| Memory Type | GDDR5, GDDR6 | |||||||||||||||||||||||||||||||||
| Max. Amount of Memory | 4 GB | |||||||||||||||||||||||||||||||||
| Shared Memory | no | |||||||||||||||||||||||||||||||||
| Memory Bandwidth | 192 GB/s | |||||||||||||||||||||||||||||||||
| API | DirectX 12_1, OpenGL 4.6 | |||||||||||||||||||||||||||||||||
| Power Consumption | 50 Watt | |||||||||||||||||||||||||||||||||
| Man. Technology | 12 nm | |||||||||||||||||||||||||||||||||
| PCIe | 4.0 | |||||||||||||||||||||||||||||||||
| Notebook Size | medium sized | |||||||||||||||||||||||||||||||||
| Date of Announcement | 23.04.2019 | |||||||||||||||||||||||||||||||||
| Link to Manufacturer Page | www.nvidia.com | |||||||||||||||||||||||||||||||||
The following benchmarks stem from our benchmarks of review laptops. The performance depends on the used graphics memory, clock rate, processor, system settings, drivers, and operating systems. So the results don't have to be representative for all laptops with this GPU. For detailed information on the benchmark results, click on the fps number.


For more games that might be playable and a list of all games and graphics cards visit our Gaming List
Dell G3 3590: Intel Core i5-9300H, 15.60", 2.5 kg
Review » 戴尔Dell G3 15 3590笔记本电脑评测:廉价且易升级
Dell XPS 15 7590 9980HK GTX 1650: Intel Core i9-9980HK, 15.60", 2 kg
Review » 势不可挡:Dell XPS 15 7590酷睿i9,GTX1650笔记本电脑评测
Acer Aspire Nitro 5 AN515-54-53Z2: Intel Core i5-9300H, 15.60", 2.2 kg
Review » 宏碁Nitro 5 (Core i5-9300H, GeForce GTX 1650) 笔记本电脑评测
Acer Nitro 5 AN515-57, GTX 1650: Intel Core i5-11400H, 15.60", 2.3 kg
External Review » Acer Nitro 5 AN515-57, GTX 1650
Lenovo IdeaPad 5 Pro 16ACH6-82L500VKMH: AMD Ryzen 7 5800H, 16.00", 1.9 kg
External Review » Lenovo IdeaPad 5 Pro 16ACH6-82L500VKMH
Acer Aspire 7 A715-76G: Intel Core i5-12450H, 15.60", 2.1 kg
External Review » Acer Aspire 7 A715-76G
HP Victus 15-fa0031dx: Intel Core i5-12450H, 15.60", 2.3 kg
External Review » HP Victus 15-fa0031dx
Asus TUF Gaming F15 FX506LHB-HN324: Intel Core i5-10300H, 15.60", 2.3 kg
External Review » Asus TUF Gaming F15 FX506LHB-HN324
HP Victus 16-d0019ns: Intel Core i5-11400H, 16.10", 2.5 kg
External Review » HP Victus 16-d0019ns
HP Victus 16-e0085ns: AMD Ryzen 5 5600H, 16.10", 2.5 kg
External Review » HP Victus 16-e0085ns
HP Victus 15-fb0152ng: AMD Ryzen 5 5600H, 16.00", 2.3 kg
External Review » HP Victus 15-fb0152ng
MSI GF63 Thin 11SC: Intel Core i5-11400H, 15.60", 1.9 kg
External Review » MSI GF63 Thin 11SC
Lenovo IdeaPad Gaming 3 15IHU6-82K1019DSP: Intel Core i5-11320H, 15.60", 2.3 kg
External Review » Lenovo IdeaPad Gaming 3 15IHU6-82K1019DSP
HP Victus 15-fa0038nf: Intel Core i5-12450H, 15.60", 2.3 kg
External Review » HP Victus 15-fa0038nf
Lenovo IdeaPad Gaming 3 15ACH6-82K201SRSP: AMD Ryzen 5 5600H, 15.60", 2.3 kg
External Review » Lenovo IdeaPad Gaming 3 15ACH6-82K201SRSP
MSI Prestige 14 A12SC-086CA: Intel Core i7-1280P, 14.00", 1.6 kg
External Review » MSI Prestige 14 A12SC-086CA
HP Victus 15t-fa000: Intel Core i5-12450H, 15.60", 2.3 kg
External Review » HP Victus 15t-fa000
Lenovo IdeaPad Gaming 3 15ACH6-82K201HEMH: AMD Ryzen 5 5600H, 15.60", 2.3 kg
External Review » Lenovo IdeaPad Gaming 3 15ACH6-82K201HEMH
Asus TUF Gaming F15 FX506LH-AS51: Intel Core i5-10300H, 15.60", 2.3 kg
External Review » Asus TUF Gaming F15 FX506LH-AS51
Acer Nitro 5 AN515-55-72P7: Intel Core i7-10750H, 15.60", 2.5 kg
External Review » Acer Nitro 5 AN515-55-72P7
Lenovo IdeaPad 5 Pro 16ACH: AMD Ryzen 7 5800H, 16.00", 2 kg
External Review » Lenovo IdeaPad 5 Pro 16ACH
Acer Nitro 5 AN515-56-54DF: Intel Core i5-11300H, 15.60", 2.3 kg
External Review » Acer Nitro 5 AN515-56-54DF
Acer Nitro 5 AN515-56-51V8: Intel Core i5-11300H, 15.60", 2.3 kg
External Review » Acer Nitro 5 AN515-56-51V8
HP Victus 16-e0040ns: AMD Ryzen 5 5600H, 16.10", 2.5 kg
External Review » HP Victus 16-e0040ns
Lenovo IdeaPad Gaming 3 15ACH6-82K201DHMH: AMD Ryzen 5 5600H, 15.60", 2.3 kg
External Review » Lenovo IdeaPad Gaming 3 15ACH6-82K201DHMH
Lenovo ThinkBook 15p G2 ITH-21B1001LUS: Intel Core i7-11800H, 15.60", 1.9 kg
External Review » Lenovo ThinkBook 15p G2 ITH-21B1001LUS
HP Victus 16-e0010ns: AMD Ryzen 5 5600H, 16.10", 2.5 kg
External Review » HP Victus 16-e0010ns
Lenovo IdeaPad Gaming 3 15ACH6-82K200UTUS: AMD Ryzen 5 5600H, 15.60", 2.3 kg
External Review » Lenovo IdeaPad Gaming 3 15ACH6-82K200UTUS
Dell G15 5510-8R03T: Intel Core i5-10200H, 15.60", 2.7 kg
External Review » Dell G15 5510-8R03T
Asus Vivobook Pro 14 K3400, i5-11300H GTX 1650: Intel Core i5-11300H, 14.00", 1.4 kg
External Review » Asus Vivobook Pro 14 K3400, i5-11300H GTX 1650
HP Pavilion Gaming 15-ec2004ns: AMD Ryzen 7 5800H, 15.60", 2 kg
External Review » HP Pavilion Gaming 15-ec2004ns
HP Pavilion Gaming 15-ec2047AX: AMD Ryzen 5 5600H, 15.60", 2 kg
External Review » HP Pavilion Gaming 15-ec2047AX
HP Pavilion Gaming 15-ec2005ns: AMD Ryzen 5 5600H, 15.60", 2 kg
External Review » HP Pavilion Gaming 15-ec2005ns
Asus ROG Strix G513IC-HN004: AMD Ryzen 7 4800H, 15.60", 2.3 kg
External Review » Asus ROG Strix G513IC-HN004
MSI GF75 Thin 10SCXR: Intel Core i5-10300H, 17.30", 2.2 kg
External Review » MSI GF75 Thin 10SCXR
HP Pavilion Gaming 15-ec2002ns: AMD Ryzen 5 5600H, 15.60", 2 kg
External Review » HP Pavilion Gaming 15-ec2002ns
Acer Aspire 7 A715-42G-R1DD: AMD Ryzen 5 5500U, 15.60", 2.2 kg
External Review » Acer Aspire 7 A715-42G-R1DD
Lenovo IdeaPad Gaming 3 15ACH6-82K20015US: AMD Ryzen 5 5600H, 15.60", 2.3 kg
External Review » Lenovo IdeaPad Gaming 3 15ACH6-82K20015US
HP Pavilion Gaming 15-ec2009ns: AMD Ryzen 5 5600H, 15.60", 2 kg
External Review » HP Pavilion Gaming 15-ec2009ns
Acer Swift X SFX14-41G-R9KC: AMD Ryzen 5 5500U, 14.00", 1.5 kg
External Review » Acer Swift X SFX14-41G-R9KC
Lenovo IdeaPad Gaming 3 15IMH05-81Y400YFSP: Intel Core i7-10750H, 15.60", 2.2 kg
External Review » Lenovo IdeaPad Gaming 3 15IMH05-81Y400YFSP
HP Victus 16-e0004ns: AMD Ryzen 5 5600H, 16.10", 2.5 kg
External Review » HP Victus 16-e0004ns
HP Pavilion Gaming 15-ec2007ns: AMD Ryzen 5 5600H, 15.60", 2 kg
External Review » HP Pavilion Gaming 15-ec2007ns
Acer Nitro 5 AN515-55-56F5: Intel Core i5-10300H, 15.60", 2.3 kg
External Review » Acer Nitro 5 AN515-55-56F5
Acer Nitro 5 AN515-55-72GW: Intel Core i7-10750H, 15.60", 2.3 kg
External Review » Acer Nitro 5 AN515-55-72GW
HP Pavilion Gaming 15-ec2008ns: AMD Ryzen 5 5600H, 15.60", 2 kg
External Review » HP Pavilion Gaming 15-ec2008ns
Lenovo IdeaPad Gaming 3 15ARH05-82EY00RDSP: AMD Ryzen 5 4600H, 15.60", 2.2 kg
External Review » Lenovo IdeaPad Gaming 3 15ARH05-82EY00RDSP
Asus TUF Gaming F15 FX506LH-HN129: Intel Core i7-10875H, 15.60", 2.3 kg
External Review » Asus TUF Gaming F15 FX506LH-HN129
HP Pavilion Gaming 15z-ec200: AMD Ryzen 5 5600H, 15.60", 2.3 kg
External Review » HP Pavilion Gaming 15z-ec200
HP Pavilion Gaming 15-ec2025ns: AMD Ryzen 7 5800H, 15.60", 2.3 kg
External Review » HP Pavilion Gaming 15-ec2025ns
Asus ROG Strix G15 G513IH-HN008: AMD Ryzen 7 4800H, 15.60", 2.1 kg
External Review » Asus ROG Strix G15 G513IH-HN008
Lenovo Legion 5 17ACH6-82K0000RMH: AMD Ryzen 5 5600H, 17.30", 3 kg
External Review » Lenovo Legion 5 17ACH6-82K0000RMH
Lenovo IdeaPad Gaming 3 15ARH05-82EY00RESP: AMD Ryzen 7 4800H, 15.60", 2.2 kg
External Review » Lenovo IdeaPad Gaming 3 15ARH05-82EY00RESP
Asus TUF Gaming F15 FX506LH-HN042T: Intel Core i5-10300H, 15.60", 2.3 kg
External Review » Asus TUF Gaming F15 FX506LH-HN042T
Acer Swift X SFX14-41G-R2DS: AMD Ryzen 7 5700U, 14.00", 1.5 kg
External Review » Acer Swift X SFX14-41G-R2DS
Lenovo Ideapad L340-17IRH 81LL001YGE: Intel Core i5-9300H, 17.30", 2.5 kg
External Review » Lenovo Ideapad L340-17IRH 81LL001YGE
Lenovo Ideapad L340 17IRH-81LL003BMH: Intel Core i7-9750H, 17.30", 2.8 kg
External Review » Lenovo Ideapad L340 17IRH-81LL003BMH
HP Pavilion Gaming 15-ec2253ng: AMD Ryzen 5 5600H, 15.60", 2.3 kg
External Review » HP Pavilion Gaming 15-ec2253ng
Acer Aspire 7 A715-42G-R9LH: AMD Ryzen 7 5700U, 15.60", 2.2 kg
External Review » Acer Aspire 7 A715-42G-R9LH
HP Pavilion Gaming 15-ec1073dx: AMD Ryzen 5 4600H, 15.60", 2 kg
External Review » HP Pavilion Gaming 15-ec1073dx
Dell Vostro 15 7500-0323: Intel Core i7-10750H, 15.60", 1.9 kg
External Review » Dell Vostro 15 7500-0323
Medion Erazer Crawler E10: Intel Core i5-10300H, 15.60", 2.2 kg
External Review » Medion Erazer Crawler E10
Acer Nitro 5 AN515-56-75HR: Intel Core i7-11370H, 15.60", 2.3 kg
External Review » Acer Nitro 5 AN515-56-75HR
Asus ROG Flow X13 GV301QH-K5228T: AMD Ryzen 9 5980HS, 13.40", 1.3 kg
External Review » Asus ROG Flow X13 GV301QH-K5228T
Acer Nitro 5 AN515-56-58CQ: Intel Core i5-11300H, 15.60", 2.3 kg
External Review » Acer Nitro 5 AN515-56-58CQ
Asus TUF FX505DT-HN540: AMD Ryzen 7 3750H, 15.60", 2.2 kg
External Review » Asus TUF FX505DT-HN540
Asus ROG Flow X13 GV301QH-K5232T: AMD Ryzen 9 5980HS, 13.40", 1.3 kg
External Review » Asus ROG Flow X13 GV301QH-K5232T
Lenovo IdeaPad Gaming 3 15ARH05-82EY00CQSP: AMD Ryzen 7 4800H, 15.60", 2.2 kg
External Review » Lenovo IdeaPad Gaming 3 15ARH05-82EY00CQSP
Acer Nitro 5 AN515-43-R6BW: AMD Ryzen 5 3550H, 15.60", 2.3 kg
External Review » Acer Nitro 5 AN515-43-R6BW
Acer Aspire 7 A715-42G-R0XB: AMD Ryzen 5 5500U, 15.60", 2.2 kg
External Review » Acer Aspire 7 A715-42G-R0XB
Lenovo IdeaPad 3 15IMH05-81Y400DWMH: Intel Core i5-10300H, 15.60", 2.2 kg
External Review » Lenovo IdeaPad 3 15IMH05-81Y400DWMH
Acer Aspire Nitro 5 AN517-53-51FQ: Intel Core i5-11300H, 17.30", 2.7 kg
External Review » Acer Aspire Nitro 5 AN517-53-51FQ
LG Ultra 17U70N-J.AA78B: Intel Core i7-10510U, 17.30"
External Review » LG Ultra 17U70N-J.AA78B
Lenovo IdeaPad 3 15ARH05-82EY00CNSP: AMD Ryzen 7 4800H, 15.60", 2.2 kg
External Review » Lenovo IdeaPad 3 15ARH05-82EY00CNSP
HP Pavilion 15-ec1155nd: AMD Ryzen 5 4600H, 15.60", 2 kg
External Review » HP Pavilion 15-ec1155nd
Acer Nitro 5 AN515-44-R8QT: AMD Ryzen 5 4600H, 15.60", 2.4 kg
External Review » Acer Nitro 5 AN515-44-R8QT
Asus TUF Gaming F15 FX506LH-BQ116: Intel Core i7-10870H, 15.60", 2.3 kg
External Review » Asus TUF Gaming F15 FX506LH-BQ116
HP Gaming Pavilion 15-ec1005ns: AMD Ryzen 5 4600H, 15.60", 2 kg
External Review » HP Gaming Pavilion 15-ec1005ns
Lenovo IdeaPad 3 15ARH05-82EY00BSMH: AMD Ryzen 7 4800H, 15.60", 2.2 kg
External Review » Lenovo IdeaPad 3 15ARH05-82EY00BSMH
Lenovo Yoga Creator 7 15IMH05 82DS000VGE: Intel Core i7-10750H, 15.60", 1.8 kg
External Review » Lenovo Yoga Creator 7 15IMH05-82DS000VGE
Asus TUF Gaming A15 FA506IH-AS53: AMD Ryzen 5 4600H, 15.60", 2.3 kg
External Review » Asus TUF Gaming A15 FA506IH-AS53
Acer ConceptD 3 CN314-72G-744X: Intel Core i7-10750H, 14.00", 1.5 kg
External Review » Acer ConceptD 3 CN314-72G-744X
Lenovo Ideapad Creator 5 15IMH05-82D4003UCK: Intel Core i5-10300H, 15.60", 2.2 kg
External Review » Lenovo Ideapad Creator 5 15IMH05-82D4003UCK
HP Pavilion Gaming 16-a0031ns: Intel Core i5-10300H, 16.10", 2.4 kg
External Review » HP Pavilion Gaming 16-a0031ns
Acer Aspire Nitro 5 AN515-44-R329: AMD Ryzen 5 4600H, 15.60", 2.4 kg
External Review » Acer Aspire Nitro 5 AN515-44-R329
Acer Aspire 7 A715-75G-59MG: Intel Core i5-10300H, 15.60", 2.2 kg
External Review » Acer Aspire 7 A715-75G-59MG
Lenovo Legion 5 17IMH05: Intel Core i5-10300H, 17.30", 2.9 kg
External Review » Lenovo Legion 5 17IMH05
Asus TUF Gaming A15 FA506IH-BQ027T: AMD Ryzen 7 4800H, 15.60", 2.3 kg
External Review » Asus TUF Gaming A15 FA506IH-BQ027T
Acer Nitro 5 AN515-44-R99Q: AMD Ryzen 5 4600H, 15.60", 2.4 kg
External Review » Acer Nitro 5 AN515-44-R99Q
Lenovo Yoga Slim 7 15IMH05-82AB003CUK: Intel Core i7-10750H, 15.60", 1.8 kg
External Review » Lenovo Yoga Slim 7 15IMH05-82AB003CUK
LG Ultra 17U70N-R.AAS8U1: Intel Core i7-10510U, 17.00", 2 kg
External Review » LG Ultra 17U70N-R.AAS8U1
HP Pavilion Gaming 15-dk1041tx: Intel Core i7-10750H, 15.60", 2.3 kg
External Review » HP Pavilion Gaming 15-dk1041tx
HP Pavilion Gaming 16-a0006ns: Intel Core i5-10300H, 15.60", 2.4 kg
External Review » HP Pavilion Gaming 16-a0006ns
Lenovo Legion 5 15IMH05-82AU00B1SP: Intel Core i7-10750H, 15.60", 2.3 kg
External Review » Lenovo Legion 5 15IMH05-82AU00B1SP
Asus TUF Gaming F15 FX506LH-BQ030: Intel Core i7-10750H, 15.60", 2.3 kg
External Review » Asus TUF FX506LH-BQ030
Asus TUF Gaming F15 FX506LH-BQ034: Intel Core i5-10300H, 15.60", 2.3 kg
External Review » Asus TUF FX506LH-BQ034
Lenovo Legion Y7000SE: Intel Core i5-9300HF, 15.60"
External Review » Lenovo Legion Y7000SE
HP Pavilion Gaming 16-a0022ns: Intel Core i5-10300H, 16.10", 2.4 kg
External Review » HP Pavilion Gaming 16-a0022ns
Asus TUF FX505DT-BQ613T: AMD Ryzen 7 3750H, 15.60", 2.2 kg
External Review » Asus TUF FX505DT-BQ613T
Lenovo Yoga Slim 7 15IMH05-82AB002WMH: Intel Core i5-10300H, 15.60", 1.8 kg
External Review » Lenovo Yoga Slim 7 15IMH05-82AB002WMH
Acer Nitro 5 AN515-44-R4P7: AMD Ryzen 7 4800H, 15.60", 2.4 kg
External Review » Acer Nitro 5 AN515-44-R4P7
MSI GF63 Thin 10SCXR-042XES: Intel Core i7-10750H, 15.60", 1.9 kg
External Review » MSI GF63 Thin 10SCXR-042XES
Lenovo Legion 5 15ARH05-82B500D3SP: AMD Ryzen 7 4800H, 15.60", 2.3 kg
External Review » Lenovo Legion 5 15ARH05-82B500D3SP
Asus TUF FX505GT-BQ108: Intel Core i5-9300H, 15.60", 2.2 kg
External Review » Asus TUF FX505GT-BQ108
HP Pavilion Gaming 16-a0000ns: Intel Core i5-10300H, 16.10", 2.4 kg
External Review » HP Pavilion Gaming 16-a0000ns
HP Pavilion Gaming 15-ec1009ns: AMD Ryzen 5 4600H, 15.60", 2 kg
External Review » HP Pavilion Gaming 15-ec1009ns
Asus F571GT-AL311T: Intel Core i7-9750H, 15.60", 1.8 kg
External Review » Asus F571GT-AL311T
Acer Nitro 5 AN515-44-R55M: AMD Ryzen 5 4600H, 15.60", 2.4 kg
External Review » Acer Nitro 5 AN515-44-R55M
Lenovo IdeaPad S540-15IWL-81SW002AGE: Intel Core i7-8565U, 15.60", 1.8 kg
External Review » Lenovo IdeaPad S540-15IWL-81SW002AGE
HP Gaming Pavilion 15-dk0025ns: Intel Core i5-9300H, 15.60", 2.2 kg
External Review » HP Gaming Pavilion 15-dk0025ns
Acer Nitro 5 AN515-55-598S: Intel Core i5-10300H, 15.60", 2.3 kg
External Review » Acer Nitro 5 AN515-55-598S
MSI GF63 Thin 10SCXR-405XES: Intel Core i7-10750H, 15.60", 1.9 kg
External Review » MSI GF63 Thin 10SCXR-405XES
Dell G3 15 3500-3KJ99: Intel Core i5-10300H, 15.60", 2.6 kg
External Review » Dell G3 15 3500-3KJ99
Lenovo IdeaPad Gaming 3i 15IMH05: Intel Core i5-10300H, 15.60", 2.2 kg
External Review » Lenovo IdeaPad Gaming 3i 15IMH05
Acer Nitro 5 AN515-55-7075: Intel Core i7-10750H, 15.60", 2.3 kg
External Review » Acer Nitro 5 AN515-55-7075
Acer Aspire 7 A715-41G-R8MJ: AMD Ryzen 5 3550H, 15.60", 2.2 kg
External Review » Acer Aspire 7 A715-41G-R8MJ
HP Omen 15-dc1049ns: Intel Core i5-9300H, 15.60", 2.3 kg
External Review » HP Omen 15-dc1049ns
Lenovo Legion Y540-15IRH-PG0: Intel Core i7-9750H, 15.60", 1.3 kg
External Review » Lenovo Legion Y540-15IRH-PG0
Lenovo Legion 5 15IMH05-82AU004YVN: Intel Core i7-10750H, 15.60", 2.4 kg
External Review » Lenovo Legion 5 15IMH05-82AU004YVN
Acer Nitro 5 AN517-52-7995: Intel Core i7-10750H, 17.30", 2.2 kg
External Review » Acer Nitro 5 AN517-52-7995
Lenovo IdeaPad Gaming 3i 15-81Y400NESB: Intel Core i7-10750H, 15.60", 2.2 kg
External Review » Lenovo IdeaPad Gaming 3i 15-81Y400NESB
Acer Aspire 7 A715-41G-R5LR: AMD Ryzen 5 3550H, 15.60", 2.4 kg
External Review » Acer Aspire 7 A715-41G-R5LR
HP Pavilion Gaming 15-ec1011ns: AMD Ryzen 5 4600H, 15.60", 2 kg
External Review » HP Pavilion Gaming 15-ec1011ns
Asus TUF FX505DT-BQ600: AMD Ryzen 7 3750H, 15.60", 2.2 kg
External Review » Asus TUF FX505DT-BQ600
HP Gaming Pavilion 15-dk0031ns: Intel Core i7-9750H, 15.60", 2.3 kg
External Review » HP Gaming Pavilion 15-dk0031ns
Asus X571GT-BQ597: Intel Core i5-8300H, 15.60", 2 kg
External Review » Asus X571GT-BQ597
Lenovo Legion 5 15ARH05-82B500CFGE: AMD Ryzen 7 4800H, 15.60", 2.3 kg
External Review » Lenovo Legion 5 15ARH05-82B500CFGE
Asus TUF FX505DT-BQ208: AMD Ryzen 7 3750H, 15.60", 2.2 kg
External Review » Asus TUF FX505DT-BQ208
Acer Nitro 5 AN515-55-53YW: Intel Core i5-10300H, 15.60", 2.3 kg
External Review » Acer Nitro 5 AN515-55-53YW
Acer Aspire 7 A715-41G-R3J5: AMD Ryzen 7 3750H, 15.60", 2.4 kg
External Review » Acer Aspire 7 A715-41G-R3J5
Acer Aspire 7 A715-74G-77AW: Intel Core i7-9750H, 15.60", 2.4 kg
External Review » Acer Aspire 7 A715-74G-77AW
Asus ROG Strix G531GT-BQ165: Intel Core i7-9750H, 15.60", 2.4 kg
External Review » Asus ROG Strix G531GT-BQ165
MSI Prestige 14 A10SC-067XES: Intel Core i7-10710U, 14.00", 1.3 kg
External Review » MSI Prestige 14 A10SC-067XES
Acer ConceptD 3 CN315-71-76MR: Intel Core i7-9750H, 15.60", 2.4 kg
External Review » Acer ConceptD 3 CN315-71-76MR
Asus TUF FX505DT-BQ051: AMD Ryzen 5 3550H, 15.60", 2.2 kg
External Review » Asus TUF FX505DT-BQ051
HP Gaming Pavilion 15-dk0026ns: Intel Core i7-9750H, 15.60", 2.2 kg
External Review » HP Gaming Pavilion 15-dk0026ns
Acer Nitro 5 AN515-43-R84P: AMD Ryzen 5 3550H, 15.60"
External Review » Acer Nitro 5 AN515-43-R84P
HP Pavilion Gaming 15-ec0014nl: AMD Ryzen 7 3750H, 15.60", 2.3 kg
External Review » HP Pavilion Gaming 15-ec0014nl
Asus TUF FX505GT-BQ025: Intel Core i5-9300H, 15.60", 2.2 kg
External Review » Asus TUF FX505GT-BQ025
MSI Prestige 14 A10SC-096NE: Intel Core i7-10710U, 14.00", 1.3 kg
External Review » MSI Prestige 14 A10SC-096NE
Acer Nitro 5 AN517-51-55ML: Intel Core i5-9300H, 17.30", 2.7 kg
External Review » Acer Nitro 5 AN517-51-55ML
Lenovo Ideapad L340-15IRH-81LK00CDSP: Intel Core i7-9750H, 15.60", 2.2 kg
External Review » Lenovo Ideapad L340-15IRH-81LK00CDSP
Acer Aspire Nitro 5 AN515-54-7793: Intel Core i7-9750H, 15.60", 2.5 kg
External Review » Acer Aspire Nitro 5 AN515-54-7793
HP Pavilion Gaming 15-dk0002ns: Intel Core i5-9300H, 15.60", 2.3 kg
External Review » HP Pavilion Gaming 15-dk0002ns
Asus TUF FX505GT-BQ028: Intel Core i7-9750H, 15.60", 2.2 kg
External Review » Asus TUF FX505GT-BQ028
MSI Prestige 15 A10SC-007ES: Intel Core i7-10710U, 15.60", 1.7 kg
External Review » MSI Prestige 15 A10SC-007ES
Asus TUF FX505DT-BQ121: AMD Ryzen 7 3750H, 15.60", 2.2 kg
External Review » Asus TUF FX505DT-BQ121
MSI GF75 Thin 9SC-277XES: Intel Core i7-9750H, 17.30", 2.2 kg
External Review » MSI GF75 Thin 9SC-277XES
HP Pavilion Gaming 15-ec0003ns: AMD Ryzen 7 3750H, 15.60", 2.3 kg
External Review » HP Pavilion Gaming 15-ec0003ns
MSI Prestige 14 A10SC-012ES: Intel Core i7-10710U, 14.00", 1.3 kg
External Review » MSI Prestige 14 A10SC-012ES
HP Omen 15-dc1010nr: Intel Core i7-9750H, 15.60", 2.6 kg
External Review » HP Omen 15-dc1010nr
Acer Aspire Nitro 5 AN517-51-76MG: Intel Core i7-9750H, 15.60", 2.5 kg
External Review » Acer Aspire Nitro 5 AN517-51-76MG
Samsung Odyssey 2 NP850XBD-XG1BR: Intel Core i5-9300H, 15.60", 2.4 kg
External Review » Samsung Odyssey 2 NP850XBD-XG1BR
HP Pavilion 15-BC520NS: Intel Core i7-9750H, 15.60", 2.2 kg
External Review » HP Pavilion 15-BC520NS
Acer Aspire Nitro 7 AN715-51-76XG: Intel Core i7-8750H, 15.60", 2.5 kg
External Review » Acer Aspire Nitro 7 AN715-51-76XG
Acer Predator Triton 300 PT315-51-58BG: Intel Core i5-9300H, 15.60", 2.5 kg
External Review » Acer Predator Triton 300 PT315-51-58BG
Lenovo Legion Y540-15IRH-81SY00A2SP: Intel Core i5-9300H, 15.60", 2.3 kg
External Review » Lenovo Legion Y540-15IRH-81SY00A2SP
Asus TUF FX505GT-BQ024: Intel Core i7-9750H, 15.60", 2.2 kg
External Review » Asus TUF FX505GT-BQ024
HP Pavilion 15-bc521ns: Intel Core i5-9300H, 15.60", 2.1 kg
External Review » HP Pavilion 15-bc521ns
Dell G3 15 3590-GN3R591AU: Intel Core i7-9750H, 15.60", 2.7 kg
External Review » Dell G3 15 3590-GN3R591AU
Acer Nitro 5 AN515-54-749V: Intel Core i7-9750H, 15.60", 2.5 kg
External Review » Acer Nitro 5 AN515-54-749V
Dell G3 3590: Intel Core i5-9300H, 15.60", 2.5 kg
External Review » Dell G3 3590
Acer Predator Triton 300 PT315-51-7815: Intel Core i7-9750H, 15.60", 2.3 kg
External Review » Acer Predator Triton 300 PT315-51-7815
HP Gaming Pavilion 15-dk0046nr: Intel Core i7-9750H, 15.60", 2.3 kg
External Review » HP Gaming Pavilion 15-dk0046nr
MSI GL65 9SC-004: Intel Core i5-9300H, 15.60", 2.3 kg
External Review » MSI GL65 9SC-004
MSI GF63 9SC-621: Intel Core i5-9300H, 15.60", 1.9 kg
External Review » MSI GF63 9SC-621
Lenovo IdeaPad L340-15IRH 81LK00BMGE: Intel Core i5-9300H, 15.60", 2.1 kg
External Review » Lenovo IdeaPad L340-15IRH 81LK00BMGE
Acer Aspire 7 A715-74G-743J: Intel Core i7-9750H, 15.60", 2.4 kg
External Review » Acer Aspire 7 A715-74G-743J
MSI GF75 Thin 9SC-061XES: Intel Core i7-9750H, 17.30", 2.2 kg
External Review » MSI GF75 Thin 9SC-061XES
Acer Nitro 5 AN517-51-77B8: Intel Core i7-9750H, 17.30", 2.7 kg
External Review » Acer Nitro 5 AN517-51-77B8
HP Gaming Pavilion 17-cd0222ng: Intel Core i5-9300H, 17.30", 2.8 kg
External Review » HP Gaming Pavilion 17-cd0222ng
Asus ROG Strix G531GT-BQ012 : Intel Core i7-9750H, 15.60", 2.4 kg
External Review » Asus ROG Strix G531GT-BQ012
Acer Aspire 7 A715-74G-53YM: Intel Core i5-9300H, 15.60", 2.4 kg
External Review » Acer Aspire 7 A715-74G-53YM
Asus Strix G G531GT-BI7N6: Intel Core i7-9750H, 15.60", 2.4 kg
External Review » Asus Strix G G531GT-BI7N6
Acer Nitro 5 AN517-51-56YW: Intel Core i5-9300H, 17.30", 2.7 kg
External Review » Acer Nitro 5 AN517-51-56YW
Acer Predator Triton 300-15: Intel Core i7-9750H, 15.60", 2.3 kg
External Review » Acer Predator Triton 300-15
Lenovo Legion Y540-15IRH-81SY00A6SP: Intel Core i7-9750H, 15.60", 2.3 kg
External Review » Lenovo Legion Y540-15IRH-81SY00A6SP
Dell XPS 15 7590-K6XWV: Intel Core i7-9750H, 15.60", 2 kg
External Review » Dell XPS 15 7590-K6XWV
Acer Nitro 5 AN517-51-70U7: Intel Core i7-9750H, 17.30", 2.7 kg
External Review » Acer Nitro 5 AN517-51-70U7
Lenovo Ideapad L340-15IRH-81LK0093MB: Intel Core i7-9750H, 15.60", 2.2 kg
External Review » Lenovo Ideapad L340-15IRH-81LK0093MB
Dell G3 15 3590-cn35917: Intel Core i5-9300H, 15.60", 2.4 kg
External Review » Dell G3 15 3590-cn35917
HP Pavilion 15-dk0042tx: Intel Core i7-9750H, 15.60", 2.3 kg
External Review » HP Pavilion 15-dk0042tx
Lenovo Legion Y545-15-81T20005US: Intel Core i7-9750H, 15.60", 2.3 kg
External Review » Lenovo Legion Y545-15-81T20005US
Asus ROG Strix G531GT-BQ020: Intel Core i7-9750H, 15.60", 2.4 kg
External Review » Asus ROG Strix G531GT-BQ020
Acer Nitro 7 AN715-51-752B: Intel Core i7-9750H, 15.60", 2.7 kg
External Review » Acer Nitro 7 AN715-51-752B
Lenovo Legion Y540 15-IRH-81SY001KSB: Intel Core i7-9750H, 15.60", 2.3 kg
External Review » Lenovo Legion Y540 15-IRH-81SY001KSB
Acer Nitro 5 AN515-54-73KT: Intel Core i7-9750H, 15.60", 2.7 kg
External Review » Acer Nitro 5 AN515-54-73KT
Asus ROG Strix G531GT-BQ005: Intel Core i5-9300H, 15.60", 2.4 kg
External Review » Asus ROG Strix G531GT-BQ005
MSI PS63 Modern 8SC-054ES: Intel Core i7-8565U, 15.60", 1.6 kg
External Review » MSI PS63 Modern 8SC-054ES
Asus Strix G531GT-BI7N6: Intel Core i7-9750H, 15.60", 2.4 kg
External Review » Asus Strix G531GT-BI7N6
Asus TUF FX705DT-AU028T: AMD Ryzen 7 3750H, 17.30", 2.6 kg
External Review » Asus TUF FX705DT-AU028T
Dell G5 15 5590-PCNJJ: Intel Core i5-9300H, 15.60", 2.7 kg
External Review » Dell G5 15 5590-PCNJJ
Dell XPS 15 7590 9980HK GTX 1650: Intel Core i9-9980HK, 15.60", 2 kg
External Review » Dell XPS 15 7590 9980HK GTX 1650
Asus TUF FX505DT-EB73: AMD Ryzen 7 3750H, 15.60", 2.2 kg
External Review » Asus TUF FX505DT-EB73
Dell XPS 15 7590: Intel Core i9-9980HK, 15.60", 2 kg
External Review » Dell XPS 15 7590
Acer Aspire Nitro 5 AN515-54-72J1: Intel Core i7-9750H, 15.60", 2.3 kg
External Review » Acer Aspire Nitro 5 AN515-54-72J1
MSI GF63 Thin 9SC-047XES: Intel Core i7-9750H, 15.60", 1.9 kg
External Review » MSI GF63 Thin 9SC-047XES
Lenovo Ideapad L340-17IRH-81LL001YGE: Intel Core i5-9300H, 17.30", 2.5 kg
External Review » Lenovo Ideapad L340-17IRH-81LL001YGE
Lenovo Ideapad L340-15IRH-81LK0001UK: Intel Core i5-9300H, 15.60", 2.2 kg
External Review » Lenovo Ideapad L340-15IRH-81LK0001UK
Acer Aspire Nitro 5 AN515-54-53Z2: Intel Core i5-9300H, 15.60", 2.2 kg
External Review » Acer Aspire Nitro 5 AN515-54-53Z2
Acer Aspire Nitro 7 AN715-51: Intel Core i7-8750H, 15.60", 2.2 kg
External Review » Acer Aspire Nitro 7 AN715-51
» Comparison of GPUs
Detailed list of all laptop GPUs sorted by class and performance.
» Benchmark List
Sort and restrict laptop GPUs based on performance in synthetic benchmarks.
» Notebook Gaming List
Playable games for each graphics card and their average FPS results.
* Approximate position of the graphics adapter
» Notebookcheck多媒体笔记本电脑Top 10排名
» Notebookcheck游戏笔记本电脑Top 10排名
» Notebookcheck低价办公/商务笔记本电脑Top 10排名
» Notebookcheck高端办公/商务笔记本电脑Top 10排名
» Notebookcheck工作站笔记本电脑Top 10排名
» Notebookcheck亚笔记本电脑Top 10排名
» Notebookcheck超级本产品Top 10排名
» Notebookcheck变形本产品Top 10排名
» Notebookcheck平板电脑Top 10排名
» Notebookcheck智能手机Top 10排名
» Notebookcheck评测过最出色的笔记本电脑屏幕
» Notebookcheck售价500欧元以下笔记本电脑Top 10排名
» Notebookcheck售价300欧元以下笔记本电脑Top 10排名