


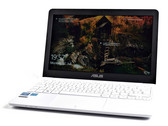
华硕 VivoBook E200HA (x5-Z8350, 32 GB) 小型笔记本简短评测
物美价廉?华硕VivoBook E200HA-FD0041TS是一台11.6英寸的小型笔记本电脑,以三种配色来吸引消费者。机内配有四核处理器。在我们的评测中,你将了解到该小型电脑的价格。
Intel Atom x5-Z8350, HD Graphics 400 (Braswell), 11.6", 976 g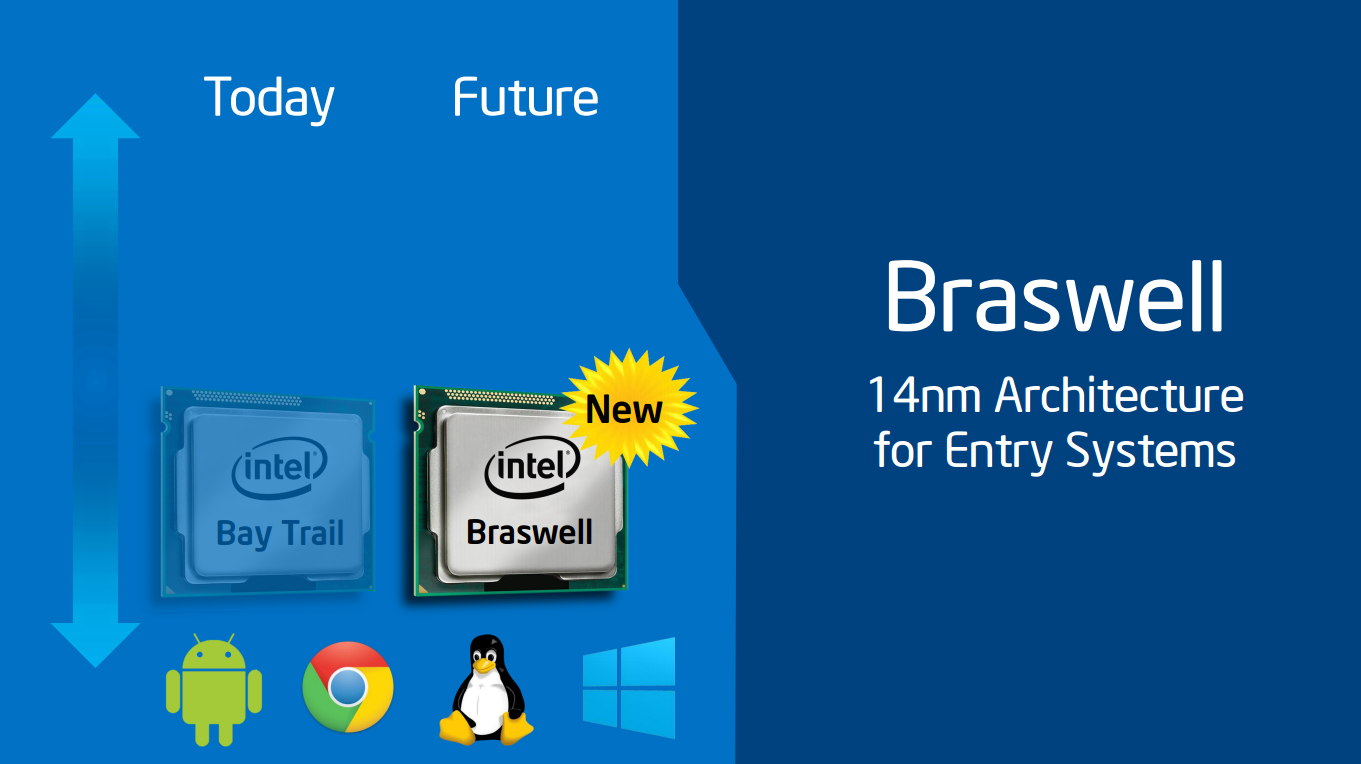
英特尔HD Graphics 400 (Braswell)是一块处于Braswell系列(2016 赛扬型号)低端处理器中的集成显卡。它基于与Broadwell显卡(例如,HD Graphics 5300)一样的构架,但提供的着色器内核更少,时钟频率更慢。
它是英特尔HD Graphics(Braswell)卡的再创造,包括Pentium处理器中速度更快的16EU型号。请参阅英特尔HD Graphics Braswell显卡页面以了解评价标准。
它的性能取决于(不同的显卡睿频速度)和占用内存。
游戏能力,依然只满足于较老的或者要求较低的游戏。处理器的游戏性能通常也是很有限。(例如在双核N3000中)。
在系统芯片中,同样集成了一个视频解码引擎。应该可以应对4k H.265的视频。
HD Graphics Series
| ||||||||||||||||||||||||||||||||||||||||||||||||||||||||||||||||||||||
| Codename | Braswell | |||||||||||||||||||||||||||||||||||||||||||||||||||||||||||||||||||||
| Architecture | Gen. 8 | |||||||||||||||||||||||||||||||||||||||||||||||||||||||||||||||||||||
| iGPU | Integrated Graphics | |||||||||||||||||||||||||||||||||||||||||||||||||||||||||||||||||||||
| Pipelines | 12 - unified | |||||||||||||||||||||||||||||||||||||||||||||||||||||||||||||||||||||
| Core Speed | 320 - 640 (Boost) MHz | |||||||||||||||||||||||||||||||||||||||||||||||||||||||||||||||||||||
| Memory Bus Width | 64/128 Bit | |||||||||||||||||||||||||||||||||||||||||||||||||||||||||||||||||||||
| Shared Memory | yes | |||||||||||||||||||||||||||||||||||||||||||||||||||||||||||||||||||||
| API | DirectX 11.2, Shader 5.0 | |||||||||||||||||||||||||||||||||||||||||||||||||||||||||||||||||||||
| Man. Technology | 14 nm | |||||||||||||||||||||||||||||||||||||||||||||||||||||||||||||||||||||
| Date of Announcement | 01.04.2016 | |||||||||||||||||||||||||||||||||||||||||||||||||||||||||||||||||||||
| ||||||||||||||||
The following benchmarks stem from our benchmarks of review laptops. The performance depends on the used graphics memory, clock rate, processor, system settings, drivers, and operating systems. So the results don't have to be representative for all laptops with this GPU. For detailed information on the benchmark results, click on the fps number.


| low | med. | high | ultra | QHD | 4K | |
|---|---|---|---|---|---|---|
| Farming Simulator 19 | 14.1 | |||||
| Team Fortress 2 | 18.5 | 16 | ||||
| Rocket League | 12.7 | |||||
| Prey | 6.8 | |||||
| Resident Evil 7 | 10.7 | |||||
| Farming Simulator 17 | 20.9 | 5.8 | ||||
| Civilization 6 | 9.7 | |||||
| Overwatch | 15 | 10 | ||||
| Rise of the Tomb Raider | 5.3 | |||||
| Rainbow Six Siege | 7.3 | 3.2 | ||||
| FIFA 16 | 36.5 | 14.2 | 9 | |||
| World of Warships | 13 | 8 | ||||
| Metal Gear Solid V | 13.3 | |||||
| Dota 2 Reborn | 21.3 | 11.4 | ||||
| The Witcher 3 | 8.5 | 5.6 | ||||
| Dirt Rally | 40.1 | 11.7 | ||||
| GTA V | 14.3 | |||||
| Dragon Age: Inquisition | 5.4 | 2.9 | ||||
| F1 2014 | 27 | 16 | ||||
| Alien: Isolation | 12 | 7 | ||||
| Sims 4 | 37 | 7.6 | ||||
| Risen 3: Titan Lords | 6.5 | 4.8 | ||||
| GRID: Autosport | 28.9 | 12.5 | ||||
| X-Plane 10.25 | 11.8 | |||||
| Battlefield 4 | 16.2 | 12.3 | 7.9 | |||
| Dead Trigger 2 | 30 | |||||
| F1 2013 | 28 | 17 | ||||
| Asphalt 8: Airborne | 30 | 30 | ||||
| GRID 2 | 19.9 | 12.5 | ||||
| BioShock Infinite | 18 | 9 | 6.23 | 1.8 | ||
| Tomb Raider | 24.8 | 10.2 | ||||
| Dead Space 3 | 21.1 | 10.8 | 8.7 | |||
| Counter-Strike: GO | 10.5 | |||||
| Diablo III | 18.3 | |||||
| Anno 2070 | 27.7 | |||||
| The Elder Scrolls V: Skyrim | 19.8 | 9.5 | ||||
| Deus Ex Human Revolution | 18.4 | 11.3 | ||||
| Dirt 3 | 29.4 | 14.3 | 12.5 | |||
| StarCraft 2 | 34.5 | 8.8 | 5.6 | |||
| Trackmania Nations Forever | 74 | 24 | 9.9 | |||
| low | med. | high | ultra | QHD | 4K | < 30 fps < 60 fps < 120 fps ≥ 120 fps | 33 5 1 | 23 | 8 2 | 3 | | |
For more games that might be playable and a list of all games and graphics cards visit our Gaming List

Samsung Chromebook Connect XE501C13-AD2BR: Intel Celeron N3060, 11.60", 1.2 kg
External Review » Samsung Chromebook Connect XE501C13-AD2BR
Acer Aspire 3 A315-33-C876: Intel Celeron N3060, 15.60", 2.1 kg
External Review » Acer Aspire 3 A315-33-C876
Chuwi HeroBook 14: Intel Atom x5-E8000, 14.00", 1.5 kg
External Review » Chuwi HeroBook 14
HP Stream 14-cb099ns: Intel Celeron N3060, 14.00", 1.5 kg
External Review » HP Stream 14-cb099ns
Dell Chromebook 11 3181 2-in-1: Intel Celeron N3060, 11.60", 1.4 kg
External Review » Dell Chromebook 11 3181 2-in-1
Medion Akoya E2215T-MD60689: Intel Atom x5-Z8350, 11.60", 1.1 kg
External Review » Medion Akoya E2215T-MD60689
Samsung Chromebook 3 XE500C13-K03US: Intel Celeron N3060, 11.60", 1.1 kg
External Review » Samsung Chromebook 3 XE500C13-K03US
Asus E406SA-BV004T: Intel Celeron N3060, 14.00", 1.3 kg
External Review » Asus E406SA-BV004T
Acer Aspire 3 A315-33-C3JA: Intel Celeron N3060, 15.60", 2.1 kg
External Review » Acer Aspire 3 A315-33-C3JA
HP Stream 11 Pro G3 Z2Z28ES: Intel Celeron N3060, 11.60", 1.2 kg
External Review » HP Stream 11 Pro G3 Z2Z28ES
HP Stream 14-ax004nl: Intel Celeron N3060, 14.00", 1.4 kg
External Review » HP Stream 14-ax004nl
HP 15-bs510ns: Intel Celeron N3060, 15.60", 2.1 kg
External Review » HP 15-bs510ns
Acer Swift 1 SF114-31-C5NW: Intel Celeron N3060, 14.00", 1.4 kg
External Review » Acer Swift 1 SF114-31-C5NW
Lenovo Ideapad 110S-11IBR: Intel Celeron N3060, 11.60", 1.1 kg
External Review » Lenovo Ideapad 110S-11IBR
Acer Extensa 2519-C8HV: Intel Celeron N3060, 15.60", 2.4 kg
External Review » Acer Extensa 2519-C8HV
Medion Akoya S4219-30020605: Intel Celeron N3050, 14.00", 1.6 kg
External Review » Medion Akoya S4219-30020605
HP Pavilion x2 10-p012ns: Intel Atom x5-Z8350, 10.10", 1.1 kg
External Review » HP Pavilion x2 10-p012ns
Acer Chromebook 15 CB3-532-C8E0: Intel Celeron N3160, 15.60", 2 kg
External Review » Acer Chromebook 15 CB3-532-C8E0
Lenovo Yoga 300-11IBR-80M100UUSP: Intel Celeron N3060, 11.60", 1.4 kg
External Review » Lenovo Yoga 300-11IBR-80M100UUSP
Lenovo Ideapad 110S-11IBR-80WG00ENSP: Intel Celeron N3060, 11.60", 1.2 kg
External Review » Lenovo Ideapad 110S-11IBR-80WG00ENSP
HP Stream 11-aa001ns: Intel Celeron N3060, 11.60", 1.4 kg
External Review » HP Stream 11-aa001ns
Medion Akoya S6219-MD60769: Intel Celeron N3060, 15.60", 1.9 kg
External Review » Medion Akoya S6219-MD60769
HP 15-bs092NS: Intel Celeron N3060, 15.60", 2.1 kg
External Review » HP 15-BS092NS
HP 14-bs002nh: Intel Celeron N3060, 14.00", 1.7 kg
External Review » HP 14-bs002nh
Lenovo IdeaPad Miix 320-10ICR Pro LTE: Intel Atom x5-Z8350, 10.10", 1 kg
External Review » Lenovo IdeaPad Miix 320-10ICR Pro LTE
Dell Inspiron 15 3552-0514: Intel Celeron N3060, 15.60", 2.1 kg
External Review » Dell Inspiron 15 3552-0514
HP Chromebook 11 G5 X0P00EA: Intel Celeron N3060, 11.60", 1.1 kg
External Review » HP Chromebook 11 G5 X0P00EA
Lenovo Yoga 300-11IBR-80M100X3SP: Intel Celeron N3060, 11.60", 1.4 kg
External Review » Lenovo Yoga 300-11IBR-80M100X3SP
Dell Chromebook 11-3189-7D21X: Intel Celeron N3060, 11.60", 1.5 kg
External Review » Dell Chromebook 11-3189-7D21X
HP Stream 14-ax005ns: Intel Celeron N3060, 14.00", 1.4 kg
External Review » HP Stream 14-ax005ns
HP Stream 11-y002ns: Intel Celeron N3060, 11.60", 1.2 kg
External Review » HP Stream 11-y002ns
Lenovo Ideapad 110-15IBR-80T70057SP: Intel Celeron N3060, 15.60", 2.3 kg
External Review » Lenovo Ideapad 110-15IBR-80T70057SP
Dell Chromebook 11 3180-RH02N: Intel Celeron N3060, 11.60", 1.3 kg
External Review » Dell Chromebook 11 3180-RH02N
HP Stream 11-y010nr: Intel Celeron N3060, 11.60", 1.2 kg
External Review » HP Stream 11-y010nr
Asus Transformer Book Flip TP201SA-FV0010T: Intel Celeron N3060, 11.60", 1.3 kg
External Review » Asus Transformer Book Flip TP201SA-FV0010T
Asus D541SA-XO460T: Intel Celeron N3060, 15.60", 1.8 kg
External Review » Asus D541SA-XO460T
HP 14-am090nd: Intel Celeron N3060, 14.00", 1.9 kg
External Review » HP 14-am090nd
Samsung Chromebook 3 XE500C13-K04US: Intel Celeron N3060, 11.60", 1.1 kg
External Review » Samsung Chromebook 3 XE500C13-K04US
Dell Inspiron 14-3451: Intel Celeron N3060, 14.00", 1.8 kg
External Review » Dell Inspiron 14-3451
Lenovo IdeaPad 100s-14IBR 80R900K5GE: Intel Celeron N3060, 14.00", 1.5 kg
External Review » Lenovo IdeaPad 100S-14IBR-80R900K5GE
HP Stream 11-y072ng: Intel Celeron N3060, 11.60", 1.2 kg
External Review » HP Stream 11-y072ng
Asus L402SA: Intel Celeron N3060, 14.00", 1.4 kg
External Review » Asus L402SA
Lenovo IdeaPad 100S-14IBR-80R900HXGE: Intel Celeron N3060, 14.10", 1.5 kg
External Review » Lenovo IdeaPad 100S-14IBR-80R900HXGE
HP Stream 11-Y000NS: Intel Celeron N3060, 11.60", 1.2 kg
External Review » HP Stream 11-Y000NS
Dell Chromebook 11-3180: Intel Celeron N3060, 11.60", 1.3 kg
External Review » Dell Chromebook 11-3180
Dell Inspiron 11-3162 2017: Intel Celeron N3060, 11.60", 1.2 kg
External Review » Dell Inspiron 11-3162 2017
HP Stream 11-AB001NS x360: Intel Celeron N3060, 11.60", 1.4 kg
External Review » HP Stream 11-AB001NS x360
Asus EeeBook E202SA-FD0076T: Intel Celeron N3060, 11.60", 1.3 kg
External Review » Asus EeeBook E202SA-FD0076T
Asus Transformer Book Flip TP201SA-FV0019T: Intel Celeron N3060, 11.60", 1.4 kg
External Review » Asus Transformer Book Flip TP201SA-FV0019T
Lenovo Yoga Book YB1-X91L: Intel Atom x5-Z8550, 10.10", 0.7 kg
External Review » Lenovo Yoga Book YB1-X91L
Acer Swift 1 SF114-31-C24: Intel Celeron N3060, 14.00", 1.6 kg
External Review » Acer Swift 1 SF114-31-C24
HP Stream 14-ax003ns: Intel Celeron N3060, 14.00", 1.4 kg
External Review » HP Stream 14-ax003ns
Lenovo IdeaPad 110S-11IBR-80WG0060FR: Intel Celeron N3060, 11.60", 1.2 kg
External Review » Lenovo IdeaPad 110S-11IBR-80WG0060FR
Lenovo IdeaPad 110-15IBR-80T700BDSP: Intel Celeron N3060, 15.60", 2.2 kg
External Review » Lenovo IdeaPad 110-15IBR-80T700BDSP
Dell Chromebook 11-3189: Intel Celeron N3060, 11.60", 1.5 kg
External Review » Dell Chromebook 11-3189
Acer Chromebook 14 CB3-431-C0AK: Intel Celeron N3160, 14.00", 1.5 kg
External Review » Acer Chromebook 14 CB3-431-C0AK
Acer Swift 1 SF114-31-C534: Intel Celeron N3060, 14.00", 1.6 kg
External Review » Acer Swift 1 SF114-31-C534
Asus Eeebook E202SA-FD0078T: Intel Celeron N3060, 11.60", 1.3 kg
External Review » Asus Eeebook E202SA-FD0078T
Asus D540SA-XX620T: Intel Celeron N3060, 15.60", 1.9 kg
External Review » Asus D540SA-XX620T
Acer Chromebook 11 N7 C731-C8VE: Intel Celeron N3060, 11.60", 1.3 kg
External Review » Acer Chromebook 11 N7 C731-C8VE
HP Stream 14-AX001NS: Intel Celeron N3060, 14.00", 1.4 kg
External Review » HP Stream 14-AX001NS
Lenovo Ideapad 110S-11IBR-80WG007TGE: Intel Celeron N3060, 11.60", 1.2 kg
External Review » Lenovo Ideapad 110S-11IBR-80WG007TGE
Lenovo Yoga A12 Android YB1-Q501F: Intel Atom x5-Z8550, 12.20", 1.1 kg
External Review » Lenovo Yoga A12 Android YB1-Q501F
Acer Aspire R3-131T-C7X1: Intel Celeron N3160, 11.60", 1.5 kg
External Review » Acer Aspire R3-131T-C7X1
Acer Aspire Switch 10 V SW5-017-196Q: Intel Atom x5-Z8350, 10.10", 1.2 kg
External Review » Acer Aspire Switch 10 V SW5-017-196Q
Lenovo N22-20: Intel Celeron N3060, 11.60", 1.2 kg
External Review » Lenovo N22-20
Asus D540SA-XX621D: Intel Celeron N3060, 15.60", 2 kg
External Review » Asus D540SA-XX621D
HP Stream 14-AX000NF: Intel Celeron N3060, 14.00", 1.4 kg
External Review » HP Stream 14-AX000NF
HP Stream 14-ax010nr: Intel Celeron N3060, 14.00", 1.4 kg
External Review » HP Stream 14-ax010nr
HP Chromebook 11 G5: Intel Celeron N3060, 11.60", 1.2 kg
External Review » HP Chromebook 11 G5
Acer Chromebook 14 CB3-431-C9WH: Intel Celeron N3060, 14.00", 1.6 kg
External Review » Acer Chromebook 14 CB3-431-C9WH
Acer Chromebook R11 CB5-132T-C8ZW: Intel Celeron N3060, 11.60", 1.2 kg
External Review » Acer Chromebook R11 CB5-132T-C8ZW
Lenovo Yoga Book YB1-X91F: Intel Atom x5-Z8550, 10.10", 0.7 kg
External Review » Lenovo Yoga Book YB1-X91F
HP 15-ay042Nns: Intel Celeron N3060, 15.60", 2.5 kg
External Review » HP 15-ay042Nns
Asus X540SA-XX311T: Intel Celeron N3060, 15.60", 1.9 kg
External Review » Asus X540SA-XX311T
Asus X540SA-XX311D: Intel Celeron N3060, 15.60", 2.4 kg
External Review » Asus X540SA-XX311D
Acer Chromebook 15 CB3-532-C47C: Intel Celeron N3060, 15.60", 1.9 kg
External Review » Acer Chromebook 15 CB3-532-C47C
HP 17-x000nd: Intel Celeron N3060, 17.30", 2.8 kg
External Review » HP 17-x000nd
Lenovo Yoga Book Android YB1-X90F: Intel Atom x5-Z8550, 10.10", 0.7 kg
External Review » Lenovo Yoga Book Android YB1-X90F
Acer Chromebook 15 CB5-532-C47C: Intel Celeron N3060, 15.60", 1.9 kg
External Review » Acer Chromebook 15 CB5-532-C47C
Acer Chromebook 14 CB3-431-C6UD: Intel Celeron N3160, 14.00", 1.6 kg
External Review » Acer Chromebook 14 CB3-431-C6UD
Panasonic Toughpad FZ-A2-A211CA3: Intel Atom x5-Z8550, 10.10", 0.9 kg
External Review » Panasonic Toughpad FZ-A2-A211CA3
Lenovo Yoga Book 2016 Windows 64GB LTE: Intel Atom x5-Z8550, 10.10", 0.7 kg
External Review » Lenovo Yoga Book 10 inch 2016, Windows 10
HP 250 G5: Intel Celeron N3060, 15.60", 1.7 kg
External Review » HP 250 G5
Asus Chromebook C202SA-YS02: Intel Celeron N3060, 11.60", 1.2 kg
External Review » Asus Chromebook C202SA-YS02
» Comparison of GPUs
Detailed list of all laptop GPUs sorted by class and performance.
» Benchmark List
Sort and restrict laptop GPUs based on performance in synthetic benchmarks.
» Notebook Gaming List
Playable games for each graphics card and their average FPS results.
* Approximate position of the graphics adapter
» Notebookcheck多媒体笔记本电脑Top 10排名
» Notebookcheck游戏笔记本电脑Top 10排名
» Notebookcheck低价办公/商务笔记本电脑Top 10排名
» Notebookcheck高端办公/商务笔记本电脑Top 10排名
» Notebookcheck工作站笔记本电脑Top 10排名
» Notebookcheck亚笔记本电脑Top 10排名
» Notebookcheck超级本产品Top 10排名
» Notebookcheck变形本产品Top 10排名
» Notebookcheck平板电脑Top 10排名
» Notebookcheck智能手机Top 10排名
» Notebookcheck评测过最出色的笔记本电脑屏幕
» Notebookcheck售价500欧元以下笔记本电脑Top 10排名
» Notebookcheck售价300欧元以下笔记本电脑Top 10排名