


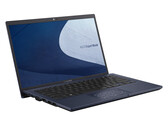
华硕ExpertBook L1 L1401CDA在审查中。小型预算的安静办公笔记本
ExpertBook板上有Ryzen 3 APU,通常运行安静,提供背光键盘,并有许多连接选项(包括VGA)。Windows 10 Pro作为操作系统(可以升级到Windows 11)。购买价格约为330欧元(约350美元)。
AMD Ryzen 3 3250U, Vega 3, 14", 1.5 kg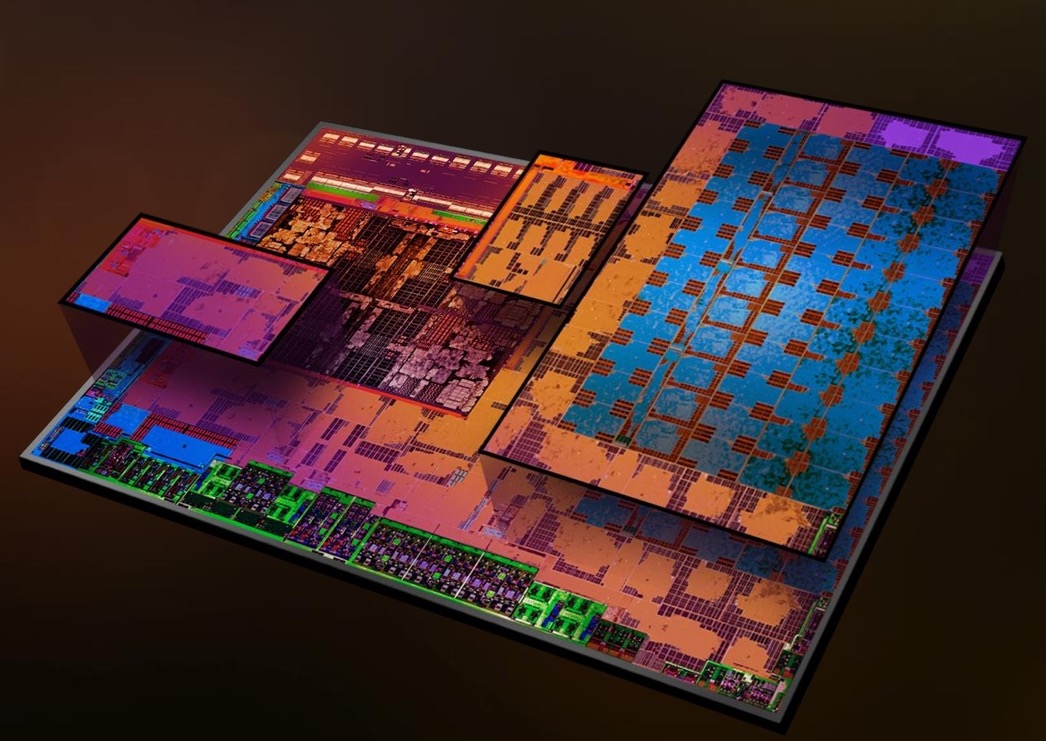
AMD Radeon RX Vega 3是用于笔记本电脑的集成GPU。它用于入门级Ryzen 3 APU,于2018年初推出。GPU基于Vega架构(第5代GCN),具有3个CU(= 704个着色器中的192个),主频高达1100 MHz。性能取决于TDP(默认12-25 W),时钟,散热和内存配置。 GPU应该受益于快速双通道DDR4-2400 RAM(DDR4-2133可能会情况不同)。
Vega架构相对于Polaris一代提供了一些改进,现在支持DirectX 12 Feature Level 12_1。有关Raven Ridge架构的文章中提供了更多信息。
目前我们估计性能与GeForce 910M相当。因此,较新的游戏可能无法流畅地运行。
由于14nm工艺和巧妙的省电功能,功耗相对较低(根据AMD的说法),因此显卡可用于轻薄笔记本电脑。
RX Vega 2000/3000 Series
| |||||||||||||||||||
| Codename | Vega Raven Ridge | ||||||||||||||||||
| Architecture | Vega | ||||||||||||||||||
| iGPU | Integrated Graphics | ||||||||||||||||||
| Pipelines | 192 - unified | ||||||||||||||||||
| Core Speed | 600 - 1200 (Boost) MHz | ||||||||||||||||||
| Shared Memory | no | ||||||||||||||||||
| API | DirectX 12_1 | ||||||||||||||||||
| Power Consumption | 15 Watt | ||||||||||||||||||
| Transistor Count | 4.5 Billion | ||||||||||||||||||
| Man. Technology | 14 nm | ||||||||||||||||||
| Features | Tiled Rasterization, Shared Memory (up to Dual-Channel DDR4-2400) | ||||||||||||||||||
| Date of Announcement | 07.01.2018 | ||||||||||||||||||
| ||||||||||||||||||||||||
The following benchmarks stem from our benchmarks of review laptops. The performance depends on the used graphics memory, clock rate, processor, system settings, drivers, and operating systems. So the results don't have to be representative for all laptops with this GPU. For detailed information on the benchmark results, click on the fps number.


For more games that might be playable and a list of all games and graphics cards visit our Gaming List
HP Chromebook 14b-nb0004ns: AMD Ryzen 3 3250U, 14.00", 1.5 kg
External Review » HP Chromebook 14b-nb0004ns
HP 15s-eq1040ns: AMD 3020e, 15.60", 1.7 kg
External Review » HP 15s-eq1040ns
Lenovo IdeaPad 1 14ADA7, AMD 3020e: AMD 3020e, 14.00", 1.4 kg
External Review » Lenovo IdeaPad 1 14ADA7, AMD 3020e
HP 255 G8, AMD 3020e: AMD 3020e, 15.60", 1.7 kg
External Review » HP 255 G8, AMD 3020e
Lenovo IdeaPad 1 15ADA7, AMD 3020e: AMD 3020e, 15.60", 1.6 kg
External Review » Lenovo IdeaPad 1 15ADA7, AMD 3020e
Asus ExpertBook L1 L1401CDA-EK0457R: AMD Ryzen 3 3250U, 14.00", 1.5 kg
External Review » Asus ExpertBook L1 L1401CDA-EK0457R
Acer Chromebook Spin 514 CP514-1H-R0KA: AMD Ryzen 3 3250U, 14.00", 1.7 kg
External Review » Acer Chromebook Spin 514 CP514-1H-R0KA
HP 14s-fq0009ns: AMD 3020e, 14.00", 1.5 kg
External Review » HP 14s-fq0009ns
Acer Chromebook Spin 514 CP514-1H-R7EY: unknown, 14.00", 1.7 kg
External Review » Acer Chromebook Spin 514 CP514-1H-R7EY
Acer Chromebook Spin 514 CP514-3H-R2D2: AMD Ryzen 3 5125C, 14.00", 1.5 kg
External Review » Acer Chromebook Spin 514 CP514-3H-R2D2
HP 15s-eq1154ns: AMD 3020e, 15.60", 1.7 kg
External Review » HP 15s-eq1154ns
HP 15s-eq1156ur: AMD Athlon Gold 3150U, 15.60", 1.7 kg
External Review » HP 15s-eq1156ur
Asus Chromebook Flip CM1400FXA-EC0021: AMD 3015Ce, 14.00", 1.7 kg
External Review » Asus Chromebook Flip CM1400FXA-EC0021
HP Chromebook 14b-na0004ns: unknown, 14.00", 1.5 kg
External Review » HP Chromebook 14b-na0004ns
Acer Aspire 3 A314-22-R9MH: AMD Ryzen 3 3250U, 14.00", 1.9 kg
External Review » Acer Aspire 3 A314-22-R9MH
HP 15s-eq1035ns: AMD 3020e, 15.60", 1.7 kg
External Review » HP 15s-eq1035ns
Lenovo IdeaPad 1 14ADA05-82GW003JGE: AMD Athlon Silver 3050e, 14.00", 1.4 kg
External Review » Lenovo IdeaPad 1 14ADA05-82GW003JGE
Acer Chromebook Spin 514 CP514-1H-R22Q: unknown, 14.00", 1.7 kg
External Review » Acer Chromebook Spin 514 CP514-1H-R22Q
Asus VivoBook 17 M712-WH34: AMD Ryzen 3 3250U, 17.30", 2.3 kg
External Review » Asus VivoBook 17 M712-WH34
Asus D515DA-BR638: AMD Ryzen 3 3250U, 15.60", 1.8 kg
External Review » Asus D515DA-BR638
Lenovo IdeaPad 3 15ADA05-81W10094US: AMD Ryzen 3 3250U, 15.60", 1.9 kg
External Review » Lenovo IdeaPad 3 15ADA05-81W10094US
Lenovo V14 ADA-82C6009GSP: AMD 3020e, 14.00", 1.6 kg
External Review » Lenovo V14 ADA-82C6009GSP
HP 14s-fq0007ns: AMD 3020e, 14.00", 1.5 kg
External Review » HP 14s-fq0007ns
HP Stream 14s-fq0005ns: AMD 3020e, 14.00", 1.5 kg
External Review » HP Stream 14s-fq0005ns
Lenovo IdeaPad 3 15ADA05-CWSP: AMD 3020e, 15.60", 1.9 kg
External Review » Lenovo IdeaPad 3 15ADA05-CWSP
Lenovo IdeaPad 3 14ADA05-81W000CLMH: AMD 3020e, 14.00", 1.6 kg
External Review » Lenovo IdeaPad 3 14ADA05-81W000CLMH
HP 14s-fq0002ns: AMD 3020e, 14.00", 1.5 kg
External Review » HP 14s-fq0002ns
Dell Inspiron 15 3505-C1DY0: AMD Ryzen 3 3250U, 15.60", 2 kg
External Review » Dell Inspiron 15 3505-C1DY0
Lenovo V15-ADA-82C7007SGE: AMD 3020e, 15.60", 1.9 kg
External Review » Lenovo V15-ADA-82C7007SGE
Asus Vivobook 15 F512DA-SH31: AMD Ryzen 3 3200U, 15.60", 1.8 kg
External Review » Asus Vivobook 15 F512DA-SH31
Lenovo IdeaPad 3 15ADA05-81W100DHGE: AMD 3020e, 15.60", 1.9 kg
External Review » Lenovo IdeaPad 3 15ADA05-81W100DHGE
Lenovo IdeaPad 3 15ADA05-81W100KHSP: AMD 3020e, 15.60", 1.9 kg
External Review » Lenovo IdeaPad 3 15ADA05-81W100KHSP
HP 15s-eq1026ns: AMD Ryzen 3 3250U, 15.60", 1.7 kg
External Review » HP 15s-eq1026ns
Lenovo IdeaPad 3 14ADA05: AMD 3020e, 14.00", 1.6 kg
External Review » Lenovo IdeaPad 3 14ADA05
HP 15s-eq1014ns: AMD Ryzen 3 3250U, 15.60", 1.7 kg
External Review » HP 15s-eq1014ns
HP 14s-dk1003au: AMD Athlon Gold 3150U, 14.00", 1.5 kg
External Review » HP 14s-dk1003au
HP 15s-eq0803ng: AMD Ryzen 3 3200U, 15.60", 1.7 kg
External Review » HP 15s-eq0803ng
Asus M509DA-BR241: AMD Ryzen 3 3200U, 15.60", 1.9 kg
External Review » Asus M509DA-BR241
Lenovo Ideapad S145-14API-81UV0000UK: AMD Athlon 300U, 14.00", 1.6 kg
External Review » Lenovo Ideapad S145-14API-81UV0000UK
Lenovo Ideapad S340-14API-81NB00D4SP: AMD Ryzen 3 3200U, 14.00", 1.6 kg
External Review » Lenovo Ideapad S340-14API-81NB00D4SP
Asus VivoBook 15 S512DA-BR658T: AMD Ryzen 3 3200U, 15.60"
External Review » Asus VivoBook 15 S512DA-BR658T
Lenovo Ideapad C340-14API 81N600A8GE: AMD Ryzen 3 3200U, 14.00", 1.7 kg
External Review » Lenovo Ideapad C340-14API 81N600A8GE
Lenovo V155-15API 81V5000YGE: AMD Athlon 300U, 15.60", 2.2 kg
External Review » Lenovo V155-15API 81V5000YGE
Lenovo V155-15API-81V50004SP: AMD Ryzen 3 3200U, 15.60", 2.2 kg
External Review » Lenovo V155-15API-81V50004SP
Asus VivoBook D509DA-EJ102T: AMD Ryzen 3 3200U, 15.60", 1.8 kg
External Review » Asus VivoBook D509DA-EJ102T
Lenovo Ideapad S340-15API-81NC007QSP: AMD Ryzen 3 3200U, 15.60", 1.8 kg
External Review » Lenovo Ideapad S340-15API-81NC007QSP
Lenovo Ideapad S145-15API-81UT00DYMB: AMD Ryzen 3 3200U, 15.60", 1.9 kg
External Review » Lenovo Ideapad S145-15API-81UT00DYMB
HP 15-db1000ng: AMD Ryzen 3 3200U, 15.60", 1.9 kg
External Review » HP 15-db1000ng
Asus M509DA-BR151: AMD Ryzen 3 3200U, 15.60", 1.9 kg
External Review » Asus M509DA-BR151
HP 15s-eq0012ns: unknown, 15.60", 1.8 kg
External Review » HP 15s-eq0012ns
Asus VivoBook 14 D409DA, Ryzen 3-3200U: AMD Ryzen 3 3200U, 14.00", 1.5 kg
External Review » Asus VivoBook 14 D409DA, Ryzen 3-3200U
Acer Aspire 3 A315-42-R1BU: AMD Ryzen 3 3200U, 15.60", 1.9 kg
External Review » Acer Aspire 3 A315-42-R1BU
Asus D509DA-BR128: AMD Ryzen 3 3200U, 15.60", 1.9 kg
External Review » Asus D509DA-BR128
HP 15-db1002ns: AMD Ryzen 3 3200U, 15.60", 1.8 kg
External Review » HP 15-db1002ns
Lenovo Ideapad S340-14API-81NB0045GE: AMD Ryzen 3 3200U, 14.00", 1.7 kg
External Review » Lenovo Ideapad S340-14API-81NB0045GE
HP 14-dk0014ns: AMD Ryzen 3 3200U, 14.00", 1.5 kg
External Review » HP 14-dk0014ns
Asus VivoBook S512DA-BR608: AMD Ryzen 3 3200U, 15.60", 1.6 kg
External Review » Asus VivoBook S512DA-BR608
Acer Swift 3 SF314-41-R4J1: AMD Ryzen 3 3200U, 14.00", 1.5 kg
External Review » Acer Swift 3 SF314-41-R4J1
Acer Aspire 5 A515-43-R19L: AMD Ryzen 3 3200U, 15.60", 1.8 kg
External Review » Acer Aspire 5 A515-43-R19L
HP 14s-dk0001ax: AMD Ryzen 3 3200U, 14.00", 1.5 kg
External Review » HP 14s-dk0001ax
Lenovo Yoga 530-14ARR-81H9005SMX: AMD Ryzen 3 2200U, 14.00", 1.6 kg
External Review » Lenovo Yoga 530-14ARR-81H9005SMX
Acer Swift 3 SF314-41-R80D: AMD Athlon 300U, 14.00", 1.5 kg
External Review » Acer Swift 3 SF314-41-R80D
HP 15-db1013ns: AMD Ryzen 3 3200U, 15.60", 1.8 kg
External Review » HP 15-db1013ns
HP 15-db1002ng: AMD Ryzen 3 3200U, 15.60", 1.8 kg
External Review » HP 15-db1002ng
HP 15-db0145ur: AMD Ryzen 3 2200U, 15.60", 2.1 kg
External Review » HP 15-db0145ur
HP 14-dk0001ns: AMD Ryzen 3 3200U, 14.00", 1.5 kg
External Review » HP 14-dk0001ns
Acer Aspire 3 A315-41-R84K: AMD Ryzen 3 2200U, 15.60", 2.3 kg
External Review » Acer Aspire 3 A315-41-R84K
HP 15-db0025ns: AMD Ryzen 3 2200U, 15.60", 1.8 kg
External Review » HP 15-db0025ns
Lenovo IdeaPad 330-15ARR-81D2005JGE: AMD Ryzen 3 2200U, 15.60", 2.2 kg
External Review » Lenovo IdeaPad 330-15ARR-81D2005JGE
Lenovo Yoga 530-14ARR-81H90019SP: AMD Ryzen 3 2200U, 14.00", 1.7 kg
External Review » Lenovo Yoga 530-14ARR-81H90019SP
Lenovo Ideapad 530S-14ARR-81H1001RGE: AMD Ryzen 3 2200U, 14.00", 1.5 kg
External Review » Lenovo Ideapad 530S-14ARR-81H1001RGE
Lenovo Ideapad 330-15ARR-81D2007MSP: AMD Ryzen 3 2200U, 15.60", 2.2 kg
External Review » Lenovo Ideapad 330-15ARR-81D2007MSP
Lenovo Yoga 530-14ARR-81H90025PB: AMD Ryzen 3 2200U, 14.00", 1.7 kg
External Review » Lenovo Yoga 530-14ARR-81H90025PB
HP 15-db0027NS: AMD Ryzen 3 2200U, 15.60", 2.1 kg
External Review » HP 15-DB0027NS
Asus VivoBook 15 X505ZA: AMD Ryzen 3 2200U, 15.60", 1.7 kg
External Review » Asus VivoBook 15 X505ZA
HP 15-db0401ng: AMD Ryzen 3 2200U, 15.60", 2 kg
External Review » HP 15-db0401ng
Lenovo Ideapad 330S-15ARR-81FB005KSP: AMD Ryzen 3 2200U, 15.60", 1.9 kg
External Review » Lenovo Ideapad 330S-15ARR-81FB005KSP
HP 17-ca0200ng: AMD Ryzen 3 2200U, 17.30", 2.5 kg
External Review » HP 17-ca0200ng
Acer Aspire 3 A315-41-R3AZ: AMD Ryzen 3 2200U, 15.60", 2.1 kg
External Review » Acer Aspire 3 A315-41-R3AZ
HP 17-ca0012ng: AMD Ryzen 3 2200U, 17.30", 2.5 kg
External Review » HP 17-ca0012ng
HP 15-db0034ns: AMD Ryzen 3 2200U, 15.60", 1.8 kg
External Review » HP 15-db0034ns
Dell Inspiron 15 5575-98MH4: AMD Ryzen 3 2200U, 15.60", 2.1 kg
External Review » Dell Inspiron 15 5575-98MH4
» Comparison of GPUs
Detailed list of all laptop GPUs sorted by class and performance.
» Benchmark List
Sort and restrict laptop GPUs based on performance in synthetic benchmarks.
» Notebook Gaming List
Playable games for each graphics card and their average FPS results.
* Approximate position of the graphics adapter
» Notebookcheck多媒体笔记本电脑Top 10排名
» Notebookcheck游戏笔记本电脑Top 10排名
» Notebookcheck低价办公/商务笔记本电脑Top 10排名
» Notebookcheck高端办公/商务笔记本电脑Top 10排名
» Notebookcheck工作站笔记本电脑Top 10排名
» Notebookcheck亚笔记本电脑Top 10排名
» Notebookcheck超级本产品Top 10排名
» Notebookcheck变形本产品Top 10排名
» Notebookcheck平板电脑Top 10排名
» Notebookcheck智能手机Top 10排名
» Notebookcheck评测过最出色的笔记本电脑屏幕
» Notebookcheck售价500欧元以下笔记本电脑Top 10排名
» Notebookcheck售价300欧元以下笔记本电脑Top 10排名