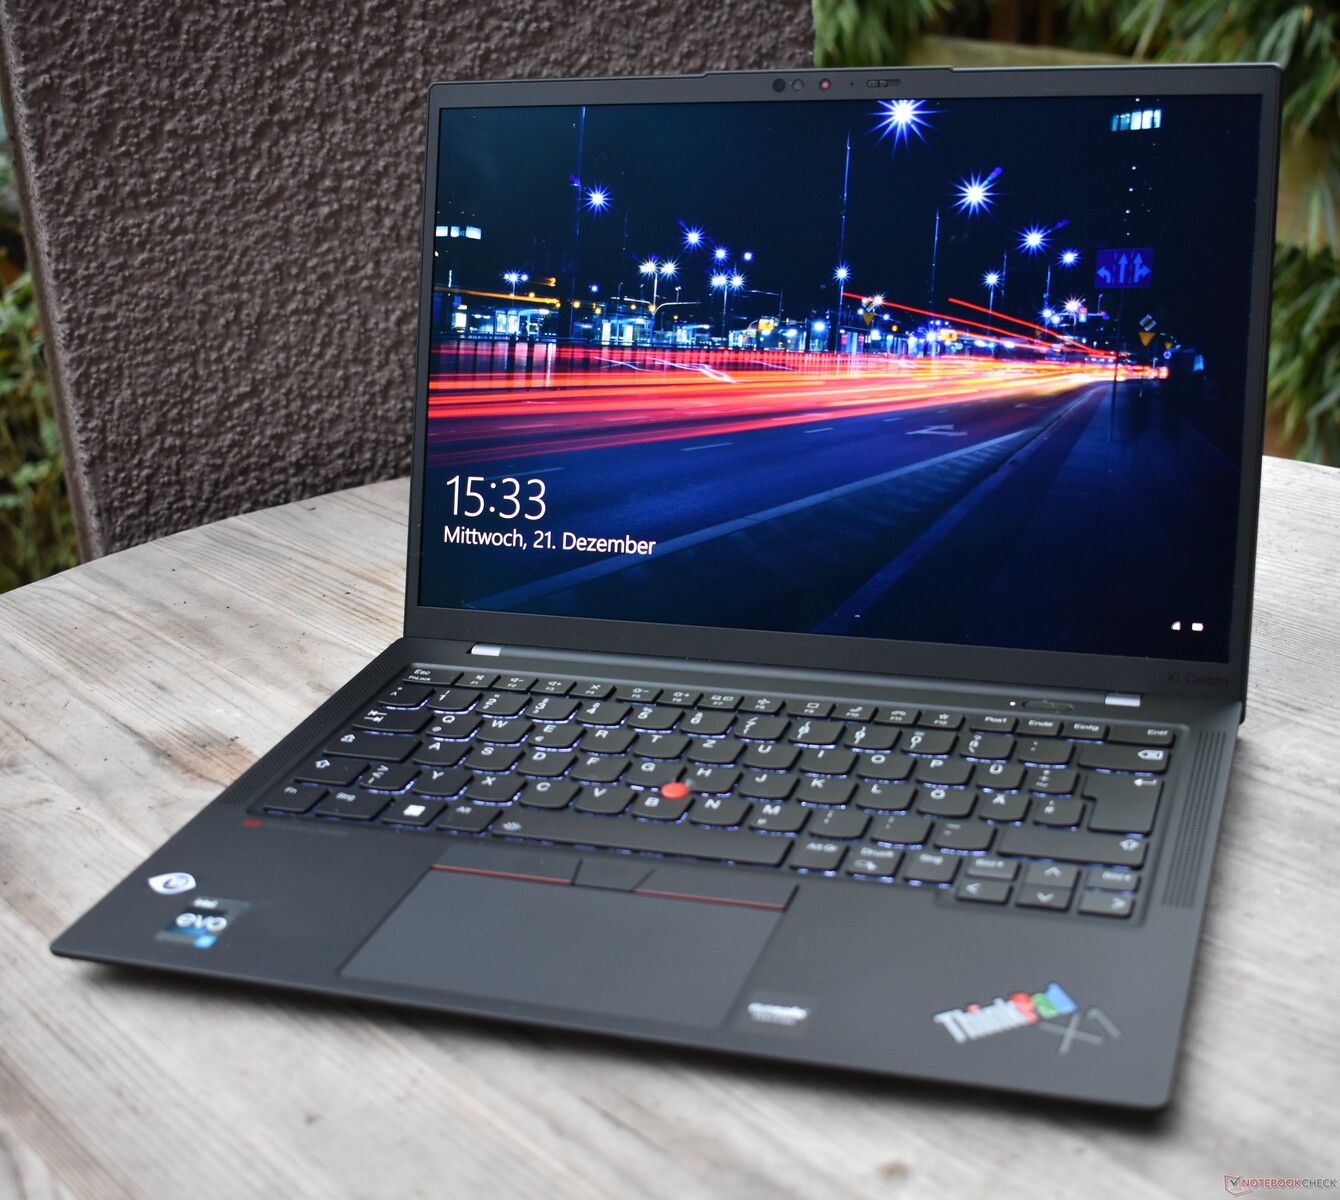
联想ThinkPad X1 Carbon G10 30周年笔记本评测。存在体力问题的OLED版
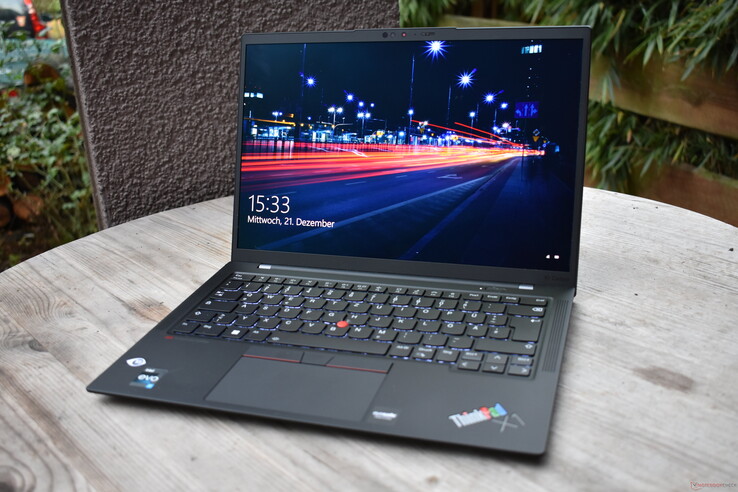
30年是科技行业的永恒,也是人类寿命中的漫长时间。联想正在用一个特殊的模型来庆祝这一里程碑。联想ThinkPad X1 Carbon G10 30周年纪念版,这就是今天评测的主题。
当然,这并不是我们放大镜下的第一台ThinkPad X1 Carbon Gen 10,这也是为什么这是一次测试更新。在规格方面,手头的这个型号因为采用了OLED屏幕而特别有趣。看看联想是否改进了英特尔Alder Lake P28 CPU的性能,也将是令人激动的事情。自ThinkPad X1 Carbon G10的第一次评论以来,联想是否改进了英特尔阿尔德湖P28处理器的性能?,当时采用的是i5处理器。
潜在的竞争对手比较
Rating | Date | Model | Weight | Height | Size | Resolution | Price |
|---|---|---|---|---|---|---|---|
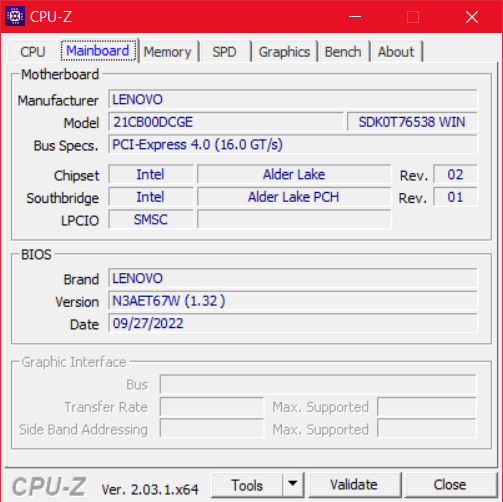
| 88.9 % v7 (old) | 12 / 2022 | Lenovo ThinkPad X1 Carbon G10 21CB00DCGE i7-1260P, Iris Xe G7 96EUs | 1.2 kg | 15.36 mm | 14.00" | 2880x1800 | |
| 90.2 % v7 (old) | 06 / 2022 | Lenovo ThinkPad X1 Carbon G10 21CC001RGE i5-1250P, Iris Xe G7 80EUs | 1.2 kg | 15.36 mm | 14.00" | 1920x1200 | |
| 90.3 % v7 (old) | 09 / 2021 | Lenovo ThinkPad X1 Carbon G9-20XWCTO1WW i7-1165G7, Iris Xe G7 96EUs | 1.2 kg | 14.9 mm | 14.00" | 3840x2400 | |
| 88.8 % v7 (old) | 10 / 2022 | Lenovo ThinkPad Z13 G1-21D20016GE R7 PRO 6860Z, Radeon 680M | 1.3 kg | 14 mm | 13.30" | 2880x1800 | |
| 91 % v7 (old) | 08 / 2022 | HP Elite Dragonfly G3 i7-1265U, Iris Xe G7 96EUs | 1.2 kg | 16.3 mm | 13.50" | 1920x1280 | |
| 89.8 % v7 (old) | 08 / 2022 | Dell Latitude 9430 2-in-1 i7-1265U, Iris Xe G7 96EUs | 1.5 kg | 13.94 mm | 14.00" | 2560x1600 |
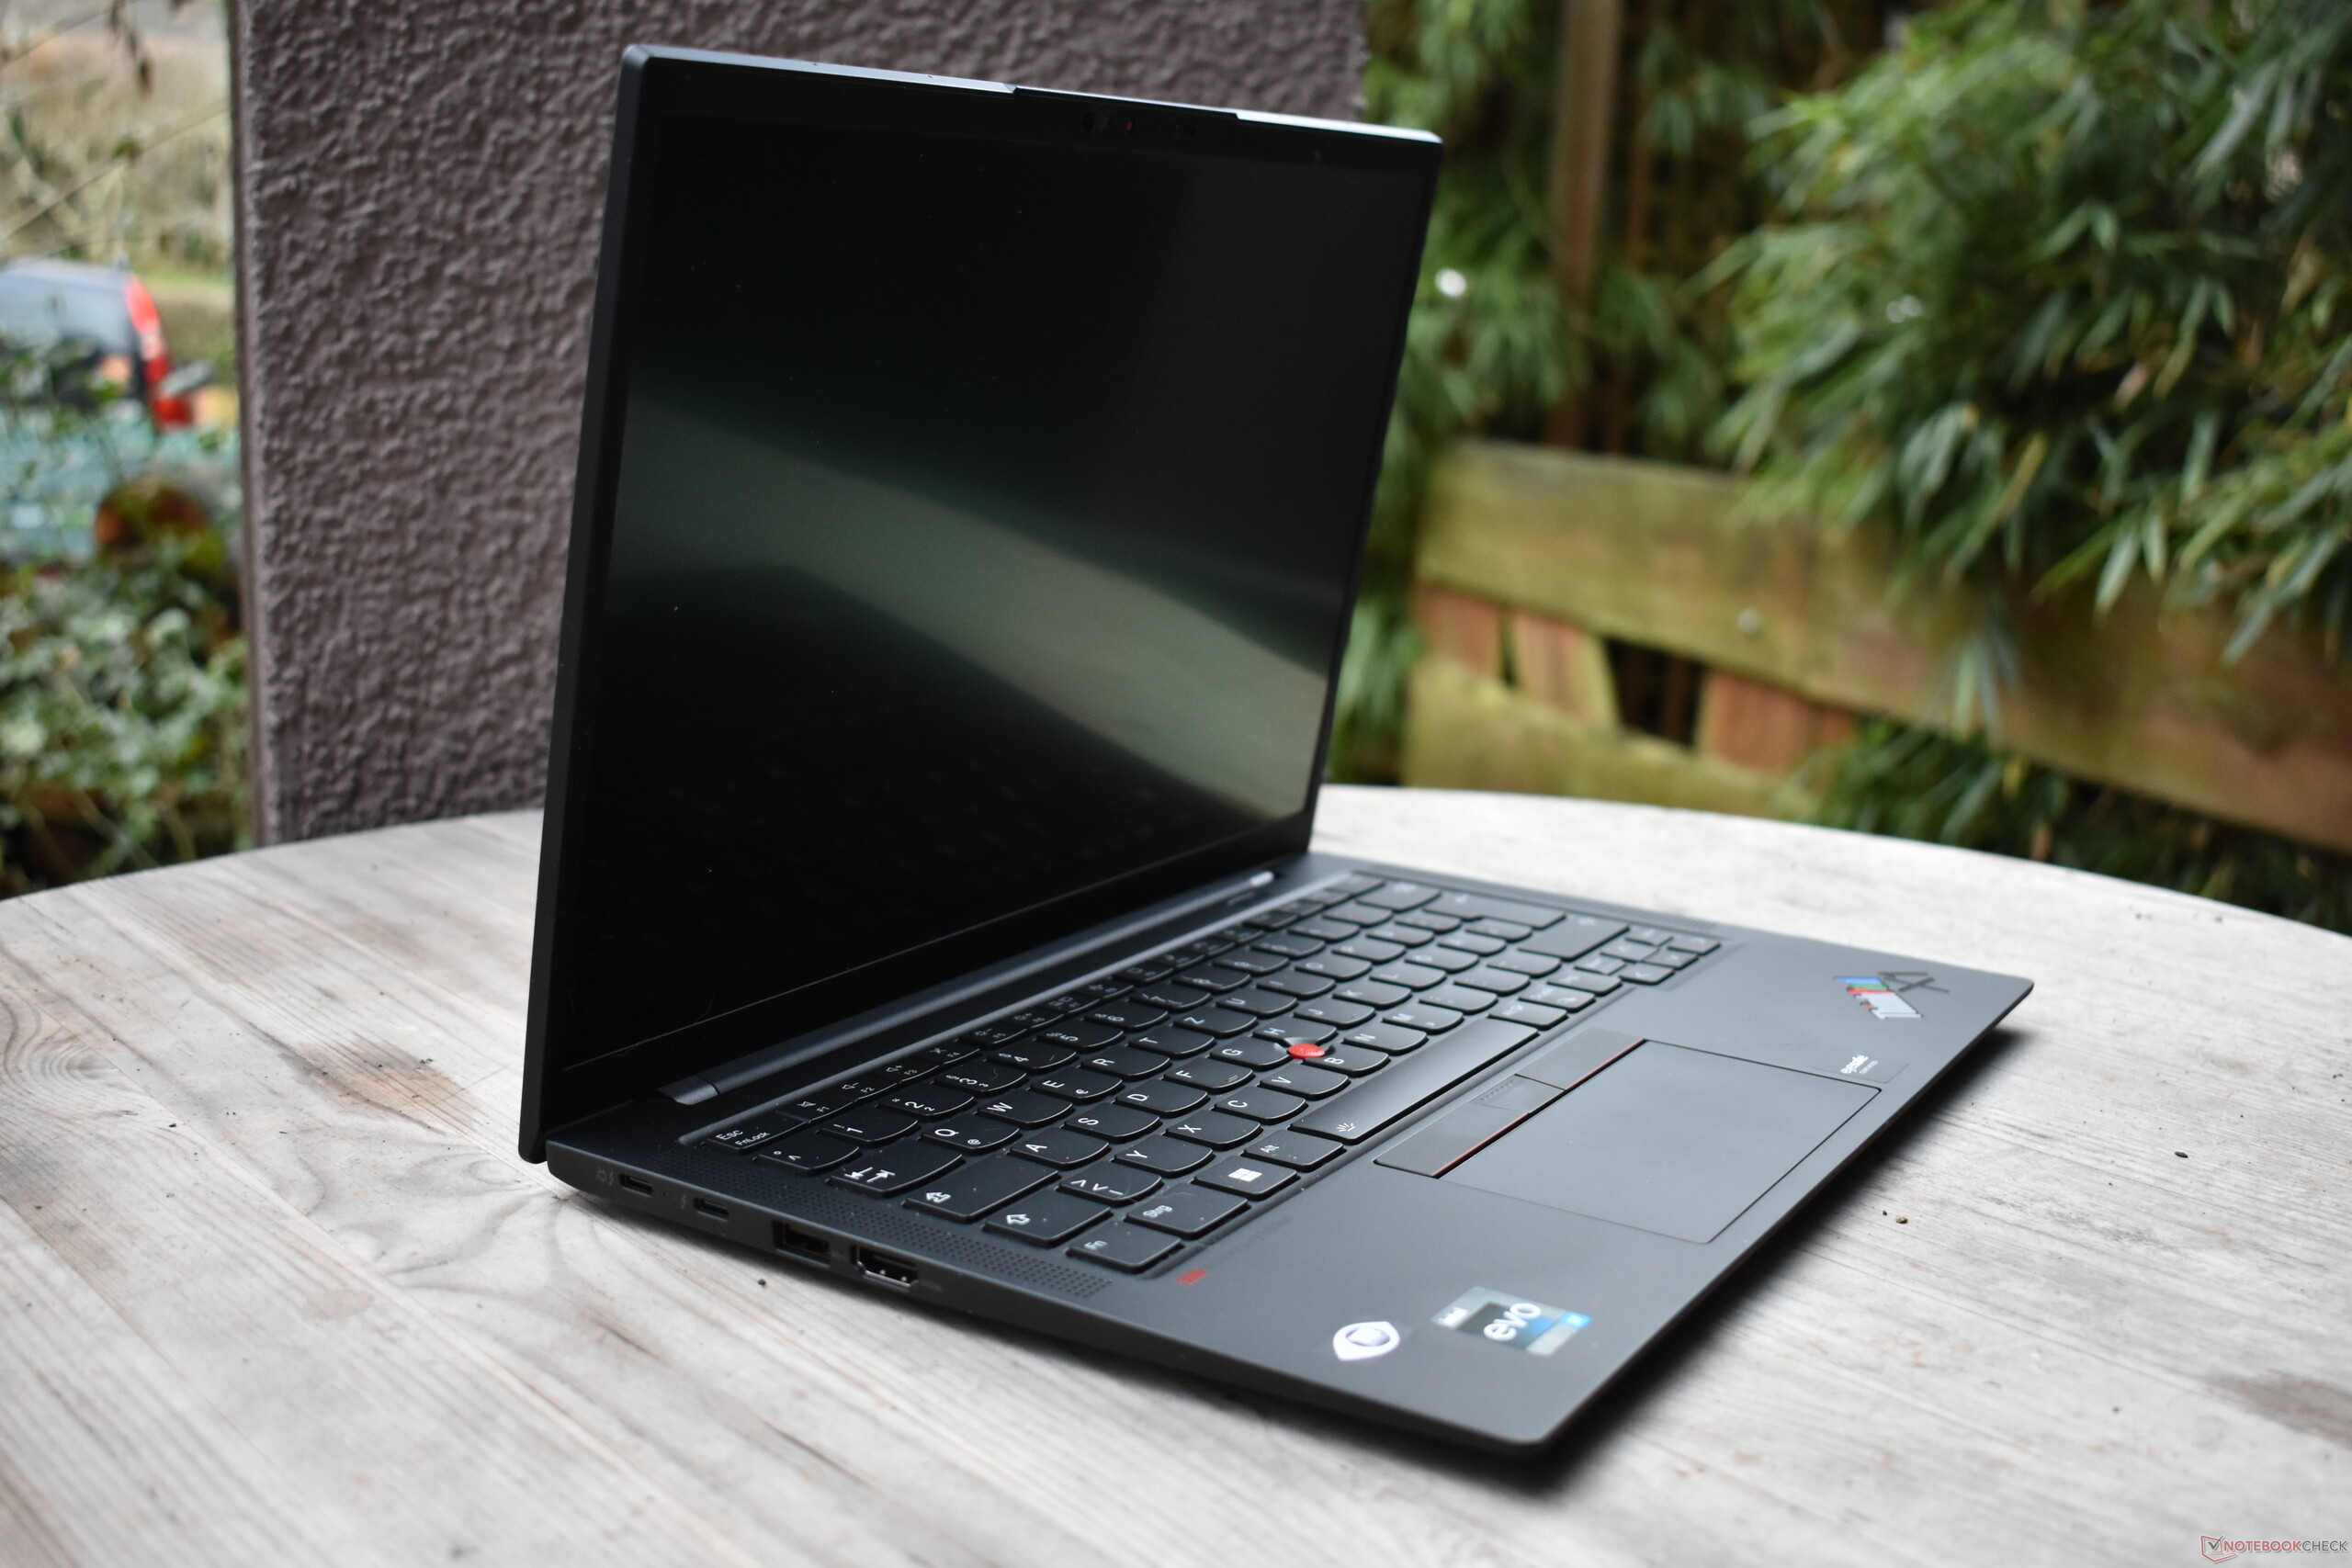
与普通模式的区别
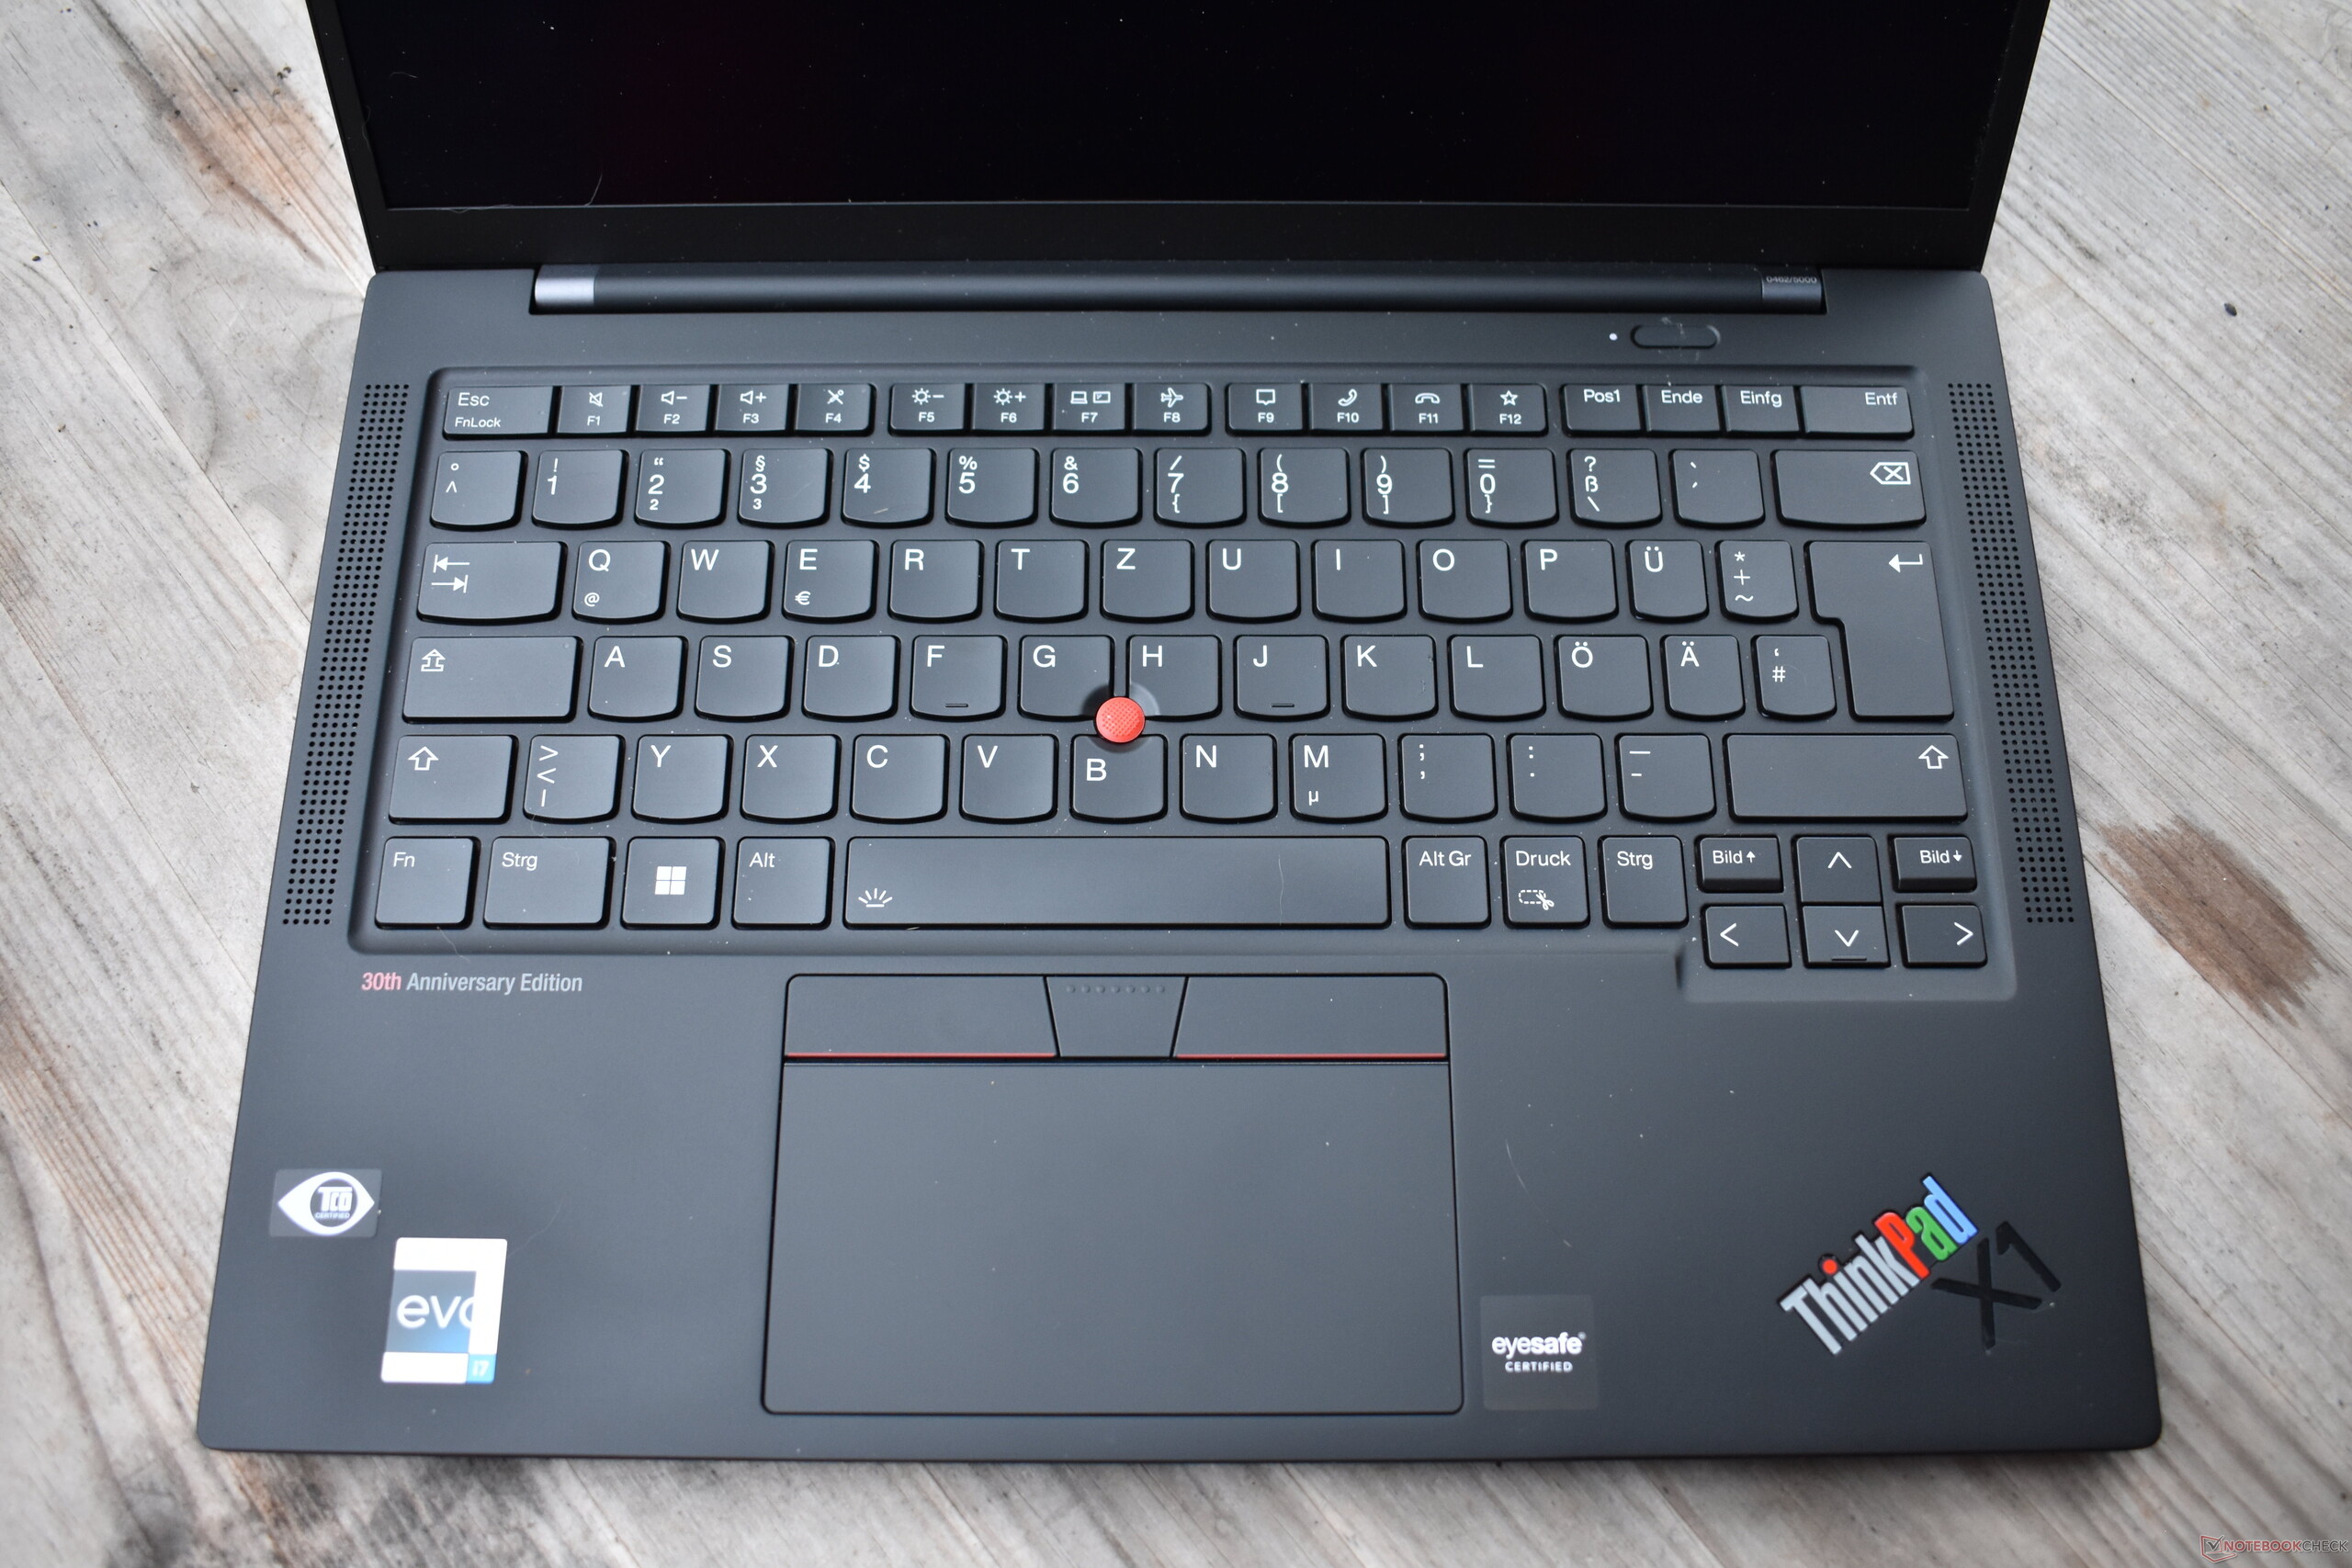
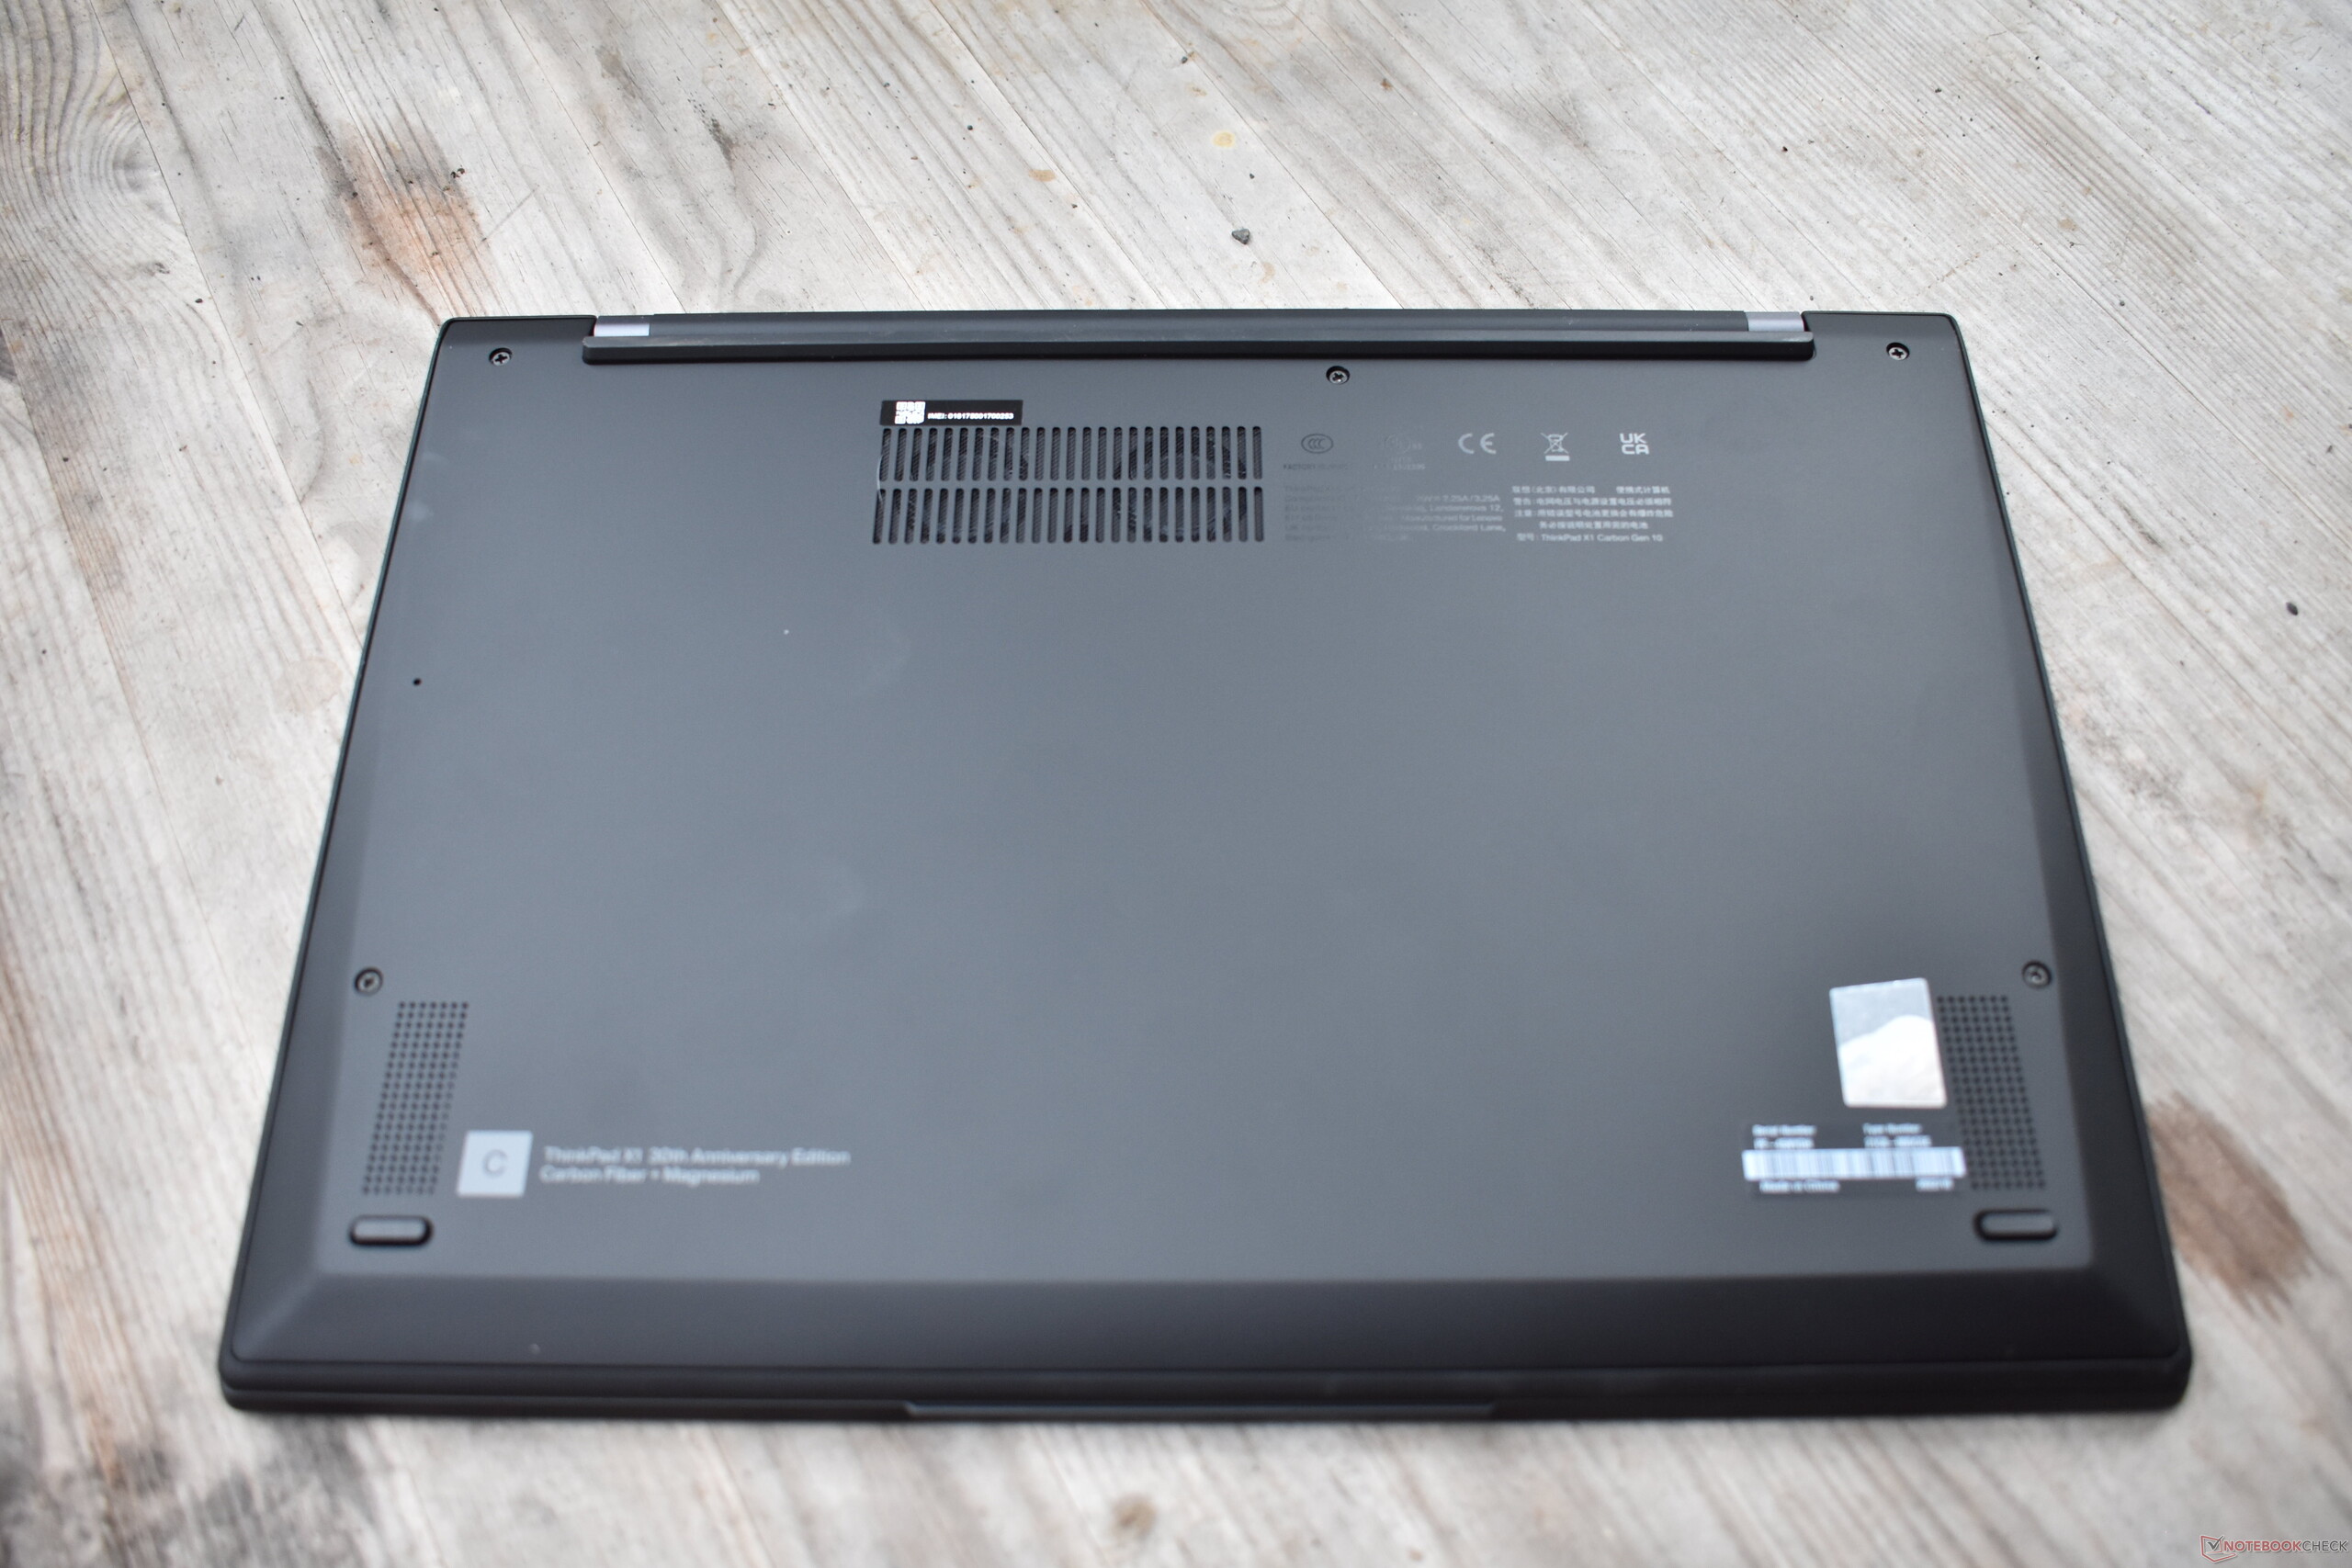
不同于 思考板25五年前,联想放弃了对X1 Carbon Gen 10 30周年纪念版硬件的重大改变。取而代之的是一些外观上的修改,比如掌托上的 "30周年纪念版 "标志,铰链上激光蚀刻的单元编号(总共有5000个型号),以及带有IBM RGB三色方案中的 "Pad "部分的特别周年ThinkPad标志--灵感来自旧的 灵感来自于旧的IBM ThinkPad标志。.此外,交货范围包括一个特别版包装和三个额外的TrackPoint帽,每个都是红、绿、蓝三色。除此之外,它是一款普通的ThinkPad X1 Carbon G10。联想这次没有试图恢复经典的ThinkPad七行键盘。

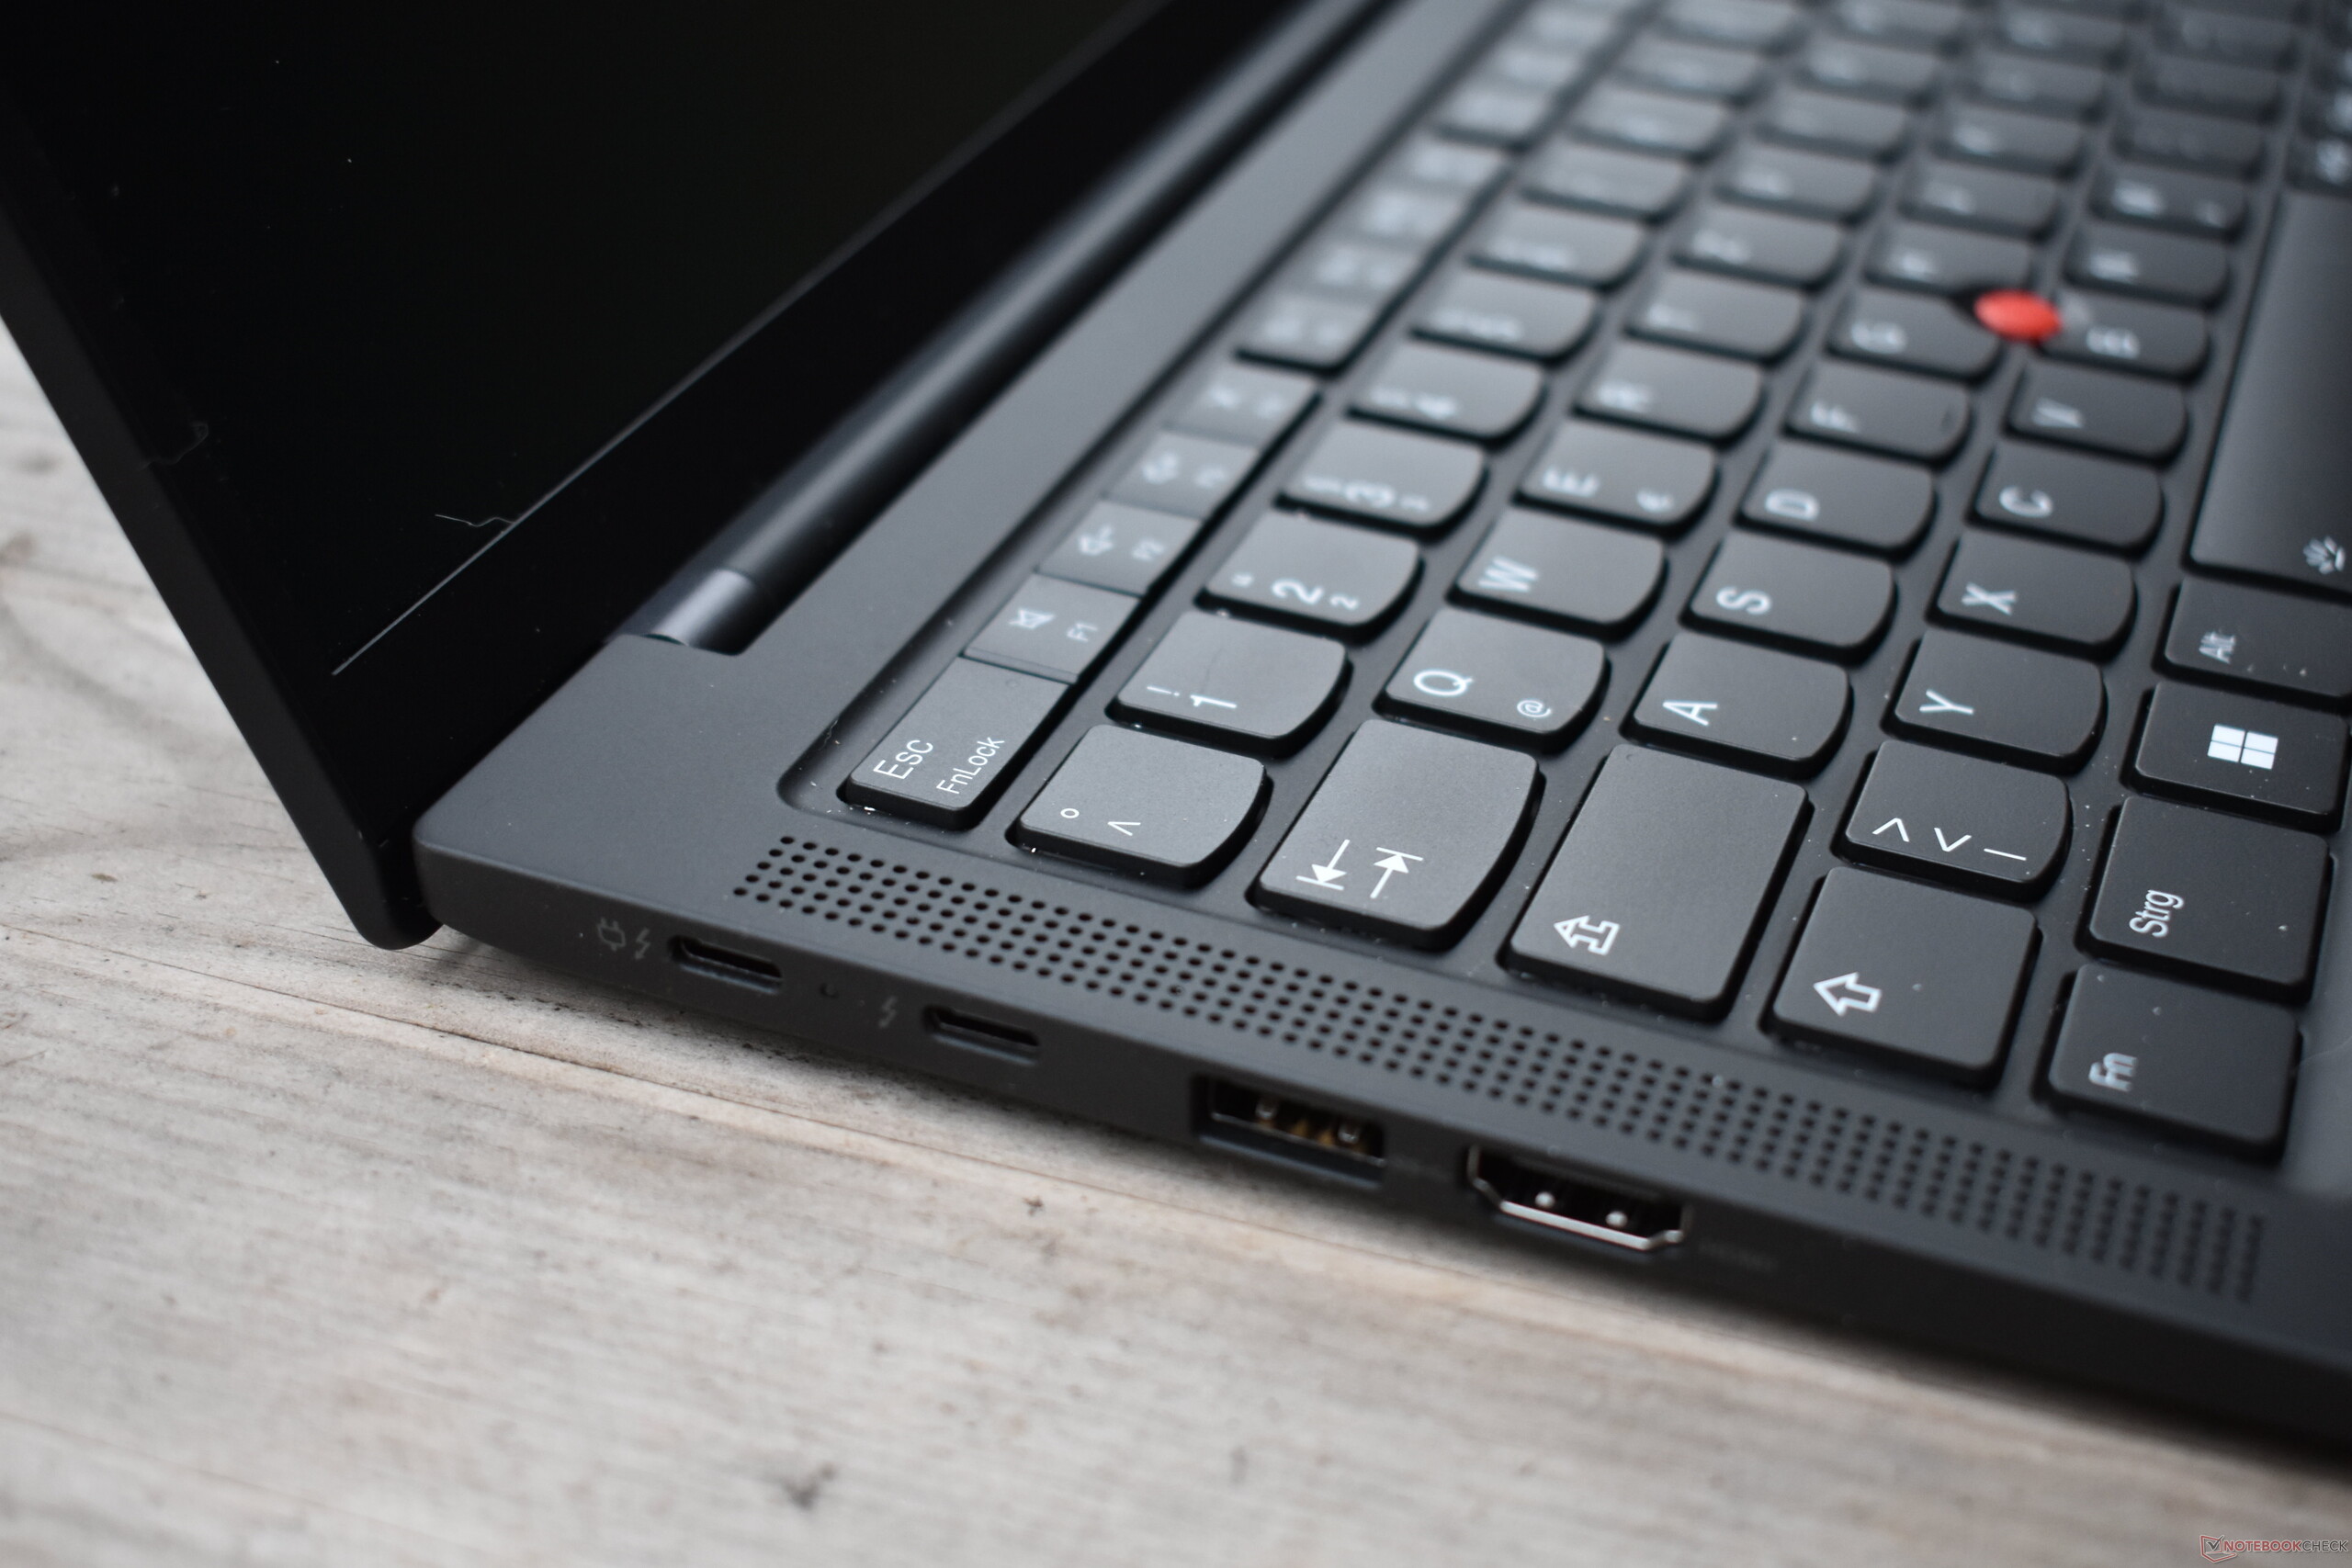
设备没有任何变化,WiFi和网络摄像头的结果几乎与 对ThinkPad X1 Carbon G10的第一次评论。...例外情况。这里测试的版本运行Windows 10,这就是为什么我们无法测试WiFi 6E。


X1 Carbon的OLED显示屏几乎是哑光的

这个版本的联想ThinkPad X1 Carbon Gen 10的核心部分毫无疑问是屏幕。与几乎所有的ThinkPad一样,有各种选择,我们在对X1 Carbon G10的第一次评论中也列出了这些选择。今天的评测单元配备了14英寸2.8K显示屏(2880×1800)--该面板(型号为ATNA40YK01-1)来自三星,是一块OLED显示屏。
据联想称,该屏幕据说能够以400cd/m²的亮度显示SDR内容,以500cd/m²的亮度显示HDR。虽然我们没有测量后者,但我们可以肯定地确认SDR值。这使得该屏幕比4K UHD显示器的X1 Carbon G9和2.5K LCD的 戴尔Latitude 9430但作为回报,OLED显示屏也有其他优势。亮度分布非常均匀,没有背光渗漏,响应时间也明显优于IPS对手。然而,遗憾的是,联想将刷新率保持在60赫兹,因为90赫兹将是一个很好的进步。
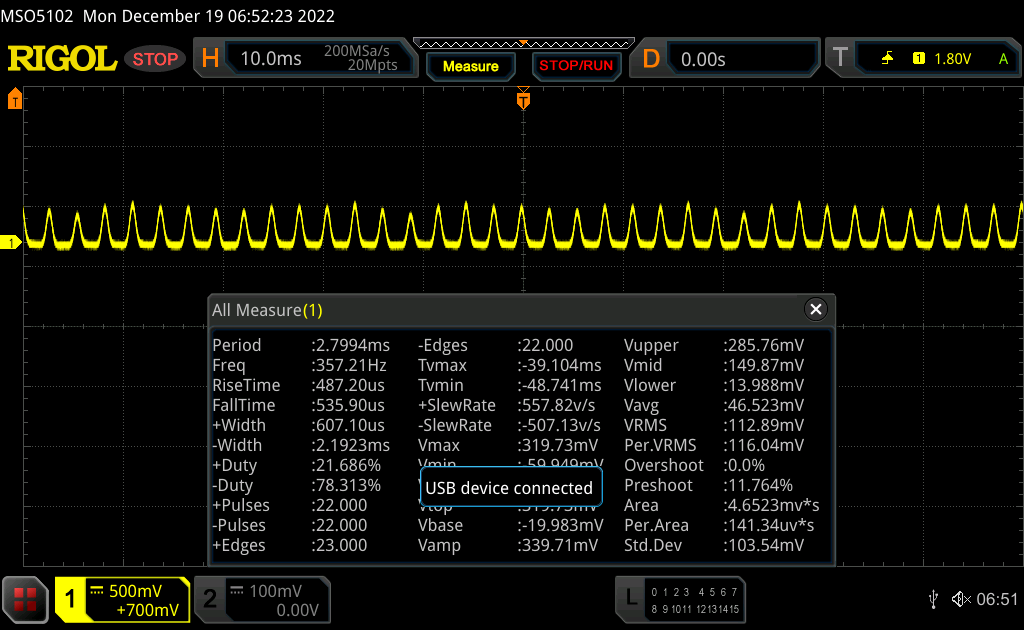
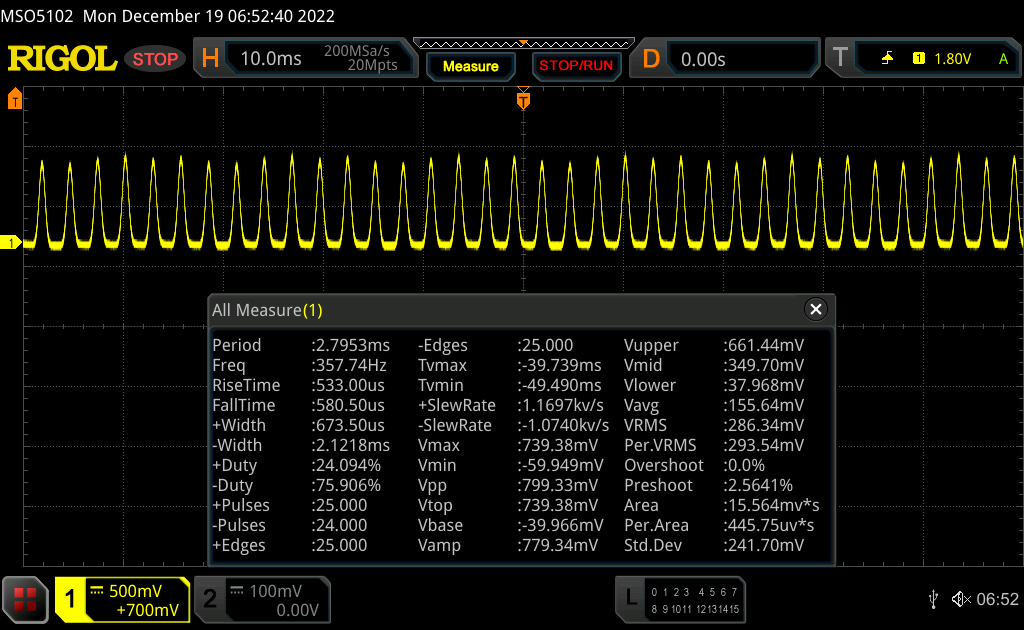
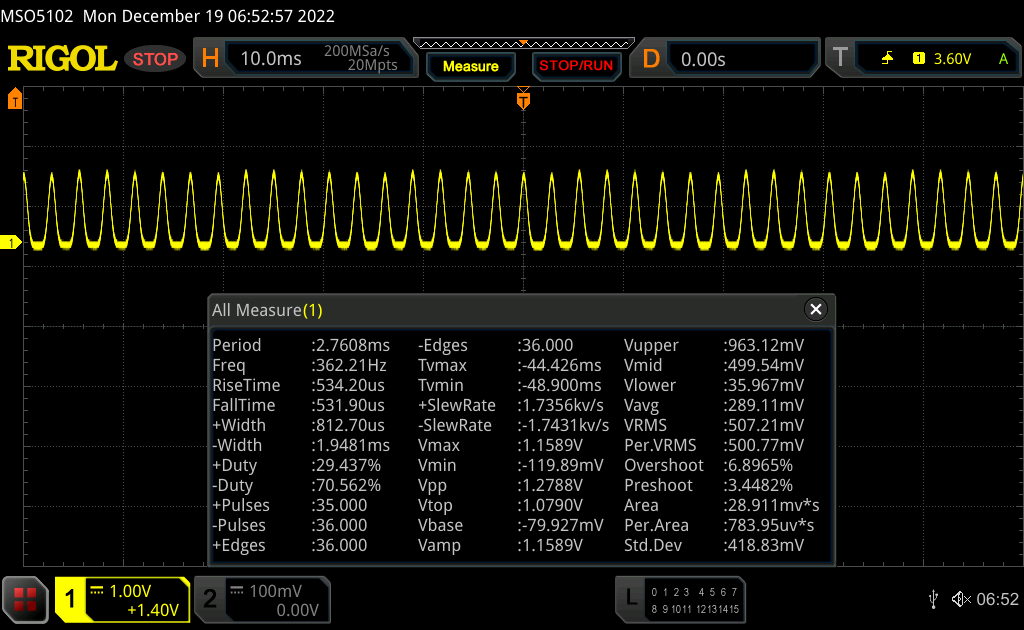
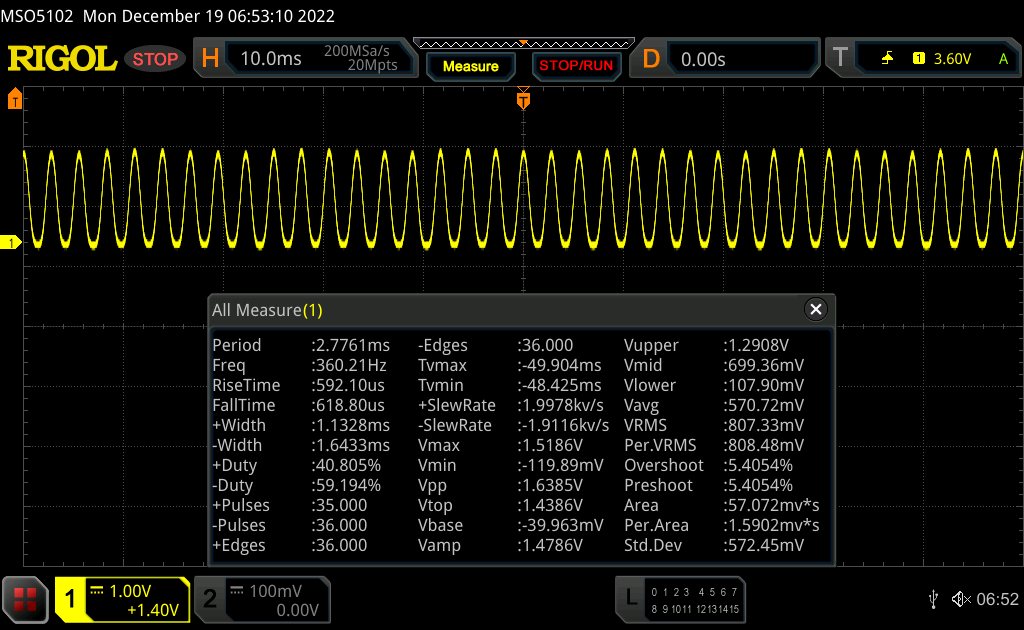
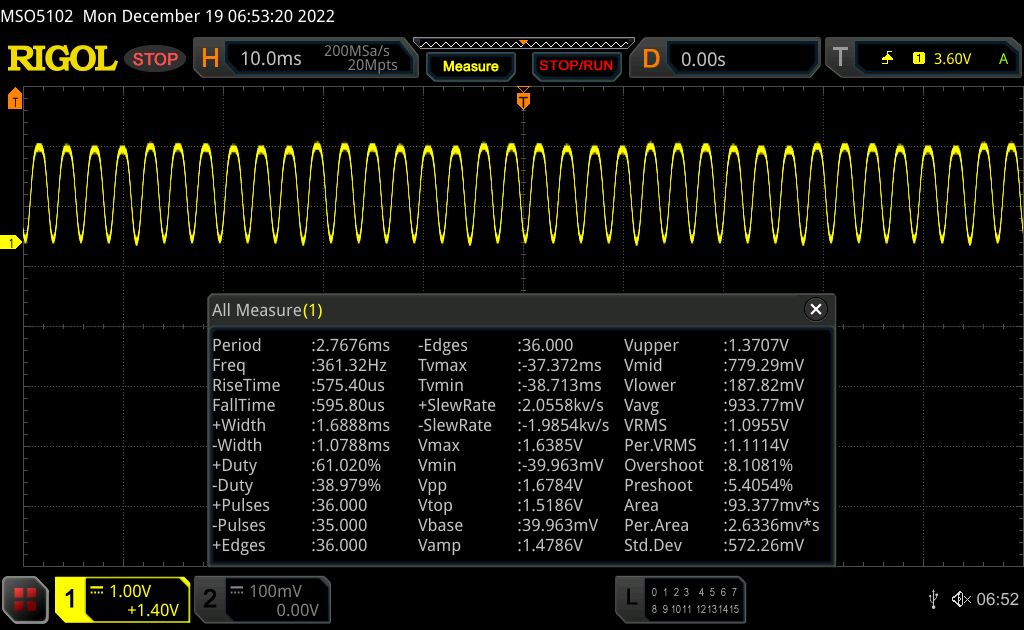
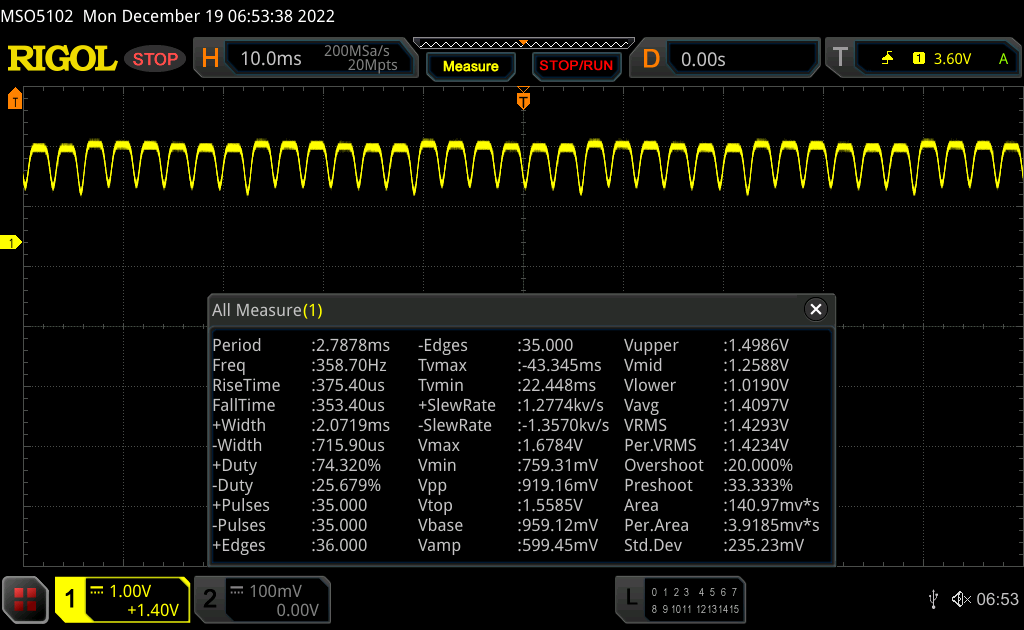
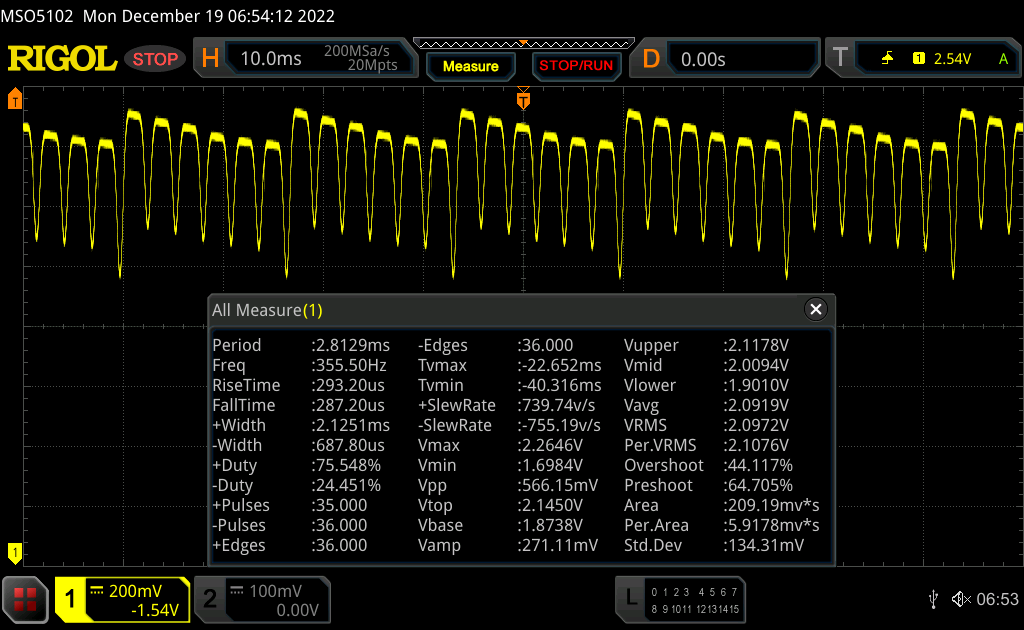
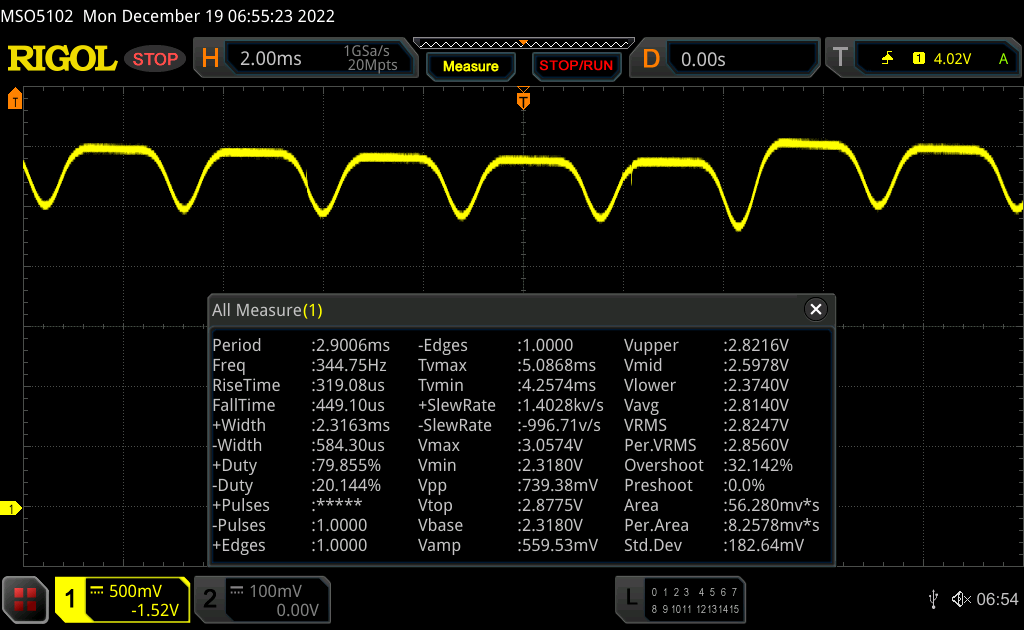
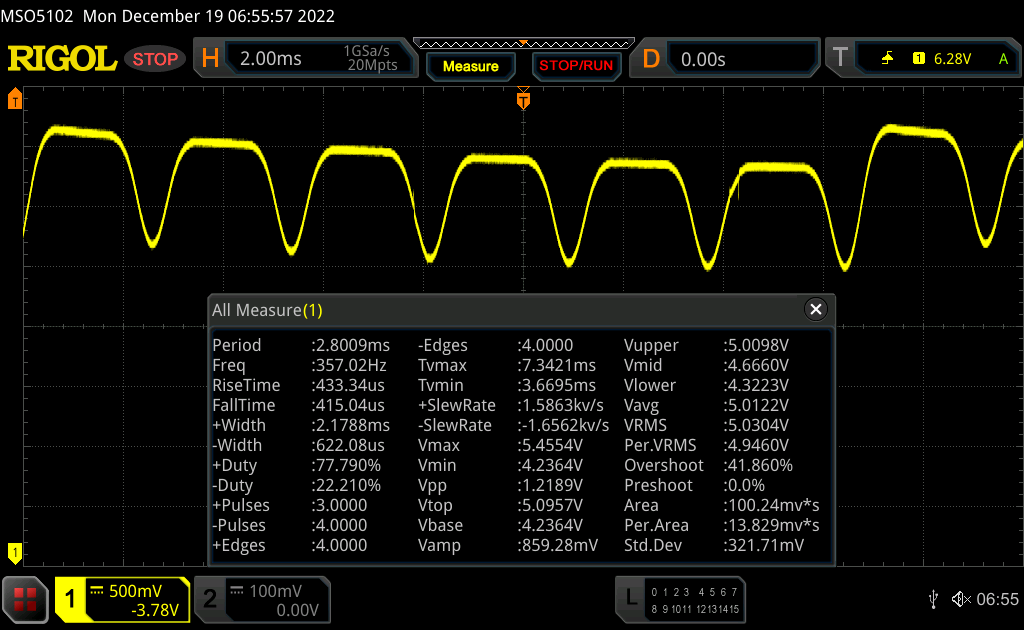
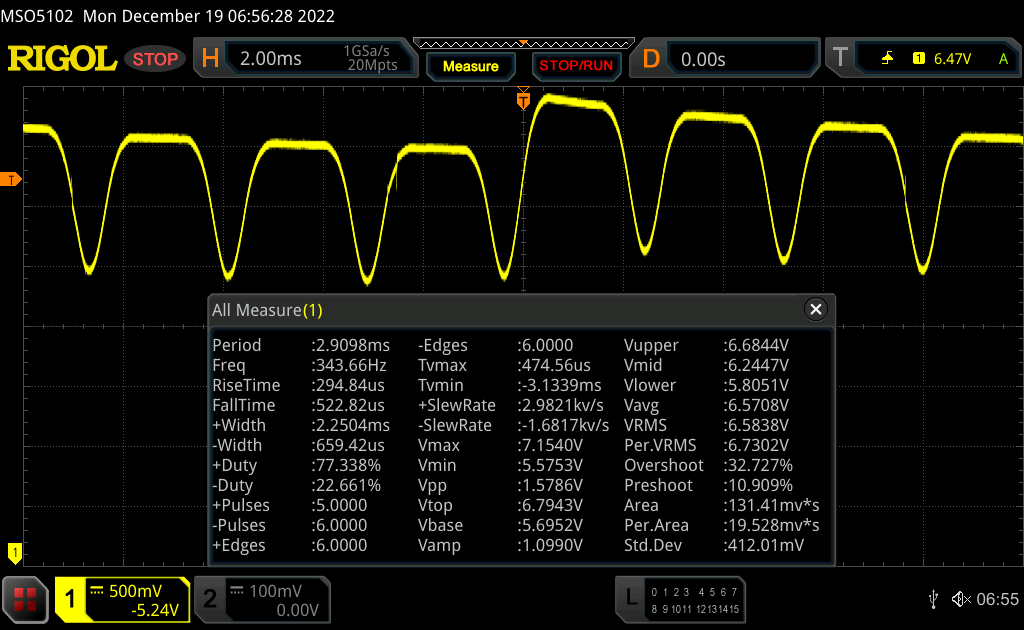
OLED技术的一个缺点。PWM始终存在。在所有亮度下,PWM频率约为342赫兹,即使肉眼看不到闪烁,也可能会让敏感的人感到头疼。
| |||||||||||||||||||||||||
Brightness Distribution: 97 %
Center on Battery: 400 cd/m²
Contrast: ∞:1 (Black: 0 cd/m²)
ΔE ColorChecker Calman: 2.2 | ∀{0.5-29.43 Ø4.71}
calibrated: 2.6
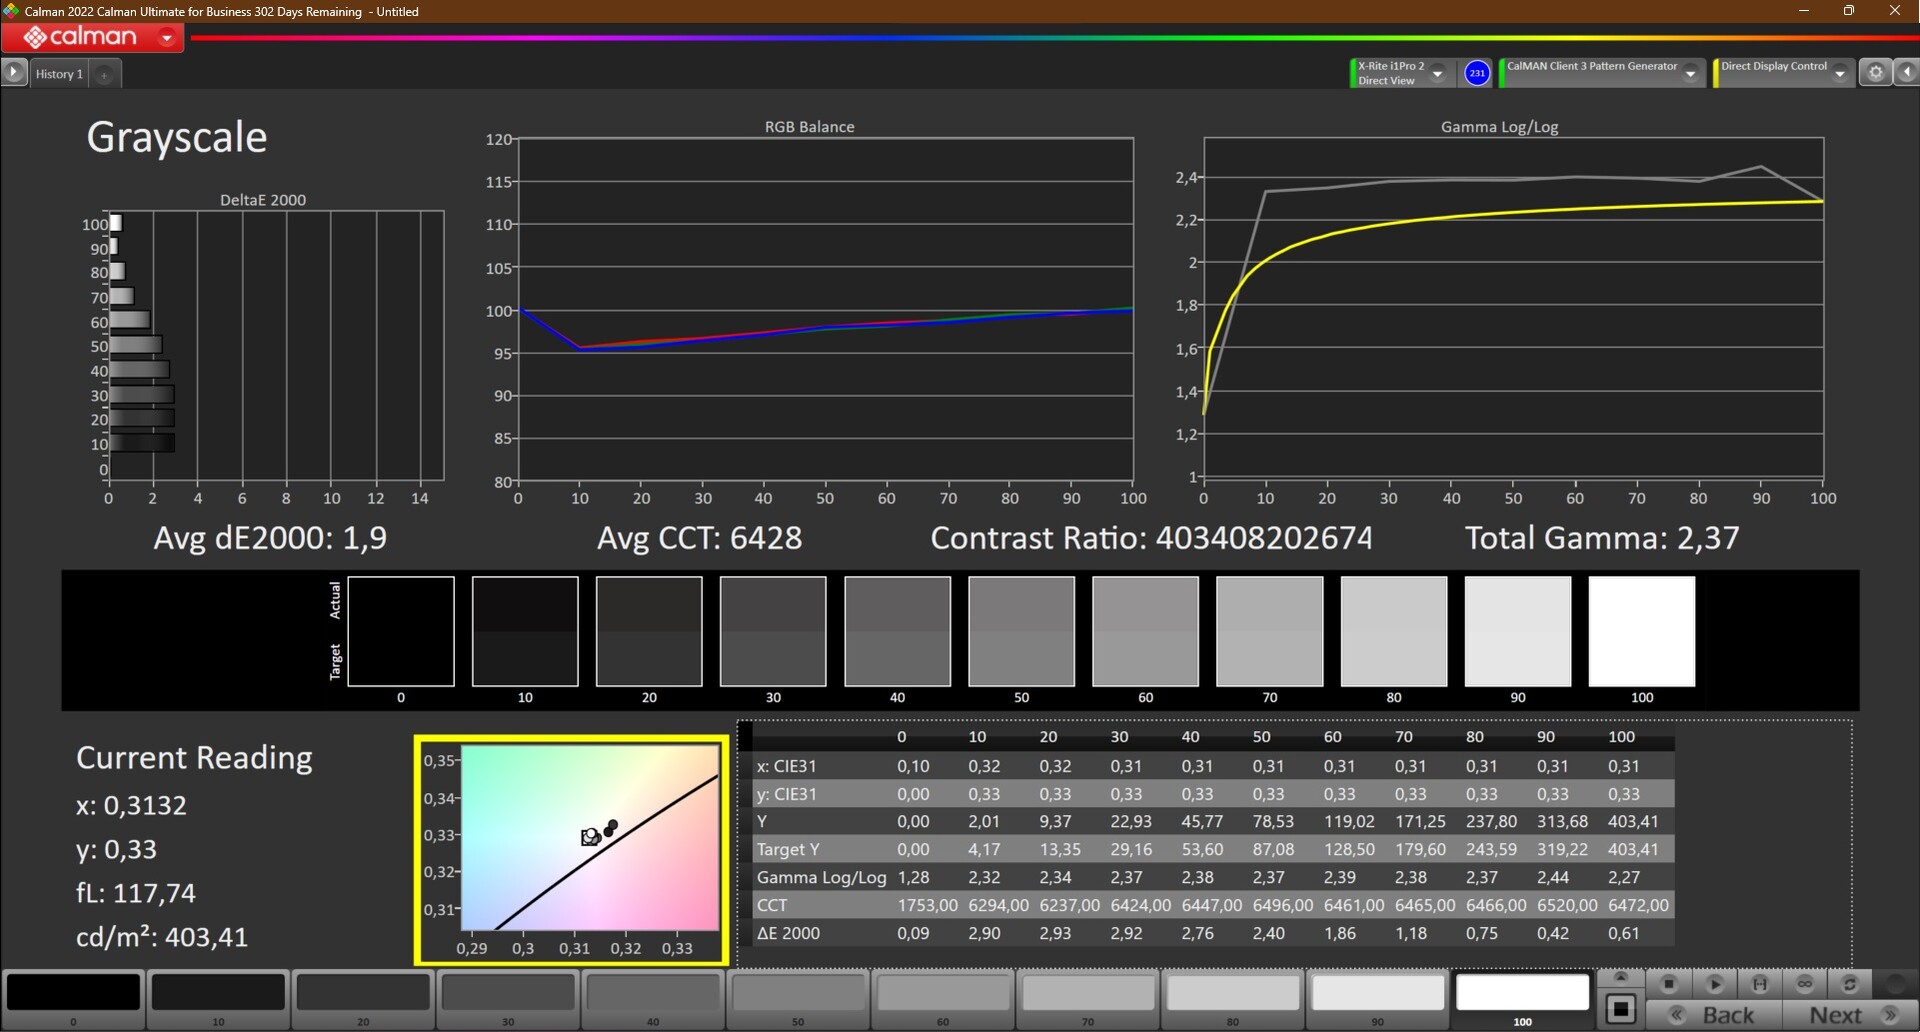
ΔE Greyscale Calman: 1.2 | ∀{0.09-98 Ø4.96}
96.5% AdobeRGB 1998 (Argyll 3D)
100% sRGB (Argyll 3D)
99.7% Display P3 (Argyll 3D)
Gamma: 2.22
CCT: 6364 K
| Lenovo ThinkPad X1 Carbon G10 21CB00DCGE ATNA40YK01-1, OLED, 2880x1800, 14" | Lenovo ThinkPad X1 Carbon G10 21CC001RGE B140UAN02.1, IPS LED, 1920x1200, 14" | Lenovo ThinkPad X1 Carbon G9-20XWCTO1WW MNE007A1-2, IPS LED, 3840x2400, 14" | Lenovo ThinkPad Z13 G1-21D20016GE ATNA33AA02-0, OLED, 2880x1800, 13.3" | HP Elite Dragonfly G3 Chi Mei CMN13C0, IPS, 1920x1280, 13.5" | Dell Latitude 9430 2-in-1 AU Optronics B140QAN, IPS, 2560x1600, 14" | |
|---|---|---|---|---|---|---|
| Display | -16% | -4% | 0% | -21% | -13% | |
| Display P3 Coverage (%) | 99.7 | 74.6 -25% | 95.2 -5% | 99.9 0% | 68 -32% | 79.4 -20% |
| sRGB Coverage (%) | 100 | 98.6 -1% | 99.8 0% | 100 0% | 98.3 -2% | 100 0% |
| AdobeRGB 1998 Coverage (%) | 96.5 | 76.5 -21% | 89.2 -8% | 97.5 1% | 69.9 -28% | 79.4 -18% |
| Response Times | -2546% | -2754% | -29% | -3117% | -3600% | |
| Response Time Grey 50% / Grey 80% * (ms) | 1.2 ? | 45.5 ? -3692% | 46 ? -3733% | 1.9 ? -58% | 50.8 ? -4133% | 63.6 ? -5200% |
| Response Time Black / White * (ms) | 1.6 ? | 24 ? -1400% | 30 ? -1775% | 1.6 ? -0% | 35.2 ? -2100% | 33.6 ? -2000% |
| PWM Frequency (Hz) | 342 ? | 53050 ? | 240 ? | |||
| Screen | -51% | 27% | -10% | -18% | -29% | |
| Brightness middle (cd/m²) | 400 | 372 -7% | 497 24% | 371 -7% | 387.2 -3% | 517.7 29% |
| Brightness (cd/m²) | 401 | 362 -10% | 488 22% | 378 -6% | 360 -10% | 493 23% |
| Brightness Distribution (%) | 97 | 94 -3% | 87 -10% | 98 1% | 80 -18% | 90 -7% |
| Black Level * (cd/m²) | 0.18 | 0.35 | 0.04 | 0.26 | 0.33 | |
| Colorchecker dE 2000 * | 2.2 | 3.4 -55% | 1.2 45% | 2.5 -14% | 2.36 -7% | 3.38 -54% |
| Colorchecker dE 2000 max. * | 4.3 | 6.7 -56% | 2.1 51% | 4.4 -2% | 4.79 -11% | 6.25 -45% |
| Colorchecker dE 2000 calibrated * | 2.6 | 1.8 31% | 0.9 65% | 1.9 27% | 0.63 76% | 0.41 84% |
| Greyscale dE 2000 * | 1.2 | 4.3 -258% | 1.3 -8% | 2 -67% | 3 -150% | 4 -233% |
| Gamma | 2.22 99% | 2.13 103% | 2.16 102% | 2.17 101% | 2.17 101% | 2.13 103% |
| CCT | 6364 102% | 6158 106% | 6690 97% | 6228 104% | 6137 106% | 6186 105% |
| Contrast (:1) | 2067 | 1420 | 9275 | 1489 | 1569 | |
| Color Space (Percent of AdobeRGB 1998) (%) | 79.37 | |||||
| Color Space (Percent of sRGB) (%) | 99.78 | |||||
| Total Average (Program / Settings) | -871% /
-458% | -910% /
-444% | -13% /
-10% | -1052% /
-535% | -1214% /
-620% |
* ... smaller is better
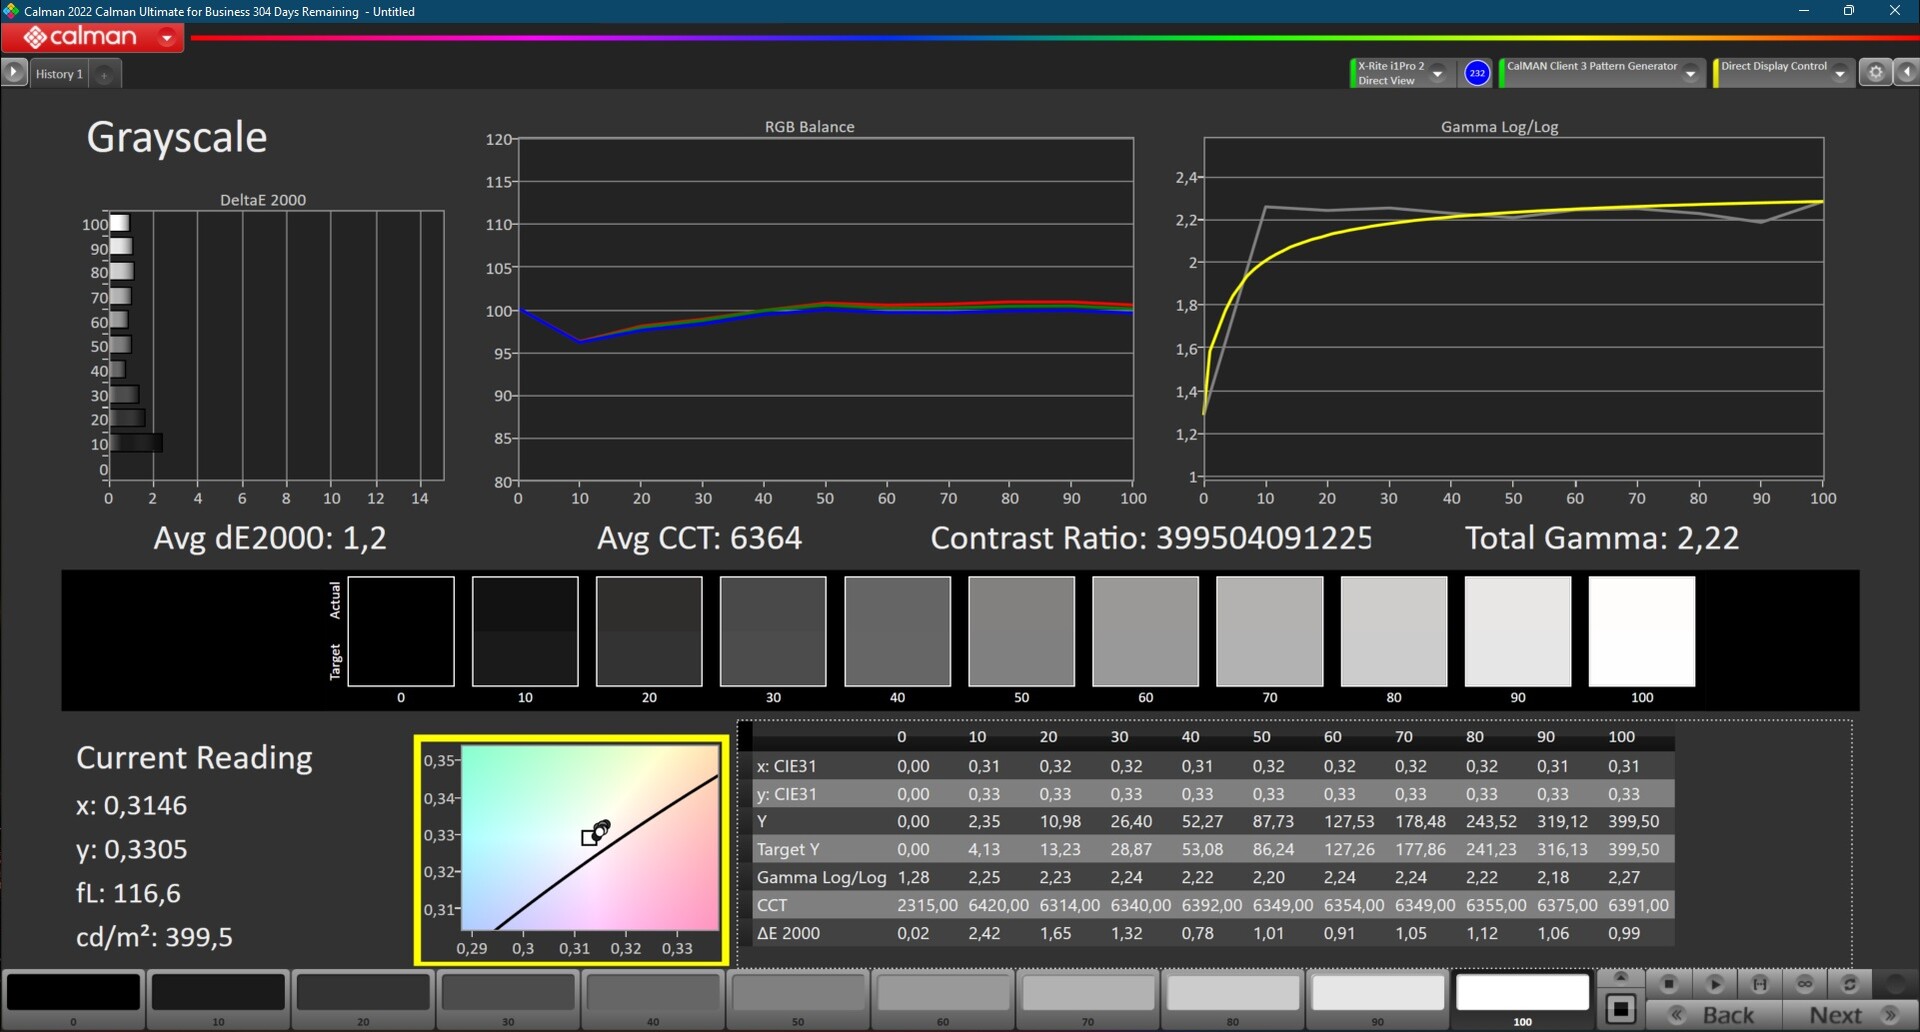
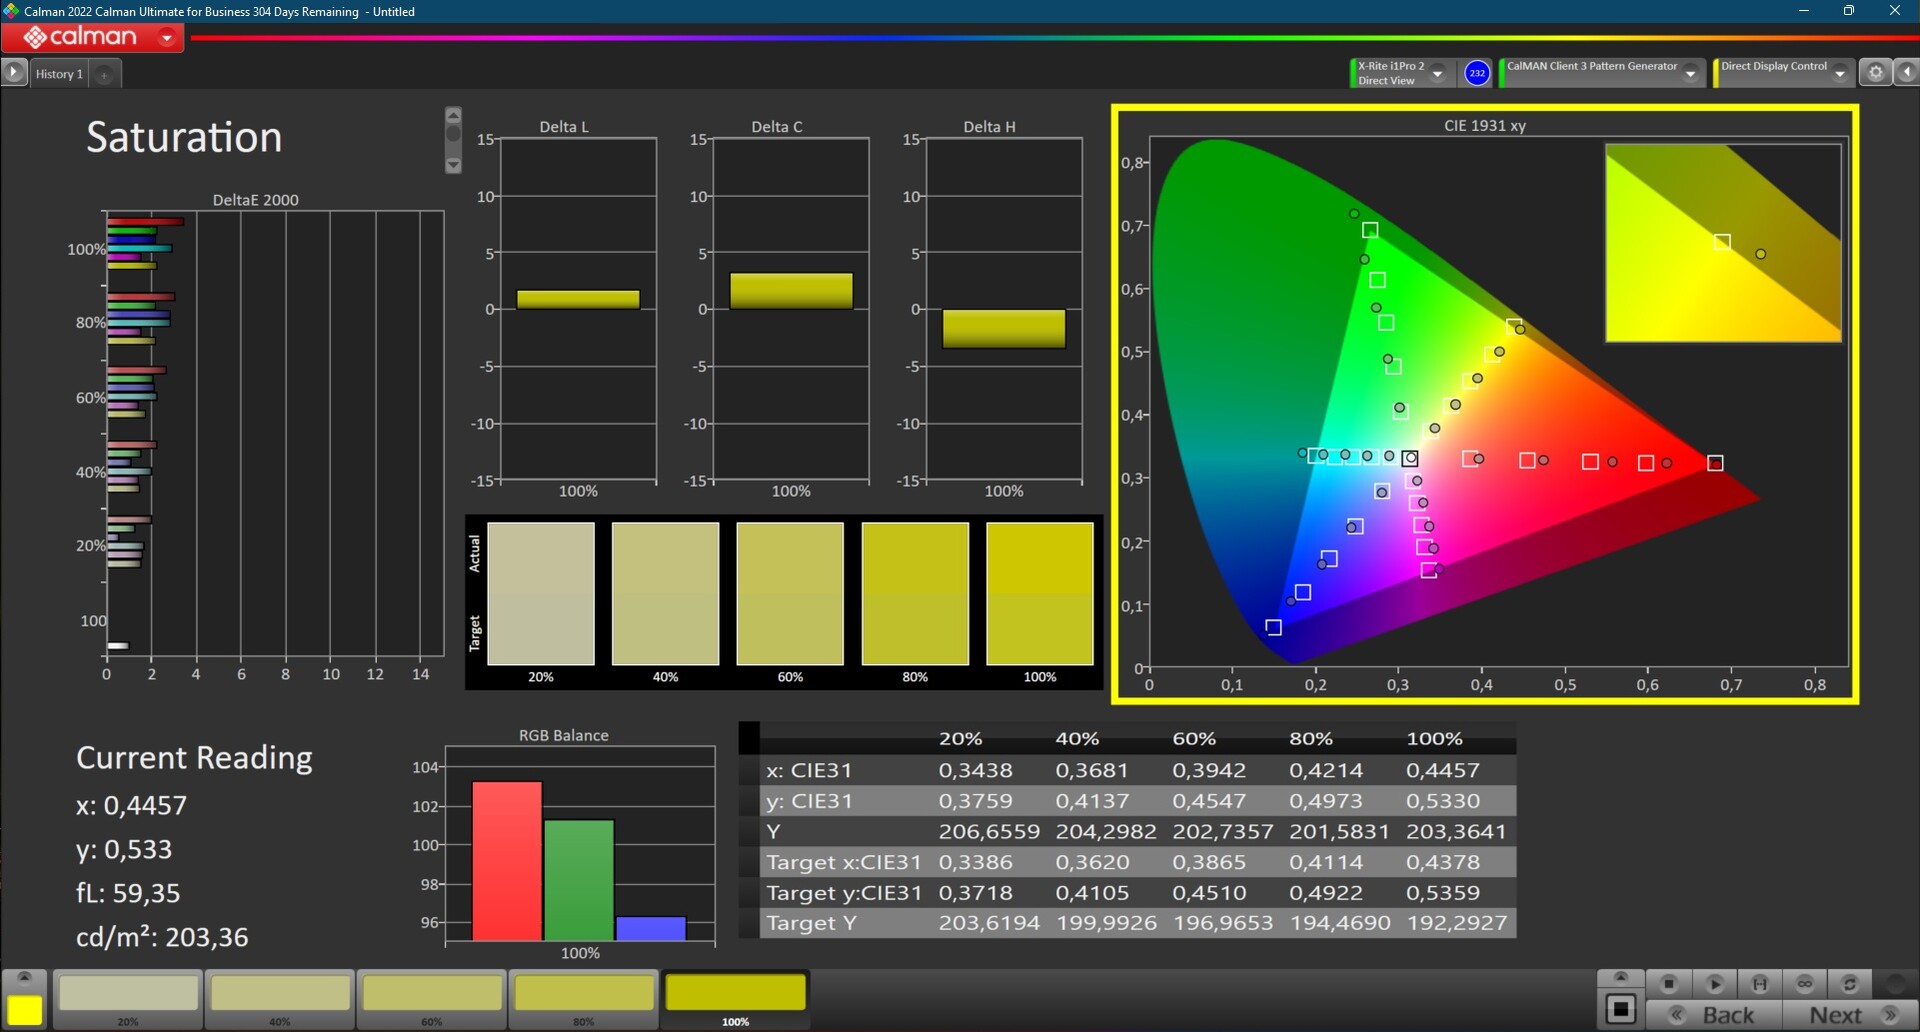
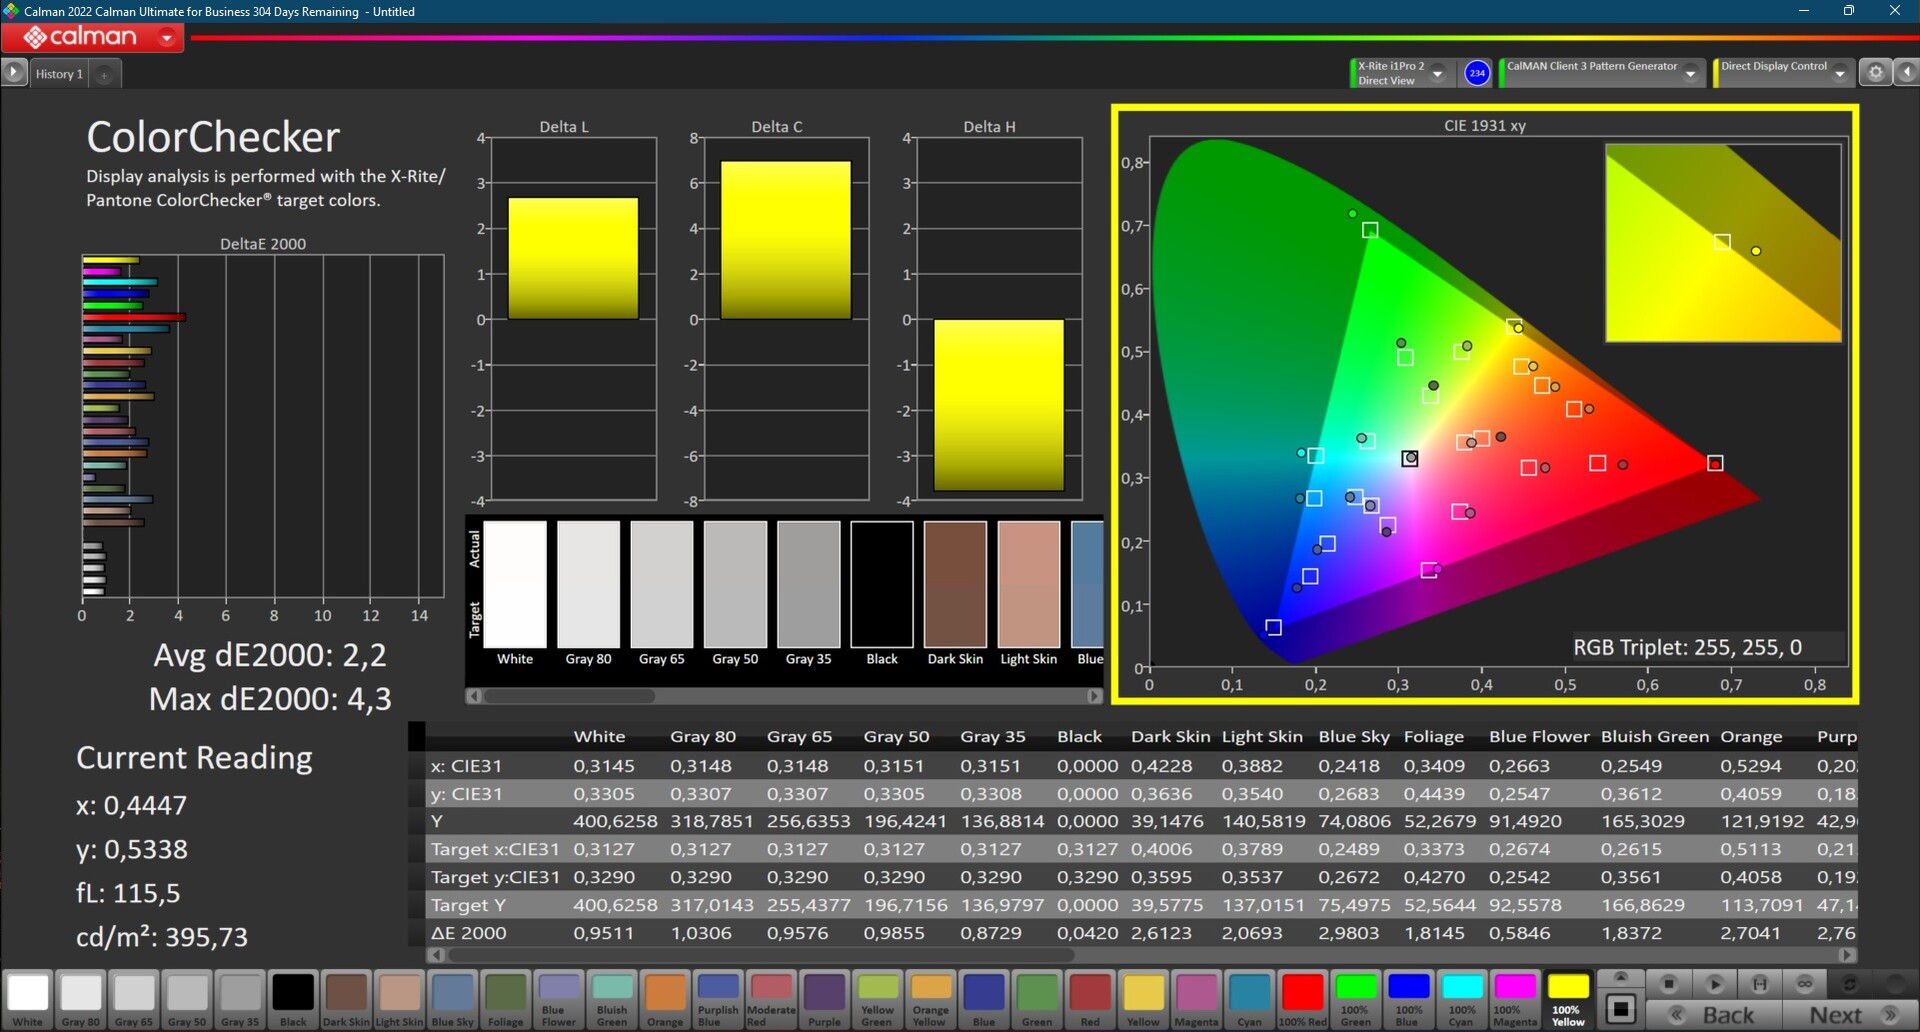
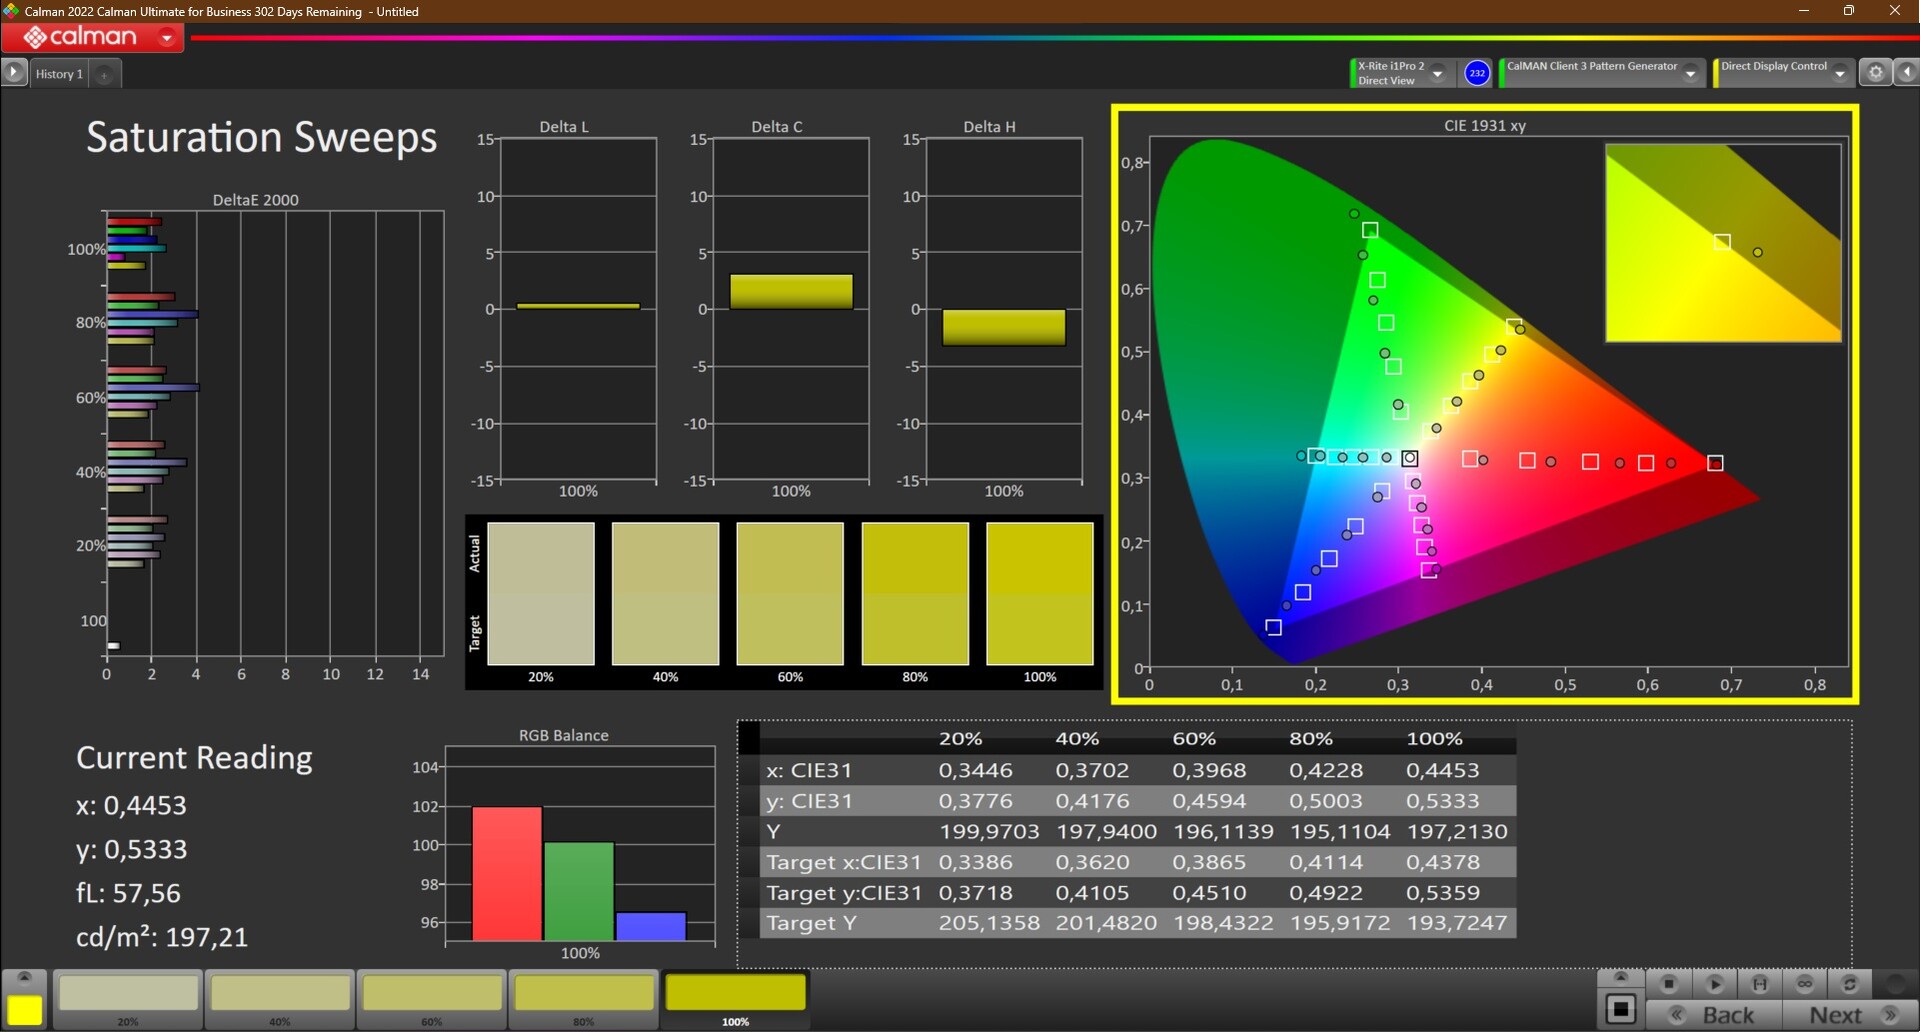
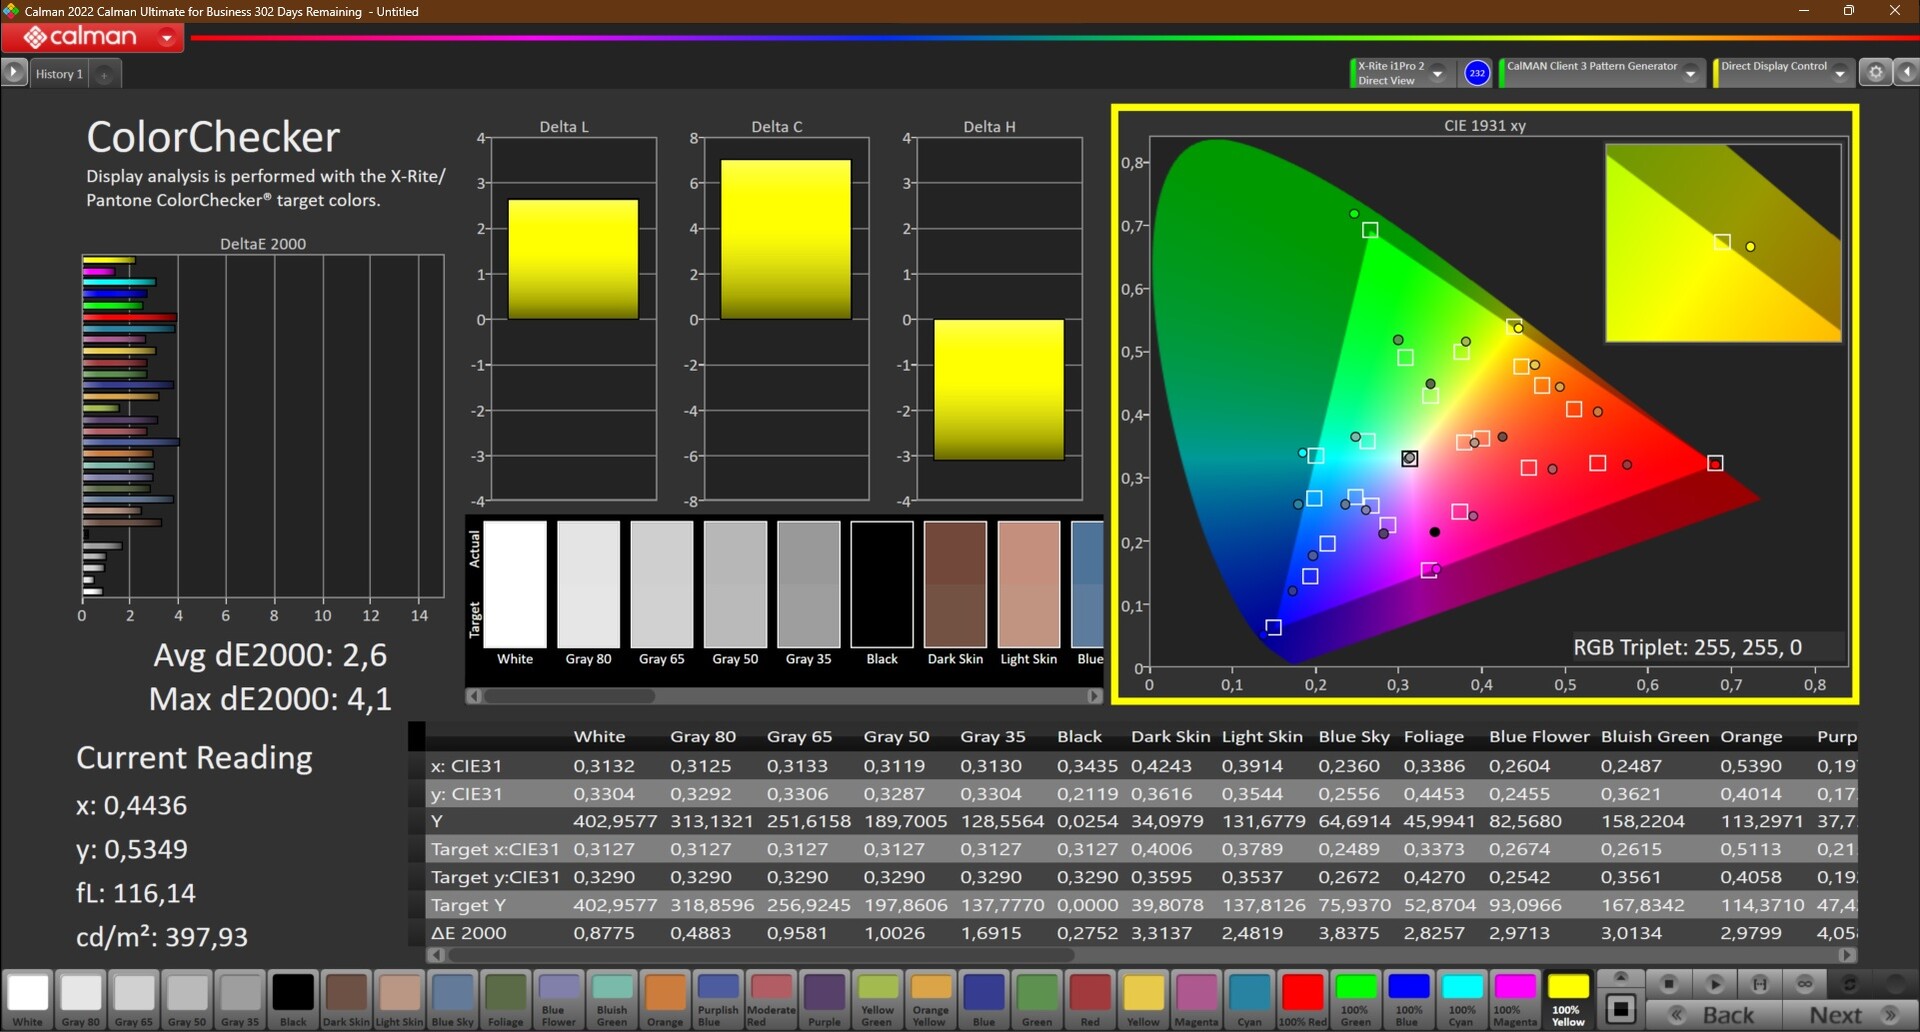
屏幕的色彩质量在出厂状态下已经非常高了;几乎是无限高的对比度值导致了生动、突出的色彩。对于大多数颜色来说,出厂时的偏差已经相对较小--我们几乎无法通过校准来提高质量。
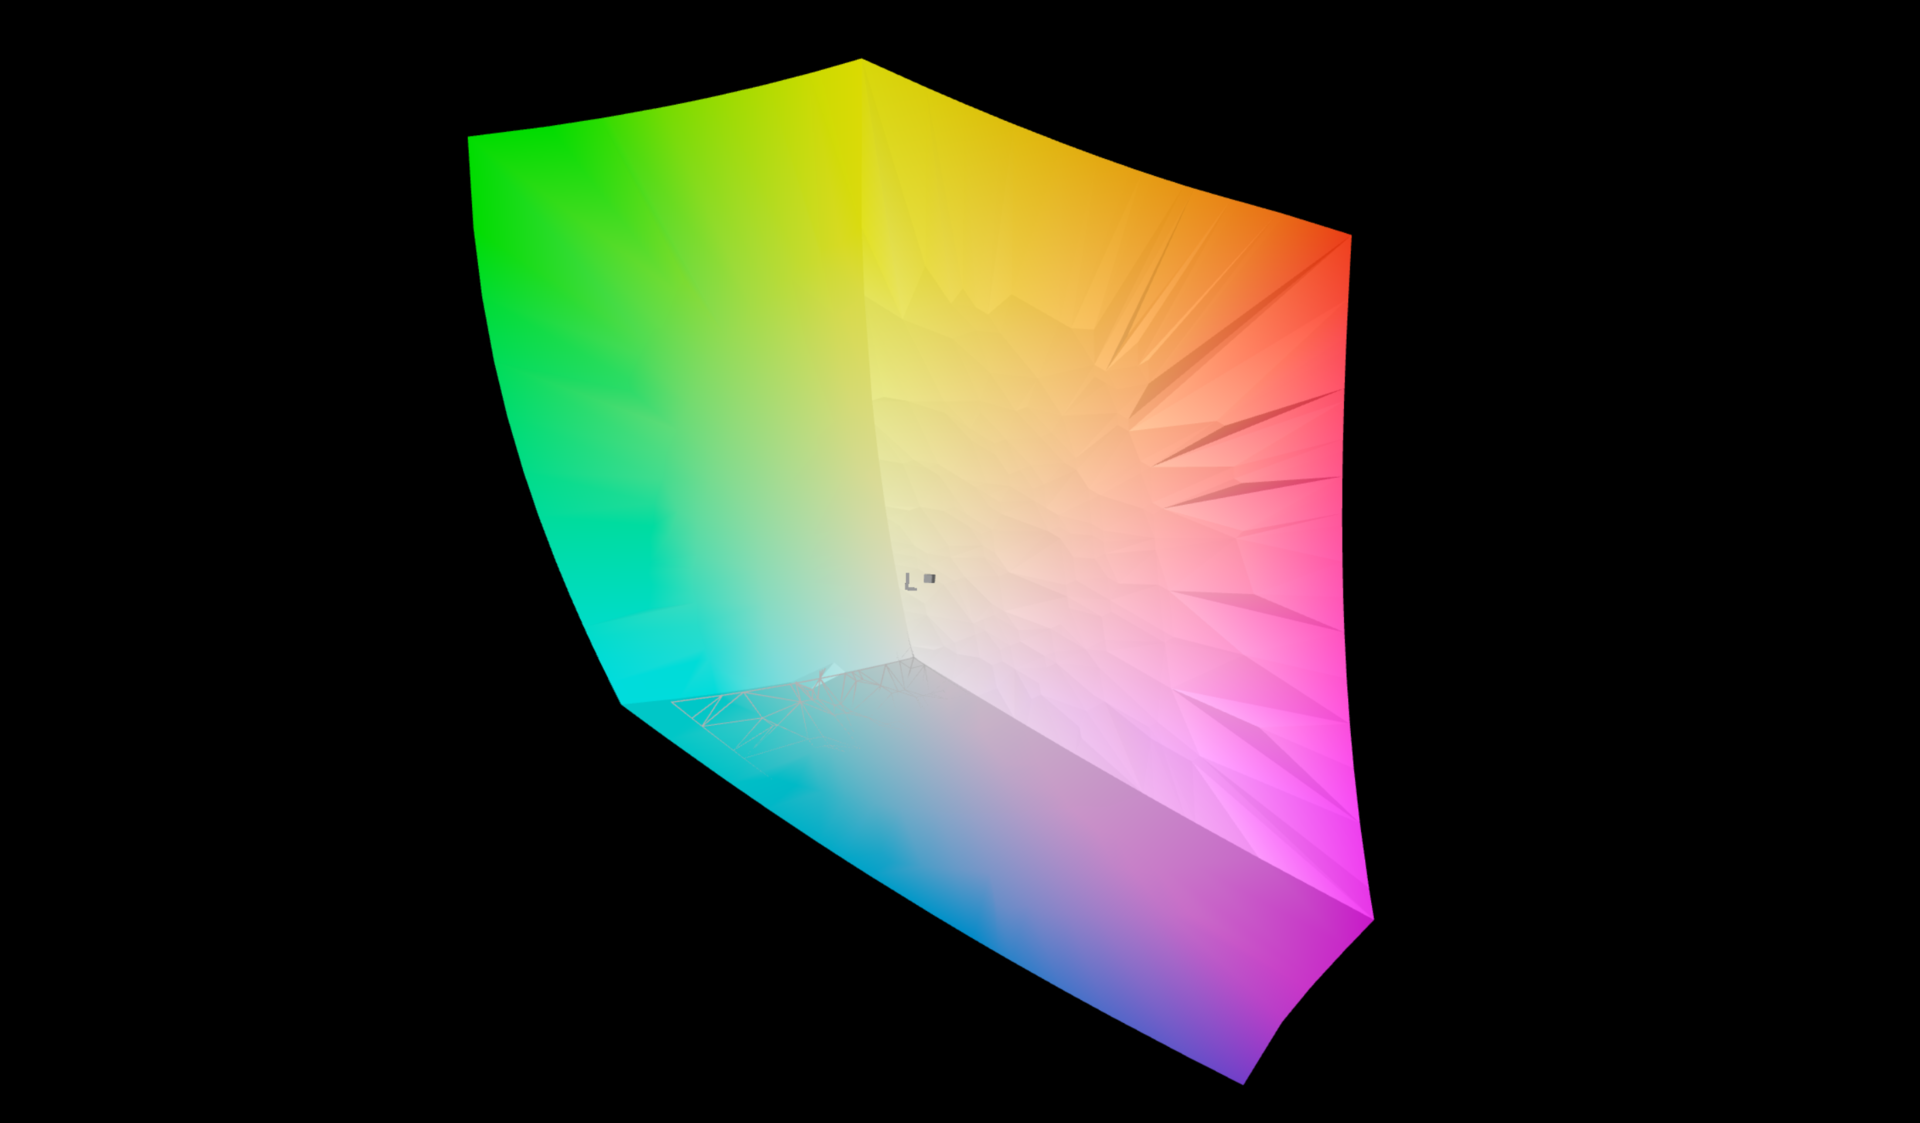
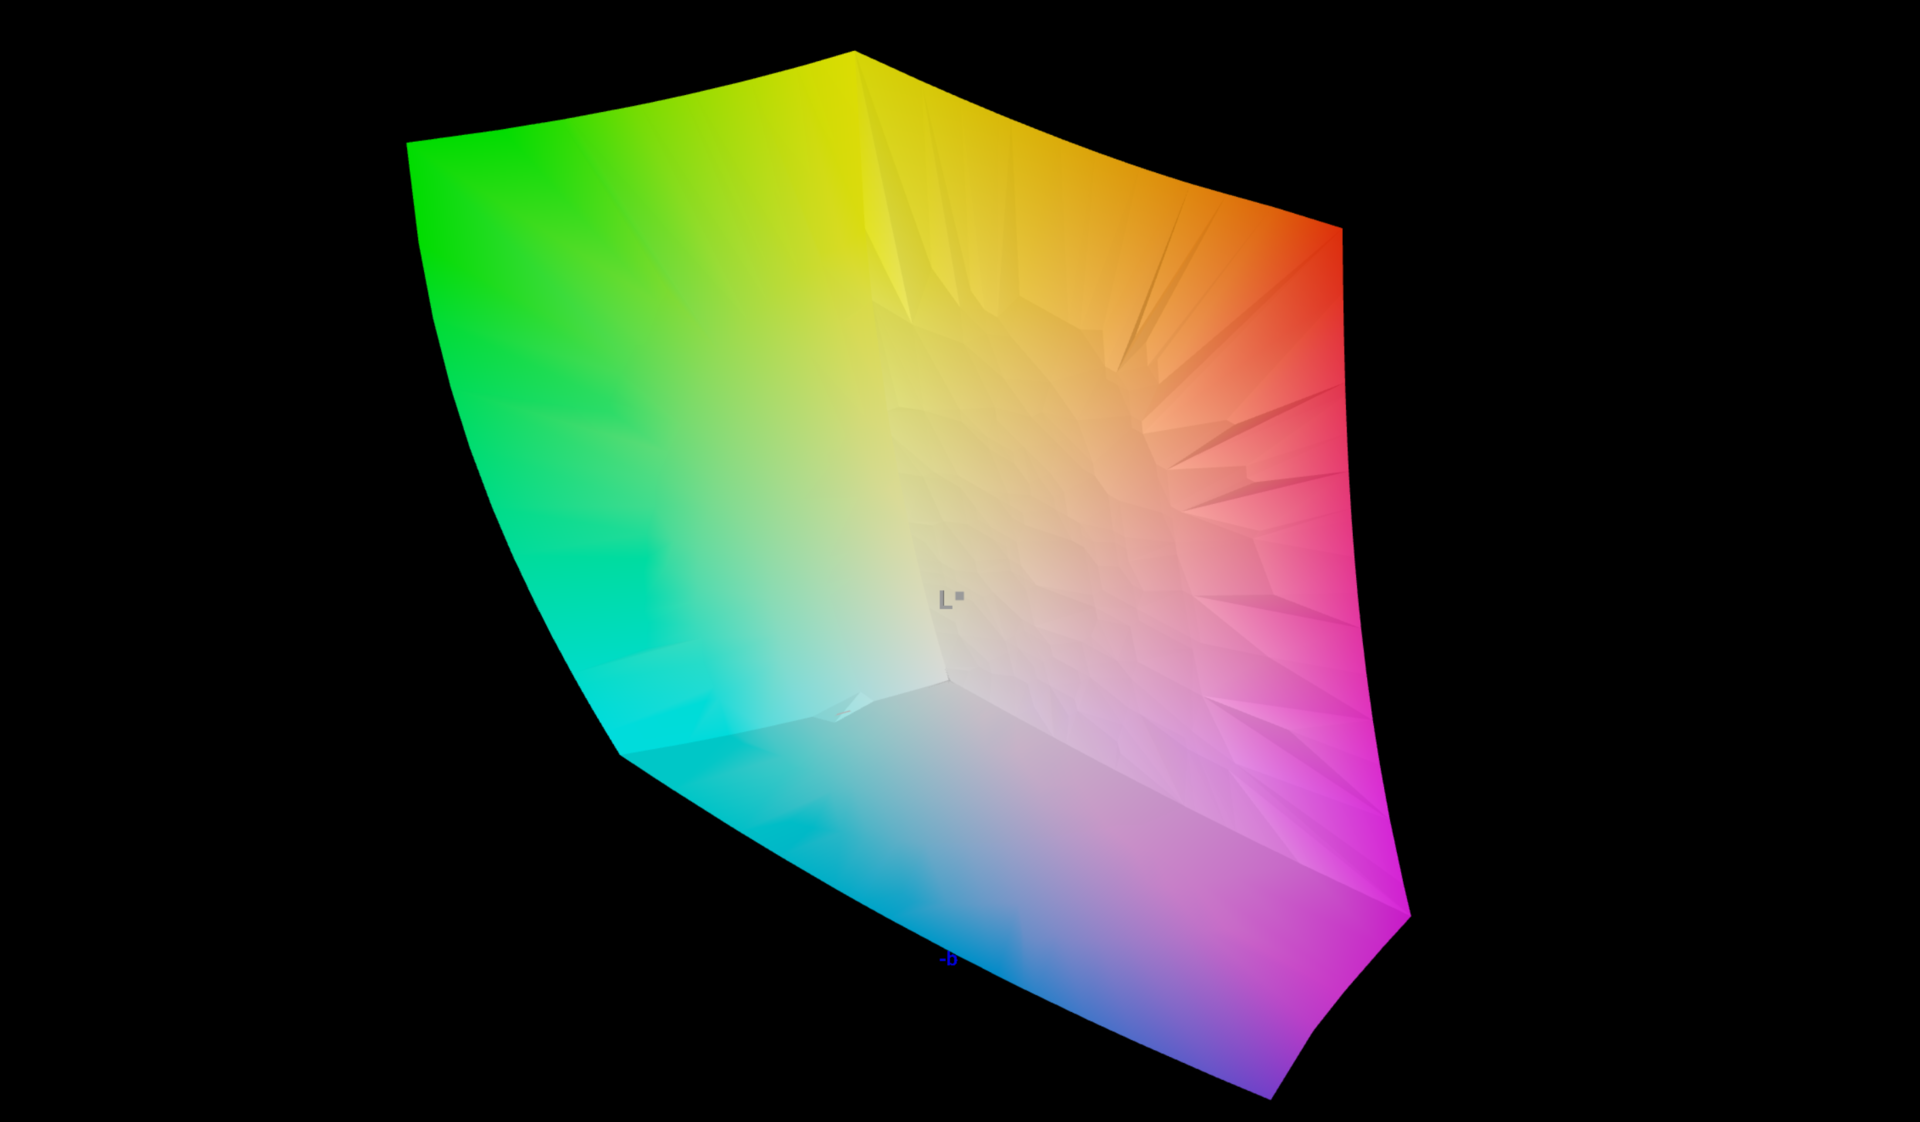
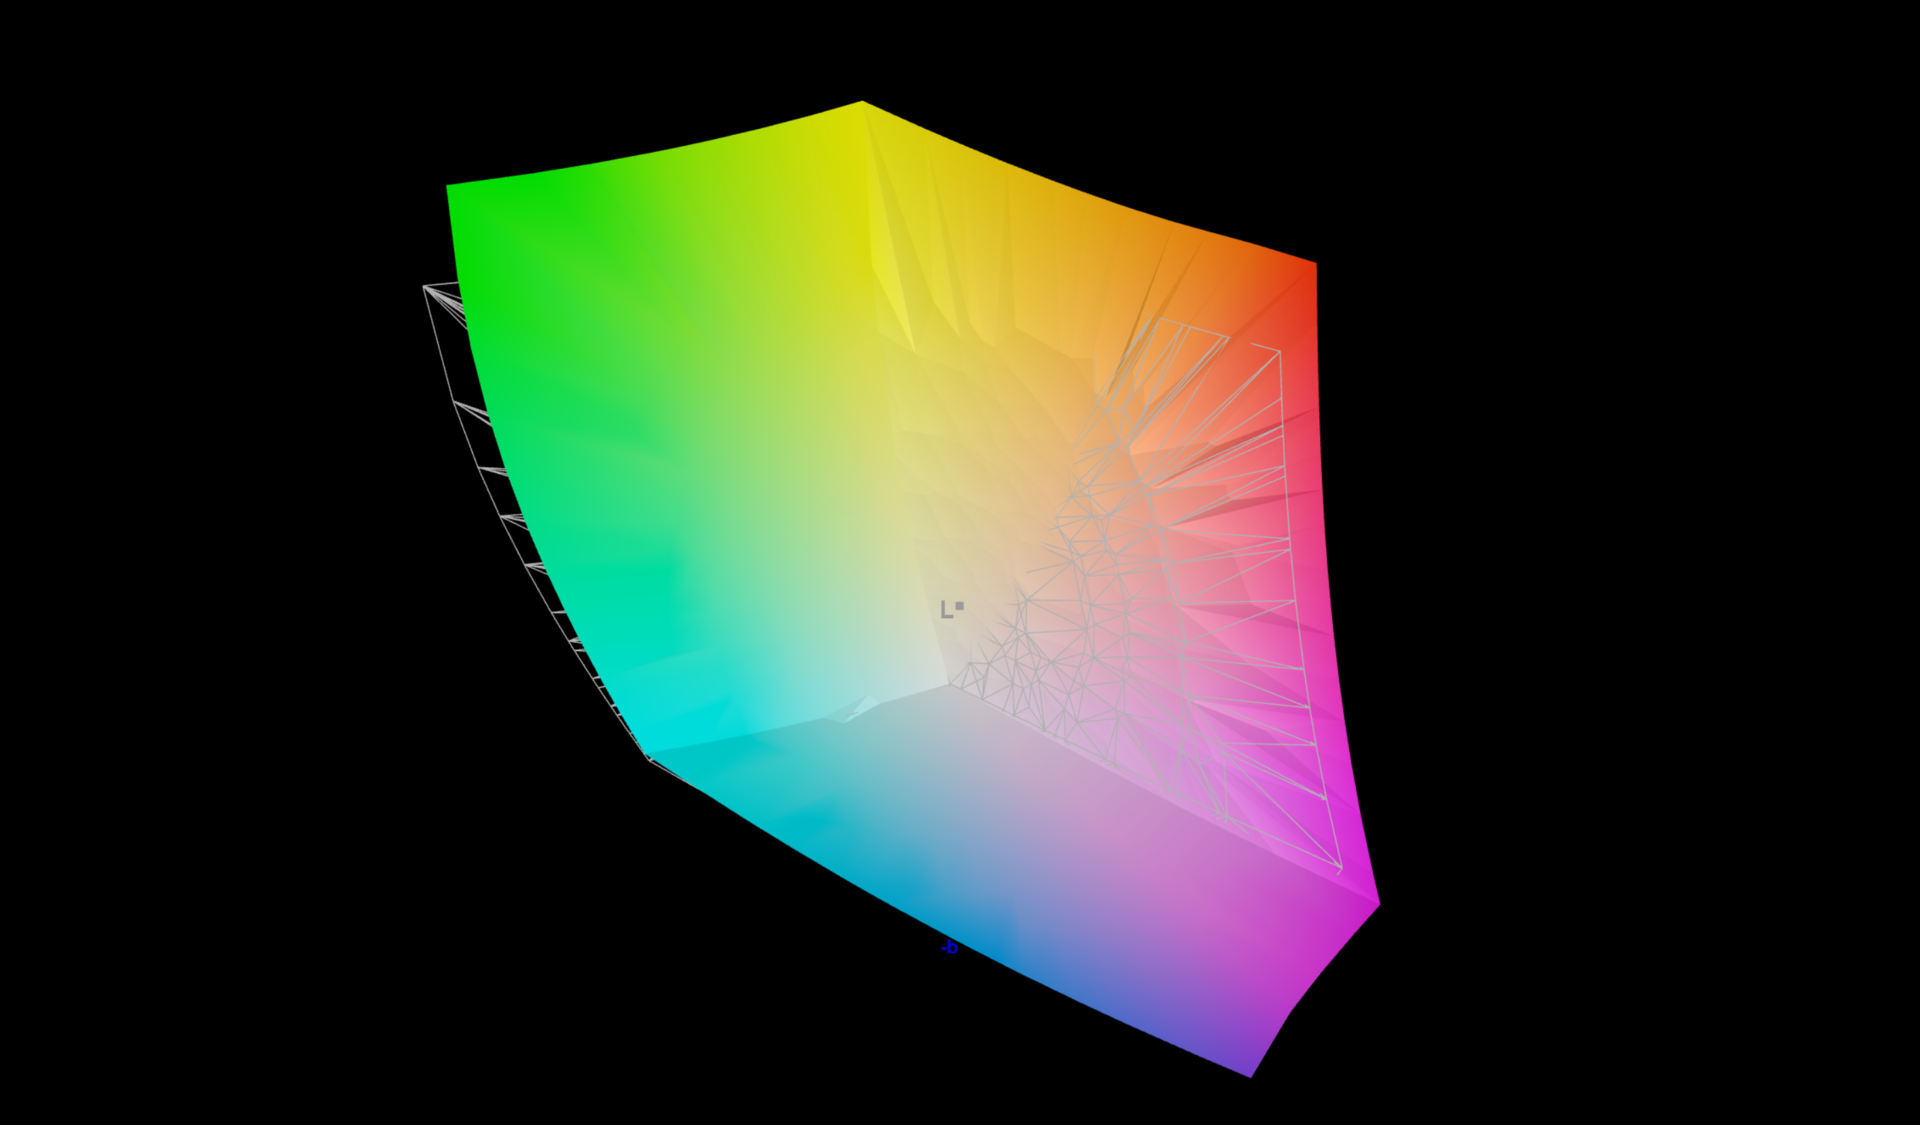
OLED屏幕的一个优势是其非常好的色彩空间覆盖。联想承诺100%的DCI-P3,实际结果是99.7%。该面板能够完全再现小的sRGB色彩空间,甚至AdobeRGB也不缺乏,达到96.5%。
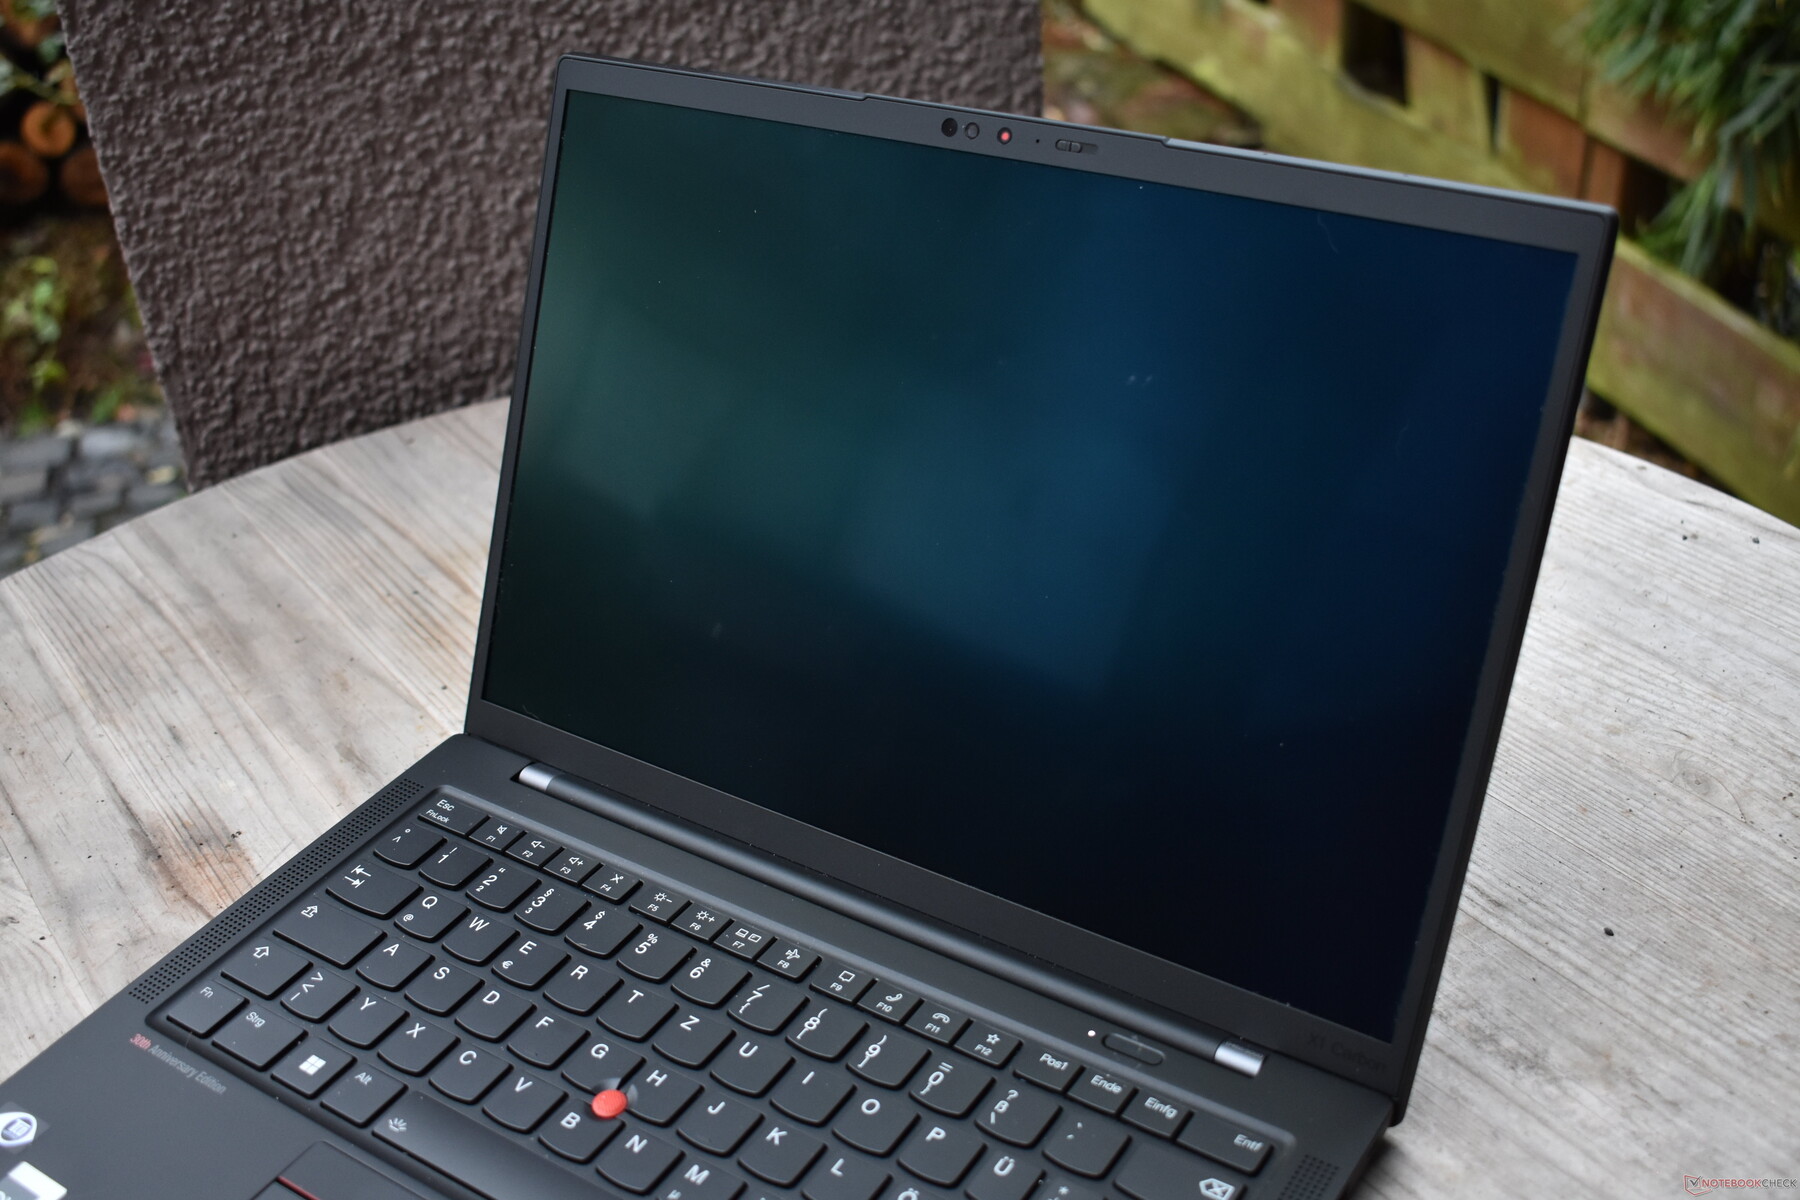
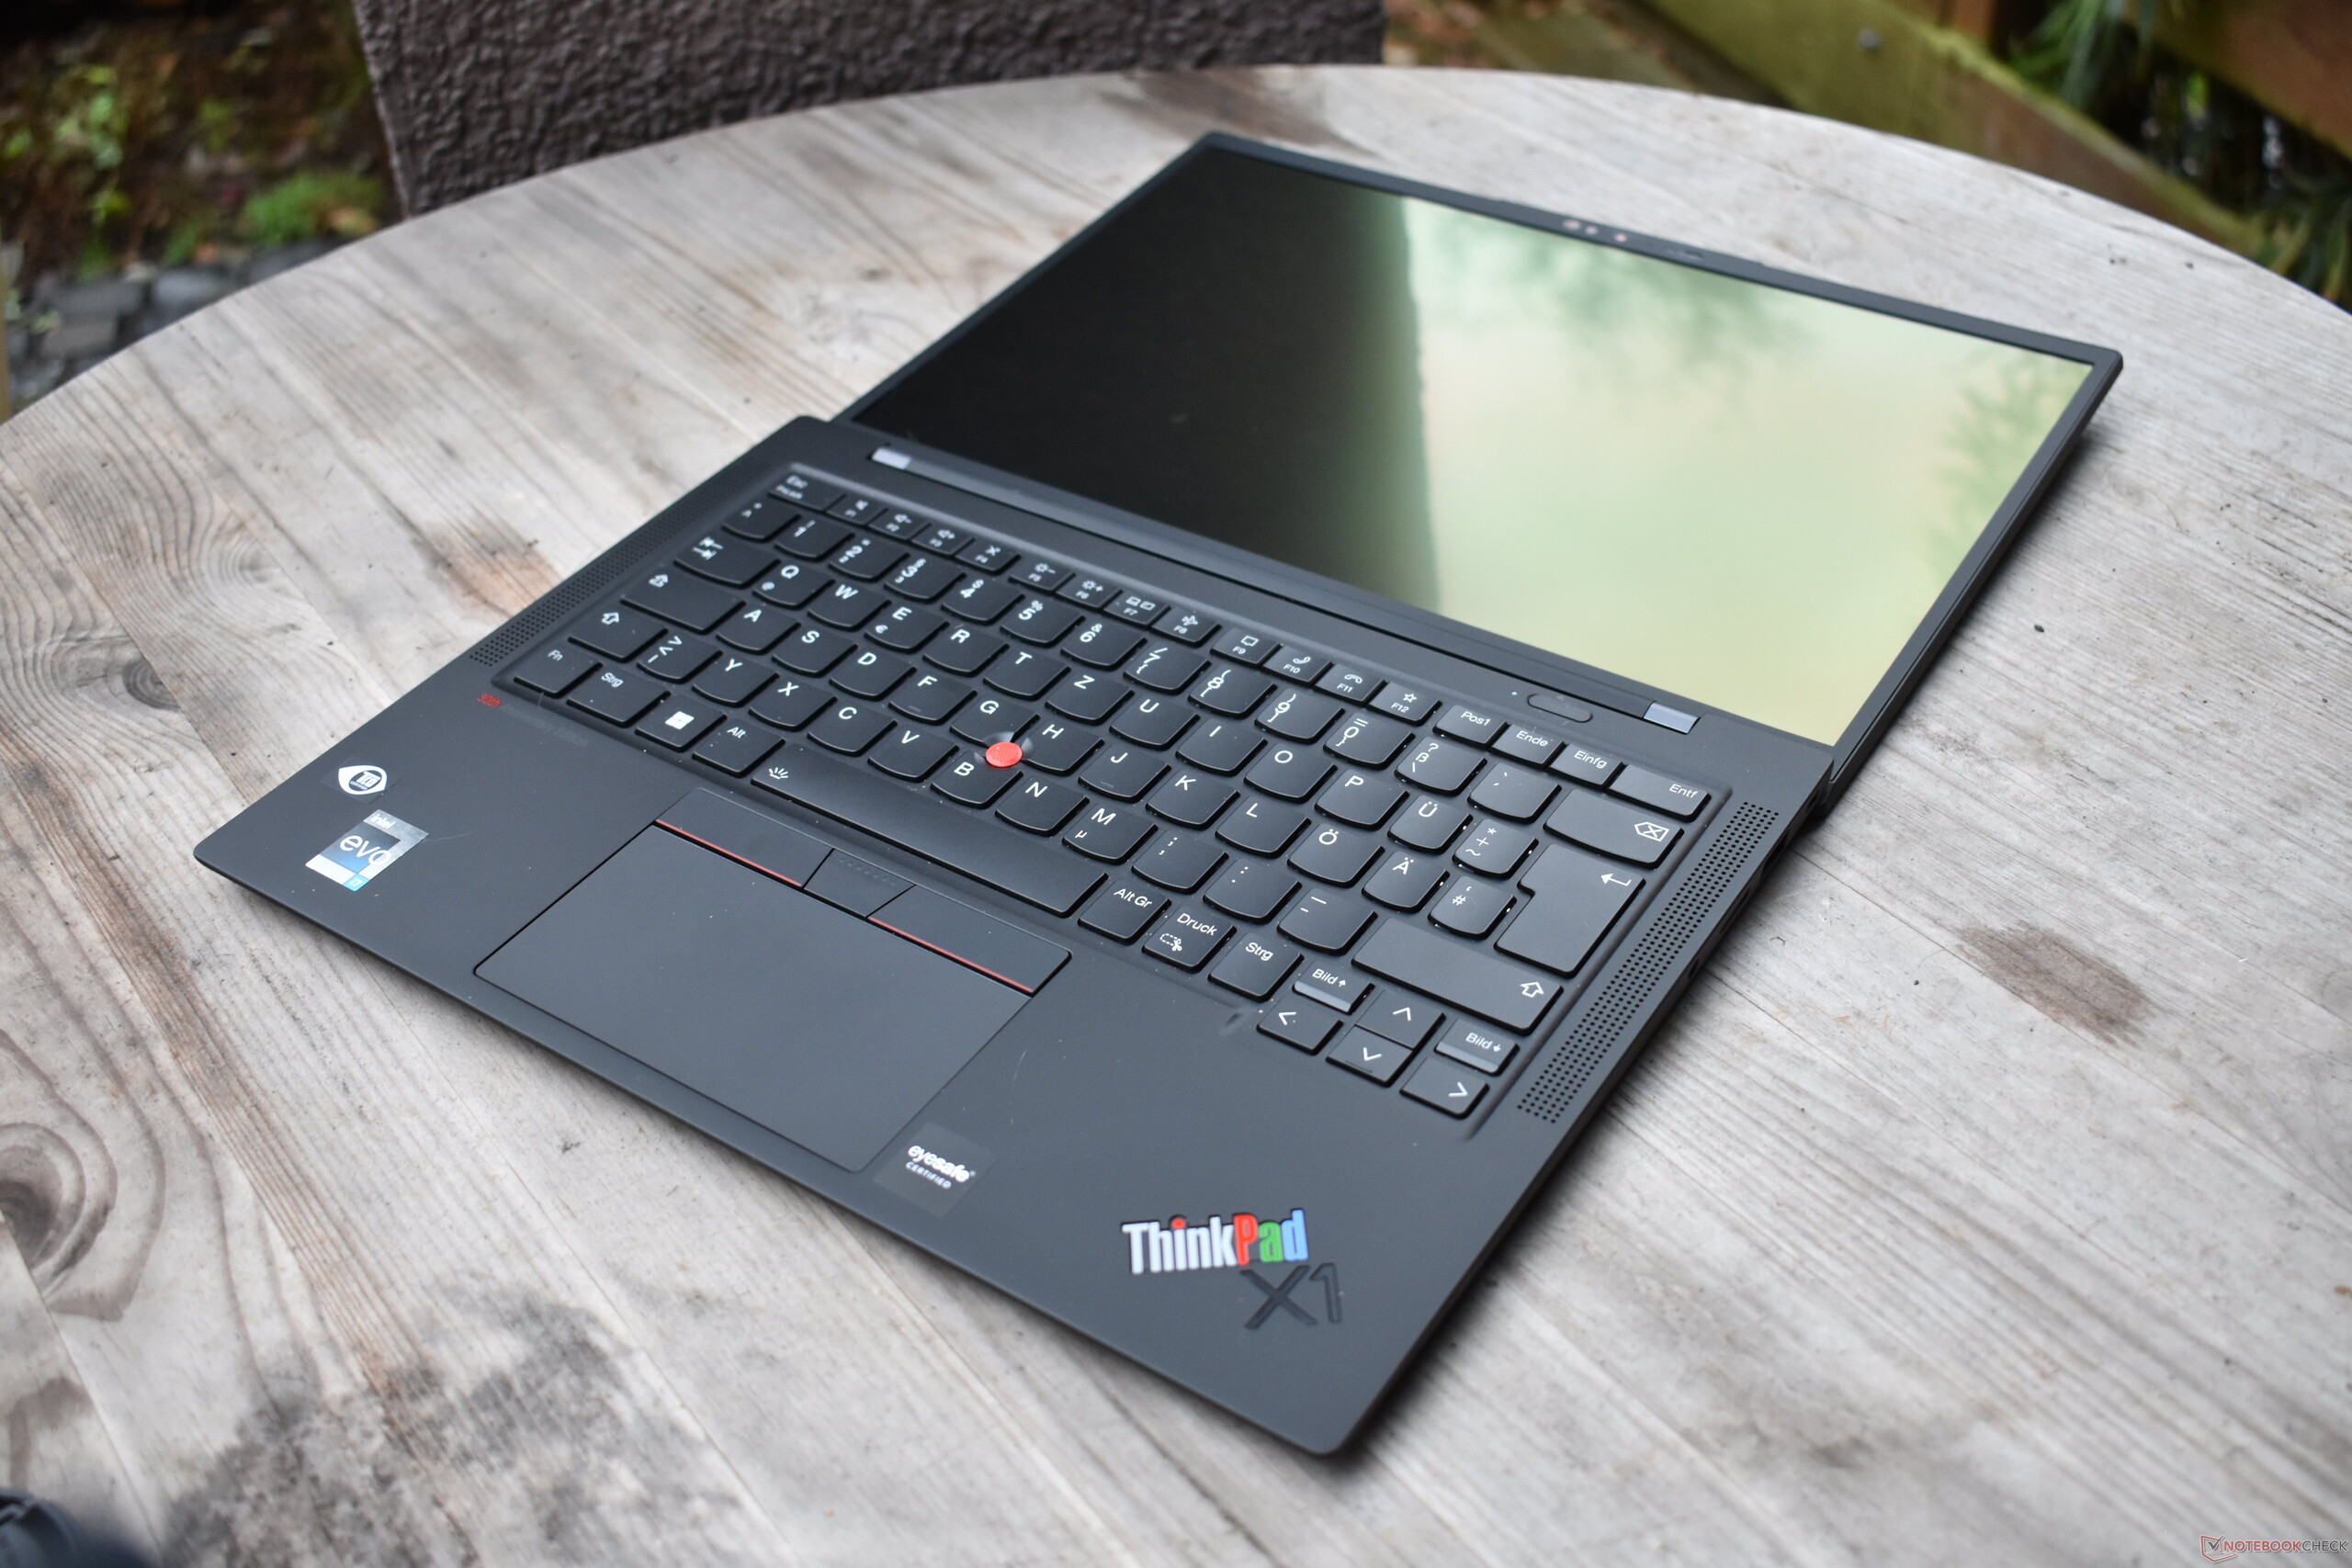
OLED显示屏通常是有光泽的--联想ThinkPad X1 Carbon G10的屏幕也是有光泽的,但只是非常轻微,而且也是抗反射面板。结合大约400cd/m²的亮度和高对比度,该屏幕在户外使用没有问题。
Display Response Times
| ↔ Response Time Black to White | ||
|---|---|---|
| 1.6 ms ... rise ↗ and fall ↘ combined | ↗ 0.9 ms rise | 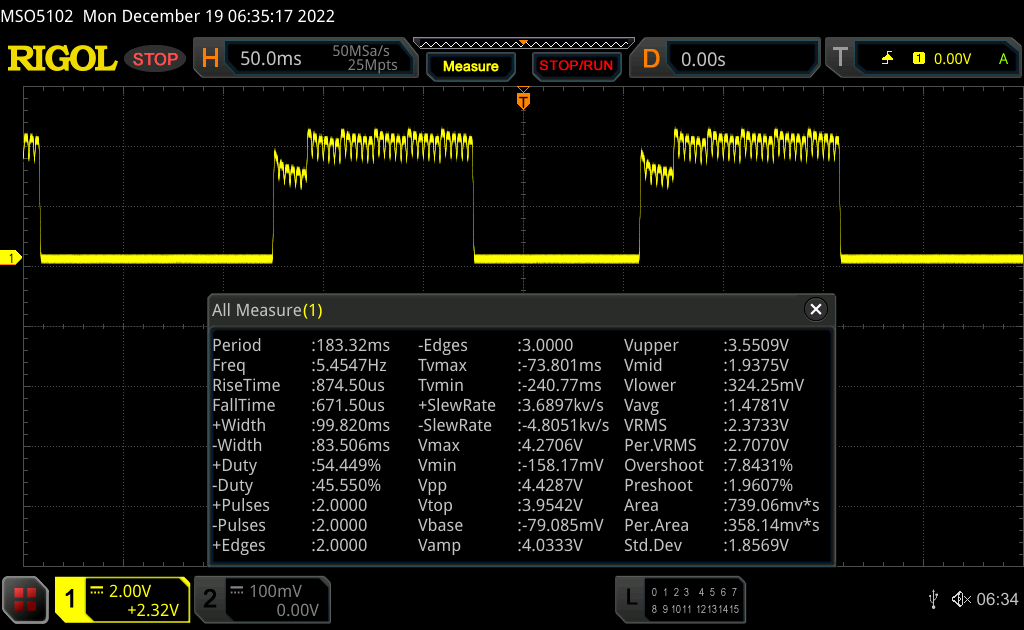 |
| ↘ 0.7 ms fall | ||
| The screen shows very fast response rates in our tests and should be very well suited for fast-paced gaming. In comparison, all tested devices range from 0.1 (minimum) to 240 (maximum) ms. » 10 % of all devices are better. This means that the measured response time is better than the average of all tested devices (19.8 ms). | ||
| ↔ Response Time 50% Grey to 80% Grey | ||
| 1.2 ms ... rise ↗ and fall ↘ combined | ↗ 0.6 ms rise | 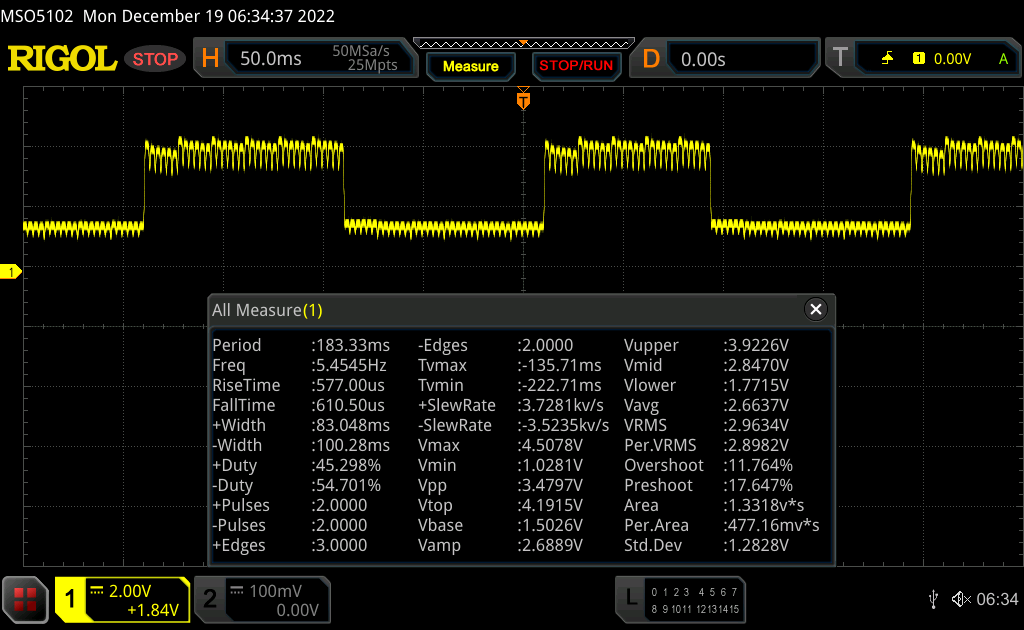 |
| ↘ 0.6 ms fall | ||
| The screen shows very fast response rates in our tests and should be very well suited for fast-paced gaming. In comparison, all tested devices range from 0.165 (minimum) to 636 (maximum) ms. » 5 % of all devices are better. This means that the measured response time is better than the average of all tested devices (31 ms). | ||
Screen Flickering / PWM (Pulse-Width Modulation)
| Screen flickering / PWM detected | 342 Hz | ≤ 100 % brightness setting | 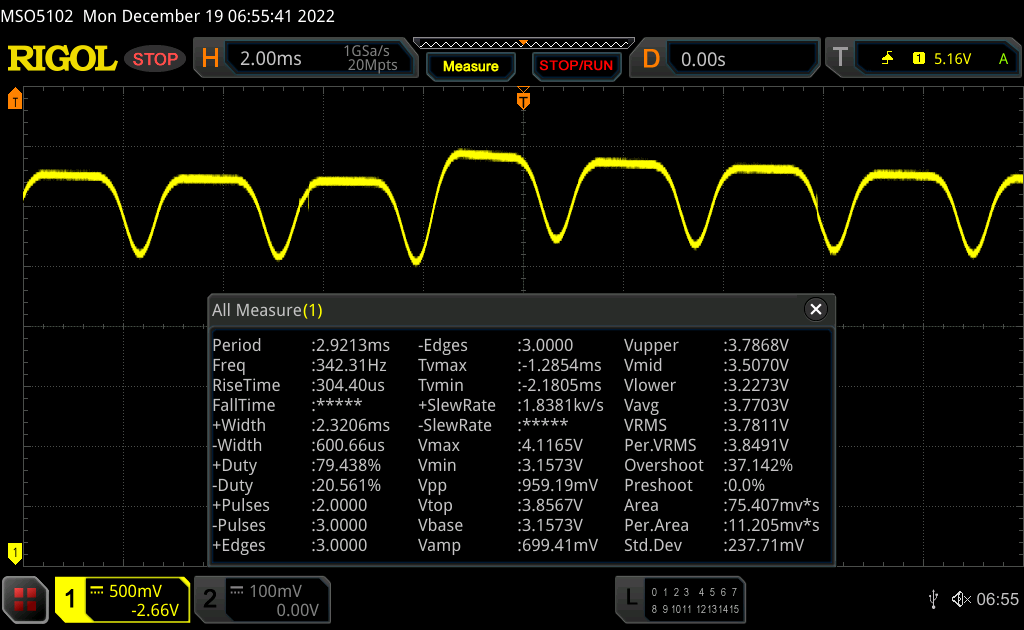 |
The display backlight flickers at 342 Hz (worst case, e.g., utilizing PWM) Flickering detected at a brightness setting of 100 % and below. There should be no flickering or PWM above this brightness setting. The frequency of 342 Hz is relatively high, so most users sensitive to PWM should not notice any flickering. However, there are reports that some users are still sensitive to PWM at 500 Hz and above, so be aware. In comparison: 52 % of all tested devices do not use PWM to dim the display. If PWM was detected, an average of 7754 (minimum: 5 - maximum: 343500) Hz was measured. | |||


性能。联想这次将TDP限制定得更高
关于组件选项的描述可以在我们的第一篇评论中找到。 联想ThinkPad X1 Carbon G10.
测试条件
与ThinkPads的一贯做法一样,联想使用了可以在Windows设置中设置的Windows性能模式。最长电池寿命 "模式将处理器永久限制在11瓦特。在中间级别的 "更好的性能 "中,最高可以有50瓦的提升,而处理器则被长期限制在19瓦。这种长期限制也适用于 "最佳性能 "设置,即短时爆发时可能达到56瓦,中间阶段为28瓦。
处理器
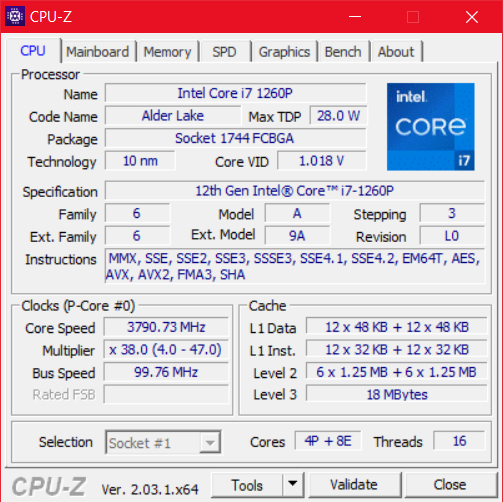
ǞǞǞ 英特尔酷睿i7-1260P是 "Alder-Lake-P28 "系列的一个处理器。顾名思义,总共有12个核心,其中4个是性能核心,8个是效率核心,设计功耗为28瓦。我们的 处理器列表可用于与其他CPU进行更广泛的基准比较。
19瓦的永久消耗量远远低于该处理器实际要达到的28瓦的标准。另一方面,这与我们对X1的第一次审查样本相比,仍然是一个进步。我们对X1 Carbon G10的第一次审查样本,其英特尔酷睿i5-1250处理器的耗电量为19瓦。其英特尔酷睿i5-1250P被永久限制在仅15瓦。此外,该处理器作为一个中间阶段,可以比我们第一次审查时保持28瓦的时间更长。在CPU性能方面,X1 Carbon Gen 10因此明显更具竞争力。然而,它仍然明显逊于采用AMD处理器的联想ThinkPad Z13。
在电池模式下,CPU性能也是完全可以的。
Cinebench R15 Multi Sustained Load
Cinebench R23: Multi Core | Single Core
Cinebench R20: CPU (Multi Core) | CPU (Single Core)
Cinebench R15: CPU Multi 64Bit | CPU Single 64Bit
Blender: v2.79 BMW27 CPU
7-Zip 18.03: 7z b 4 | 7z b 4 -mmt1
Geekbench 5.5: Multi-Core | Single-Core
HWBOT x265 Benchmark v2.2: 4k Preset
LibreOffice : 20 Documents To PDF
R Benchmark 2.5: Overall mean
| CPU Performance rating | |
| Lenovo ThinkPad Z13 G1-21D20016GE | |
| Average of class Office | |
| Dell Latitude 9430 2-in-1 -1! | |
| Average Intel Core i7-1260P | |
| Lenovo ThinkPad X1 Carbon G10 21CB00DCGE | |
| HP Elite Dragonfly G3 | |
| Lenovo ThinkPad X1 Carbon G10 21CC001RGE | |
| Lenovo ThinkPad X1 Carbon G9-20XWCTO1WW | |
| Cinebench R23 / Multi Core | |
| Lenovo ThinkPad Z13 G1-21D20016GE | |
| Average of class Office (1673 - 22808, n=76, last 2 years) | |
| Lenovo ThinkPad X1 Carbon G10 21CB00DCGE | |
| Average Intel Core i7-1260P (3173 - 12150, n=27) | |
| Dell Latitude 9430 2-in-1 | |
| Lenovo ThinkPad X1 Carbon G10 21CC001RGE | |
| HP Elite Dragonfly G3 | |
| Lenovo ThinkPad X1 Carbon G9-20XWCTO1WW | |
| Cinebench R23 / Single Core | |
| Dell Latitude 9430 2-in-1 | |
| Average of class Office (708 - 2130, n=76, last 2 years) | |
| Average Intel Core i7-1260P (1155 - 1812, n=25) | |
| Lenovo ThinkPad X1 Carbon G10 21CB00DCGE | |
| HP Elite Dragonfly G3 | |
| Lenovo ThinkPad X1 Carbon G10 21CC001RGE | |
| Lenovo ThinkPad X1 Carbon G9-20XWCTO1WW | |
| Lenovo ThinkPad Z13 G1-21D20016GE | |
| Cinebench R20 / CPU (Multi Core) | |
| Lenovo ThinkPad Z13 G1-21D20016GE | |
| Average of class Office (648 - 8840, n=75, last 2 years) | |
| Lenovo ThinkPad X1 Carbon G10 21CB00DCGE | |
| Average Intel Core i7-1260P (1234 - 4748, n=25) | |
| Dell Latitude 9430 2-in-1 | |
| HP Elite Dragonfly G3 | |
| Lenovo ThinkPad X1 Carbon G10 21CC001RGE | |
| Lenovo ThinkPad X1 Carbon G9-20XWCTO1WW | |
| Cinebench R20 / CPU (Single Core) | |
| Dell Latitude 9430 2-in-1 | |
| Average of class Office (345 - 816, n=75, last 2 years) | |
| Average Intel Core i7-1260P (448 - 698, n=25) | |
| Lenovo ThinkPad X1 Carbon G10 21CB00DCGE | |
| Lenovo ThinkPad Z13 G1-21D20016GE | |
| HP Elite Dragonfly G3 | |
| Lenovo ThinkPad X1 Carbon G9-20XWCTO1WW | |
| Lenovo ThinkPad X1 Carbon G10 21CC001RGE | |
| Cinebench R15 / CPU Multi 64Bit | |
| Lenovo ThinkPad Z13 G1-21D20016GE | |
| Average of class Office (250 - 3380, n=77, last 2 years) | |
| Lenovo ThinkPad X1 Carbon G10 21CB00DCGE | |
| Dell Latitude 9430 2-in-1 | |
| Average Intel Core i7-1260P (549 - 2034, n=29) | |
| Lenovo ThinkPad X1 Carbon G10 21CC001RGE | |
| HP Elite Dragonfly G3 | |
| Lenovo ThinkPad X1 Carbon G9-20XWCTO1WW | |
| Cinebench R15 / CPU Single 64Bit | |
| Dell Latitude 9430 2-in-1 | |
| Average of class Office (99.5 - 316, n=77, last 2 years) | |
| Lenovo ThinkPad Z13 G1-21D20016GE | |
| Average Intel Core i7-1260P (165.4 - 260, n=27) | |
| HP Elite Dragonfly G3 | |
| Lenovo ThinkPad X1 Carbon G9-20XWCTO1WW | |
| Lenovo ThinkPad X1 Carbon G10 21CC001RGE | |
| Lenovo ThinkPad X1 Carbon G10 21CB00DCGE | |
| Blender / v2.79 BMW27 CPU | |
| Lenovo ThinkPad X1 Carbon G9-20XWCTO1WW | |
| Lenovo ThinkPad X1 Carbon G10 21CC001RGE | |
| HP Elite Dragonfly G3 | |
| Average Intel Core i7-1260P (264 - 906, n=26) | |
| Average of class Office (158 - 1940, n=76, last 2 years) | |
| Lenovo ThinkPad X1 Carbon G10 21CB00DCGE | |
| Lenovo ThinkPad Z13 G1-21D20016GE | |
| 7-Zip 18.03 / 7z b 4 | |
| Lenovo ThinkPad Z13 G1-21D20016GE | |
| Average of class Office (7098 - 76886, n=77, last 2 years) | |
| Lenovo ThinkPad X1 Carbon G10 21CB00DCGE | |
| Average Intel Core i7-1260P (16146 - 47064, n=25) | |
| Dell Latitude 9430 2-in-1 | |
| HP Elite Dragonfly G3 | |
| Lenovo ThinkPad X1 Carbon G10 21CC001RGE | |
| Lenovo ThinkPad X1 Carbon G9-20XWCTO1WW | |
| 7-Zip 18.03 / 7z b 4 -mmt1 | |
| Dell Latitude 9430 2-in-1 | |
| Average of class Office (3387 - 6469, n=77, last 2 years) | |
| Lenovo ThinkPad Z13 G1-21D20016GE | |
| Average Intel Core i7-1260P (4064 - 5791, n=25) | |
| Lenovo ThinkPad X1 Carbon G10 21CB00DCGE | |
| Lenovo ThinkPad X1 Carbon G9-20XWCTO1WW | |
| HP Elite Dragonfly G3 | |
| Lenovo ThinkPad X1 Carbon G10 21CC001RGE | |
| Geekbench 5.5 / Multi-Core | |
| Average of class Office (1483 - 16999, n=73, last 2 years) | |
| Dell Latitude 9430 2-in-1 | |
| Average Intel Core i7-1260P (3866 - 10570, n=25) | |
| Lenovo ThinkPad X1 Carbon G10 21CB00DCGE | |
| Lenovo ThinkPad Z13 G1-21D20016GE | |
| HP Elite Dragonfly G3 | |
| Lenovo ThinkPad X1 Carbon G10 21CC001RGE | |
| Lenovo ThinkPad X1 Carbon G9-20XWCTO1WW | |
| Geekbench 5.5 / Single-Core | |
| Average of class Office (811 - 2175, n=73, last 2 years) | |
| Dell Latitude 9430 2-in-1 | |
| Lenovo ThinkPad X1 Carbon G10 21CB00DCGE | |
| Average Intel Core i7-1260P (1436 - 1786, n=25) | |
| Lenovo ThinkPad X1 Carbon G10 21CC001RGE | |
| Lenovo ThinkPad X1 Carbon G9-20XWCTO1WW | |
| HP Elite Dragonfly G3 | |
| Lenovo ThinkPad Z13 G1-21D20016GE | |
| HWBOT x265 Benchmark v2.2 / 4k Preset | |
| Lenovo ThinkPad Z13 G1-21D20016GE | |
| Average of class Office (2.21 - 26, n=76, last 2 years) | |
| Average Intel Core i7-1260P (3.45 - 13.6, n=26) | |
| Dell Latitude 9430 2-in-1 | |
| Lenovo ThinkPad X1 Carbon G10 21CB00DCGE | |
| HP Elite Dragonfly G3 | |
| Lenovo ThinkPad X1 Carbon G10 21CC001RGE | |
| Lenovo ThinkPad X1 Carbon G9-20XWCTO1WW | |
| LibreOffice / 20 Documents To PDF | |
| HP Elite Dragonfly G3 | |
| Average of class Office (39.9 - 102.3, n=76, last 2 years) | |
| Lenovo ThinkPad X1 Carbon G10 21CC001RGE | |
| Lenovo ThinkPad Z13 G1-21D20016GE | |
| Average Intel Core i7-1260P (40.2 - 65.7, n=25) | |
| Lenovo ThinkPad X1 Carbon G10 21CB00DCGE | |
| Dell Latitude 9430 2-in-1 | |
| Lenovo ThinkPad X1 Carbon G9-20XWCTO1WW | |
| R Benchmark 2.5 / Overall mean | |
| Lenovo ThinkPad X1 Carbon G9-20XWCTO1WW | |
| Lenovo ThinkPad X1 Carbon G10 21CC001RGE | |
| HP Elite Dragonfly G3 | |
| Lenovo ThinkPad X1 Carbon G10 21CB00DCGE | |
| Lenovo ThinkPad Z13 G1-21D20016GE | |
| Average of class Office (0.393 - 0.888, n=76, last 2 years) | |
| Average Intel Core i7-1260P (0.4559 - 0.727, n=25) | |
| Dell Latitude 9430 2-in-1 | |
* ... smaller is better
AIDA64: FP32 Ray-Trace | FPU Julia | CPU SHA3 | CPU Queen | FPU SinJulia | FPU Mandel | CPU AES | CPU ZLib | FP64 Ray-Trace | CPU PhotoWorxx
| Performance rating | |
| Lenovo ThinkPad Z13 G1-21D20016GE | |
| Average of class Office | |
| Dell Latitude 9430 2-in-1 | |
| Average Intel Core i7-1260P | |
| Lenovo ThinkPad X1 Carbon G9-20XWCTO1WW | |
| Lenovo ThinkPad X1 Carbon G10 21CB00DCGE | |
| HP Elite Dragonfly G3 | |
| Lenovo ThinkPad X1 Carbon G10 21CC001RGE | |
| AIDA64 / FP32 Ray-Trace | |
| Average of class Office (2083 - 31245, n=83, last 2 years) | |
| Lenovo ThinkPad Z13 G1-21D20016GE | |
| Dell Latitude 9430 2-in-1 | |
| Lenovo ThinkPad X1 Carbon G9-20XWCTO1WW | |
| Lenovo ThinkPad X1 Carbon G10 21CB00DCGE | |
| Average Intel Core i7-1260P (2176 - 10898, n=26) | |
| HP Elite Dragonfly G3 | |
| Lenovo ThinkPad X1 Carbon G10 21CC001RGE | |
| AIDA64 / FPU Julia | |
| Lenovo ThinkPad Z13 G1-21D20016GE | |
| Average of class Office (8191 - 125394, n=83, last 2 years) | |
| Dell Latitude 9430 2-in-1 | |
| Lenovo ThinkPad X1 Carbon G10 21CB00DCGE | |
| Average Intel Core i7-1260P (11015 - 56906, n=26) | |
| HP Elite Dragonfly G3 | |
| Lenovo ThinkPad X1 Carbon G9-20XWCTO1WW | |
| Lenovo ThinkPad X1 Carbon G10 21CC001RGE | |
| AIDA64 / CPU SHA3 | |
| Average of class Office (433 - 5755, n=83, last 2 years) | |
| Lenovo ThinkPad Z13 G1-21D20016GE | |
| Dell Latitude 9430 2-in-1 | |
| Lenovo ThinkPad X1 Carbon G9-20XWCTO1WW | |
| Average Intel Core i7-1260P (669 - 2709, n=26) | |
| HP Elite Dragonfly G3 | |
| Lenovo ThinkPad X1 Carbon G10 21CB00DCGE | |
| Lenovo ThinkPad X1 Carbon G10 21CC001RGE | |
| AIDA64 / CPU Queen | |
| Lenovo ThinkPad Z13 G1-21D20016GE | |
| Lenovo ThinkPad X1 Carbon G10 21CB00DCGE | |
| Average Intel Core i7-1260P (42571 - 82493, n=26) | |
| Lenovo ThinkPad X1 Carbon G10 21CC001RGE | |
| Dell Latitude 9430 2-in-1 | |
| Average of class Office (22784 - 115197, n=67, last 2 years) | |
| HP Elite Dragonfly G3 | |
| Lenovo ThinkPad X1 Carbon G9-20XWCTO1WW | |
| AIDA64 / FPU SinJulia | |
| Lenovo ThinkPad Z13 G1-21D20016GE | |
| Average of class Office (1378 - 18321, n=83, last 2 years) | |
| Average Intel Core i7-1260P (2901 - 6975, n=26) | |
| Dell Latitude 9430 2-in-1 | |
| Lenovo ThinkPad X1 Carbon G10 21CB00DCGE | |
| Lenovo ThinkPad X1 Carbon G10 21CC001RGE | |
| Lenovo ThinkPad X1 Carbon G9-20XWCTO1WW | |
| HP Elite Dragonfly G3 | |
| AIDA64 / FPU Mandel | |
| Lenovo ThinkPad Z13 G1-21D20016GE | |
| Average of class Office (4601 - 66922, n=83, last 2 years) | |
| Dell Latitude 9430 2-in-1 | |
| Lenovo ThinkPad X1 Carbon G9-20XWCTO1WW | |
| Lenovo ThinkPad X1 Carbon G10 21CB00DCGE | |
| Average Intel Core i7-1260P (5950 - 26376, n=26) | |
| HP Elite Dragonfly G3 | |
| Lenovo ThinkPad X1 Carbon G10 21CC001RGE | |
| AIDA64 / CPU AES | |
| Lenovo ThinkPad X1 Carbon G9-20XWCTO1WW | |
| Lenovo ThinkPad Z13 G1-21D20016GE | |
| Average of class Office (4854 - 155900, n=83, last 2 years) | |
| Average Intel Core i7-1260P (16041 - 92356, n=26) | |
| Dell Latitude 9430 2-in-1 | |
| Lenovo ThinkPad X1 Carbon G10 21CB00DCGE | |
| HP Elite Dragonfly G3 | |
| Lenovo ThinkPad X1 Carbon G10 21CC001RGE | |
| AIDA64 / CPU ZLib | |
| Average of class Office (114.6 - 1366, n=83, last 2 years) | |
| Lenovo ThinkPad Z13 G1-21D20016GE | |
| Dell Latitude 9430 2-in-1 | |
| Average Intel Core i7-1260P (259 - 771, n=26) | |
| Lenovo ThinkPad X1 Carbon G10 21CC001RGE | |
| HP Elite Dragonfly G3 | |
| Lenovo ThinkPad X1 Carbon G10 21CB00DCGE | |
| Lenovo ThinkPad X1 Carbon G9-20XWCTO1WW | |
| AIDA64 / FP64 Ray-Trace | |
| Average of class Office (1109 - 17834, n=83, last 2 years) | |
| Lenovo ThinkPad Z13 G1-21D20016GE | |
| Dell Latitude 9430 2-in-1 | |
| Lenovo ThinkPad X1 Carbon G9-20XWCTO1WW | |
| Average Intel Core i7-1260P (1237 - 5858, n=26) | |
| Lenovo ThinkPad X1 Carbon G10 21CB00DCGE | |
| HP Elite Dragonfly G3 | |
| Lenovo ThinkPad X1 Carbon G10 21CC001RGE | |
| AIDA64 / CPU PhotoWorxx | |
| Dell Latitude 9430 2-in-1 | |
| HP Elite Dragonfly G3 | |
| Average of class Office (11090 - 65229, n=83, last 2 years) | |
| Lenovo ThinkPad X1 Carbon G9-20XWCTO1WW | |
| Lenovo ThinkPad X1 Carbon G10 21CB00DCGE | |
| Lenovo ThinkPad X1 Carbon G10 21CC001RGE | |
| Average Intel Core i7-1260P (13261 - 43652, n=26) | |
| Lenovo ThinkPad Z13 G1-21D20016GE | |
系统性能
合成系统性能基准测试与CPU测试类似。联想ThinkPad X1 Carbon 10代30周年纪念版工作速度很快,但没有占据杆位。在日常使用中,它被证明是一个反应非常灵敏的设备。
CrossMark: Overall | Productivity | Creativity | Responsiveness
| PCMark 10 / Score | |
| Average of class Office (2601 - 9298, n=68, last 2 years) | |
| Lenovo ThinkPad Z13 G1-21D20016GE | |
| Average Intel Core i7-1260P, Intel Iris Xe Graphics G7 96EUs (4796 - 6068, n=17) | |
| Dell Latitude 9430 2-in-1 | |
| Lenovo ThinkPad X1 Carbon G10 21CB00DCGE | |
| Lenovo ThinkPad X1 Carbon G10 21CC001RGE | |
| Lenovo ThinkPad X1 Carbon G9-20XWCTO1WW | |
| HP Elite Dragonfly G3 | |
| PCMark 10 / Essentials | |
| Dell Latitude 9430 2-in-1 | |
| Average Intel Core i7-1260P, Intel Iris Xe Graphics G7 96EUs (9260 - 11251, n=17) | |
| Lenovo ThinkPad Z13 G1-21D20016GE | |
| Lenovo ThinkPad X1 Carbon G10 21CC001RGE | |
| Lenovo ThinkPad X1 Carbon G9-20XWCTO1WW | |
| Average of class Office (3245 - 11594, n=68, last 2 years) | |
| Lenovo ThinkPad X1 Carbon G10 21CB00DCGE | |
| HP Elite Dragonfly G3 | |
| PCMark 10 / Productivity | |
| Average of class Office (5336 - 17243, n=68, last 2 years) | |
| Lenovo ThinkPad Z13 G1-21D20016GE | |
| Dell Latitude 9430 2-in-1 | |
| Average Intel Core i7-1260P, Intel Iris Xe Graphics G7 96EUs (6167 - 8629, n=17) | |
| Lenovo ThinkPad X1 Carbon G9-20XWCTO1WW | |
| Lenovo ThinkPad X1 Carbon G10 21CB00DCGE | |
| Lenovo ThinkPad X1 Carbon G10 21CC001RGE | |
| HP Elite Dragonfly G3 | |
| PCMark 10 / Digital Content Creation | |
| Average of class Office (2049 - 13541, n=68, last 2 years) | |
| Lenovo ThinkPad Z13 G1-21D20016GE | |
| Lenovo ThinkPad X1 Carbon G10 21CB00DCGE | |
| Average Intel Core i7-1260P, Intel Iris Xe Graphics G7 96EUs (5231 - 6908, n=17) | |
| Dell Latitude 9430 2-in-1 | |
| HP Elite Dragonfly G3 | |
| Lenovo ThinkPad X1 Carbon G10 21CC001RGE | |
| Lenovo ThinkPad X1 Carbon G9-20XWCTO1WW | |
| CrossMark / Overall | |
| Average Intel Core i7-1260P, Intel Iris Xe Graphics G7 96EUs (1484 - 1811, n=16) | |
| Dell Latitude 9430 2-in-1 | |
| Lenovo ThinkPad X1 Carbon G10 21CB00DCGE | |
| Lenovo ThinkPad X1 Carbon G10 21CC001RGE | |
| Lenovo ThinkPad Z13 G1-21D20016GE | |
| Average of class Office (381 - 2010, n=75, last 2 years) | |
| HP Elite Dragonfly G3 | |
| CrossMark / Productivity | |
| Average Intel Core i7-1260P, Intel Iris Xe Graphics G7 96EUs (1486 - 1755, n=16) | |
| Dell Latitude 9430 2-in-1 | |
| Lenovo ThinkPad Z13 G1-21D20016GE | |
| Lenovo ThinkPad X1 Carbon G10 21CB00DCGE | |
| Lenovo ThinkPad X1 Carbon G10 21CC001RGE | |
| Average of class Office (464 - 1880, n=75, last 2 years) | |
| HP Elite Dragonfly G3 | |
| CrossMark / Creativity | |
| Average Intel Core i7-1260P, Intel Iris Xe Graphics G7 96EUs (1451 - 1872, n=16) | |
| Lenovo ThinkPad X1 Carbon G10 21CB00DCGE | |
| Dell Latitude 9430 2-in-1 | |
| Lenovo ThinkPad X1 Carbon G10 21CC001RGE | |
| Average of class Office (319 - 2361, n=75, last 2 years) | |
| Lenovo ThinkPad Z13 G1-21D20016GE | |
| HP Elite Dragonfly G3 | |
| CrossMark / Responsiveness | |
| Average Intel Core i7-1260P, Intel Iris Xe Graphics G7 96EUs (1253 - 1807, n=16) | |
| Dell Latitude 9430 2-in-1 | |
| Lenovo ThinkPad X1 Carbon G10 21CC001RGE | |
| Lenovo ThinkPad X1 Carbon G10 21CB00DCGE | |
| Lenovo ThinkPad Z13 G1-21D20016GE | |
| Average of class Office (360 - 1820, n=75, last 2 years) | |
| HP Elite Dragonfly G3 | |
| PCMark 10 Score | 5411 points | |
Help | ||
| AIDA64 / Memory Copy | |
| Dell Latitude 9430 2-in-1 | |
| HP Elite Dragonfly G3 | |
| Average of class Office (20075 - 110930, n=80, last 2 years) | |
| Lenovo ThinkPad X1 Carbon G10 21CC001RGE | |
| Lenovo ThinkPad X1 Carbon G10 21CB00DCGE | |
| Lenovo ThinkPad X1 Carbon G9-20XWCTO1WW | |
| Average Intel Core i7-1260P (25125 - 71544, n=25) | |
| Lenovo ThinkPad Z13 G1-21D20016GE | |
| AIDA64 / Memory Read | |
| Lenovo ThinkPad X1 Carbon G10 21CC001RGE | |
| Lenovo ThinkPad X1 Carbon G10 21CB00DCGE | |
| Average of class Office (10084 - 128030, n=81, last 2 years) | |
| HP Elite Dragonfly G3 | |
| Dell Latitude 9430 2-in-1 | |
| Lenovo ThinkPad X1 Carbon G9-20XWCTO1WW | |
| Average Intel Core i7-1260P (24983 - 72065, n=25) | |
| Lenovo ThinkPad Z13 G1-21D20016GE | |
| AIDA64 / Memory Write | |
| Average of class Office (20073 - 119858, n=81, last 2 years) | |
| Dell Latitude 9430 2-in-1 | |
| Lenovo ThinkPad X1 Carbon G10 21CB00DCGE | |
| Lenovo ThinkPad X1 Carbon G9-20XWCTO1WW | |
| Lenovo ThinkPad X1 Carbon G10 21CC001RGE | |
| HP Elite Dragonfly G3 | |
| Average Intel Core i7-1260P (23512 - 66799, n=25) | |
| Lenovo ThinkPad Z13 G1-21D20016GE | |
| AIDA64 / Memory Latency | |
| Lenovo ThinkPad Z13 G1-21D20016GE | |
| HP Elite Dragonfly G3 | |
| Average of class Office (7.6 - 162.9, n=76, last 2 years) | |
| Dell Latitude 9430 2-in-1 | |
| Lenovo ThinkPad X1 Carbon G10 21CB00DCGE | |
| Lenovo ThinkPad X1 Carbon G9-20XWCTO1WW | |
| Average Intel Core i7-1260P (77.9 - 118.4, n=21) | |
| Lenovo ThinkPad X1 Carbon G10 21CC001RGE | |
| Lenovo ThinkPad X1 Carbon G10 21CC001RGE | |
* ... smaller is better
DPC延时
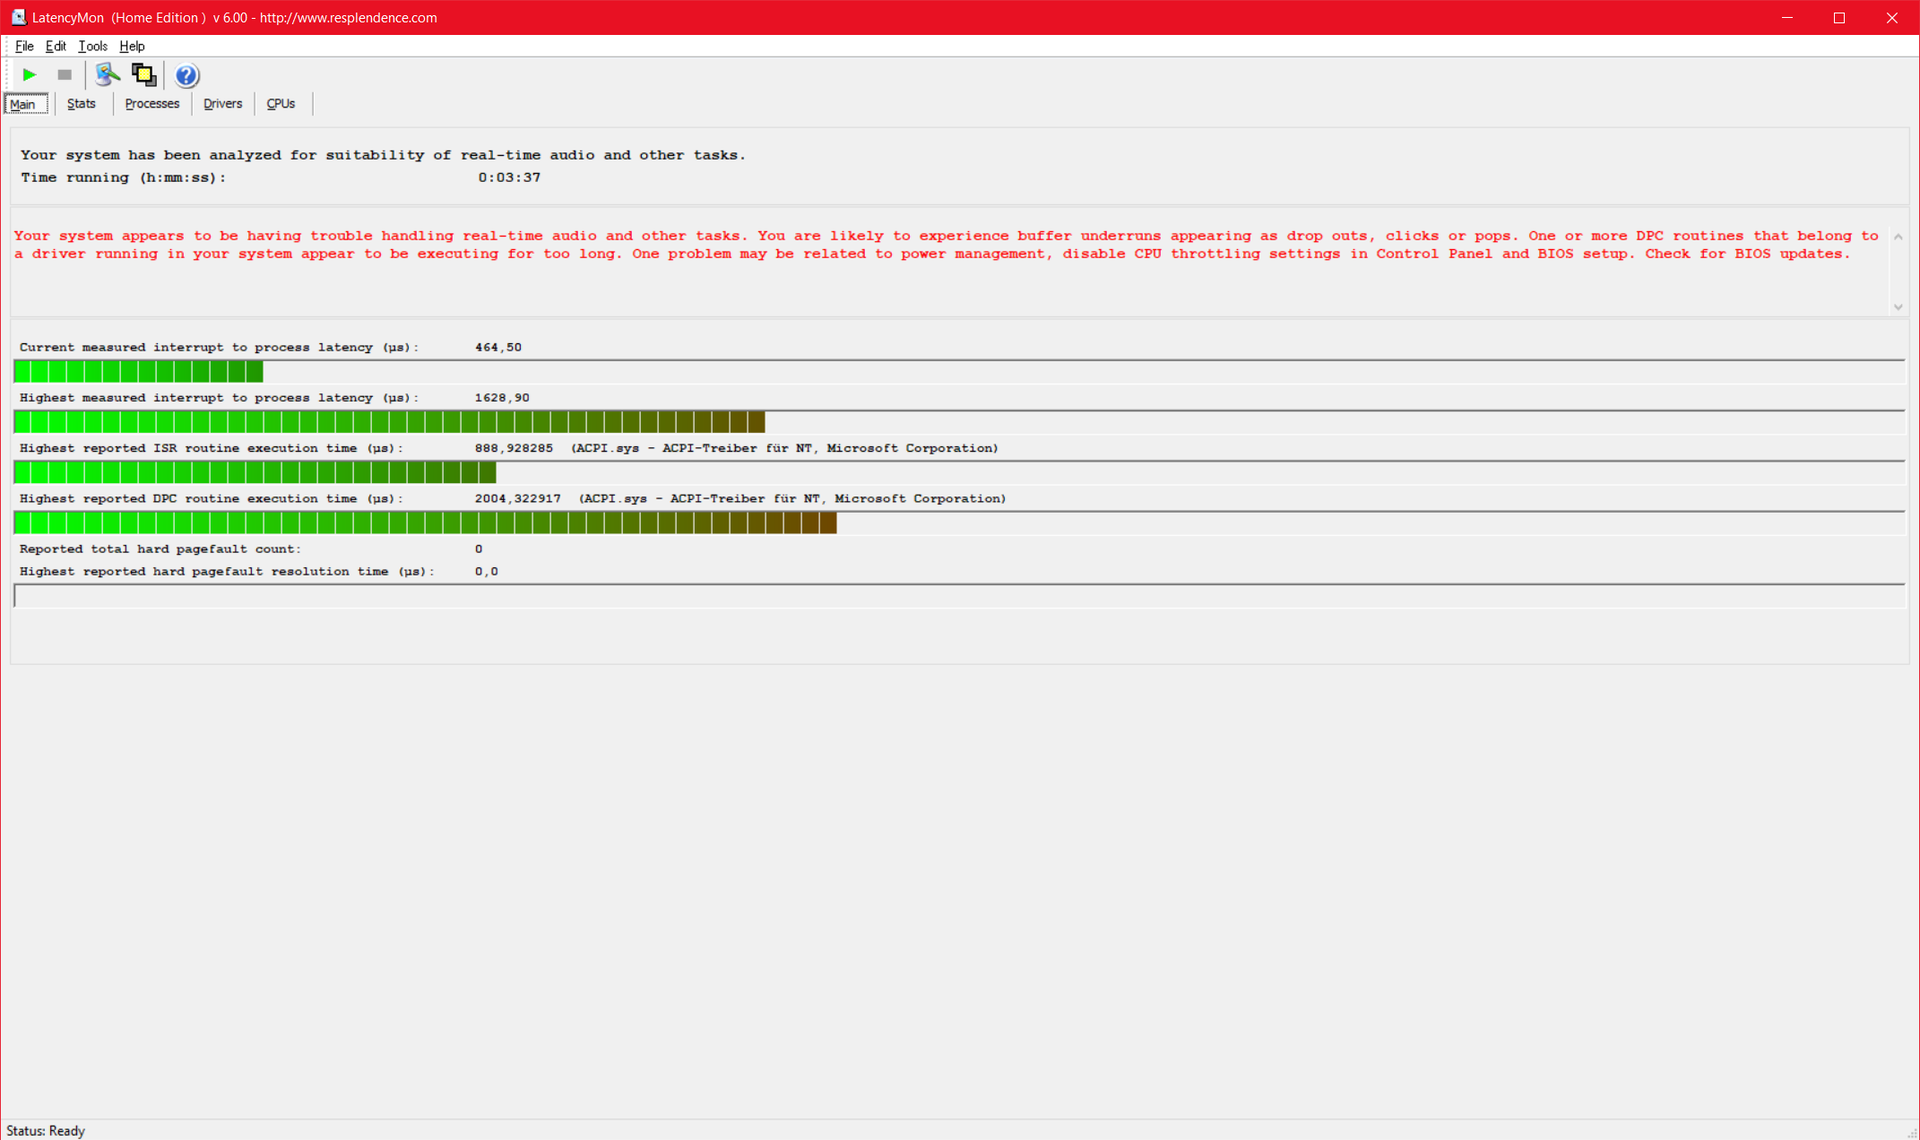
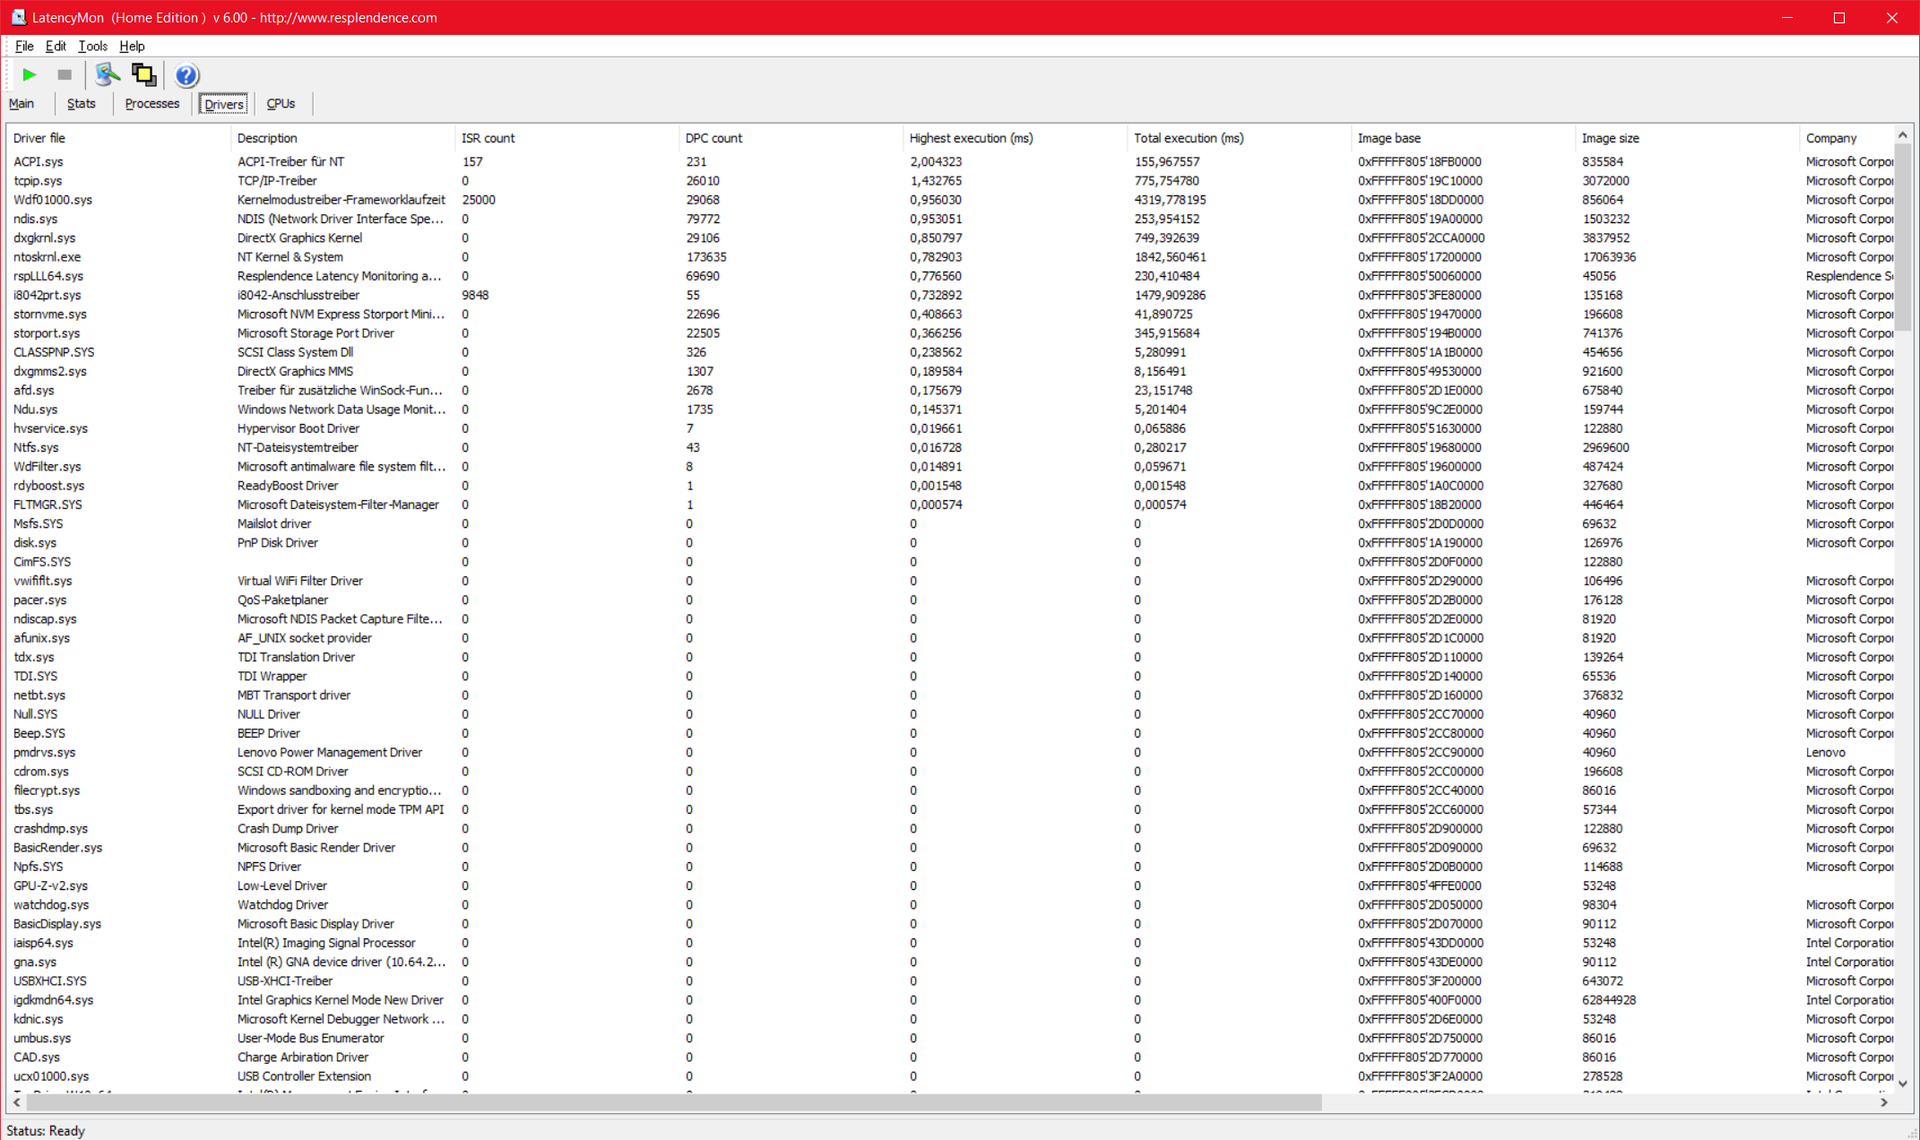
| DPC Latencies / LatencyMon - interrupt to process latency (max), Web, Youtube, Prime95 | |
| Lenovo ThinkPad X1 Carbon G10 21CC001RGE | |
| Lenovo ThinkPad X1 Carbon G10 21CB00DCGE | |
| HP Elite Dragonfly G3 | |
| Dell Latitude 9430 2-in-1 | |
| Lenovo ThinkPad Z13 G1-21D20016GE | |
| Lenovo ThinkPad X1 Carbon G9-20XWCTO1WW | |
* ... smaller is better
存储设备
容量为512GB的M.2 SSD PM91A来自三星。它连接到NVMe PCIe 4.0标准,工作速度很快,尽管略低于这种SSD的平均水平。至少性能是完全稳定的,即使是在永久性负载下。

* ... smaller is better
Sustained Read Performance: DiskSpd Read Loop, Queue Depth 8
图形卡
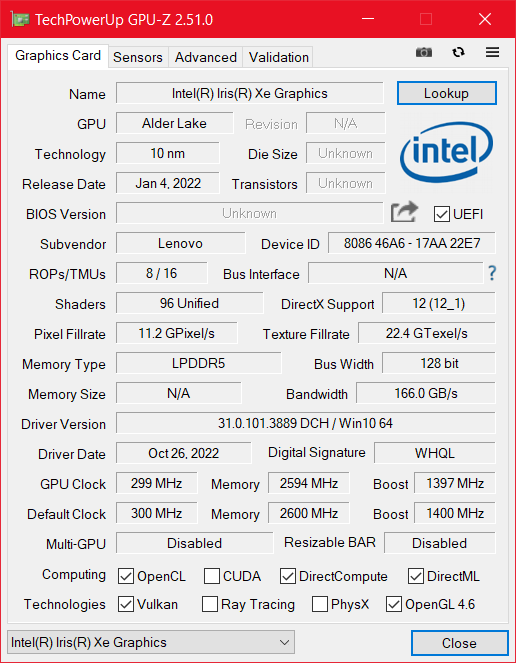
与我们对X1 Carbon 2022的第一次审查样本相比,GPU也有了变化,因为英特尔Iris Xe有96个而不是80个执行单元。这导致了性能的轻微提高,但并没有真正产生大的差异。GPU对于简单的任务来说是足够的,但是X1 Carbon G10对于其他一切来说都是错误的笔记本,包括游戏和CAD。
| 3DMark 11 Performance | 5769 points | |
| 3DMark Cloud Gate Standard Score | 14688 points | |
| 3DMark Fire Strike Score | 4154 points | |
| 3DMark Time Spy Score | 1722 points | |
Help | ||
* ... smaller is better
| The Witcher 3 - 1920x1080 Ultra Graphics & Postprocessing (HBAO+) | |
| Average of class Office (14.8 - 28.1, n=3, last 2 years) | |
| Lenovo ThinkPad Z13 G1-21D20016GE | |
| Dell Latitude 9430 2-in-1 | |
| HP Elite Dragonfly G3 | |
| Lenovo ThinkPad X1 Carbon G10 21CB00DCGE | |
| Lenovo ThinkPad X1 Carbon G10 21CC001RGE | |
| Final Fantasy XV Benchmark - 1920x1080 High Quality | |
| Average of class Office (8.09 - 79.5, n=71, last 2 years) | |
| Lenovo ThinkPad Z13 G1-21D20016GE | |
| Dell Latitude 9430 2-in-1 | |
| HP Elite Dragonfly G3 | |
| Lenovo ThinkPad X1 Carbon G10 21CB00DCGE | |
| Lenovo ThinkPad X1 Carbon G10 21CC001RGE | |
| Strange Brigade - 1920x1080 ultra AA:ultra AF:16 | |
| Lenovo ThinkPad Z13 G1-21D20016GE | |
| Average of class Office (12.9 - 142.1, n=53, last 2 years) | |
| Dell Latitude 9430 2-in-1 | |
| HP Elite Dragonfly G3 | |
| Lenovo ThinkPad X1 Carbon G10 21CB00DCGE | |
| Dota 2 Reborn - 1920x1080 ultra (3/3) best looking | |
| Lenovo ThinkPad Z13 G1-21D20016GE | |
| Average of class Office (14.6 - 135, n=77, last 2 years) | |
| Dell Latitude 9430 2-in-1 | |
| HP Elite Dragonfly G3 | |
| Lenovo ThinkPad X1 Carbon G10 21CB00DCGE | |
| Lenovo ThinkPad X1 Carbon G10 21CC001RGE | |
Witcher 3 FPS Chart
| low | med. | high | ultra | QHD | |
|---|---|---|---|---|---|
| The Witcher 3 (2015) | 83.3 | 51 | 27.2 | 12.9 | |
| Dota 2 Reborn (2015) | 99.8 | 74.7 | 50.3 | 43.5 | |
| Final Fantasy XV Benchmark (2018) | 39.8 | 18.6 | 13 | 9.59 | |
| X-Plane 11.11 (2018) | 38.1 | 38.2 | 34.2 | ||
| Strange Brigade (2018) | 79.2 | 34.2 | 25.8 | 19.8 |
排放。提高性能意味着更大的风扇噪音
噪声
虽然性能值有所提高,但与之相反的是风扇的噪音,比我们第一次评测样本中的噪音更大,而且也更频繁地运行。即使在空闲模式下,冷却系统偶尔也会偶尔启动。相比之下,只有联想ThinkPad Z13在负载下的冷却声音更大。因此,ThinkPad X1 Carbon G10不一定是爱好安静的人的正确选择,特别是由于风扇的频率也比较高。
没有检测到线圈的啸叫。
Noise level
| Idle |
| 22.8 / 22.8 / 24.6 dB(A) |
| Load |
| 38.2 / 38.2 dB(A) |
 | ||
30 dB silent 40 dB(A) audible 50 dB(A) loud |
||
min: | ||
| Lenovo ThinkPad X1 Carbon G10 21CB00DCGE Iris Xe G7 96EUs, i7-1260P, Samsung PM9A1 MZVL2512HCJQ | Lenovo ThinkPad X1 Carbon G10 21CC001RGE Iris Xe G7 80EUs, i5-1250P, Samsung PM9A1 MZVL2512HCJQ | Lenovo ThinkPad X1 Carbon G9-20XWCTO1WW Iris Xe G7 96EUs, i7-1165G7, Samsung PM9A1 MZVL21T0HCLR | Lenovo ThinkPad Z13 G1-21D20016GE Radeon 680M, R7 PRO 6860Z, Micron 2450 1TB MTFDKCD1T0TFK | HP Elite Dragonfly G3 Iris Xe G7 96EUs, i7-1265U, Micron 3400 MTFDKBA512TFH 512GB | Dell Latitude 9430 2-in-1 Iris Xe G7 96EUs, i7-1265U | |
|---|---|---|---|---|---|---|
| Noise | 5% | 2% | -6% | 9% | -4% | |
| off / environment * (dB) | 22.8 | 22.81 -0% | 23.66 -4% | 24.3 -7% | 22.8 -0% | 23.7 -4% |
| Idle Minimum * (dB) | 22.8 | 22.81 -0% | 23.6 -4% | 24.3 -7% | 23.2 -2% | 23.7 -4% |
| Idle Average * (dB) | 22.8 | 22.81 -0% | 23.6 -4% | 24.3 -7% | 23.2 -2% | 23.7 -4% |
| Idle Maximum * (dB) | 24.6 | 22.81 7% | 23.6 4% | 24.3 1% | 23.2 6% | 23.7 4% |
| Load Average * (dB) | 38.2 | 31.59 17% | 33.5 12% | 41 -7% | 25.1 34% | 35.1 8% |
| Witcher 3 ultra * (dB) | 38.1 | 35.59 7% | 41 -8% | 32 16% | 43.3 -14% | |
| Load Maximum * (dB) | 38.2 | 35.47 7% | 34.3 10% | 41 -7% | 35.2 8% | 43 -13% |
* ... smaller is better
温度
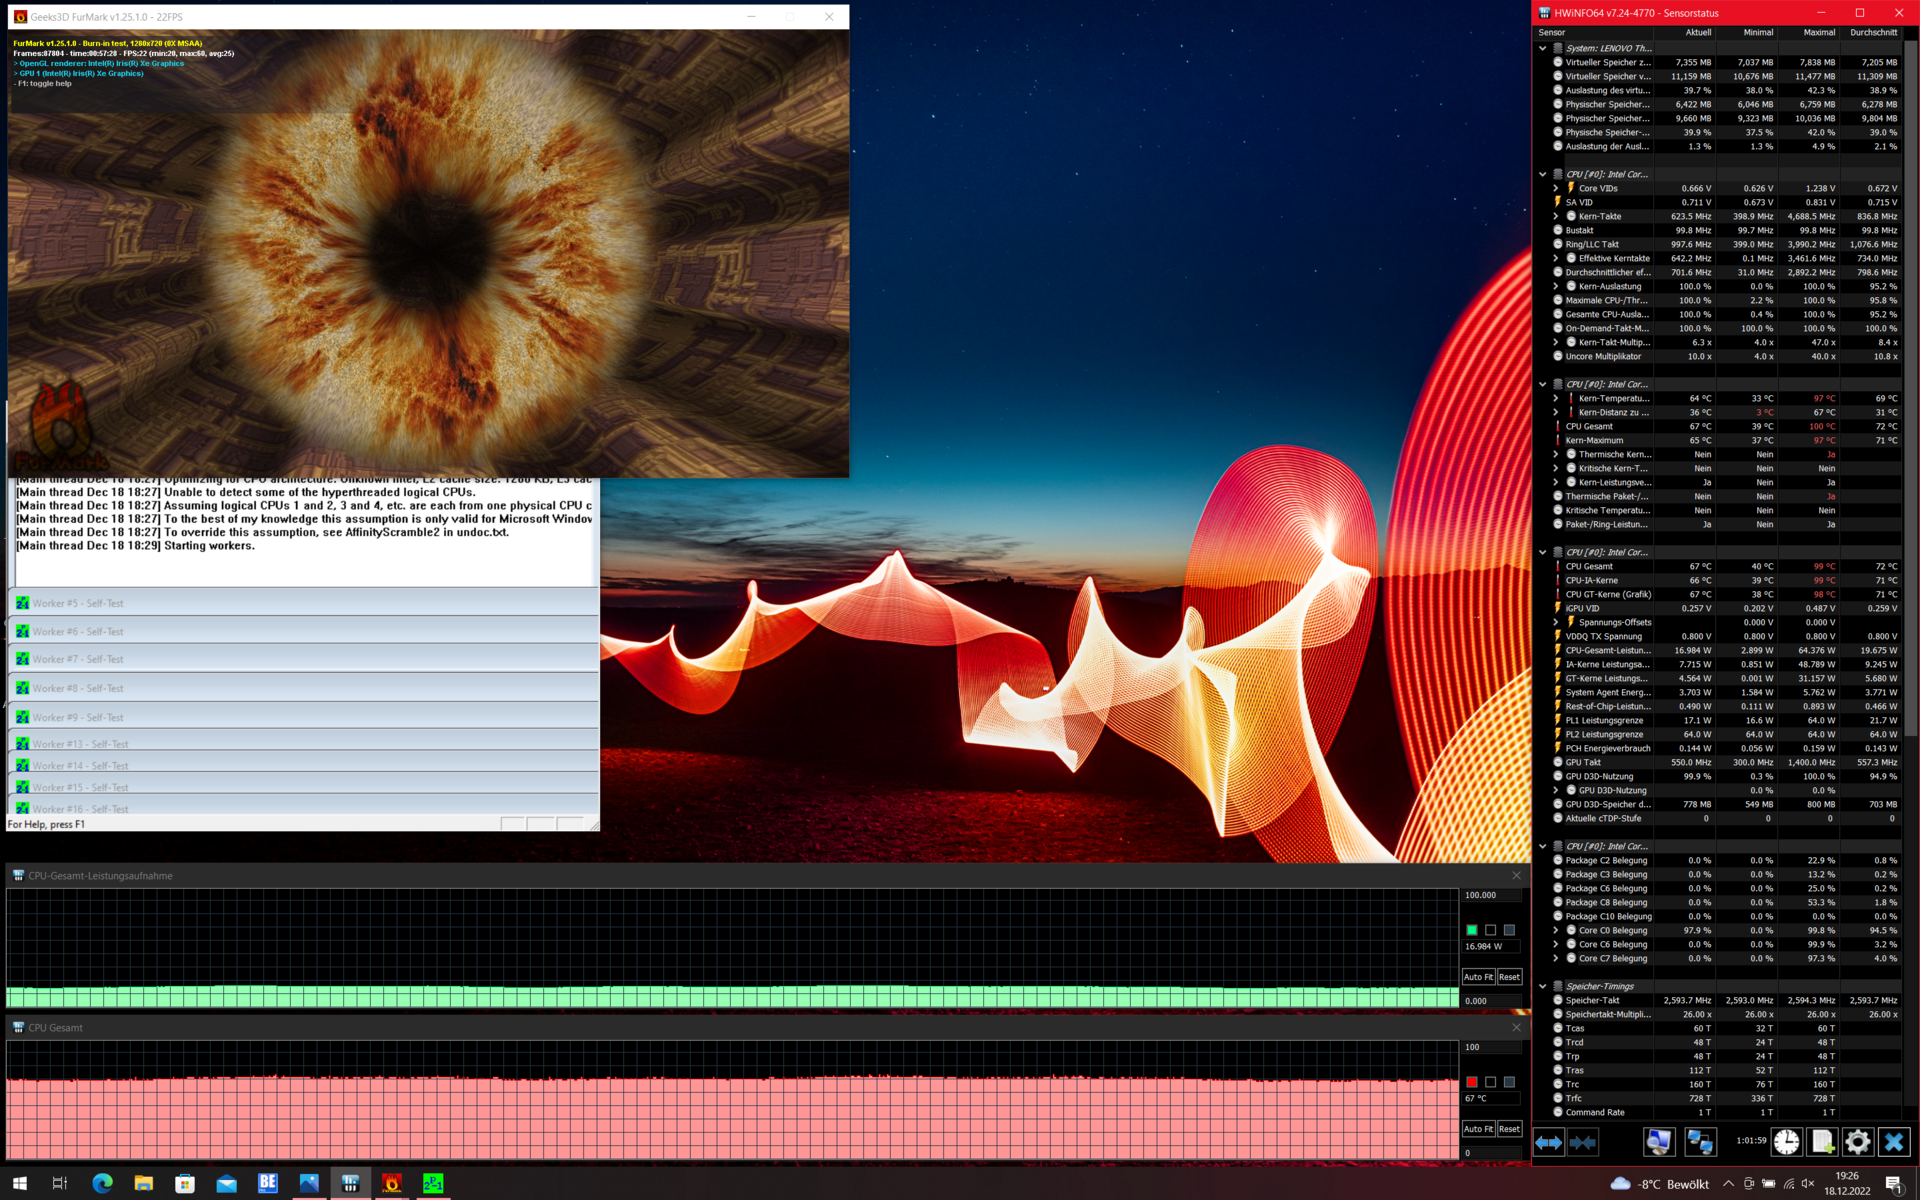
大部分热量的发展集中在机箱的左上角。在负载情况下,这里达到了50摄氏度左右,无论是顶部还是底部,甚至在Witcher 3 测试中还会多一点。值得庆幸的是,这些地方在使用过程中通常不会被触及,但联想ThinkPad X1 Carbon G10 30周年纪念版肯定不能被描述为一台运行凉爽的笔记本电脑。
在压力测试期间,即GPU和CPU的同时负荷,处理器被永久限制在仅17瓦。除了已经存在的对CPU性能的限制外,这种与TDP相关的节流对日常使用没有进一步影响。在这种情况下,GPU消耗了TDP预算的一个额外部分。
(-) The maximum temperature on the upper side is 50 °C / 122 F, compared to the average of 34.3 °C / 94 F, ranging from 21.2 to 62.5 °C for the class Office.
(-) The bottom heats up to a maximum of 49.7 °C / 121 F, compared to the average of 36.8 °C / 98 F
(+) In idle usage, the average temperature for the upper side is 27.1 °C / 81 F, compared to the device average of 29.5 °C / 85 F.
(±) Playing The Witcher 3, the average temperature for the upper side is 35.7 °C / 96 F, compared to the device average of 29.5 °C / 85 F.
(+) The palmrests and touchpad are cooler than skin temperature with a maximum of 28.8 °C / 83.8 F and are therefore cool to the touch.
(±) The average temperature of the palmrest area of similar devices was 27.5 °C / 81.5 F (-1.3 °C / -2.3 F).
| Lenovo ThinkPad X1 Carbon G10 21CB00DCGE Intel Core i7-1260P, Intel Iris Xe Graphics G7 96EUs | Lenovo ThinkPad X1 Carbon G10 21CC001RGE Intel Core i5-1250P, Intel Iris Xe Graphics G7 80EUs | Lenovo ThinkPad X1 Carbon G9-20XWCTO1WW Intel Core i7-1165G7, Intel Iris Xe Graphics G7 96EUs | Lenovo ThinkPad Z13 G1-21D20016GE AMD Ryzen 7 PRO 6860Z, AMD Radeon 680M | HP Elite Dragonfly G3 Intel Core i7-1265U, Intel Iris Xe Graphics G7 96EUs | Dell Latitude 9430 2-in-1 Intel Core i7-1265U, Intel Iris Xe Graphics G7 96EUs | |
|---|---|---|---|---|---|---|
| Heat | 6% | 6% | 9% | 17% | 24% | |
| Maximum Upper Side * (°C) | 50 | 45 10% | 51.5 -3% | 45.6 9% | 39 22% | 39.2 22% |
| Maximum Bottom * (°C) | 49.7 | 44 11% | 45.3 9% | 51 -3% | 42.2 15% | 44.8 10% |
| Idle Upper Side * (°C) | 32.4 | 31.2 4% | 29.6 9% | 27 17% | 26.8 17% | 21.4 34% |
| Idle Bottom * (°C) | 32.3 | 33.2 -3% | 30 7% | 27.9 14% | 28.2 13% | 22.4 31% |
* ... smaller is better
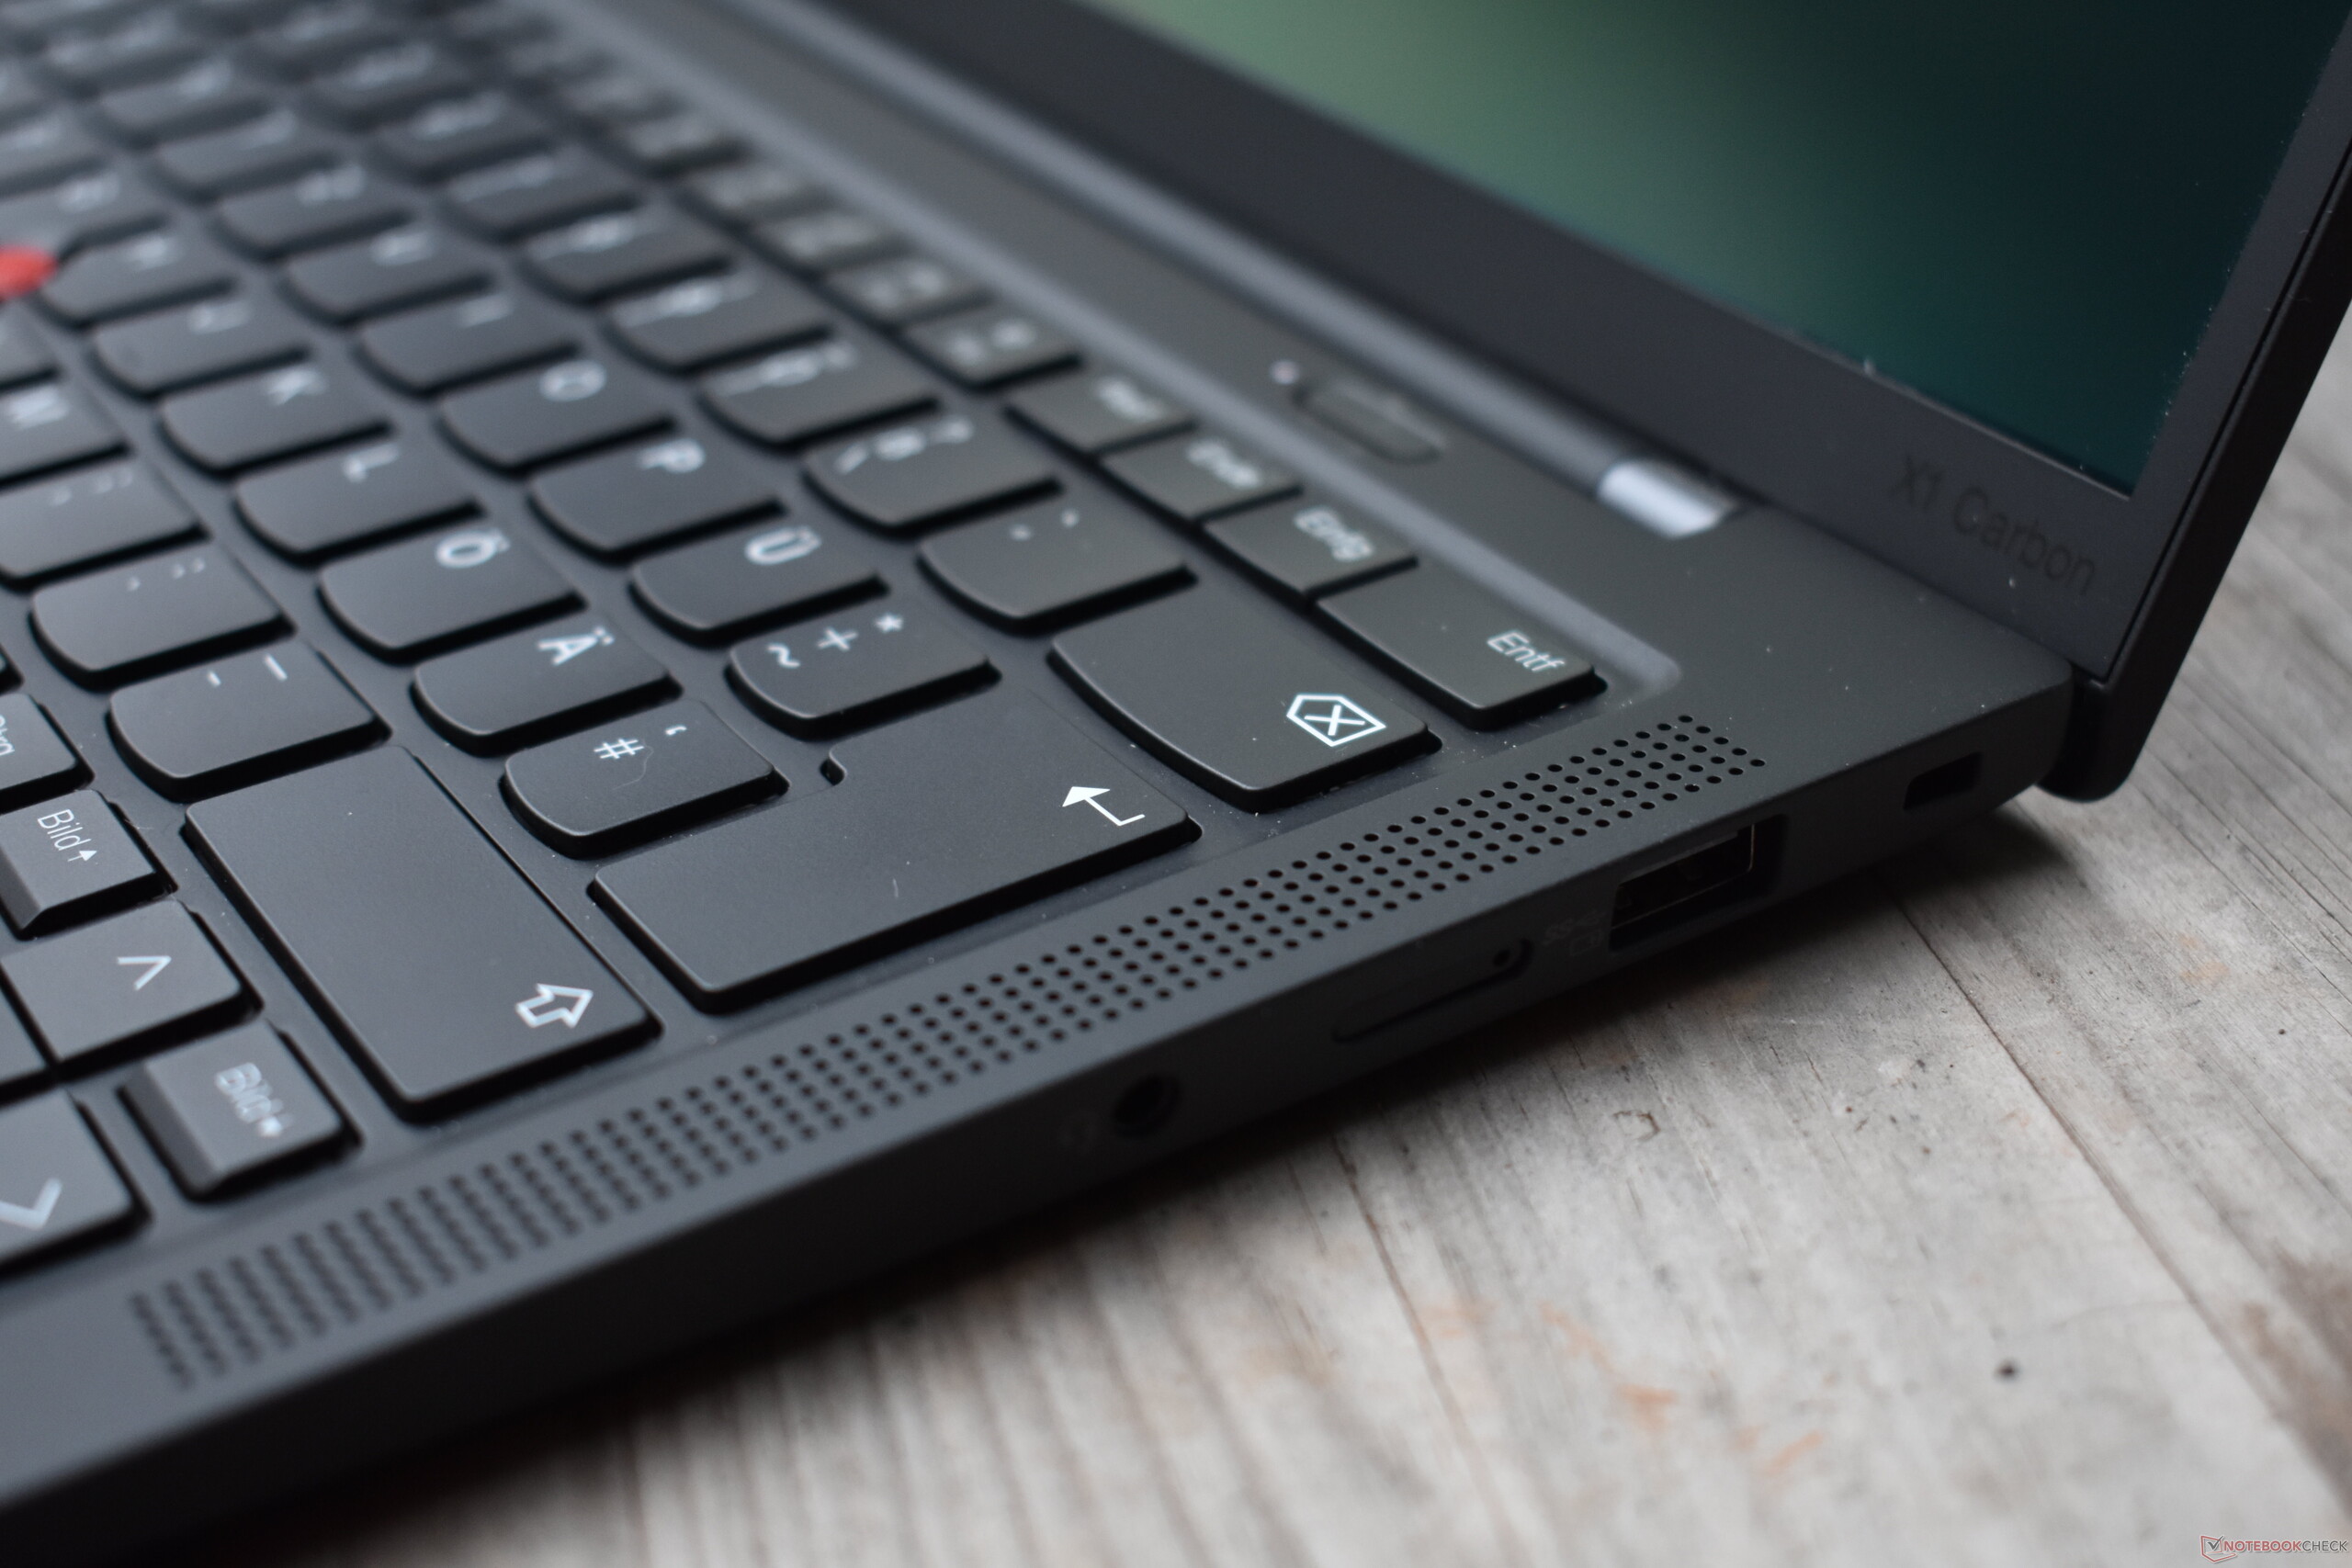
发言人
相比之下戴尔Latitude 9430联想ThinkPad X1 Carbon G10的四个扬声器要安静得多,但在某种程度上更加平衡。底部的两个低音扬声器和顶部的两个高音扬声器的组合,足以让一个小房间充满声音。
Lenovo ThinkPad X1 Carbon G10 21CB00DCGE audio analysis
(±) | speaker loudness is average but good (75.2 dB)
Bass 100 - 315 Hz
(±) | reduced bass - on average 12.8% lower than median
(±) | linearity of bass is average (14.9% delta to prev. frequency)
Mids 400 - 2000 Hz
(+) | balanced mids - only 2.5% away from median
(+) | mids are linear (4.8% delta to prev. frequency)
Highs 2 - 16 kHz
(+) | balanced highs - only 1.1% away from median
(+) | highs are linear (2.8% delta to prev. frequency)
Overall 100 - 16.000 Hz
(+) | overall sound is linear (12.2% difference to median)
Compared to same class
» 5% of all tested devices in this class were better, 2% similar, 94% worse
» The best had a delta of 7%, average was 21%, worst was 53%
Compared to all devices tested
» 10% of all tested devices were better, 3% similar, 88% worse
» The best had a delta of 4%, average was 23%, worst was 134%
Dell Latitude 9430 2-in-1 audio analysis
(+) | speakers can play relatively loud (94.3 dB)
Bass 100 - 315 Hz
(±) | reduced bass - on average 12.3% lower than median
(+) | bass is linear (5.3% delta to prev. frequency)
Mids 400 - 2000 Hz
(+) | balanced mids - only 2% away from median
(+) | mids are linear (4.7% delta to prev. frequency)
Highs 2 - 16 kHz
(±) | higher highs - on average 5.4% higher than median
(+) | highs are linear (3% delta to prev. frequency)
Overall 100 - 16.000 Hz
(+) | overall sound is linear (11.6% difference to median)
Compared to same class
» 10% of all tested devices in this class were better, 4% similar, 86% worse
» The best had a delta of 6%, average was 20%, worst was 57%
Compared to all devices tested
» 8% of all tested devices were better, 2% similar, 90% worse
» The best had a delta of 4%, average was 23%, worst was 134%
电源管理。OLED缩短了X1 Carbon G10的电池寿命
消耗功率
更高分辨率的OLED屏幕对消耗的影响显然是消极的一面。最低空闲消耗量是ThinkPad X1 Carbon G10的第一款机型的两倍多,后者配备的是IPS WUXGA面板。至少X1 Carbon几乎与ThinkPad Z13持平,后者也采用了OLED屏幕。
电源的尺寸比较合适,最大消耗为62.5瓦,这也只代表峰值负载。
| Off / Standby | |
| Idle | |
| Load |
|
Key:
min: | |
| Lenovo ThinkPad X1 Carbon G10 21CB00DCGE i7-1260P, Iris Xe G7 96EUs, Samsung PM9A1 MZVL2512HCJQ, OLED, 2880x1800, 14" | Lenovo ThinkPad X1 Carbon G10 21CC001RGE i5-1250P, Iris Xe G7 80EUs, Samsung PM9A1 MZVL2512HCJQ, IPS LED, 1920x1200, 14" | Lenovo ThinkPad X1 Carbon G9-20XWCTO1WW i7-1165G7, Iris Xe G7 96EUs, Samsung PM9A1 MZVL21T0HCLR, IPS LED, 3840x2400, 14" | Lenovo ThinkPad Z13 G1-21D20016GE R7 PRO 6860Z, Radeon 680M, Micron 2450 1TB MTFDKCD1T0TFK, OLED, 2880x1800, 13.3" | HP Elite Dragonfly G3 i7-1265U, Iris Xe G7 96EUs, Micron 3400 MTFDKBA512TFH 512GB, IPS, 1920x1280, 13.5" | Dell Latitude 9430 2-in-1 i7-1265U, Iris Xe G7 96EUs, , IPS, 2560x1600, 14" | Average Intel Iris Xe Graphics G7 96EUs | Average of class Office | |
|---|---|---|---|---|---|---|---|---|
| Power Consumption | 28% | -10% | -3% | 16% | 19% | -5% | 10% | |
| Idle Minimum * (Watt) | 6.4 | 2.9 55% | 5 22% | 5.7 11% | 3.4 47% | 2.9 55% | 5.51 ? 14% | 4.26 ? 33% |
| Idle Average * (Watt) | 7.4 | 4.9 34% | 10.2 -38% | 7.6 -3% | 5.6 24% | 5.8 22% | 8.66 ? -17% | 7.31 ? 1% |
| Idle Maximum * (Watt) | 8.3 | 6 28% | 11 -33% | 8.4 -1% | 8.4 -1% | 6.6 20% | 10.9 ? -31% | 8.55 ? -3% |
| Load Average * (Watt) | 56.5 | 29.3 48% | 51.7 8% | 54.4 4% | 40.8 28% | 49.2 13% | 45.6 ? 19% | 43.8 ? 22% |
| Witcher 3 ultra * (Watt) | 37.5 | 36.6 2% | 48.1 -28% | 35.5 5% | 35.3 6% | |||
| Load Maximum * (Watt) | 62.5 | 63.3 -1% | 67.5 -8% | 62.7 -0% | 68.4 -9% | 63.1 -1% | 67.8 ? -8% | 64.5 ? -3% |
* ... smaller is better
Power consumption Witcher 3 / Stress test
Power Consumption with an external monitor
电池寿命
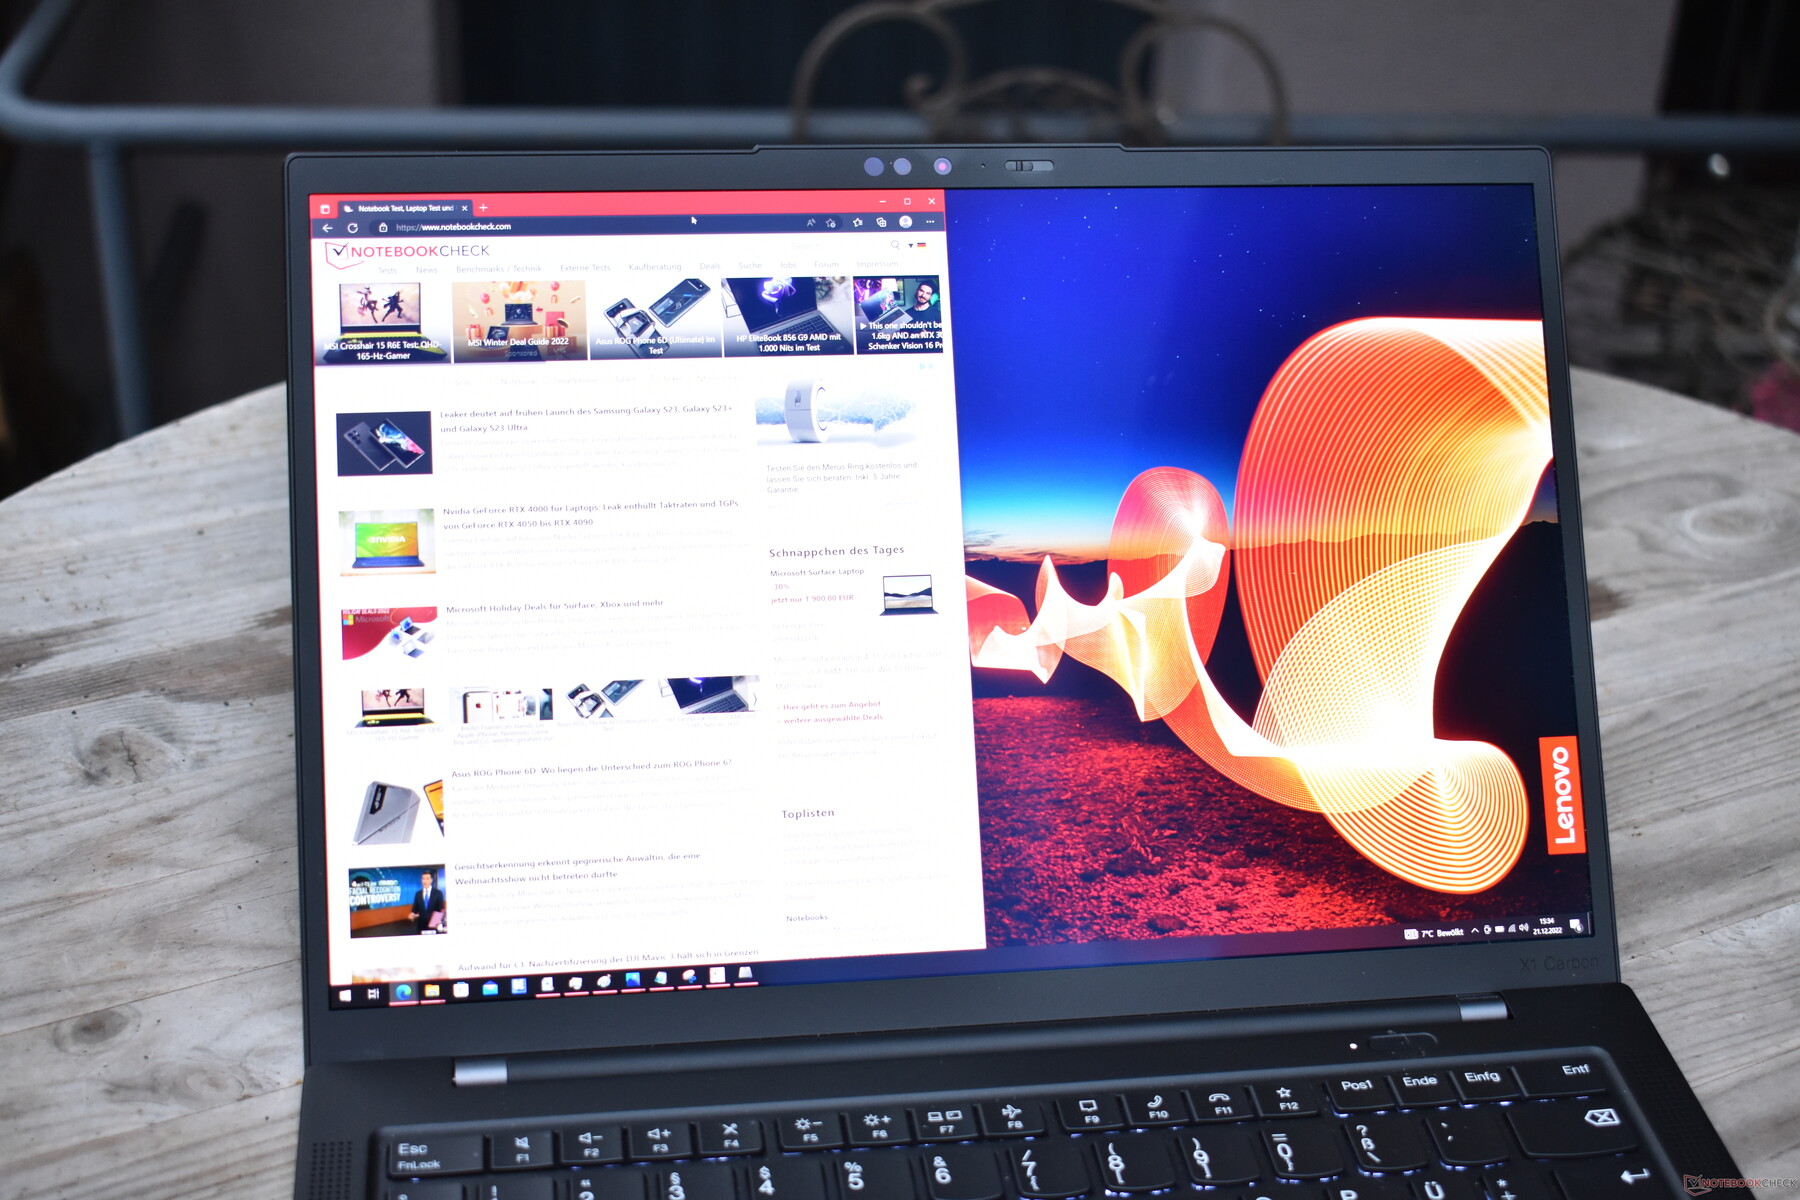
57瓦特小时的电池容量保持不变。OLED屏幕的较高消耗明显影响了电池运行时间。在我们的Wi-Fi测试中,联想ThinkPad X1 Carbon G10 30周年纪念版仅在5小时后就耗尽了电量(150cd/m²的亮度)。这是很弱的。相比之下。同样采用耗电的OLED显示屏的ThinkPad Z13在同一测试中取得了超过7小时的成绩。
在OLED笔记本电脑中实现更长的电池运行时间的一个方法是黑暗模式。我们的WiFi测试主要包括具有明亮背景的网站,这意味着对部分自发光像素的消耗更高。现代网络浏览器可以被设置为所有网站都以黑暗模式显示。我们在这些条件下重复进行了Wi-Fi测试。在黑暗模式下,联想ThinkPad X1 Carbon G10 OLED在Wi-Fi测试中实现了约7小时的运行时间。这款机型和其他OLED笔记本的购买者应该尽可能使用黑暗模式。
Pros
Cons
评语:高质量的OLED显示屏缩短了电池寿命
即使没有OLED显示屏,联想ThinkPad X1 Carbon Gen 10也是一款非常好的商务笔记本。我们的第一款评测设备,采用IPS面板,取得了90%的综合评分。有了OLED,显示质量明显提高,但必须在其他方面做出妥协。由于更高的消耗,电池寿命受到很大影响,如果不对所有应用程序和网站激活黑暗模式,X1 Carbon G10 OLED很难在旅途中长时间使用。很遗憾,因为抗反射的OLED面板实际上非常适合户外使用。
这次评测更新的另一个令人兴奋的方面是CPU的性能,在我们第一次评测X1 Carbon G10 mit i5时发现它的性能不理想。 X1 Carbon G10 mit i5-CPU.幸运的是,这一点已经得到改善,联想通过固件更新解决了这个问题。然而,风扇在负载下运行的声音比以前大了一些。
小小的周年纪念精神,却有一个非常好的OLED显示屏。联想ThinkPad X1 Carbon 10代30周年纪念版
在日常使用中你几乎注意不到这是一个周年纪念版,除了彩色的标志作为提醒。联想在这里浪费了创造独特东西的机会,这意味着OLED显示屏是这款机型的主要焦点。这实际上在商务笔记本中仍然是一个相当罕见的功能,而高图像质量是X1 Carbon Gen 10 30周年纪念版的一个非常好的理由。由于电池寿命较短,它可能不像其他商务机型那样实用,但使用OLED显示器是一种享受。
如果端口和更经典的ThinkPad设计不是那么重要,那么 联想ThinkPad Z13 OLED可能是一个不错的选择。它的功能更加强大,电池寿命也更长。其他厂商的商务竞争产品不提供OLED,但 HP Elite Dragonfly G3有一个非常好的3:2格式的IPS液晶显示器,这对一些读者来说可能很有趣。该 戴尔Latitude 9430 2合1明显更重,但却有一个更明亮的显示屏作为回报。戴尔和惠普的笔记本电脑也都有更好的电池寿命。
价格和可用性
根据你的位置,联想ThinkPad X1 Carbon Gen 10 30周年纪念版可通过联想官方网站以自由配置的笔记本电脑形式购买。美国的价格从1,397.40美元起。.在英国的起价为和新加坡分别为2,310.00英镑和2,303.74新加坡元(这并不是一个详尽的清单)。
价格截至22.12.2022,可能会有变化。
Lenovo ThinkPad X1 Carbon G10 21CB00DCGE
- 12/21/2022 v7 (old)
Benjamin Herzig
Price comparison

