Notebook reviews with NVIDIA GeForce RTX 4070 Laptop GPU graphics card
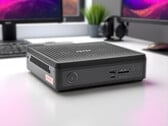
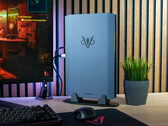
Zotac Zbox Magnus EN374070 评测 - 2.65 升机箱内的迷你游戏 PC,配备 NvidiaGeForce RTX 4070
众泰 Zbox Magnus EN374070 将强大的硬件与小巧的机身完美结合:英特尔酷睿 i7-13700HX 和 NvidiaGeForce RTX 4070 笔记本电脑图形处理器为游戏和日常使用提供了强大的性能。在测试过程中,我们检查了它的性能、噪音排放和功耗,并展示了这款迷你 PC 能否跟上竞争对手的步伐。
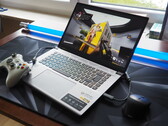
Intel Core i7-13700HX, NVIDIA GeForce RTX 4070 Laptop GPU, 1.6 kg微星 Katana A17 AI 笔记本电脑评测:图形处理能力强劲,但显示效果不佳
Katana A17 是 GE、GS 或 GT 系列的廉价替代品,其 105 WGeForce RTX 4070 GPU 仍能提供出色的图形性能。遗憾的是,它的 1080p 面板缺乏完整的 sRGB 色彩、快速响应时间和 G-Sync 支持。
AMD Ryzen 7 8845HS, NVIDIA GeForce RTX 4070 Laptop GPU, 17.3", 2.7 kg微星 Katana A15 AI 笔记本电脑评测:RTX 4070 玩家因节约成本而受伤
微星凭借 Katana A15 AI 进入竞争激烈的中端游戏笔记本电脑领域。这款 15 英寸笔记本电脑配备了强大的 Ryzen 处理器和GeForce RTX 4060 或 RTX 4070,但在一个关键方面却令人大失所望。
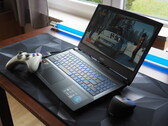
AMD Ryzen 9 8945HS, NVIDIA GeForce RTX 4070 Laptop GPU, 15.6", 2.3 kg宏碁掠夺者 Triton Neo 16 评论:为游戏玩家和创作者打造的配备 RTX 4070 的高端笔记本电脑
我们最近测试的 Nitro V 16 由于显示效果不佳,只给我们留下了有限的印象,而 Predator Triton Neo 16 的表现则要好得多。我们对这款配备 Meteor Lake CPU 和GeForce RTX 4070 的 16 英寸游戏机进行了测试。
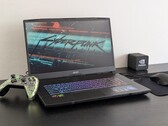
Intel Core Ultra 9 185H, NVIDIA GeForce RTX 4070 Laptop GPU, 16", 2 kgMinisforum AtomMan G7 Ti 评论:无屏幕游戏笔记本电脑:台式电脑的空间节约型替代品
Minisforum AtomMan G7 Ti 以小巧的外形实现了台式机的性能。它配备了功能强大的英特尔酷睿 i9-14900HX 和 NvidiaGeForce RTX 4070 笔记本电脑 GPU,主要面向需要在最小空间内实现最高性能的游戏玩家、创意人士和专业人士。在本次测试中,我们将仔细研究这款迷你 PC,看看它是否不负众望。
Intel Core i9-14900HX, NVIDIA GeForce RTX 4070 Laptop GPU, 2.6 kgMSI Sword 16 HX B14VGKG: Intel Core i7-14700HX, 16.00", 2.3 kg
Review » 微星 Sword 16 HX 笔记本电脑评测:乏善可陈的屏幕扼杀了游戏性能
Maingear ML-16 MK2: Intel Core Ultra 7 155H, 16.00", 2.1 kg
Review » Maingear ML-16 MK2 笔记本电脑评测: GeForce RTX 4070 性能卓越,价格实惠
Acer Predator Helios Neo 14 (2024): Intel Core Ultra 9 185H, 14.50", 1.9 kg
Review » 宏碁掠夺者 Helios Neo 14 (2024) 评测:超长运行时间的便携式 RTX 4070 笔记本电脑
Asus ROG NUC 14-90AS0051: Intel Core Ultra 9 185H, 2.6 kg
Review » 华硕 ROG NUC 游戏迷你 PC 评测:英特尔酷睿 Ultra 9 185H 和 NvidiaGeForce RTX 4070 笔记本电脑的 2.5 升机箱
Asus ProArt P16 H7606WI: AMD Ryzen AI 9 HX 370, 16.00", 1.8 kg
Review » 华硕 ProArt P16 笔记本电脑评测 - AMD Zen 5 与 RTX 4070 笔记本电脑和 4K OLED 的完美结合
Asus ProArt PX13 HN7306: AMD Ryzen AI 9 HX 370, 13.30", 1.4 kg
Review » AMD Zen 5 Strix Point CPU 分析 - Ryzen AI 9 HX 370 与英特尔酷睿 Ultra、Apple M3 和高通骁龙 X Elite 的比较
Review » 华硕 ProArt PX13 评测--搭载 AMD Zen 5 和 RTX 4070 的全球最快 13.3 英寸二合一笔记本电脑
Schenker XMG Pro 16 Studio (Mid 24): Intel Core i9-14900HX, 16.00", 2.3 kg
Review » XMG Pro 16 Studio (Mid 24) 评测:面向游戏玩家和创作者的酷睿 i9 和 RTX 4070
HP Omen 17-db0079ng: AMD Ryzen 7 8845HS, 17.30", 2.8 kg
Review » 惠普预兆 17(2024)评测:RTX 4070 和 Ryzen 7 在游戏笔记本电脑中大显身手
Acer Predator Helios Neo 16 (2024): Intel Core i7-14700HX, 16.00", 2.6 kg
Review » 宏碁掠夺者 Helios Neo 16 (2024) 评测:配备 RTX 4070 和 DCI-P3 面板的游戏笔记本电脑
Schenker XMG Fusion 15 (Early 24): Intel Core i9-14900HX, 15.30", 2.1 kg
Review » XMG Fusion 15(提前 24 天)评测:专为游戏玩家和创作者打造的紧凑型 RTX 4070 笔记本电脑
Lenovo Yoga Pro 9 16IMH9: Intel Core Ultra 9 185H, 16.00", 2.1 kg
Review » 联想 Yoga Pro 9i 16 G9 笔记本电脑评测:配备 1200 尼特和酷睿 9 处理器的 MiniLED 笔记本电脑
Lenovo Legion 7 16 IRX G9: Intel Core i9-14900HX, 16.00", 2.3 kg
Review » 联想Legion 7 16 G9 笔记本电脑评测--配备 3.2K 显示屏、HX CPU 和超频 RTX 4070 的游戏本
Aorus 16X 2024: Intel Core i9-14900HX, 16.00", 2.3 kg
Review » Aorus 16X (2024) 评测:酷睿 i9 和 RTX 4070 售价 2,000 美元
Dell XPS 16 9640: Intel Core Ultra 7 155H, 16.30", 2.3 kg
Review » 戴尔 XPS 16 9640 评测--配备 4K OLED 和恼人触控条的多媒体笔记本电脑
Lenovo Legion Pro 5 16IRX9: Intel Core i9-14900HX, 16.00", 2.5 kg
Review » 联想Legion Pro 5 16IRX9 笔记本电脑评测:性能卓越,但略显笨重
Alienware m16 R2: Intel Core Ultra 7 155H, 16.00", 2.5 kg
Review » Alienware m16 R2 笔记本电脑评测:巨大而冒险的变化
Razer Blade 14 RZ09-0508: AMD Ryzen 9 8945HS, 14.00", 1.9 kg
Review » Razer Blade 14 2024 笔记本电脑评测:搭载 Ryzen AI,面向未来
HP Omen Transcend 16-u1095ng: Intel Core i9-14900HX, 16.00", 2.3 kg
Review » 惠普 Omen Transcend 16 (2024) 笔记本电脑评测:配备 OLED 显示屏的 RTX 4070 游戏机
Asus ROG Zephyrus G14 2024 GA403U: AMD Ryzen 9 8945HS, 14.00", 1.5 kg
Review » 华硕 ROG Zephyrus G14 2024 评测--配备 Ryzen 8000 和 G-Sync OLED 的游戏/多媒体笔记本电脑
Asus ROG Zephyrus G16 2024 GU605M: Intel Core Ultra 7 155H, 16.00", 1.8 kg
Review » 华硕 ROG Zephyrus G16 2024 评测--配备 G-Sync OLED 和英特尔流星湖技术的游戏笔记本电脑
Asus TUF Gaming A17 FA707XI-NS94: AMD Ryzen 9 7940HS, 17.30", 2.5 kg
Review » 华硕 TUF Gaming A17 FA707XI 笔记本电脑评测:140 瓦GeForce RTX 4070 售价 1400 美元
MSI Stealth 16 Mercedes-AMG Motorsport A13VG: Intel Core i9-13900H, 16.00", 1.9 kg
Review » 微星 Stealth 16 Mercedes-AMG Motorsport 笔记本电脑评测:配备 OLED 显示屏的移动赛车
Schenker XMG Pro 16 Studio (Mid 23): Intel Core i9-13900H, 16.00", 2.6 kg
Review » XMG Pro 16 Studio (Mid 23) 评测:专为游戏玩家和创作者打造的 RTX 4070 笔记本电脑
Schenker XMG CORE 16 (L23): AMD Ryzen 7 7840HS, 16.00", 2.4 kg
Review » 申克 XMG 酷睿 16 游戏笔记本评测--联想Legion Pro 5 16 的真正竞争对手
HP Victus 16-r0077ng: Intel Core i7-13700H, 16.10", 2.4 kg
Review » 惠普 Victus 16 笔记本电脑评测:配备 RTX 4070 的全高清游戏本
HP Omen 16-xf0376ng: AMD Ryzen 7 7840HS, 16.10", 2.4 kg
Review » 惠普 Omen 16 笔记本电脑评测:Zen 4 也是游戏玩家的不错选择
Acer Nitro 17 AN17-41-R9LN: AMD Ryzen 7 7735HS, 17.30", 3 kg
Review » 宏碁 Nitro 17 Ryzen 版评测:配备 RTX 4070 的 QHD 游戏笔记本电脑
Aorus 15 BSF: Intel Core i7-13700H, 15.60", 2.4 kg
Review » Aorus 15 BSF 评测:配备 RTX 4070 且运行时间出色的 QHD 游戏笔记本电脑
HP Omen Transcend 16: Intel Core i9-13900HX, 16.00", 2.3 kg
Review » 惠普 Omen Transcend 16 笔记本电脑评测:不仅仅是名称上的细微差别
Schenker VISION 16 Pro (M23): Intel Core i7-13700H, 16.00", 1.6 kg
Review » 申克 Vision 16 Pro 2023 评论: 1.配备 RTX 4070 笔记本电脑的 6 千克轻型强力套装
MSI Pulse 17 B13VGK: Intel Core i7-13700H, 17.30", 2.7 kg
Review » 微星Pulse 17 B13V游戏笔记本评测:拥有安静的翅膀
MSI Stealth 16 Studio A13VG: Intel Core i7-13700H, 16.00", 2 kg
Review » 微星Stealth 16 Studio笔记本电脑回顾:为游戏玩家和创作者提供的极轻、16英寸、Core i7、RTX 4070设备
Lenovo Legion Slim 7i 16 Gen 8: Intel Core i9-13900H, 16.00", 2.1 kg
Review » 联想Legion Slim 7i 16 8代笔记本电脑评论:比Razer Blade 16更薄
Asus ProArt Studiobook 16 OLED H7604: Intel Core i9-13980HX, 16.00", 2.4 kg
Review » 华硕ProArt Studiobook 16 OLED回顾:具有极端CPU性能的多媒体笔记本电脑
Razer Blade 14 RTX 4070: AMD Ryzen 9 7940HS, 14.00", 1.8 kg
Review » Razer Blade 14 Zen 4笔记本电脑回顾:很多重要的变化
Acer Nitro 16 AN16-41: AMD Ryzen 7 7735HS, 16.00", 2.7 kg
Review » 宏碁Nitro 16 AN16-41评论:一个具有良好电池寿命的RTX 4070游戏笔记本
Schenker XMG Focus 17 (E23): Intel Core i9-13900HX, 17.30", 2.9 kg
Review » Schenker XMG Focus 17 (E23) in review:配备RTX 4070的游戏笔记本在性能上毫不逊色
Asus Zenbook Pro 14 OLED UX6404VI: Intel Core i9-13900H, 14.50", 1.7 kg
Review » 华硕Zenbook Pro 14 OLED笔记本电脑回顾:配备120赫兹OLED显示屏的MacBook Pro竞争对手
Dell XPS 17 9730 RTX 4070: Intel Core i7-13700H, 17.00", 2.5 kg
Review » 戴尔XPS 17 9730笔记本电脑回顾: GeForce RTX 4070多媒体怪物
Lenovo Legion Pro 5 16ARX8: AMD Ryzen 7 7745HX, 16.00", 2.5 kg
Review » Ryzen 7 7745HX性能首次亮相:联想Legion Pro 5 16代8笔记本评测
Samsung Galaxy Book3 Ultra 16, i9-13900H RTX 4070: Intel Core i9-13900H, 16.00", 1.8 kg
Review » 三星Galaxy Book3 Ultra 16 with RTX 4070 in review:商务型笔记本中的高图形性能
Medion Erazer Major X20: Intel Core i9-13900HX, 16.00", 2.4 kg
Review » Medion Erazer Major X20回顾:配备RTX 4070和坚实硬件的游戏笔记本
Dell XPS 15 9530 RTX 4070: Intel Core i7-13700H, 15.60", 1.9 kg
Review » 戴尔XPS 15 9530 RTX 4070笔记本电脑评论:既令人印象深刻又令人失望
Asus ROG Flow Z13 ACRNM: Intel Core i9-13900H, 13.40", 1.7 kg
Review » 华硕ROG Flow Z13 ACRNM评测--带RTX 4070的游戏可转换笔记本电脑
Aorus 15X ASF: Intel Core i7-13700HX, 15.60", 2.3 kg
Review » Aorus 15X ASF回顾:具有RTX 4070能力和耐力的游戏笔记本电脑
Asus ROG Strix G17 G713PI: AMD Ryzen 9 7945HX, 17.30", 2.8 kg
Review » AMD Ryzen 9 7945HX分析--Zen4龙系列比英特尔猛禽湖-HX更快、更高效
Uniwill GM6PX7X RTX 4070: Intel Core i7-13700HX, 16.00", 2.2 kg
Review » 酷睿i7-13700HX性能首次亮相:联合利华GM6PX7X IDX笔记本评测
Asus ROG Strix G17 G713PI: AMD Ryzen 9 7945HX, 17.30", 2.8 kg
Review » 华硕ROG Strix G17 G713PI。游戏笔记本在新Ryzen 9的测试中给人留下深刻印象
Gigabyte AERO 16 OLED BSF: Intel Core i9-13900H, 16.00", 2.1 kg
Review » 纤薄的技嘉AERO 16 OLED笔记本电脑回顾。高效的RTX 4070,适合游戏玩家和创作者
Asus ROG Strix G18 G814JI: Intel Core i7-13650HX, 18.00", 3 kg
Review » 华硕ROG Strix G18 G814JI笔记本电脑回顾。18英寸游戏机的光与影
Razer Blade 18 RTX 4070: Intel Core i9-13950HX, 18.00", 3 kg
Review » Razer Blade 18笔记本电脑回顾。比许多17英寸游戏笔记本更小
Schenker XMG Neo 17 2023 Engineering Sample: Intel Core i9-13900HX
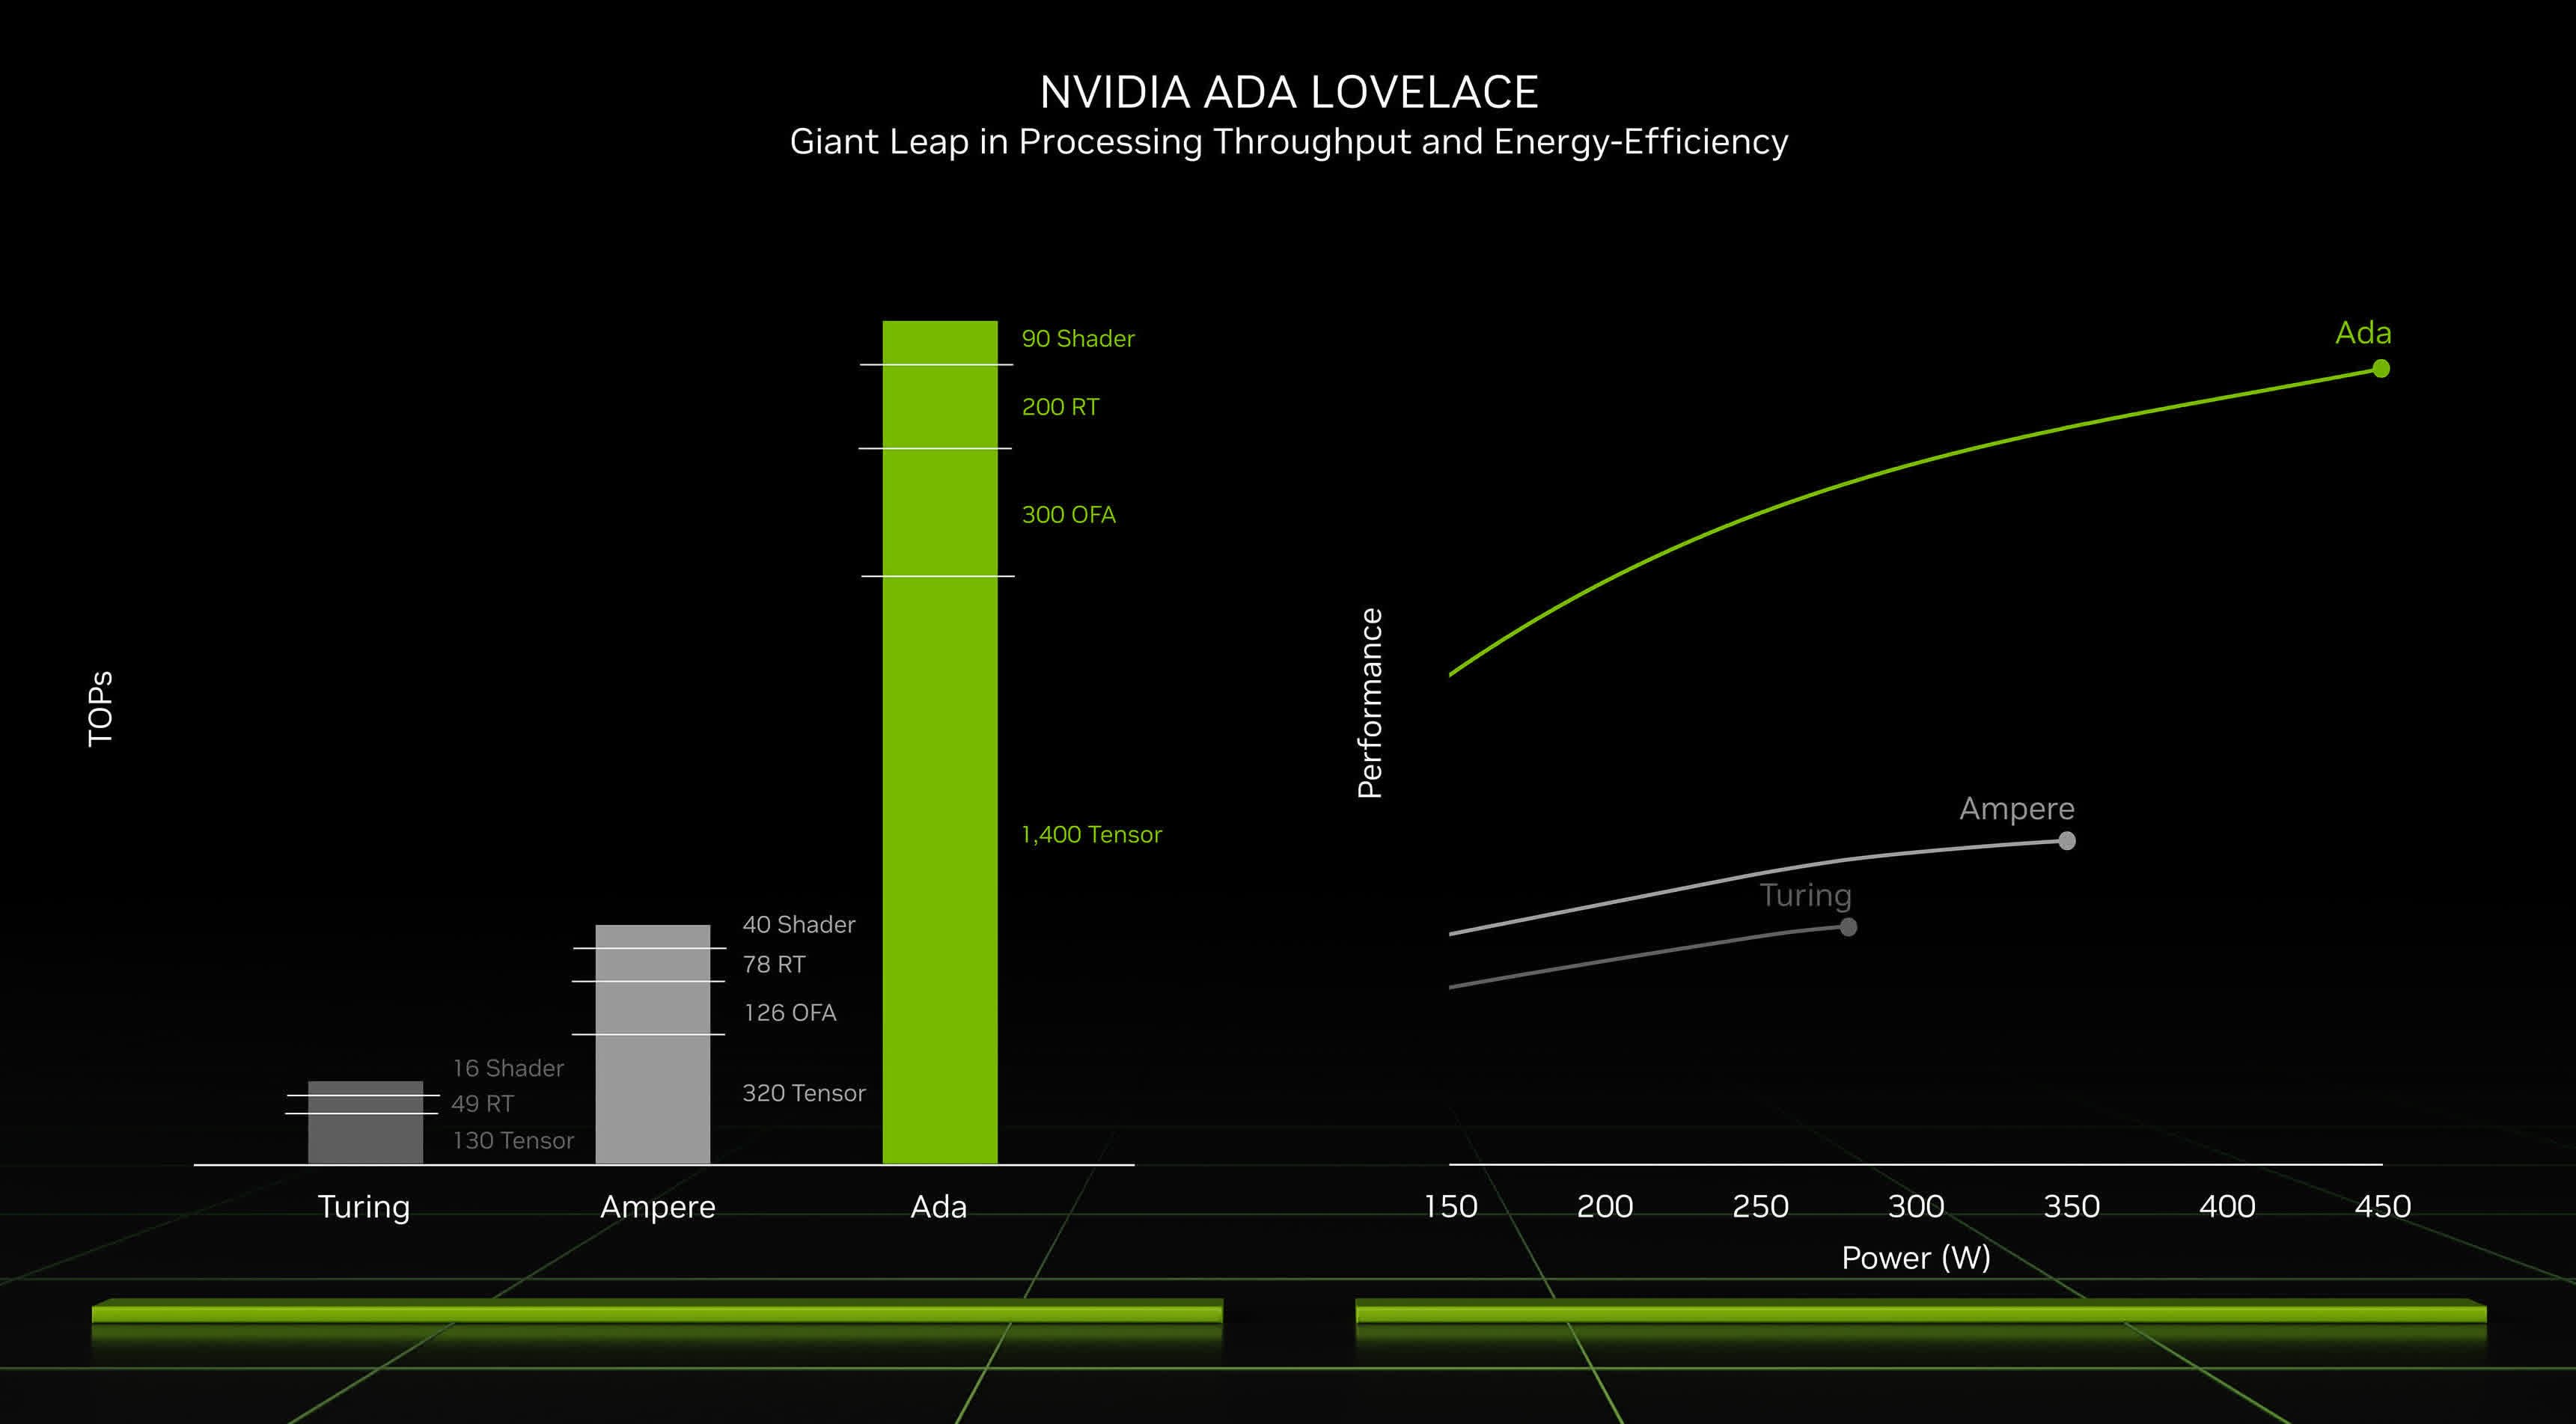
Review » GeForce RTX 4070、4060、4050笔记本电脑分析--Nvidia新的主流笔记本电脑GPU回顾
MSI Creator A16 AI+ A3XVFG: AMD Ryzen AI 9 365, 16.00", 2.1 kg
External Review » MSI Creator A16 AI+ A3XVFG
MSI Katana 15 B13VGK, i7-13700H: Intel Core i7-13700H, 15.60", 2.3 kg
External Review » MSI Katana 15 B13VGK, i7-13700H
HP Victus 16-s1000: AMD Ryzen 7 8845HS, 16.10", 2.3 kg
External Review » HP Victus 16-s1000
Tulpar 6 V3.2.2: Intel Core i7-13700HX, 16.00", 2.3 kg
External Review » Tulpar 6 V3.2.2
MSI Creator A16 AI+ A3HVGG: AMD Ryzen AI 9 365, 16.00", 2.1 kg
External Review » MSI Creator A16 AI+ A3HVGG
Lenovo Legion 5 16IRX9, i7-14700HX: Intel Core i7-14700HX, 6.00", 2.5 kg
External Review » Lenovo Legion 5 16IRX9, i7-14700HX
MSI Prestige 16 AI Studio B1VGG: Intel Core Ultra 9 185H, 16.00", 1.6 kg
External Review » MSI Prestige 16 AI Studio B1VGG
MSI Sword 16 HX B14VGKG, i7-14650HX: Intel Core i7-14650HX, 16.00", 2.3 kg
External Review » MSI Sword 16 HX B14VGKG, i7-14650HX
MSI Pulse 17 AI C1VGKG: Intel Core Ultra 7 155H, 17.00", 2.8 kg
External Review » MSI Pulse 17 AI C1VGKG
MSI Stealth A16 AI+ A3XVGG: AMD Ryzen AI 9 365, 16.00", 2.1 kg
External Review » MSI Stealth A16 AI+ A3XVGG
MSI Stealth 16 AI Studio A1VGG, Ultra 7 155H: Intel Core Ultra 7 155H, 16.00", 2 kg
External Review » MSI Stealth 16 AI Studio A1VGG, Ultra 7 155H
Asus ROG Zephyrus G16 GA605WI: AMD Ryzen AI 9 HX 370, 16.00", 1.9 kg
External Review » Asus ROG Zephyrus G16 GA605WI
Acer Predator Helios Neo 14 (2024): Intel Core Ultra 9 185H, 14.50", 1.9 kg
External Review » Acer Predator Helios Neo 14 (2024)
Asus TUF Gaming F15 FX507VI: Intel Core i7-13620H, 15.60", 2.2 kg
External Review » Asus TUF Gaming F15 FX507VI
HP Omen Transcend 14-fb: Intel Core Ultra 7 155H, 14.00", 1.6 kg
External Review » HP Omen Transcend 14-fb
MSI Stealth 16 AI Studio A1VGG: Intel Core Ultra 9 185H, 16.00", 2 kg
External Review » MSI Stealth 16 AI Studio A1VGG
Asus ProArt P16 H7606WI: AMD Ryzen AI 9 HX 370, 16.00", 1.8 kg
External Review » Asus ProArt P16 H7606WI
MSI Creator M16 HX C14VGG: Intel Core i9-14900HX, 16.00", 2.4 kg
External Review » MSI Creator M16 HX C14VGG
Aorus 16X 9SG: Intel Core i7-13650HX, 16.00", 2.3 kg
External Review » Aorus 16X 9SG
HP Omen 17-db0079ng: AMD Ryzen 7 8845HS, 17.30", 2.8 kg
External Review » HP Omen 17-db0079ng
Lenovo Legion 7 16IRX9, i7-14700HX: Intel Core i7-14700HX, 16.00", 2.2 kg
External Review » Lenovo Legion 7 16IRX9, i7-14700HX
Asus ProArt PX13 HN7306: AMD Ryzen AI 9 HX 370, 13.30", 1.4 kg
External Review » Asus ProArt PX13 HN7306
Maingear ML-16 MK2: Intel Core Ultra 7 155H, 16.00", 2.1 kg
External Review » Maingear ML-16 MK2
Schenker XMG Fusion 15 (Early 24): Intel Core i9-14900HX, 15.30", 2.1 kg
External Review » SCHENKER XMG Fusion 15 (Early 24)
Acer Nitro 16 AN16-42: AMD Ryzen 7 8845HS, 16.00", 2.7 kg
External Review » Acer Nitro 16 AN16-42
HP Omen 16-wf0000: Intel Core i7-13650HX, 16.10", 2.4 kg
External Review » HP Omen 16-wf0000
Acer Predator Triton Neo 16 PTN16-51, RTX 4070: Intel Core Ultra 9 185H, 16.00", 2.1 kg
External Review » Acer Predator Triton Neo 16 PTN16-51, RTX 4070
Medion Erazer Beast X40 2024, RTX 4070: Intel Core i9-14900HX, 17.00", 2.9 kg
External Review » Medion Erazer Beast X40 2024, RTX 4070
Acer Swift X OLED SFX14-72G, RTX 4070: Intel Core Ultra 7 155H, 14.50", 1.6 kg
External Review » Acer Swift X OLED SFX14-72G, RTX 4070
MSI Katana A17 AI B8VG: AMD Ryzen 9 8945HS, 17.30", 2.7 kg
External Review » MSI Katana A17 AI B8VG
Medion Erazer Deputy P60: Intel Core i7-12650H, 15.60", 2.1 kg
External Review » Medion Erazer Deputy P60
Acer Nitro 17 AN17-41-R3S4: AMD Ryzen 9 7940HS, 17.30", 3.1 kg
External Review » Acer Nitro 17 AN17-41-R3S4
Asus ROG Strix G16 G614JZR: Intel Core i9-14900HX, 16.00", 2.8 kg
External Review » Asus ROG Strix G16 G614JZR
HP Victus 16-r1000: Intel Core i7-14700HX, 16.10", 2.3 kg
External Review » HP Victus 16-r1000
MSI Katana A15 AI B8VG: AMD Ryzen 9 8945HS, 15.60", 2.3 kg
External Review » MSI Katana A15 AI B8VG
Asus ROG Strix G18 G814JIR: Intel Core i9-14900HX, 18.00", 3 kg
External Review » Asus ROG Strix G18 G814JIR
Asus TUF Gaming A16 FA608: AMD Ryzen AI 9 HX 370, 16.00", 2.2 kg
External Review » Asus TUF Gaming A16 FA608
Asus ROG Strix G16 G614JIR: Intel Core i9-14900HX, 16.00", 2.8 kg
External Review » Asus ROG Strix G16 G614JIR
MSI Pulse 16 AI C1VGKG: Intel Core Ultra 9 185H, 16.00", 2.5 kg
External Review » MSI Pulse 16 AI C1VGKG
Acer Predator Helios Neo 14 PHN14-51: Intel Core Ultra 7 155H, 14.50", 1.9 kg
External Review » Acer Predator Helios Neo 14 PHN14-51
MSI Stealth 14 AI Studio A1VGG: Intel Core Ultra 9 185H, 14.00", 1.7 kg
External Review » MSI Stealth 14 AI Studio A1VGG
MSI Sword 16 HX B14VGKG: Intel Core i7-14700HX, 16.00", 2.3 kg
External Review » MSI Sword 16 HX B14VGKG
MSI Sword 17 HX B14VGKG: Intel Core i7-14700HX, 17.00", 2.6 kg
External Review » MSI Sword 17 HX B14VGKG
Lenovo Legion 7 16IRX9, i9-14900HX: Intel Core i9-14900HX, 16.00", 2.2 kg
External Review » Lenovo Legion 7 16IRX9, i9-14900HX
Acer Nitro 16 AN16-41-R6KQ: AMD Ryzen 7 7840HS, 16.00", 2.7 kg
External Review » Acer Nitro 16 AN16-41-R6KQ
Samsung Galaxy Book4 Ultra, RTX 4070: Intel Core Ultra 9 185H, 16.00", 1.9 kg
External Review » Samsung Galaxy Book4 Ultra, RTX 4070
Lenovo Legion Slim 5 16AHP9: AMD Ryzen 7 8845HS, 16.00", 2.3 kg
External Review » Lenovo Legion Slim 5 16AHP9
Lenovo Legion 5 16IRX9, i7-14650HX: Intel Core i7-14650HX, 16.00", 2.3 kg
External Review » Lenovo Legion 5 16IRX9, i7-14650HX
Asus ROG Zephyrus G16 GU605MI, Ultra 9 185H: Intel Core Ultra 9 185H, 16.00", 1.8 kg
External Review » Asus ROG Zephyrus G16 GU605MI, Ultra 9 185H
Asus TUF Gaming A16 FA607PI: AMD Ryzen 9 7845HX, 16.00", 2.3 kg
External Review » Asus TUF Gaming A16 FA607PI
Dell XPS 16 9640, Ultra 7 165H RTX 4070: Intel Core Ultra 7 165H, 16.30", 2.1 kg
External Review » Dell XPS 16 9640, Ultra 7 165H RTX 4070
HP Omen 16-xf0079ng: AMD Ryzen 7 7840HS, 16.10", 2.4 kg
External Review » HP Omen 16-xf0079ng
HP Omen Transcend 16-u1095ng: Intel Core i9-14900HX, 16.00", 2.3 kg
External Review » HP Omen Transcend 16-u1095ng
MSI Vector 17 HX A14VGG: Intel Core i9-14900HX, 17.30", 3 kg
External Review » MSI Vector 17 HX A14VGG
Lenovo Legion Pro 5 16IRX9, i7-14700HX: Intel Core i7-14700HX, 16.00", 2.5 kg
External Review » Lenovo Legion Pro 5 16IRX9, i7-14700HX
Lenovo Legion Slim 7 16IRH8, i9-13900H RTX 4070: Intel Core i9-13900H, 16.00", 2 kg
External Review » Lenovo Legion Slim 7 16IRH8, i9-13900H RTX 4070
Lenovo Yoga Pro 9 16IMH9: Intel Core Ultra 9 185H, 16.00", 2.1 kg
External Review » Lenovo Yoga Pro 9 16IMH9
Lenovo Legion 7 16IRX9: Intel Core i7-14650HX, 16.00", 2.3 kg
External Review » Lenovo Legion 7 16IRX9
Lenovo ThinkPad P1 G6, i7-13800H RTX 4070: Intel Core i7-13800H, 16.00", 1.8 kg
External Review » Lenovo ThinkPad P1 G6, i7-13800H RTX 4070
Acer Nitro 16 AN16-41, R9 7940HS: AMD Ryzen 9 7940HS, 16.00", 2.7 kg
External Review » Acer Nitro 16 AN16-41, R9 7940HS
HP Omen Transcend 14-fb0000ng: Intel Core Ultra 9 185H, 14.00", 1.6 kg
External Review » HP Omen Transcend 14-fb0000ng
Aorus 16X 2024: Intel Core i9-14900HX, 16.00", 2.3 kg
External Review » Aorus 16X 2024
Lenovo Legion Pro 5 16IRX9: Intel Core i9-14900HX, 16.00", 2.5 kg
External Review » Lenovo Legion Pro 5 16IRX9
Razer Blade 14 RZ09-0508: AMD Ryzen 9 8945HS, 14.00", 1.9 kg
External Review » Razer Blade 14 RZ09-0508
Acer Predator Helios Neo 18 PHN18-71: Intel Core i9-14900HX, 18.00", 3.4 kg
External Review » Acer Predator Helios Neo 18 PHN18-71
Acer Predator Helios Neo 16 (2024): Intel Core i7-14700HX, 16.00", 2.6 kg
External Review » Acer Predator Helios Neo 16 PHN16-72
Alienware m16 R2: Intel Core Ultra 7 155H, 16.00", 2.5 kg
External Review » Alienware m16 R2
Asus ROG Zephyrus G16 2024 GU605M: Intel Core Ultra 7 155H, 16.00", 1.8 kg
External Review » Asus ROG Zephyrus G16 2024 GU605M
Asus ROG Zephyrus G14 2024 GA403U: AMD Ryzen 9 8945HS, 14.00", 1.5 kg
External Review » Asus ROG Zephyrus G14 2024 GA403U
Acer Predator Helios Neo 16 PHN16-71, i5-13700HX RTX 4070: Intel Core i7-13700HX, 16.00", 2.6 kg
External Review » Acer Predator Helios Neo 16 PHN16-71, i5-13700HX RTX 4070
Dell XPS 16 9640: Intel Core Ultra 7 155H, 16.30", 2.3 kg
External Review » Dell XPS 16 9640
Aorus 16X ASG: Intel Core i7-14650HX, 16.00", 2.3 kg
External Review » Aorus 16X ASG
MSI Alpha 17 C7VG: AMD Ryzen 9 7945HX, 17.30", 2.8 kg
External Review » MSI Alpha 17 C7VG
Dell XPS 17 9730, i9-13900H: Intel Core i9-13900H, 17.00", 2.4 kg
External Review » Dell XPS 17 9730, i9-13900H
Dell G16 7630, i9-13900HX RTX 4070: Intel Core i9-13900HX, 16.00", 2.9 kg
External Review » Dell G16 7630, i9-13900HX RTX 4070
Acer Nitro 17 AN17-41: AMD Ryzen 7 7840HS, 17.30", 3 kg
External Review » Acer Nitro 17 AN17-41
HP Omen 16-xf0000ng: AMD Ryzen 9 7940HS, 16.10", 2.4 kg
External Review » HP Omen 16-xf0000ng
Schenker XMG CORE 16 (L23): AMD Ryzen 7 7840HS, 16.00", 2.4 kg
External Review » SCHENKER XMG CORE 16 (L23)
Asus ROG Zephyrus G14 GA402XI: AMD Ryzen 9 7940HS, 14.00", 1.7 kg
External Review » Asus ROG Zephyrus G14 GA402XI
MSI Creator Z17 HX Studio A13VGT, i7-13700HX: Intel Core i7-13700HX, 17.00", 2.5 kg
External Review » MSI Creator Z17 HX Studio A13VGT, i7-13700HX
Acer Predator Helios 16 PH16-71-97H2: Intel Core i9-13900HX, 16.00", 2.7 kg
External Review » Acer Predator Helios 16 PH16-71-97H2
HP Victus 16-s0000: AMD Ryzen 7 7840HS, 16.10", 2.3 kg
External Review » HP Victus 16-s0000
Schenker VISION 16 Pro (M23): Intel Core i7-13700H, 16.00", 1.6 kg
External Review » SCHENKER VISION 16 Pro (M23)
Lenovo Yoga Pro 9i RTX4070: Intel Core i9-13905H, 16.00"
External Review » Lenovo Yoga Pro 9i RTX4070
HP Victus 16-r0077ng: Intel Core i7-13700H, 16.10", 2.4 kg
External Review » HP Victus 16-r0077ng
Asus TUF Gaming A15 FA507XI: AMD Ryzen 9 7940HS, 15.60", 2.2 kg
External Review » Asus TUF Gaming A15 FA507XI
Lenovo Legion Pro 5 16IRX8, i7-13700HX RTX 4070: Intel Core i7-13700HX, 16.00", 2.6 kg
External Review » Lenovo Legion Pro 5 16IRX8, i7-13700HX RTX 4070
Acer Predator Helios 16 PH16-71-76FS: Intel Core i7-13700HX, 16.00", 2.7 kg
External Review » Acer Predator Helios 16 PH16-71-76FS
Lenovo Yoga Pro 9 16IRP8, RTX 4070: Intel Core i9-13905H, 16.00", 2.2 kg
External Review » Lenovo Yoga Pro 9 16IRP8, RTX 4070
MSI Katana 17 B13VGK: Intel Core i7-13620H, 17.30", 2.6 kg
External Review » MSI Katana 17 B13VGK
Acer Predator Helios 16 PH16-71-74AS: Intel Core i7-13700HX, 16.00", 2.6 kg
External Review » Acer Predator Helios 16 PH16-71-74AS
Lenovo Legion 5 Pro 16ARX8: AMD Ryzen 7 7745HX, 16.00", 2.5 kg
External Review » Lenovo Legion 5 Pro 16ARX8
HP Omen Transcend 16-u0027TX: Intel Core i7-13700HX, 16.00", 2.2 kg
External Review » HP Omen Transcend 16-u0027TX
Acer Predator Triton 14 PT14-51, i7-13700H RTX 4070: Intel Core i7-13700H, 14.00", 1.7 kg
External Review » Acer Predator Triton 14 PT14-51, i7-13700H RTX 4070
HP Omen Transcend 16-u0000: Intel Core i9-13900HX, 16.00", 2.2 kg
External Review » HP Omen Transcend 16-u0000
Lenovo Legion Pro 7 16IRX8, i7-13700HX RTX 4070: Intel Core i7-13700HX, 16.00", 2.8 kg
External Review » Lenovo Legion Pro 7 16IRX8, i7-13700HX RTX 4070
Acer Nitro 16 AN16-41: AMD Ryzen 7 7735HS, 16.00", 2.7 kg
External Review » Acer Nitro 16 AN16-41
Asus TUF Gaming A17 FA707XI: AMD Ryzen 9 7940HS, 17.30", 2.6 kg
External Review » Asus TUF Gaming A17 FA707XI
Alienware m16 R1 AMD, RTX 4070: AMD Ryzen 9 7845HX, 16.00", 3.1 kg
External Review » Alienware m16 R1 AMD, RTX 4070
Acer Nitro 16 AN16-41-R8UR: AMD Ryzen 7 7735HS, 16.00", 2.7 kg
External Review » Acer Nitro 16 AN16-41-R8UR
HP Victus 16-r0000ns: Intel Core i7-13700H, 16.10", 2.3 kg
External Review » HP Victus 16-r0000ns
Asus ROG Flow X13 GV302XI: AMD Ryzen 9 7940HS, 13.40", 1.3 kg
External Review » Asus ROG Flow X13 GV302XI
Asus ProArt StudioBook 16 OLED H7604JI: Intel Core i9-13980HX, 16.00", 2.4 kg
External Review » Asus ProArt StudioBook 16 OLED H7604JI
Asus VivoBook Pro 16 OLED K6604JI: Intel Core i9-13980HX, 16.00", 2 kg
External Review » Asus VivoBook Pro 16 OLED K6604JI
Origin PC EON14-S 2023: Intel Core i9-13900H, 14.00", 1.8 kg
External Review » Origin PC EON14-S 2023
MSI Katana 15 B12VGK: Intel Core i7-12650H, 15.60", 2.3 kg
External Review » MSI Katana 15 B12VGK
HP Omen Transcend 16: Intel Core i9-13900HX, 16.00", 2.3 kg
External Review » HP Omen Transcend 16
Lenovo Legion Slim 7i 16 Gen 8: Intel Core i9-13900H, 16.00", 2.1 kg
External Review » Lenovo Legion Slim 7i 16 Gen 8
HP Omen Transcend 16-u0095ng: Intel Core i9-13900HX, 16.00", 2.2 kg
External Review » HP Omen Transcend 16-u0095ng
MSI Crosshair 15 C12VG: Intel Core i7-12650H, 15.60", 2.3 kg
External Review » MSI Crosshair 15 C12VG
Hyperbook SL606, i9-13900H RTX 4070: Intel Core i9-13900H, 16.00", 2.7 kg
External Review » Hyperbook SL606, i9-13900H RTX 4070
MSI Alpha 17 C7VF: AMD Ryzen 9 7945HX, 17.30", 2.8 kg
External Review » MSI Alpha 17 C7VF
Lenovo Legion Pro 5 16ARX8: AMD Ryzen 7 7745HX, 16.00", 2.5 kg
External Review » Lenovo Legion Pro 5 16ARX8
MSI Creator Z17 HX Studio A13VGT: Intel Core i9-13950HX, 17.00", 2.5 kg
External Review » MSI Creator Z17 HX Studio A13VGT
Origin PC EVO16-S 2023: Intel Core i9-13900H, 16.10", 2.5 kg
External Review » Origin PC EVO16-S 2023
Acer Nitro 17 AN17-41-R9LN: AMD Ryzen 7 7735HS, 17.30", 3 kg
External Review » Acer Nitro 17 AN17-41-R9LN
Razer Blade 14 RTX 4070: AMD Ryzen 9 7940HS, 14.00", 1.8 kg
External Review » Razer Blade 14 RTX 4070
MSI Stealth 14 Studio A13VG, i7-13620H: Intel Core i7-13620H, 14.00", 1.7 kg
External Review » MSI Stealth 14 Studio A13VG, i7-13620H
Dell XPS 17 9730 RTX 4070: Intel Core i7-13700H, 17.00", 2.5 kg
External Review » Dell XPS 17 9730 RTX 4070
Asus ProArt Studiobook 16 OLED H7604: Intel Core i9-13980HX, 16.00", 2.4 kg
External Review » Asus ProArt Studiobook 16 OLED H7604
Lenovo Legion Pro 5 16IRX8, i9-13900HX RTX 4070: Intel Core i9-13900HX, 16.00", 2.6 kg
External Review » Lenovo Legion Pro 5 16IRX8, i9-13900HX RTX 4070
Asus ROG Zephyrus M16 GU604VI: Intel Core i9-13900H, 16.00", 2.3 kg
External Review » Asus ROG Zephyrus M16 GU604VI
Lenovo Legion Pro 7 16IRX8H, i9-13900HX RTX 4070: Intel Core i9-13900HX, 16.00", 2.5 kg
External Review » Lenovo Legion Pro 7 16IRX8H, i9-13900HX RTX 4070
Asus Zenbook Pro 14 OLED UX6404VI: Intel Core i9-13900H, 14.50", 1.7 kg
External Review » Asus Zenbook Pro 14 OLED UX6404VI
Lenovo Yoga Pro 9i 14 2023: Intel Core i9-13905H, 14.50", 1.7 kg
External Review » Lenovo Yoga Pro 9i 14 2023
Razer Blade 16 Early 2023 RTX 4070: Intel Core i9-13950HX, 16.00", 2.5 kg
External Review » Razer Blade 16 Early 2023 RTX 4070
MSI Stealth 14 Studio A13VG: Intel Core i7-13700H, 14.00", 1.7 kg
External Review » MSI Stealth 14 Studio A13VG
Acer Predator Helios 16 PH16-71: Intel Core i9-13900HX, 16.00", 2.7 kg
External Review » Acer Predator Helios 16 PH16-71
Acer Predator Helios 16 PH16-71-96HK: Intel Core i9-13900HK, 16.00", 2.7 kg
External Review » Acer Predator Helios 16 PH16-71-96HK
Dell XPS 15 9530 RTX 4070: Intel Core i7-13700H, 15.60", 1.9 kg
External Review » Dell XPS 15 9530 RTX 4070
Asus ROG Strix G17 G713PI: AMD Ryzen 9 7945HX, 17.30", 2.8 kg
External Review » Asus ROG Strix G17 G713PI
Asus ROG Strix G18 G814JI, i9-13980HX: Intel Core i9-13980HX, 18.00", 3 kg
External Review » Asus ROG Strix G18 G814JI, i9-13980HX
Gigabyte Aorus 15 BSF: Intel Core i7-13700H, 15.60", 2.3 kg
External Review » Gigabyte Aorus 15 BSF
MSI Raider GE68 HX 13VG: Intel Core i9-13950HX, 15.60", 2.7 kg
External Review » MSI Raider GE68 HX 13VG
MSI Raider GE68 HX 13VG, i7-13700HX: Intel Core i7-13700HX, 16.00", 2.7 kg
External Review » MSI Raider GE68 HX 13VG, i7-13700HX
Medion Erazer Major X20: Intel Core i9-13900HX, 16.00", 2.4 kg
External Review » Medion Erazer Major X20
MSI Stealth 16 Studio A13VG: Intel Core i7-13700H, 16.00", 2 kg
External Review » MSI Stealth 16 Studio A13VG
Asus ROG Strix G16 G614JI: Intel Core i9-13980HX, 16.00", 2.5 kg
External Review » Asus ROG Strix G16 G614JI
Asus ROG Flow X16 GV601VI: Intel Core i9-13900H, 16.00", 2.2 kg
External Review » Asus ROG Flow X16 GV601VI
MSI Pulse 15 B13VGK: Intel Core i7-13700H, 17.30", 2.7 kg
External Review » MSI Pulse 15 B13VGK
Gigabyte AERO 16 OLED BSF: Intel Core i9-13900H, 16.00", 2.1 kg
External Review » Gigabyte AERO 16 OLED BSF
Asus ROG Flow Z13 ACRNM: Intel Core i9-13900H, 13.40", 1.7 kg
External Review » Asus ROG Flow Z13 ACRNM
MSI Katana 15 B13VGK: Intel Core i7-13620H, 15.60", 2.3 kg
External Review » MSI Katana 15 2023 B13VGK
MSI Vector GP77 13VG: Intel Core i7-13700H, 17.30", 2.8 kg
External Review » MSI Vector GP77 13VG
MSI Pulse 17 B13VGK: Intel Core i7-13700H, 17.30", 2.7 kg
External Review » MSI Pulse 17 B13VGK
Asus ROG Strix G18 G814JI: Intel Core i7-13650HX, 18.00", 3 kg
External Review » Asus ROG Strix G18 G814JI
Aorus 15X ASF: Intel Core i7-13700HX, 15.60", 2.3 kg
External Review » Aorus 15X ASF
Razer Blade 18 RTX 4070: Intel Core i9-13950HX, 18.00", 3 kg
External Review » Razer Blade 18 RTX 4070
Samsung Galaxy Book3 Ultra 16, i9-13900H RTX 4070: Intel Core i9-13900H, 16.00", 1.8 kg
External Review » Samsung Galaxy Book3 Ultra 16, i9-13900H RTX 4070
Lenovo Yoga Pro 9 16IMH9: Intel Core Ultra 9 185H, 16.00", 2.1 kg
» 联想 Yoga Pro 9 配备 Nvidia RTX 5060、2.8 K、120 Hz OLED 显示屏,价格令人瞠目
Asus ROG Zephyrus G14 2024 GA403U: AMD Ryzen 9 8945HS, 14.00", 1.5 kg
» 2025 华硕 ROG Zephyrus G14 发布,最高配备 RTX 5080 笔记本 GPU、ROG Nebula OLED 显示屏和更薄的机身结构
Asus ProArt PX13 HN7306: AMD Ryzen AI 9 HX 370, 13.30", 1.4 kg
» Strix Point APU 掌上电脑性能模拟:Ryzen AI 9 HX 370 在游戏中大放异彩,即使测试功耗仅为 17 W
Asus ROG Zephyrus G14 2024 GA403U: AMD Ryzen 9 8945HS, 14.00", 1.5 kg
» 华硕 ROG Zephyrus G14 和 G16 上市,配备 OLED 显示屏,起价 1,899 欧元
Asus ROG Zephyrus G16 2024 GU605M: Intel Core Ultra 7 155H, 16.00", 1.8 kg
» 华硕 ROG Zephyrus G14 和 G16 上市,配备 OLED 显示屏,起价 1,899 欧元
HP Omen Transcend 16: Intel Core i9-13900HX, 16.00", 2.3 kg
» 惠普 "奥门 "创见 16 是该系列的三进一退之作
Lenovo Legion Slim 7i 16 Gen 8: Intel Core i9-13900H, 16.00", 2.1 kg
» 联想Legion Slim第8代上的小细节解决了Alienware x16 r1上的一个恼人的问题