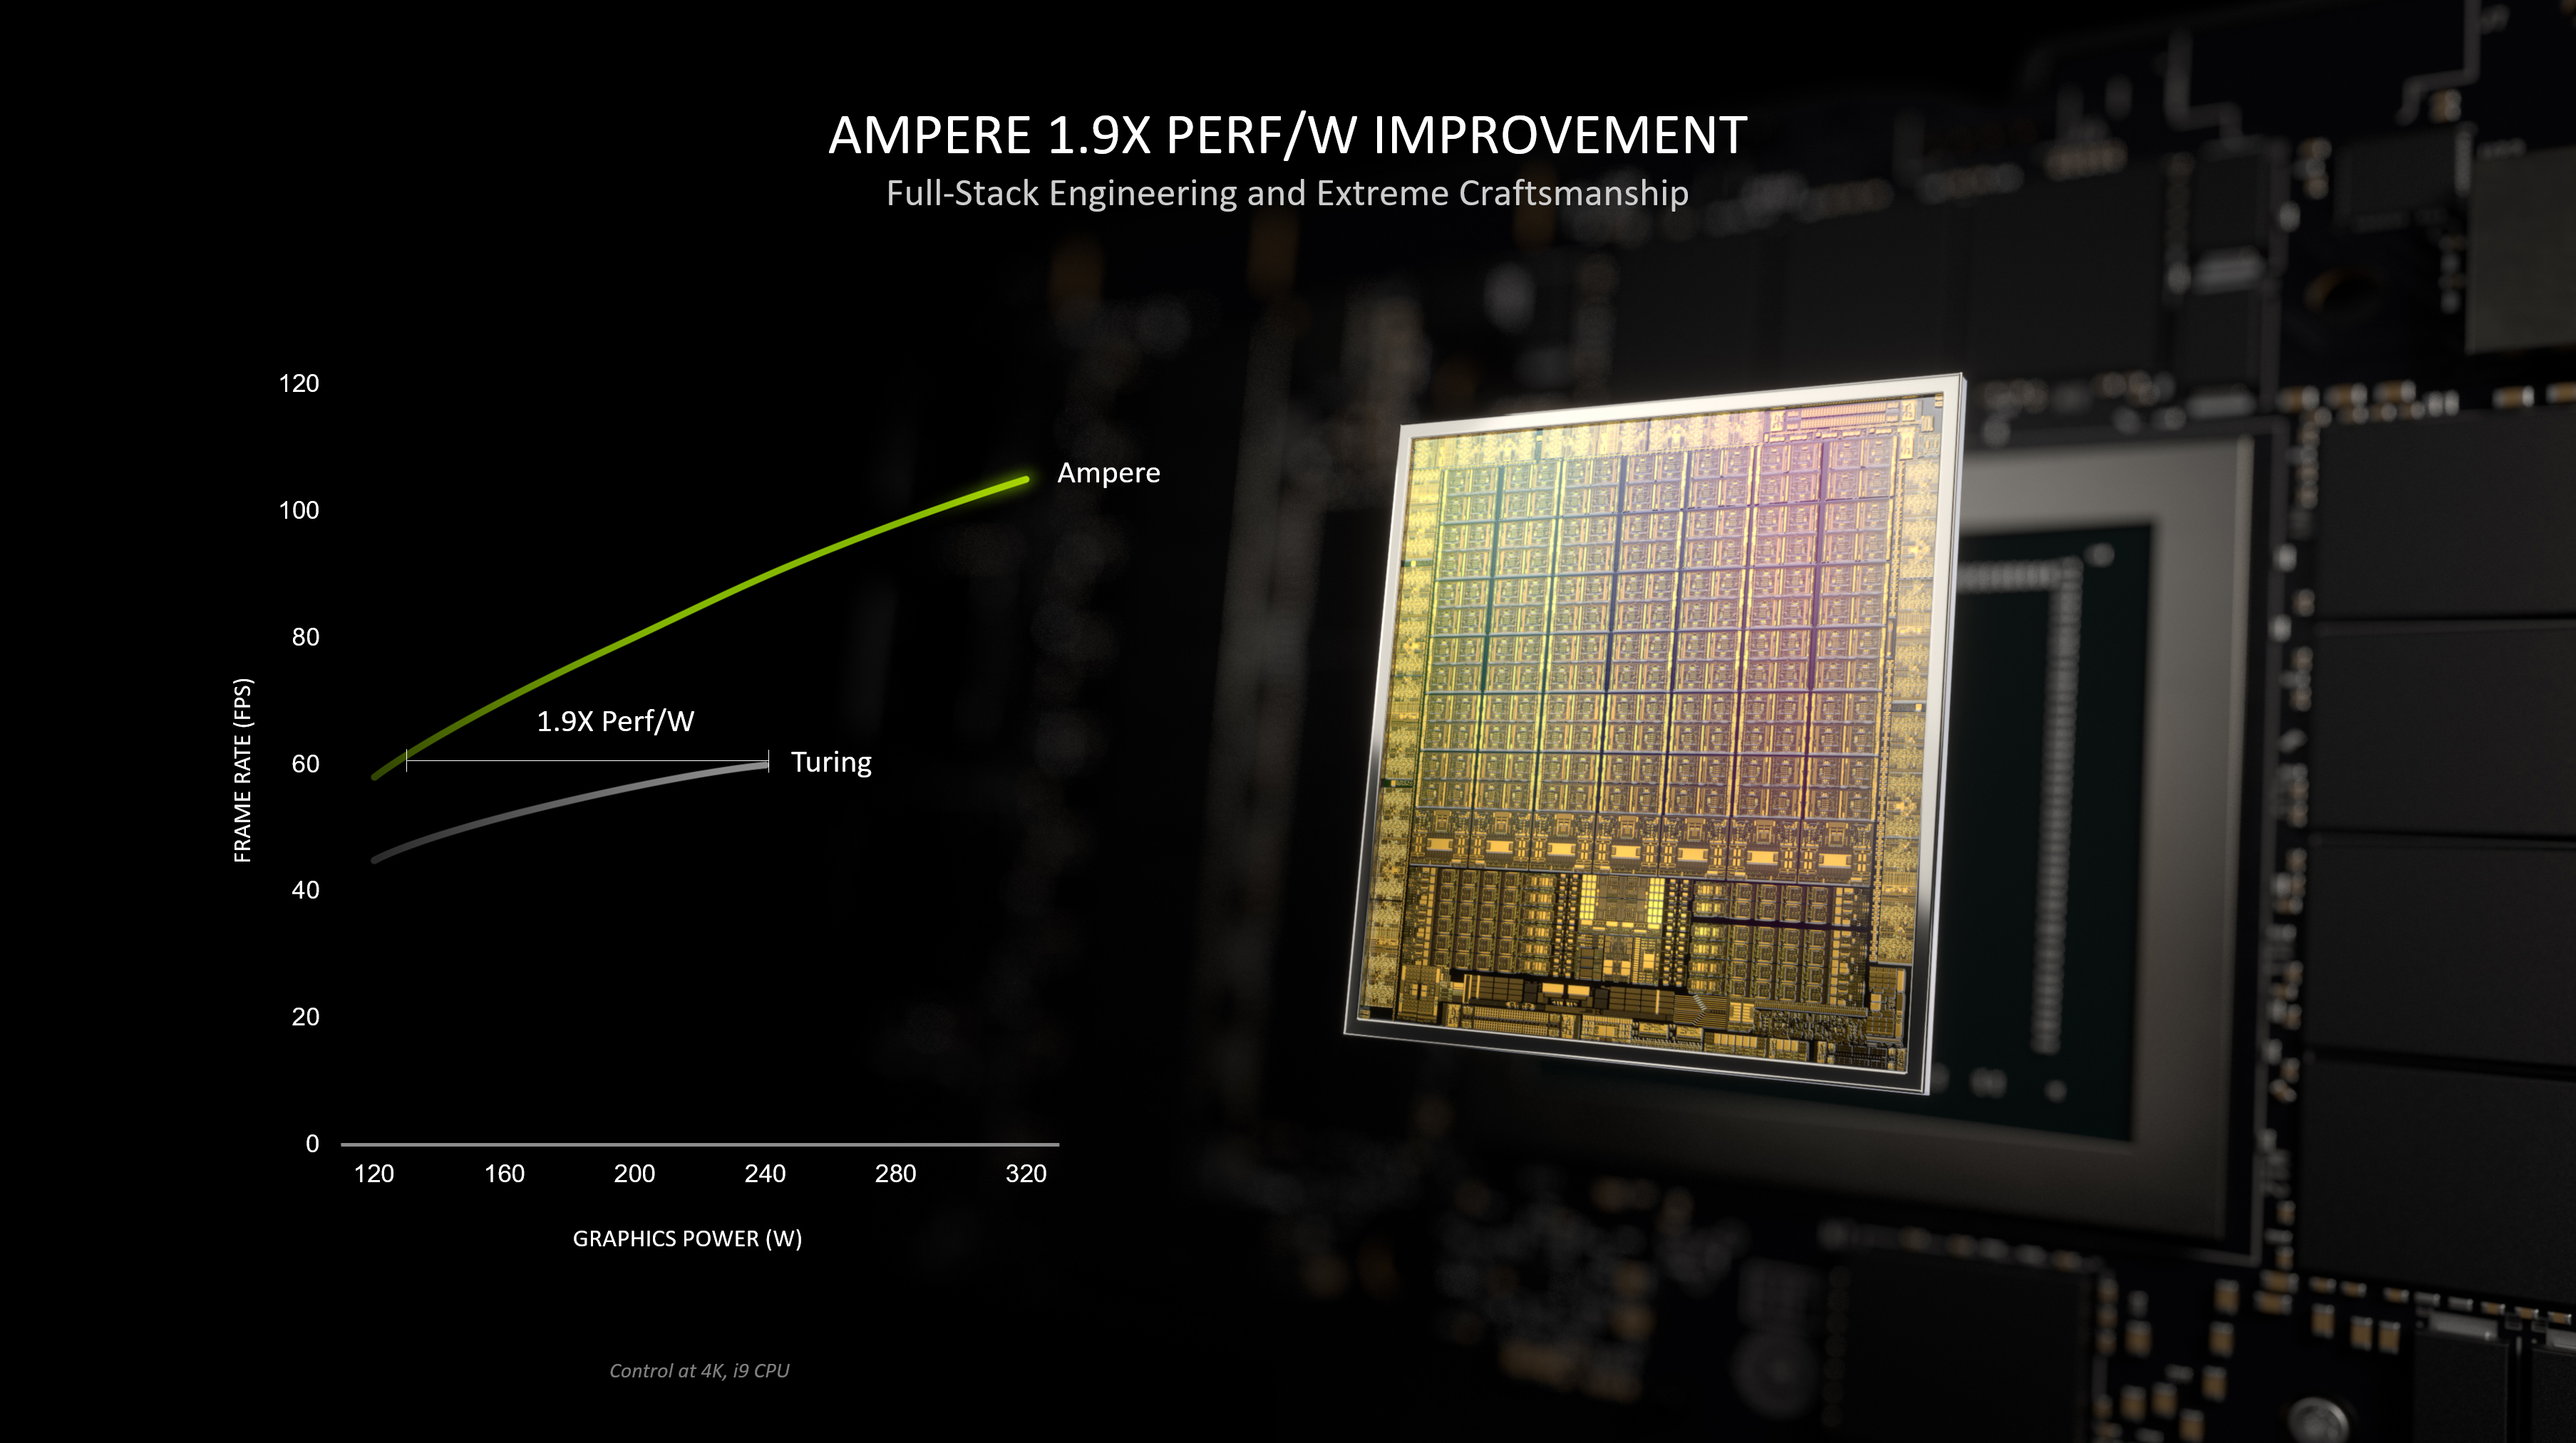
Notebookcheck Logo

NVIDIA GeForce RTX 3080 Laptop GPU

NVIDIA GeForce RTX 3080 Laptop GPU

Nvidia GeForce RTX 3080笔记本电脑GPU或3080移动(适用于笔记本电脑,GN20-E7)是2021年初笔记本电脑的最快的显卡。 基于GA104-775-A1安培芯片,提供8GB或16GB GDDR6图形内存和256位内存总线。 支持PCIe 4.0。80~150瓦特(TGP)(80、90、115、125、135、145和150瓦特)的多种型号。 作为封装,笔记本电脑的显卡使用GB5-256,芯片大小为40x40mm。 GPU 支持 eDP 1.4b 连接内部监视器。

Max-Q 变体(以前用于低功耗变体),但所有 OEM 都可以选择实施 Max-Q 技术(动态 Boost、Whisper 模式)。

性能取决于笔记本电脑的TGP设置和冷却。 在同一 TGP 级别上,RTX 3080 必须比传统顶级机型 RTX 2080 Super Mobile 更快,与台式机 RTX 3070 类似。 也就是说,GPU非常适合帧率高的4K游戏或QHD。 类似的RTX 3080台式机卡速度非常快。

GA104芯片提供6,144个FP32ALU,其中一半可以执行INT32指令(3,072个INT32ALU)。 如果使用 Turing,则所有着色器都可以执行 FP32 或 INT32 指令。 Nvidia还改善了芯片上的光线跟踪和张量核。 安培芯片还包括改进的第 5代视频编码器 (H.264和 H.265的 NVENC)和第 7代解码器 (包括 AV1的各种格式 )。

GA104芯片由Samsung以8nm(8N)制造,与TSMC的7nm节点(AMD、专业GA100安培芯片等)相比,性能差很多。

GeForce RTX 3000 Series

NVIDIA GeForce RTX 3090 Ti 10752 @ 1.56 - 1.86 GHz384 Bit @ 21000 MHz
NVIDIA GeForce RTX 3090 10496 @ 1.4 - 1.7 GHz384 Bit @ 19500 MHz
NVIDIA GeForce RTX 3080 Ti 10240 @ 1.37 - 1.67 GHz384 Bit @ 19000 MHz
NVIDIA GeForce RTX 3080 12 GB 8960/ cores @ 1.26 - 1.71 GHz384 Bit @ 19000 MHz
NVIDIA GeForce RTX 3080 8704 @ 1.45 - 1.71 GHz320 Bit @ 19000 MHz
GeForce RTX 3070 Ti 6144 @ 1.58 - 1.77 GHz256 Bit @ 19000 MHz
GeForce RTX 3080 Ti Laptop GPU 7424 @ 0.98 - 1.59 GHz256 Bit @ 14000 MHz
NVIDIA GeForce RTX 3070 5888 @ 1.5 - 1.73 GHz256 Bit @ 14000 MHz
GeForce RTX 3080 Laptop GPU 6144 @ 0.78 - 1.25 GHz256 Bit @ 14000 MHz
NVIDIA GeForce RTX 3060 Ti 4864 @ 1.41 - 1.67 GHz256 Bit @ 14000 MHz
GeForce RTX 3070 Ti Laptop GPU 5888 @ 0.92 - 1.48 GHz256 Bit @ 14000 MHz
GeForce RTX 3070 Laptop GPU 5120 @ 0.78 - 1.29 GHz256 Bit @ 14000 MHz
NVIDIA GeForce RTX 3060 3584 @ 1.32 - 1.78 GHz192 Bit @ 15000 MHz
GeForce RTX 3080 Max-Q 6144 @ 0.78 - 1.25 GHz256 Bit @ 6000 MHz
GeForce RTX 3070 Max-Q 5120 @ 1.29 GHz256 Bit
GeForce RTX 3060 Laptop GPU 3840 @ 0.82 - 1.7 GHz192 Bit @ 14000 MHz
GeForce RTX 3060 Max-Q 3840 @ 1.28 GHz192 Bit
NVIDIA GeForce RTX 3050 2560 @ 1.55 - 1.78 GHz128 Bit Bit @ 1750 MHz
GeForce RTX 3050 Ti Laptop GPU 2560 @ 1.22 - 1.49 GHz128 Bit @ 12000 MHz
GeForce RTX 3050 6GB Laptop GPU 2560 @ 1.24 - 1.49 GHz96 Bit @ 12000 MHz
GeForce RTX 3050 A Laptop GPU 1792 64 Bit
GeForce RTX 3050 4GB Laptop GPU 2048 @ 1.24 - 1.5 GHz128 Bit @ 12000 MHz
CodenameGN20-E7 GA104
ArchitectureAmpere
Pipelines6144 - unified
TMUs192
ROPs96
Raytracing Cores48
Core Speed780 - 1100 - 1245 - 1710 (Boost) MHz
Memory Speed14000 effective = 1750 MHz
Memory Bus Width256 Bit
Memory TypeGDDR6
Max. Amount of Memory16 GB
Shared Memoryno
Memory Bandwidth448 GB/s
APIDirectX 12_2, Shader 6.7, OpenGL 4.6
Power Consumption150 Watt (80 - 150 Watt TGP)
Transistor Count17.4 Billion
Die Size 392 mm²
technology8 nm
PCIe4.0
DisplaysHDMI 2.1, DisplayPort 1.4a
FeaturesNVIDIA DLSS, NVIDIA Reflex, Resizable BAR, NVIDIA Broadcast, NVIDIA Ansel, NVIDIA ShadowPlay®, NVIDIA G-SYNC®, Advanced Optimus, Nvidia Max-Q, Dynamic Boost, VR-ready, Nvidia Omniverse
Notebook Sizelarge
Date of Announcement12.01.2021

Benchmarks

Performance Rating - 3DMark 11 + Fire Strike + Time Spy
10.2 pt (31%)
Restrict / Search: Model: Max. age: years
3DMark - 3DMark Time Spy Score
min: 6499     avg: 10435     median: 10365 (28%)     max: 13067 Points
3DMark - 3DMark Time Spy Graphics
min: 6407     avg: 10681     median: 10752 (22%)     max: 13210 Points
Intel UHD Graphics 605
113 -99%
...
9943 -7%
10043 -6%
10046 -6%
AMD Radeon RX 8050S
10106 -5%
10206 -4%
10285 -4%
NVIDIA GeForce RTX 2080 Super Mobile
10301 -4%
10455 -2%
10478 -2%
NVIDIA GeForce RTX 3080 Laptop GPU
10681
10783 1%
11067 4%
11609 9%
11837 11%
11850 11%
Nvidia GeForce RTX 5060 Laptop
12223 14%
12640 18%
12806 20%
Nvidia GeForce RTX 5070 Laptop
13047 22%
...
19434 82%
max:
NVIDIA GeForce RTX 5090
46337 334%
0%
100%
Restrict / Search: Model: Max. age: years
3DMark - 3DMark Ice Storm Unlimited Graphics
min: 444648     avg: 551636     median: 544242 (55%)     max: 650505 Points
3DMark - 3DMark Ice Storm Extreme Graphics
min: 78873     avg: 160168     median: 105728 (12%)     max: 415335 Points
3DMark - 3DMark Cloud Gate Score
min: 30210     avg: 47565     median: 49494 (47%)     max: 65479 Points
3DMark - 3DMark Cloud Gate Graphics
min: 38816     avg: 116297     median: 107695 (26%)     max: 192950 Points
3DMark - 3DMark Fire Strike Standard Score
min: 13393     avg: 22296     median: 22750 (34%)     max: 27685 Points
3DMark - 3DMark Fire Strike Standard Graphics
min: 16455     avg: 27420     median: 27194 (25%)     max: 32366 Points
3DMark - 3DMark Ice Storm Graphics
min: 40654     avg: 137205     median: 79586.5 (9%)     max: 462145 Points
3DMark - 3DMark Wild Life Unlimited
min: 58406     avg: 69018     median: 66168 (33%)     max: 81508 Points
3DMark - 3DMark Wild Life Extreme Unlimited
min: 20061     avg: 22847     median: 21712 (25%)     max: 26393 Points
3DMark - 3DMark Night Raid
min: 27201     avg: 36576     median: 36125 (34%)     max: 52124 Points
3DMark - 3DMark Night Raid Graphics Score
min: 33157     avg: 62060     median: 56082.5 (22%)     max: 114808 Points
3DMark 11 - 3DM11 Performance Score
min: 22428     avg: 29044     median: 29220 (35%)     max: 32922 Points
3DMark 11 - 3DM11 Performance GPU
min: 31288     avg: 38259     median: 37933 (29%)     max: 43744 Points
171.8 -100%
...
NVIDIA GeForce RTX 2080 Super Mobile
35153 -8%
35286 -8%
35743 -7%
35944 -6%
36101 -6%
36164 -5%
37375 -2%
37792 -1%
37918 -1%
NVIDIA GeForce RTX 3080 Laptop GPU
38259
39402 3%
40164 5%
40391 6%
40462 6%
41630 9%
42016 10%
Nvidia GeForce RTX 5070 Laptop
42925 12%
43219 13%
46877 23%
...
59943 57%
max:
NVIDIA GeForce RTX 5090
129772 239%
0%
100%
Restrict / Search: Model: Max. age: years
3DMark Vantage
3DM Vant. Perf. total +
3DMark Vantage - 3DM Vant. Perf. total
min: 61664     avg: 75136     median: 78406 (23%)     max: 82066 Points
3DM Vant. Perf. GPU no PhysX +
3DMark Vantage - 3DM Vant. Perf. GPU no PhysX
min: 85368     avg: 90128     median: 90014 (49%)     max: 95116 Points
ATI Radeon HD 3200
62 -100%
...
77766 -14%
79140 -12%
80330 -11%
80346 -11%
80643 -11%
82368 -9%
85013 -6%
85672 -5%
86536 -4%
NVIDIA GeForce RTX 3080 Laptop GPU
90128
94006 4%
96677 7%
97889 9%
102426 14%
102619 14%
Nvidia GeForce RTX 5070 Ti Laptop
122701 36%
129977 44%
Nvidia GeForce RTX 5090 Laptop
131334 46%
132443 47%
...
Nvidia GeForce RTX 5080 Laptop
151016 68%
max:
173912 93%
0%
100%
Restrict / Search: Model: Max. age: years
3DMark 05 - 3DMark 05 - Standard
min: 50419     avg: 54320     median: 54800 (60%)     max: 57262 Points
Intel Graphics Media Accelerator (GMA) 500
133.4 -100%
...
AMD Radeon 660M
43616 -20%
AMD Radeon 680M
43633 -20%
44877 -17%
46269 -15%
46696 -14%
47870 -12%
48758 -10%
50971 -6%
52117 -4%
NVIDIA GeForce RTX 3080 Laptop GPU
54320
54758 1%
55811 3%
59420 9%
61850 14%
62666 15%
69623 28%
max:
87172 60%
0%
100%
Restrict / Search: Model: Max. age: years
3DMark 06 3DMark 06 - Standard 1280x1024 +
3DMark 06
min: 40441     avg: 45930     median: 45730.5 (60%)     max: 51819 Points
Unigine Valley 1.0 - Unigine Valley 1.0 DX
min: 124.6     avg: 128.3     median: 129.4 (39%)     max: 129.8 fps
Blender - Blender 3.3 Classroom CUDA *
min: 41     avg: 41.3     median: 41 (6%)     max: 42 Seconds
Blender - Blender 3.3 Classroom OPTIX *
min: 23     avg: 23.8     median: 23.5 (9%)     max: 25 Seconds
SPECviewperf 12
specvp12 sw-03 +
SPECviewperf 12 - specvp12 sw-03
min: 69.8     avg: 75     median: 75.9 (19%)     max: 78.4 fps
specvp12 snx-02 +
SPECviewperf 12 - specvp12 snx-02
min: 12.5     avg: 12.7     median: 12.8 (2%)     max: 12.9 fps
specvp12 showcase-01 +
SPECviewperf 12 - specvp12 showcase-01
min: 122     avg: 126.3     median: 125 (22%)     max: 133 fps
specvp12 mediacal-01 +
SPECviewperf 12 - specvp12 mediacal-01
79.4 fps (20%)
specvp12 maya-04 +
SPECviewperf 12 - specvp12 maya-04
min: 164     avg: 180.3     median: 183.5 (50%)     max: 190 fps
specvp12 energy-01 +
SPECviewperf 12 - specvp12 energy-01
11.8 fps (11%)
specvp12 creo-01 +
SPECviewperf 12 - specvp12 creo-01
min: 61     avg: 62.6     median: 62.7 (25%)     max: 64.1 fps
specvp12 catia-04 +
SPECviewperf 12 - specvp12 catia-04
min: 111     avg: 112.5     median: 112.5 (19%)     max: 114 fps
specvp12 3dsmax-05 +
SPECviewperf 12 - specvp12 3dsmax-05
min: 214     avg: 216.5     median: 216.5 (33%)     max: 219 fps
SPECviewperf 13 specvp13 sw-04 +
SPECviewperf 13 - specvp13 sw-04
min: 98.6     avg: 104.2     median: 101.5 (27%)     max: 115 fps
specvp13 snx-03 +
SPECviewperf 13 - specvp13 snx-03
min: 23     avg: 23.1     median: 23.1 (3%)     max: 23.2 fps
specvp13 showcase-02 +
SPECviewperf 13 - specvp13 showcase-02
min: 120     avg: 123.3     median: 120 (20%)     max: 133 fps
specvp13 medical-02 +
SPECviewperf 13 - specvp13 medical-02
min: 58.9     avg: 59     median: 59 (10%)     max: 59.2 fps
specvp13 maya-05 +
SPECviewperf 13 - specvp13 maya-05
min: 304     avg: 308.3     median: 309 (35%)     max: 311 fps
specvp13 energy-02 +
SPECviewperf 13 - specvp13 energy-02
min: 24.6     avg: 24.7     median: 24.6 (8%)     max: 24.8 fps
specvp13 creo-02 +
SPECviewperf 13 - specvp13 creo-02
min: 215     avg: 216.3     median: 216 (32%)     max: 218 fps
specvp13 catia-05 +
SPECviewperf 13 - specvp13 catia-05
min: 158     avg: 158.8     median: 159 (18%)     max: 159 fps
specvp13 3dsmax-06 +
SPECviewperf 13 - specvp13 3dsmax-06
min: 215     avg: 215.8     median: 215.5 (34%)     max: 217 fps
SPECviewperf 2020 specvp2020 snx-04 1080p +
SPECviewperf 2020 - specvp2020 snx-04 1080p
23.1 fps (3%)
specvp2020 medical-03 1080p +
SPECviewperf 2020 - specvp2020 medical-03 1080p
29.6 fps (8%)
specvp2020 maya-06 1080p +
SPECviewperf 2020 - specvp2020 maya-06 1080p
360 fps (39%)
specvp2020 energy-03 1080p +
SPECviewperf 2020 - specvp2020 energy-03 1080p
24.7 fps (4%)
specvp2020 creo-03 1080p +
SPECviewperf 2020 - specvp2020 creo-03 1080p
98.9 fps (34%)
specvp2020 catia-06 1080p +
SPECviewperf 2020 - specvp2020 catia-06 1080p
64.8 fps (32%)
specvp2020 3dsmax-07 1080p +
SPECviewperf 2020 - specvp2020 3dsmax-07 1080p
126 fps (33%)
specvp2020 solidworks-05 4k +
SPECviewperf 2020 - specvp2020 solidworks-05 4k
min: 102     avg: 104     median: 104.5 (25%)     max: 105 fps
specvp2020 snx-04 4k +
SPECviewperf 2020 - specvp2020 snx-04 4k
min: 18.5     avg: 18.7     median: 18.7 (2%)     max: 18.8 fps
specvp2020 medical-03 4k +
SPECviewperf 2020 - specvp2020 medical-03 4k
min: 9.84     avg: 10.3     median: 10.5 (7%)     max: 10.5 fps
specvp2020 maya-06 4k +
SPECviewperf 2020 - specvp2020 maya-06 4k
min: 186     avg: 187.8     median: 187.5 (27%)     max: 190 fps
specvp2020 energy-03 4k +
SPECviewperf 2020 - specvp2020 energy-03 4k
min: 29.1     avg: 29.5     median: 29.6 (4%)     max: 29.6 fps
specvp2020 creo-03 4k +
SPECviewperf 2020 - specvp2020 creo-03 4k
min: 75.7     avg: 77.7     median: 77.7 (35%)     max: 79.7 fps
specvp2020 catia-06 4k +
SPECviewperf 2020 - specvp2020 catia-06 4k
min: 37.6     avg: 37.9     median: 37.9 (25%)     max: 38.1 fps
specvp2020 3dsmax-07 4k +
SPECviewperf 2020 - specvp2020 3dsmax-07 4k
min: 84.5     avg: 86.5     median: 86.9 (29%)     max: 87.5 fps
Cinebench R10 Cinebench R10 Shading (32bit) +
Cinebench R10 - Cinebench R10 Shading (32bit)
min: 6839     avg: 6844     median: 6843.5 (5%)     max: 6850 points
Cinebench R11.5 Cinebench R11.5 OpenGL 64 Bit +
Cinebench R11.5 - Cinebench R11.5 OpenGL 64 Bit
min: 154.39     avg: 163.7     median: 157.6 (52%)     max: 185.34 fps
Cinebench R15
Cinebench R15 OpenGL 64 Bit +
Cinebench R15 - Cinebench R15 OpenGL 64 Bit
min: 115     avg: 182.3     median: 183.2 (11%)     max: 255.42 fps
Cinebench R15 OpenGL Ref. Match 64 Bit +
Cinebench R15 - Cinebench R15 OpenGL Ref. Match 64 Bit
99.6 % (100%)
Basemark GPU 1.2 - Basemark GPU 1.2 Vulkan Official Medium Offscreen 1080
min: 243     avg: 244.5     median: 245 (6%)     max: 245 fps
Basemark GPU 1.2 - Basemark GPU 1.2 Vulkan Official High Offscreen 2160
min: 16.7     avg: 17.9     median: 18.2 (3%)     max: 18.3 fps
Geekbench 6.4 - Geekbench 6.4 GPU OpenCL
min: 115109     avg: 119516     median: 118365 (31%)     max: 129446 points
Geekbench 6.4 - Geekbench 6.4 GPU Vulkan
min: 22054     avg: 38442     median: 22271 (6%)     max: 103350 points
LuxMark v2.0 64Bit - LuxMark v2.0 Room GPU
min: 4895     avg: 4937     median: 4908 (18%)     max: 5062 Samples/s
LuxMark v2.0 64Bit - LuxMark v2.0 Sala GPU
min: 11081     avg: 11447     median: 11429.5 (20%)     max: 11844 Samples/s
ComputeMark v2.1 - ComputeMark v2.1 Result
min: 23023     avg: 24296     median: 23303.5 (19%)     max: 28376 points
Power Consumption - Furmark Stress Test Power Consumption - external Monitor *
min: 122     avg: 174.9     median: 168.2 (23%)     max: 254 Watt
0153045607590105120135150165180195210225240255Tooltip
Power Consumption - The Witcher 3 Power Consumption - external Monitor *
min: 124     avg: 184.3     median: 183 (26%)     max: 244 Watt
0153045607590105120135150165180195210225240Tooltip
Power Consumption - Witcher 3 Power Consumption *
min: 123     avg: 186.6     median: 189 (42%)     max: 297 Watt
0153045607590105120135150165180195210225240255Tooltip
Power Consumption - Power Efficiency - Witcher 3 ultra
min: 0.4141     avg: 0.6     median: 0.6 (51%)     max: 0.74 fps per Watt
0102030405060708090100110120130140Tooltip
Power Consumption - Power Efficiency - Witcher 3 ultra external Monitor
min: 0.4696     avg: 0.6     median: 0.6 (47%)     max: 0.736 fps per Watt
Power Consumption - Cyberpunk 2077 Power Consumption - external Monitor *
min: 194.7     avg: 200.4     median: 200.4 (25%)     max: 206 Watt
0153045607590105120135150165180195210Tooltip
Emissions Witcher 3 Fan Noise +
Emissions - Witcher 3 Fan Noise
min: 36.8     avg: 49     median: 49.5 (79%)     max: 61 dB(A)
Clock Speed - GPU Clock Witcher 3 ultra
min: 1260     avg: 1530     median: 1492.5 (59%)     max: 1815 MHz
Clock Speed - GPU Clock Speed Furmark
1185 MHz (47%)
- Range of benchmark values
red legend - Average benchmark values
* Smaller numbers mean a higher performance

Game Benchmarks

The following benchmarks stem from our benchmarks of review laptops. The performance depends on the used graphics memory, clock rate, processor, system settings, drivers, and operating systems. So the results don't have to be representative for all laptops with this GPU. For detailed information on the benchmark results, click on the fps number.

F1 25

F1 25

2025
low 1920x1080
200  fps    + Compare
med. 1920x1080
185  fps    + Compare
high 1920x1080
150.2  fps    + Compare
ultra 1920x1080
15.9  fps    + Compare
» With all tested laptops playable in detail settings high.
Additional Benchmarks
Ultra High Preset 16xAF TAA 1920x1080
51.9
Doom: The Dark Ages

Doom: The Dark Ages

2025
low 1920x1080
62.9  fps    + Compare + 📈 Graph
med. 1920x1080
58  fps    + Compare + 📈 Graph
high 1920x1080
53.3  fps    + Compare + 📈 Graph
ultra 1920x1080
51.2  fps    + Compare + 📈 Graph
» With all tested laptops playable in detail settings ultra.
The Elder Scrolls IV Oblivion Remastered

The Elder Scrolls IV Oblivion Remastered

2025
low 1920x1080
71.3  fps    + Compare + 📈 Graph
med. 1920x1080
69.3  fps    + Compare + 📈 Graph
high 1920x1080
50.2  fps    + Compare + 📈 Graph
ultra 1920x1080
25.5  fps    + Compare + 📈 Graph
» With all tested laptops playable in detail settings high.
low 1920x1080
47  fps    + Compare
med. 1920x1080
41  fps    + Compare
high 1920x1080
33  fps    + Compare
ultra 1920x1080
25  fps    + Compare
QHD 2560x1440
20  fps    + Compare
QHD DLSS 2560x1440
27  fps    + Compare
» With all tested laptops playable in detail settings med..
low 1920x1080
163.9  fps    + Compare + 📈 Graph
med. 1920x1080
171.9  fps    + Compare + 📈 Graph
high 1920x1080
131.8  fps    + Compare + 📈 Graph
QHD 2560x1440
85.8  fps    + Compare + 📈 Graph
4K 3840x2160
40  fps    + Compare + 📈 Graph
» With all tested laptops playable in detail settings high.
low 1920x1080
59.3  fps    + Compare
med. 1920x1080
50.2  fps    + Compare
ultra 1920x1080
40.1  fps    + Compare
QHD 2560x1440
31.1  fps    + Compare
4K 3840x2160
19.5  fps    + Compare
4K DLSS 3840x2160
26.4  fps    + Compare
QHD DLSS 2560x1440
38.6  fps    + Compare
» With all tested laptops playable in detail settings ultra.
low 1920x1080
117.6  fps    + Compare + 📈 Graph
med. 1920x1080
91.1  fps    + Compare + 📈 Graph
high 1920x1080
74.9  fps    + Compare + 📈 Graph
ultra 1920x1080
52.5  fps    + Compare + 📈 Graph
QHD 2560x1440
38.7  fps    + Compare + 📈 Graph
4K 3840x2160
21.7  fps    + Compare + 📈 Graph
4K DLSS 3840x2160
32.9  fps    + Compare + 📈 Graph
QHD DLSS 2560x1440
51.9  fps    + Compare + 📈 Graph
» With all tested laptops playable in detail settings ultra.
low 1920x1080
94.3  fps    + Compare + 📈 Graph
high 1920x1080
69.4  fps    + Compare + 📈 Graph
ultra 1920x1080
63.1  fps    + Compare + 📈 Graph
QHD 2560x1440
49.3  fps    + Compare + 📈 Graph
4K 3840x2160
29.9  fps    + Compare + 📈 Graph
» With all tested laptops playable in detail settings ultra.
Stalker 2

Stalker 2

2024
low 1920x1080
54.7  fps    + Compare + 📈 Graph
med. 1920x1080
48.7  fps    + Compare + 📈 Graph
high 1920x1080
43  fps    + Compare + 📈 Graph
ultra 1920x1080
37.1 45.6 ~ 41 fps    + Compare + 📈 Graph
QHD 2560x1440
28.8 36.5 ~ 33 fps    + Compare + 📈 Graph
4K 3840x2160
17.3 21.7 ~ 20 fps    + Compare + 📈 Graph
» With all tested laptops playable in detail settings ultra.
Additional Benchmarks
Low Preset 1280x720
75.5
Epic Preset DLSS 1920x1080
51.4
43.5
low 1920x1080
130  fps    + Compare
med. 1920x1080
119  fps    + Compare
high 1920x1080
74 87 ~ 81 fps    + Compare
ultra 1920x1080
69 81 ~ 75 fps    + Compare
QHD 2560x1440
48 64 ~ 56 fps    + Compare
4K 3840x2160
25 42 ~ 34 fps    + Compare
4K DLSS 3840x2160
41 43 ~ 42 fps    + Compare
4K FSR 3840x2160
39  fps    + Compare
QHD DLSS 2560x1440
67 71 ~ 69 fps    + Compare
QHD FSR 2560x1440
68  fps    + Compare
» With all tested laptops playable in detail settings ultra.
Additional Benchmarks
Minimum Preset 1280x720
158
low 1920x1080
82.1  fps    + Compare + 📈 Graph
med. 1920x1080
78.8  fps    + Compare + 📈 Graph
high 1920x1080
60.7  fps    + Compare + 📈 Graph
ultra 1920x1080
45.3 52.2 ~ 49 fps    + Compare + 📈 Graph
QHD 2560x1440
32.4 37.1 ~ 35 fps    + Compare + 📈 Graph
4K 3840x2160
18.2 21.6 ~ 20 fps    + Compare + 📈 Graph
4K DLSS 3840x2160
25.3  fps    + Compare + 📈 Graph
4K FSR 3840x2160
25.1  fps    + Compare + 📈 Graph
QHD DLSS 2560x1440
41.8 60 ~ 51 fps    + Compare + 📈 Graph
QHD FSR 2560x1440
42.2  fps    + Compare + 📈 Graph
» With all tested laptops playable in detail settings ultra.
Additional Benchmarks
Low Preset 1280x720
83.4
ultra 1920x1080
113.6  fps    + Compare + 📈 Graph
QHD 2560x1440
110.5  fps    + Compare + 📈 Graph
4K 3840x2160
72.4  fps    + Compare + 📈 Graph
» With all tested laptops playable in detail settings ultra.
low 1920x1080
131.6  fps    + Compare + 📈 Graph
med. 1920x1080
109.7  fps    + Compare + 📈 Graph
high 1920x1080
95.2  fps    + Compare + 📈 Graph
ultra 1920x1080
92.9 95.8 ~ 94 fps    + Compare + 📈 Graph
QHD 2560x1440
66.6 73.7 ~ 70 fps    + Compare + 📈 Graph
4K 3840x2160
38.7 45.2 ~ 42 fps    + Compare + 📈 Graph
4K DLSS 3840x2160
57.9 63.5 ~ 61 fps    + Compare + 📈 Graph
QHD DLSS 2560x1440
87.7  fps    + Compare + 📈 Graph
» With all tested laptops playable in detail settings ultra.
Additional Benchmarks
Low Preset TAA 1280x720
159.5
low 1920x1080
70.9  fps    + Compare + 📈 Graph
med. 1920x1080
70.3  fps    + Compare + 📈 Graph
high 1920x1080
60.7  fps    + Compare + 📈 Graph
ultra 1920x1080
54.9 61.5 ~ 58 fps    + Compare + 📈 Graph
QHD 2560x1440
37.9 43.2 ~ 41 fps    + Compare + 📈 Graph
4K 3840x2160
21.1 24.6 ~ 23 fps    + Compare + 📈 Graph
4K DLSS 3840x2160
32.1  fps    + Compare + 📈 Graph
QHD DLSS 2560x1440
54.1  fps    + Compare + 📈 Graph
» With all tested laptops playable in detail settings ultra.
Additional Benchmarks
Low Preset (Super Resolution off) 1280x720
105.3
low 1920x1080
81  fps    + Compare + 📈 Graph
med. 1920x1080
76.6  fps    + Compare + 📈 Graph
high 1920x1080
77.7  fps    + Compare + 📈 Graph
ultra 1920x1080
64.2 71.9 ~ 68 fps    + Compare + 📈 Graph
QHD 2560x1440
32.3 50.3 56.1 ~ 46 fps    + Compare + 📈 Graph
4K 3840x2160
26.1  fps    + Compare + 📈 Graph
4K DLSS 3840x2160
65.5  fps    + Compare + 📈 Graph
» With all tested laptops playable in detail settings ultra.
Additional Benchmarks
Low Preset TAA 1280x720
82
low 1920x1080 cinem.
49.7 53.1 ~ 51 fps    + Compare + 📈 Graph
med. 1920x1080 cinem.
45.2 51.7 ~ 48 fps    + Compare + 📈 Graph
high 1920x1080 cinem.
39.6 47.5 ~ 44 fps    + Compare + 📈 Graph
ultra 1920x1080 cinem.
32.2 49.5 ~ 41 fps    + Compare + 📈 Graph
QHD 2560x1440 cinem.
23.2 31.1 ~ 27 fps    + Compare + 📈 Graph
4K 3840x2160 cinem.
12.6  fps    + Compare + 📈 Graph
4K DLSS 3840x2160 cinem.
20.8  fps    + Compare + 📈 Graph
QHD DLSS 2560x1440 cinem.
33.4 44.8 ~ 39 fps    + Compare + 📈 Graph
» With most tested laptops playable in detail settings ultra.
Additional Benchmarks
low 1280x720 cinem.
57.8
48.5
ultra DLSS 1920x1080 cinem.
52.3
low 1920x1080
76 77 ~ 77 fps    + Compare
med. 1920x1080
58 58 69 ~ 62 fps    + Compare
high 1920x1080
44 44 53 ~ 47 fps    + Compare
ultra 1920x1080
24 24 29 ~ 26 fps    + Compare
QHD 2560x1440
18 18 22 ~ 19 fps    + Compare
4K 3840x2160
11 11 ~ 11 fps    + Compare
4K DLSS 3840x2160
19 19 ~ 19 fps    + Compare
QHD DLSS 2560x1440
27 27 34 ~ 29 fps    + Compare
» With all tested laptops playable in detail settings high.
Additional Benchmarks
low TSR 100 1280x720
145
116
116
low 1920x1080
184 188.2 ~ 186 fps    + Compare + 📈 Graph
med. 1920x1080
134.3 134.3 ~ 134 fps    + Compare + 📈 Graph
high 1920x1080
112.5 114.2 ~ 113 fps    + Compare + 📈 Graph
ultra 1920x1080
99.5 104.1 ~ 102 fps    + Compare + 📈 Graph
QHD 2560x1440
65 69.4 ~ 67 fps    + Compare + 📈 Graph
4K 3840x2160
34.3 36.2 ~ 35 fps    + Compare + 📈 Graph
» With all tested laptops playable in detail settings ultra.
Additional Benchmarks
Very Low Preset 1280x720
246
225
low 1920x1080
147.6  fps    + Compare + 📈 Graph
med. 1920x1080
93.3  fps    + Compare + 📈 Graph
high 1920x1080
76.1  fps    + Compare + 📈 Graph
ultra 1920x1080
64.5  fps    + Compare + 📈 Graph
QHD 2560x1440
43.3  fps    + Compare + 📈 Graph
4K 3840x2160
23.9  fps    + Compare + 📈 Graph
4K DLSS 3840x2160
24.3  fps    + Compare + 📈 Graph
» With all tested laptops playable in detail settings ultra.
Additional Benchmarks
Low Preset 1280x720
179.6
Ultra Preset + Ultra Ray Tracing + DLSS Quality 2560x1440
41.7
F1 24

F1 24

2024
low 1920x1080
244 252 ~ 248 fps    + Compare
med. 1920x1080
227 230 ~ 229 fps    + Compare
high 1920x1080
175.6 176.4 ~ 176 fps    + Compare
ultra 1920x1080
58.8 59.3 ~ 59 fps    + Compare
QHD 2560x1440
38.3 38.7 ~ 39 fps    + Compare
4K 3840x2160
18.7 18.8 ~ 19 fps    + Compare
4K DLSS 3840x2160
33.2 33.5 ~ 33 fps    + Compare
» With all tested laptops playable in detail settings ultra.
Additional Benchmarks
Ultra High Preset + Quality DLSS 16xAF 2560x1440
61.1
60.4
low 1920x1080
57.6 59.3 ~ 58 fps    + Compare + 📈 Graph
med. 1920x1080
48.2 49.9 ~ 49 fps    + Compare + 📈 Graph
high 1920x1080
35.6 37 ~ 36 fps    + Compare + 📈 Graph
QHD 2560x1440
25.9 26.3 ~ 26 fps    + Compare + 📈 Graph
4K 3840x2160
14.4 14.5 ~ 14 fps    + Compare + 📈 Graph
4K DLSS 3840x2160
23.7 24.5 24.8 ~ 24 fps    + Compare + 📈 Graph
QHD DLSS 2560x1440
37.3 38.3 ~ 38 fps    + Compare + 📈 Graph
QHD FSR 2560x1440
37.2  fps    + Compare + 📈 Graph
» With all tested laptops playable in detail settings high.
low 1920x1080
93.6 97.4 ~ 96 fps    + Compare + 📈 Graph
med. 1920x1080
79.1 83 ~ 81 fps    + Compare + 📈 Graph
high 1920x1080
70.9 76 ~ 73 fps    + Compare + 📈 Graph
ultra 1920x1080
58.6 61.2 ~ 60 fps    + Compare + 📈 Graph
QHD 2560x1440
46 48.3 ~ 47 fps    + Compare + 📈 Graph
4K 3840x2160
28.7 29.5 ~ 29 fps    + Compare + 📈 Graph
4K DLSS 3840x2160
42.7 44.7 ~ 44 fps    + Compare + 📈 Graph
QHD DLSS 2560x1440
58.5 62.8 ~ 61 fps    + Compare + 📈 Graph
» With all tested laptops playable in detail settings ultra.
Additional Benchmarks
Very High Preset + Quality FSR 2560x1440
57.7
40.6
low 1920x1080
61.5 68.9 ~ 65 fps    + Compare + 📈 Graph
high 1920x1080
56.9 60.8 ~ 59 fps    + Compare + 📈 Graph
QHD 2560x1440
45.2 53.6 ~ 49 fps    + Compare + 📈 Graph
4K 3840x2160
29.3 32.1 ~ 31 fps    + Compare + 📈 Graph
4K DLSS 3840x2160
31.7 40.7 ~ 36 fps    + Compare + 📈 Graph
4K FSR 3840x2160
30.2 36.7 ~ 33 fps    + Compare + 📈 Graph
» With all tested laptops playable in detail settings high.
Additional Benchmarks
Low Preset 1280x720
64.4
71.9
low 1920x1080
100.3 100.7 ~ 101 fps    + Compare + 📈 Graph
med. 1920x1080
89.5 93 ~ 91 fps    + Compare + 📈 Graph
high 1920x1080
62.7 63.4 ~ 63 fps    + Compare + 📈 Graph
ultra 1920x1080
62.4 62.6 74 ~ 66 fps    + Compare + 📈 Graph
QHD 2560x1440
47.7 47.9 55.9 ~ 51 fps    + Compare + 📈 Graph
4K 3840x2160
28.9 29.8 35.3 ~ 31 fps    + Compare + 📈 Graph
4K DLSS 3840x2160
40.8 41.5 48.9 ~ 44 fps    + Compare + 📈 Graph
4K FSR 3840x2160
38.8 39.5 ~ 39 fps    + Compare + 📈 Graph
» With all tested laptops playable in detail settings ultra.
Additional Benchmarks
Very Low Preset 1280x720
116.7
133.5
low 1920x1080
165.1 189.5 ~ 177 fps    + Compare + 📈 Graph
med. 1920x1080
157 180.5 ~ 169 fps    + Compare + 📈 Graph
high 1920x1080
155 163.1 ~ 159 fps    + Compare + 📈 Graph
ultra 1920x1080
103.2 108.5 ~ 106 fps    + Compare + 📈 Graph
QHD 2560x1440
50.7 64.9 ~ 58 fps    + Compare + 📈 Graph
4K 3840x2160
18.4 20.2 ~ 19 fps    + Compare + 📈 Graph
4K DLSS 3840x2160
40.3 47.3 ~ 44 fps    + Compare + 📈 Graph
4K FSR 3840x2160
55.9 58.7 ~ 57 fps    + Compare + 📈 Graph
» With all tested laptops playable in detail settings ultra.
Additional Benchmarks
Low Preset 1280x720
174.9
194.8
low 1920x1080
179.4 192.2 ~ 186 fps    + Compare + 📈 Graph
med. 1920x1080
172.8 183.7 ~ 178 fps    + Compare + 📈 Graph
high 1920x1080
167.5 175.6 ~ 172 fps    + Compare + 📈 Graph
ultra 1920x1080
127.9 128 ~ 128 fps    + Compare + 📈 Graph
QHD 2560x1440
83 83.8 ~ 83 fps    + Compare + 📈 Graph
4K 3840x2160
40.6 40.7 ~ 41 fps    + Compare + 📈 Graph
» With all tested laptops playable in detail settings ultra.
Additional Benchmarks
Very Low Preset 1280x720
190.6
205
low 1920x1080
97 100 ~ 99 fps    + Compare
med. 1920x1080
90 91 110 ~ 97 fps    + Compare
high 1920x1080
73 75 93 ~ 80 fps    + Compare
ultra 1920x1080
57 60 73 ~ 63 fps    + Compare
QHD 2560x1440
45 47 62 ~ 51 fps    + Compare
4K 3840x2160
30 31 39 ~ 33 fps    + Compare
4K DLSS 3840x2160
43 43 51 ~ 46 fps    + Compare
4K FSR 3840x2160
39 40 ~ 40 fps    + Compare
» With all tested laptops playable in detail settings ultra.
Additional Benchmarks
Low Preset TAA 1280x720
119
121
low 1920x1080
125.9 126.5 ~ 126 fps    + Compare + 📈 Graph
med. 1920x1080
95.2 106.7 ~ 101 fps    + Compare + 📈 Graph
high 1920x1080
85.6 94.9 ~ 90 fps    + Compare + 📈 Graph
ultra 1920x1080
86.3 93.2 97.4 ~ 92 fps    + Compare + 📈 Graph
QHD 2560x1440
64.7 66.6 71.4 ~ 68 fps    + Compare + 📈 Graph
4K 3840x2160
37.6 37.6 40.9 ~ 39 fps    + Compare + 📈 Graph
» With all tested laptops playable in detail settings ultra.
Additional Benchmarks
Low Preset 1280x720
130.8
128
low 1920x1080
74 76.2 ~ 75 fps    + Compare + 📈 Graph
med. 1920x1080
64.8 66.5 ~ 66 fps    + Compare + 📈 Graph
high 1920x1080
55.3 57.4 ~ 56 fps    + Compare + 📈 Graph
ultra 1920x1080
48.1 49 53.4 ~ 50 fps    + Compare + 📈 Graph
QHD 2560x1440
37.2 38 42.2 ~ 39 fps    + Compare + 📈 Graph
4K 3840x2160
23 23.1 26.1 ~ 24 fps    + Compare + 📈 Graph
4K DLSS 3840x2160
34.3 34.4 39.9 ~ 36 fps    + Compare + 📈 Graph
4K FSR 3840x2160
28.8 33.1 ~ 31 fps    + Compare + 📈 Graph
» With all tested laptops playable in detail settings ultra.
Additional Benchmarks
Max. Performance 1280x720
116.3
118.5
Palworld

Palworld

2024
low 1920x1080
118.6 119.9 ~ 119 fps    + Compare + 📈 Graph
med. 1920x1080
113.7 116.4 ~ 115 fps    + Compare + 📈 Graph
high 1920x1080
96.8 102.5 ~ 100 fps    + Compare + 📈 Graph
ultra 1920x1080
92.3 93.1 100.5 ~ 95 fps    + Compare + 📈 Graph
QHD 2560x1440
65.5 68.2 76.4 ~ 70 fps    + Compare + 📈 Graph
4K 3840x2160
35.2 35.3 45.1 ~ 39 fps    + Compare + 📈 Graph
4K DLSS 3840x2160
47 47.4 61.8 ~ 52 fps    + Compare + 📈 Graph