Notebookcheck Logo

Intel Core i9-13905H

Intel i9-13905H

英特尔酷睿 i9-13905H 是基于 Raptor Lake-H 系列(Alder Lake 架构)的笔记本电脑高端移动 CPU。它于 2023 年初发布,提供 6 个高性能核心(P 核心,Golden Cove 架构)和 8 个高效核心(E 核心,Gracemont 架构)。P 核心支持超线程技术,与 E 核心结合可支持 20 个线程。性能集群的时钟频率范围为 2.6 至 5.4 GHz(单核涡轮增压,全核 4.9 GHz),效率集群的时钟频率范围为 1.9 至 4.1 GHz。E 核心的性能应与旧版 Skylake 核心类似(与酷睿 i7-6920HQ 作比较 酷睿 i7-6920HQ).所有内核均可使用多达 24 MB 三级缓存。与 i9-13900H但不支持 vPro,而且 13905H 使用不同的封装和插槽。

性能

得益于高核心数和高时钟频率,酷睿 i9-13905H 是(与 13900HK 一起)笔记本电脑中速度最快的 45W CPU,仅次于基于 Raptor Lake-HX 的更多核心和改进 P 核心的型号(如 i9-13980HX).尽管如此,这款 CPU 仍然非常适合游戏、内容创建和科学计算等所有苛刻的使用情况。

功能特点

集成内存控制器支持各种内存类型,最高可达 DDR5-5200(第 12 代产品为 4800 MHz)。线程指令(硬件)可支持操作系统决定在性能核心或高效核心上使用哪个线程,以获得最佳性能。针对人工智能任务,CPU 还集成了 GNA 3.0 和 DL Boost(通过 AVX2)。第 8 版的 Quick Sync 与 Rocket Lake CPU 相同,支持 MPEG-2、AVC、VC-1 解码、JPEG、VP8 解码、VP9、HEVC 和 AV1 硬件解码。CPU 现在支持用于 GPU 的 PCIe 5.0 x8 和用于 SSD 的两个 PCIe 4.0 x4。

集成显卡基于 Xe 架构,提供 96 个 EU(执行单元)。

CPU 的基本额定功率为 45 瓦(PL2 为 115 瓦),但大多数笔记本电脑的 PL1 功率约为 60 瓦。SoC 采用英特尔 10 纳米工艺制造,被称为英特尔 7(比第 12 代改进)。

SeriesIntel Raptor Lake-H
CodenameRaptor Lake-H

Series: Raptor Lake-H Raptor Lake-H

Intel Core i9-13900HK1.9 - 5.4 GHz14 / 20 cores24 MB L3
Intel Core i9-13905H « 1.9 - 5.4 GHz14 / 20 cores24 MB L3
Intel Core i9-13900H1.9 - 5.4 GHz14 / 20 cores24 MB L3
Intel Core i7-13800H1.8 - 5.2 GHz14 / 20 cores24 MB L3
Intel Core i7-13705H1.8 - 5 GHz14 / 20 cores24 MB L3
Intel Core i7-13700H1.8 - 5 GHz14 / 20 cores24 MB L3
Intel Core i7-13620H1.8 - 4.9 GHz10 / 16 cores24 MB L3
Intel Core i5-13600H2.1 - 4.8 GHz12 / 16 cores18 MB L3
Intel Core i5-13505H1.9 - 4.7 GHz12 / 16 cores18 MB L3
Intel Core i5-13500H1.9 - 4.7 GHz12 / 16 cores18 MB L3
Intel Core i5-13420H1.5 - 4.6 GHz8 / 12 cores12 MB L3
Clock Rate1900 - 5400 MHz
Level 1 Cache1.2 MB
Level 2 Cache11.5 MB
Level 3 Cache24 MB
Number of Cores / Threads14 / 20
Power Consumption (TDP = Thermal Design Power)45 Watt
Manufacturing Technology10 nm
Max. Temperature100 °C
SocketFCBGA1792
FeaturesThread Director
GPUIntel Iris Xe Graphics G7 96EUs ( - 1500 MHz)
64 Bit64 Bit support
Architecturex86
Announcement Date01/04/2023
Product Link (external)ark.intel.com

Benchmarks

Performance Rating - CB R15 + R20 + 7-Zip + X265 + Blender + 3DM11 CPU
42.9 pt (60%)
Cinebench R23 - Cinebench R23 Multi Core
min: 17880     avg: 19384     median: 20034 (19%)     max: 20237 Points
Cinebench R23 - Cinebench R23 Single Core
min: 1652     avg: 1901     median: 2020 (86%)     max: 2030 Points
Cinebench R20 - Cinebench R20 CPU (Single Core)
min: 622     avg: 679     median: 639 (71%)     max: 775 Points
Cinebench R20 - Cinebench R20 CPU (Multi Core)
min: 6462     avg: 7028     median: 7152 (17%)     max: 7469 Points
Cinebench R15 - Cinebench R15 CPU Multi 64 Bit
min: 2676     avg: 2821     median: 2857 (18%)     max: 2931 Points
01503004506007509001050120013501500165018001950210022502400255027002850Tooltip
Cinebench R15 - Cinebench R15 CPU Single 64 Bit
min: 235     avg: 255.3     median: 246 (74%)     max: 285 Points
7-Zip 18.03 - 7-Zip 18.03 Multli Thread 4 runs
min: 68880     avg: 71701     median: 69892 (40%)     max: 76332 MIPS
7-Zip 18.03 - 7-Zip 18.03 Single Thread 4 runs
min: 4871     avg: 5487     median: 5520 (66%)     max: 6069 MIPS
HWBOT x265 Benchmark v2.2 - HWBOT x265 4k Preset
min: 20.5     avg: 21.5     median: 21.2 (37%)     max: 22.9 fps
05101520253035Tooltip
Blender - Blender 3.3 Classroom CPU *
min: 280     avg: 296     median: 302 (4%)     max: 306 Seconds
Blender - Blender 2.79 BMW27 CPU *
min: 163     avg: 171.3     median: 173 (1%)     max: 178 Seconds
R Benchmark 2.5 - R Benchmark 2.5 *
min: 0.4178     avg: 0.5     median: 0.5 (10%)     max: 0.4974 sec
3DMark 11 - 3DM11 Performance Physics
min: 22494     avg: 23911     median: 23894 (65%)     max: 25346 Points
3DMark - 3DMark Fire Strike Standard Physics
min: 27625     avg: 29475     median: 29193 (52%)     max: 31606 Points
3DMark - 3DMark Time Spy CPU
min: 12800     avg: 13567     median: 13653 (58%)     max: 14249 Points
Geekbench 5.5 - Geekbench 5.1 - 5.4 64 Bit Single-Core
min: 1672     avg: 1774     median: 1685 (71%)     max: 1966 points
Geekbench 5.5 - Geekbench 5.1 - 5.4 64 Bit Multi-Core
min: 13661     avg: 14122     median: 13707 (25%)     max: 14999 points
Geekbench 5.0 - Geekbench 5.0 64 Bit Multi-Core
14690 points (46%)
Mozilla Kraken 1.1 - Kraken 1.1 Total Score *
min: 465     avg: 522     median: 545 (1%)     max: 557 ms
WebXPRT 4 - WebXPRT 4 Score
min: 243     avg: 265.5     median: 265.5 (76%)     max: 288 Points
WebXPRT 3 - WebXPRT 3 Score
min: 267     avg: 301.5     median: 301.5 (63%)     max: 336 Points
CrossMark - CrossMark Overall
min: 1774     avg: 1884     median: 1883.5 (72%)     max: 1993 Points
Power Consumption - Prime95 Power Consumption - external Monitor *
min: 139.4     avg: 140     median: 140 (24%)     max: 140.6 Watt
0102030405060708090100110120130140150160170180Tooltip
Power Consumption - Cinebench R15 Multi Power Consumption - external Monitor *
168.6 Watt (31%)
0102030405060708090100110120130140150160170Tooltip
Power Consumption - Idle Power Consumption - external Monitor *
min: 16     avg: 16.6     median: 16.6 (11%)     max: 17.2 Watt
0510152025303540Tooltip
Power Consumption - Idle Power Consumption 150cd 1min *
min: 11.7     avg: 15.8     median: 15.8 (17%)     max: 19.9 Watt
05101520Tooltip
Power Consumption - Cinebench R15 Multi Power Efficiency - external Monitor
16.9 Points per Watt (13%)
- Range of benchmark values for this graphics card
- Average benchmark values for this graphics card
* Smaller numbers mean a higher performance

v1.26
log 25. 03:17:56

#0 no ids found in url (should be separated by "_") +0s ... 0s

#1 not redirecting to Ajax server +0s ... 0s

#2 did not recreate cache, as it is less than 5 days old! Created at Tue, 23 Apr 2024 05:40:15 +0200 +0.001s ... 0.001s

#3 no comparison url found in template nbc.compare_page_2 needed +0.013s ... 0.015s

#4 no comparison url found in template nbc.compare_page_2 needed +0s ... 0.015s

#5 no comparison url found in template nbc.compare_page_2 needed +0s ... 0.015s

#6 no comparison url found in template nbc.compare_page_2 needed +0s ... 0.015s

#7 no comparison url found in template nbc.compare_page_2 needed +0s ... 0.016s

#8 no comparison url found in template nbc.compare_page_2 needed +0s ... 0.016s

#9 no comparison url found in template nbc.compare_page_2 needed +0s ... 0.016s

#10 no comparison url found in template nbc.compare_page_2 needed +0s ... 0.016s

#11 no comparison url found in template nbc.compare_page_2 needed +0s ... 0.017s

#12 no comparison url found in template nbc.compare_page_2 needed +0s ... 0.017s

#13 composed specs +0s ... 0.017s

#14 did output specs +0s ... 0.017s

#15 getting avg benchmarks for device 14983 +0.02s ... 0.037s

#16 got single benchmarks 14983 +0.022s ... 0.059s

#17 got avg benchmarks for devices +0s ... 0.059s

#18 min, max, avg, median took s +0.632s ... 0.691s

#19 no comparison url found in template nbc.compare_page_2 needed +0s ... 0.691s

#20 return log +0s ... 0.691s

Reviews for the Intel Core i9-13905H processor

华硕 Zenbook Pro 16X (2023)

Zenbook Pro 16X (2023) 评测:华硕旗舰机的最强动力

具有特殊优势的笔记本电脑又回来了。在新款 18 毫米薄的 Zenbook 中,华硕安装了极其强大的硬件,并最终让它摆脱了束缚。在我们的测试机中,NvidiaGeForce RTX 4080 的功率高达 140 瓦,因此丝毫不逊色于许多游戏笔记本电脑中的同类产品。 ...
Intel Core i9-13905H | NVIDIA GeForce RTX 4080 Laptop GPU | 16.00" | 2.4 kg
联想 Slim Pro 9i 16IRP8 笔记本电脑评测:Apple MacBook Pro 16 的替代品

联想 Slim Pro 9i 16IRP8 笔记本电脑评测:Apple MacBook Pro 16 的替代品

虽然价格不菲,超过两千美元,但 Slim Pro 9i 配备了令人印象深刻的 3.2K miniLED 触摸屏,具有宽广的 DCI-P3 色彩和超过 IPS 两倍的对比度。...
Intel Core i9-13905H | NVIDIA GeForce RTX 4050 Laptop GPU | 16.00" | 2.2 kg

Asus ZenBook Pro 16X OLED UX7602: NVIDIA GeForce RTX 4080 Laptop GPU, 16.00", 2.2 kg
  External Review » Asus ZenBook Pro 16X OLED UX7602

Lenovo Yoga Pro 9i RTX4070: NVIDIA GeForce RTX 4070 Laptop GPU, 16.00"
  External Review » Lenovo Yoga Pro 9i RTX4070

Lenovo Yoga Pro 9 16IRP8, RTX 4070: NVIDIA GeForce RTX 4070 Laptop GPU, 16.00", 2.2 kg
  External Review » Lenovo Yoga Pro 9 16IRP8, RTX 4070

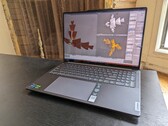
Lenovo Slim Pro 9i 16IRP8: NVIDIA GeForce RTX 4050 Laptop GPU, 16.00", 2.2 kg
  External Review » Lenovo Slim Pro 9i 16IRP8

Lenovo Yoga Pro 9 14IRP G8, i9-13905H RTX 4060: NVIDIA GeForce RTX 4060 Laptop GPU, 14.50", 1.7 kg
  External Review » Lenovo Yoga Pro 9 14IRP G8, i9-13905H RTX 4060

Lenovo Yoga Pro 9i 14 2023: NVIDIA GeForce RTX 4070 Laptop GPU, 14.50", 1.7 kg
  External Review » Lenovo Yoga Pro 9i 14 2023

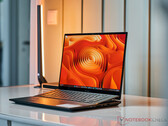
Asus Zenbook Pro 16X UX7602BZ-MY005W: NVIDIA GeForce RTX 4080 Laptop GPU, 16.00", 2.4 kg
   » 性能明显强于前代产品:全新华硕 Zenbook Pro 16X 达到游戏笔记本电脑的性能水平

Please share our article, every link counts!

»移动处理器 对比
所有移动处理器的对比


»移动处理器 基准测试
所有已有笔记本电脑中使用的处理器的基准测试成绩 (桌面处理器或移动处理器)

Other CPUs of the series Raptor Lake-H

» Intel Core i9-13900HK
   14x 1.9 GHz - 5.4 GHz
» Intel Core i9-13905H
   14x 1.9 GHz - 5.4 GHz
» Intel Core i9-13900H
   14x 1.9 GHz - 5.4 GHz
» Intel Core i7-13800H
   14x 1.8 GHz - 5.2 GHz
» Intel Core i7-13705H
   14x 1.8 GHz - 5 GHz
» Intel Core i7-13700H
   14x 1.8 GHz - 5 GHz
» Intel Core i7-13620H
   10x 1.8 GHz - 4.9 GHz
» Intel Core i5-13600H
   12x 2.1 GHz - 4.8 GHz
» Intel Core i5-13505H
   12x 1.9 GHz - 4.7 GHz
» Intel Core i5-13500H
   12x 1.9 GHz - 4.7 GHz
» Intel Core i5-13420H
   8x 1.5 GHz - 4.6 GHz

Surrounding CPUs

+ Apple M3 Max 16-Core
   16x 2.75 GHz - 4.06 GHz
+ Intel Core i7-14650HX
   16x 1.6 GHz - 5.2 GHz
+ Intel Core i7-13700HX
   16x 1.5 GHz - 5 GHz
+ Intel Core i9-13900HK
   14x 1.9 GHz - 5.4 GHz
+ Intel Core Ultra 9 185H
   16x 3.8 GHz - 5.1 GHz
» Intel Core i9-13905H
   14x 1.9 GHz - 5.4 GHz
- Intel Core i9-13900H
   14x 1.9 GHz - 5.4 GHz
- Apple M3 Max 14-Core
   14x 2.75 GHz - 4.06 GHz
- Intel Core Ultra 7 165H
   16x 3.8 GHz - 5 GHz
- Intel Core i7-13800H
   14x 1.8 GHz - 5.2 GHz
- Intel Core i7-12850HX
   16x 1.5 GHz - 4.8 GHz
> Notebookcheck中文版(NBC中国) > FAQ / 小提示/ 技术参数 > 移动处理器 —— 基准测试成绩列表 > Intel Raptor Lake-H i9-13905H 笔记本处理器
Klaus Hinum (Update: 2023-11-26)