HP Elite Dragonfly G3 13.5笔记本电脑评测。全新的设计和性能
蜻蜓G3直接继承了去年的 蜻蜓Max(即蜻蜓G2),从上到下都是新硬件。除了明显的CPU从第11代Tiger Lake-U升级到第12代Alder Lake-U之外,G3还采用了新的3:2外形尺寸和13.5英寸显示屏,与旧的16:9 13.3英寸设计形成对比。惠普表示,所有的变化都是为了迎合家庭外和家庭内的混合劳动力。
我们的评测单位配置了酷睿i7-1265U vPro CPU、1280p IPS显示屏、5G WWAN和512GB SSD,价格约为2700美元。其他配置有较小的酷睿i5-1235U和OLED触摸屏,但所有选项都有集成的Iris Xe图形和至少16GB的LPDDR5内存。
蜻蜓G3的替代品包括其他旗舰型13英寸办公或商务笔记本电脑,如 戴尔Latitude 13 7330, 联想ThinkPad X1 Yoga G1, MSI Summit E13, 或 框架笔记本电脑.
更多惠普评论。
潜在的竞争对手比较
Rating | Date | Model | Weight | Height | Size | Resolution | Price |
|---|---|---|---|---|---|---|---|
| 91 % v7 (old) | 08 / 2022 | HP Elite Dragonfly G3 i7-1265U, Iris Xe G7 96EUs | 1.2 kg | 16.3 mm | 13.50" | 1920x1280 | |
| 89.4 % v7 (old) | 02 / 2021 | HP Spectre x360 14t-ea000 i7-1165G7, Iris Xe G7 96EUs | 1.3 kg | 17.2 mm | 13.50" | 1920x1280 | |
| 86.1 % v7 (old) | 08 / 2022 | Dell XPS 13 Plus 9320 i5-1240p i5-1240P, Iris Xe G7 80EUs | 1.2 kg | 15.3 mm | 13.40" | 1920x1200 | |
| 85.1 % v7 (old) | 07 / 2022 | Framework Laptop 13.5 12th Gen Intel i7-1260P, Iris Xe G7 96EUs | 1.3 kg | 15.85 mm | 13.50" | 2256x1504 | |
| 84 % v7 (old) | 08 / 2021 | HP EliteBook Folio 13.5-3G2L2EA SD 8cx Gen 2 5G, Adreno 680 | 1.3 kg | 16 mm | 13.50" | 1920x1280 | |
| 87.3 % v7 (old) | 05 / 2021 | Lenovo ThinkPad X1 Titanium Yoga G1 20QA001RGE i7-1160G7, Iris Xe G7 96EUs | 1.2 kg | 11.5 mm | 13.50" | 2256x1504 |
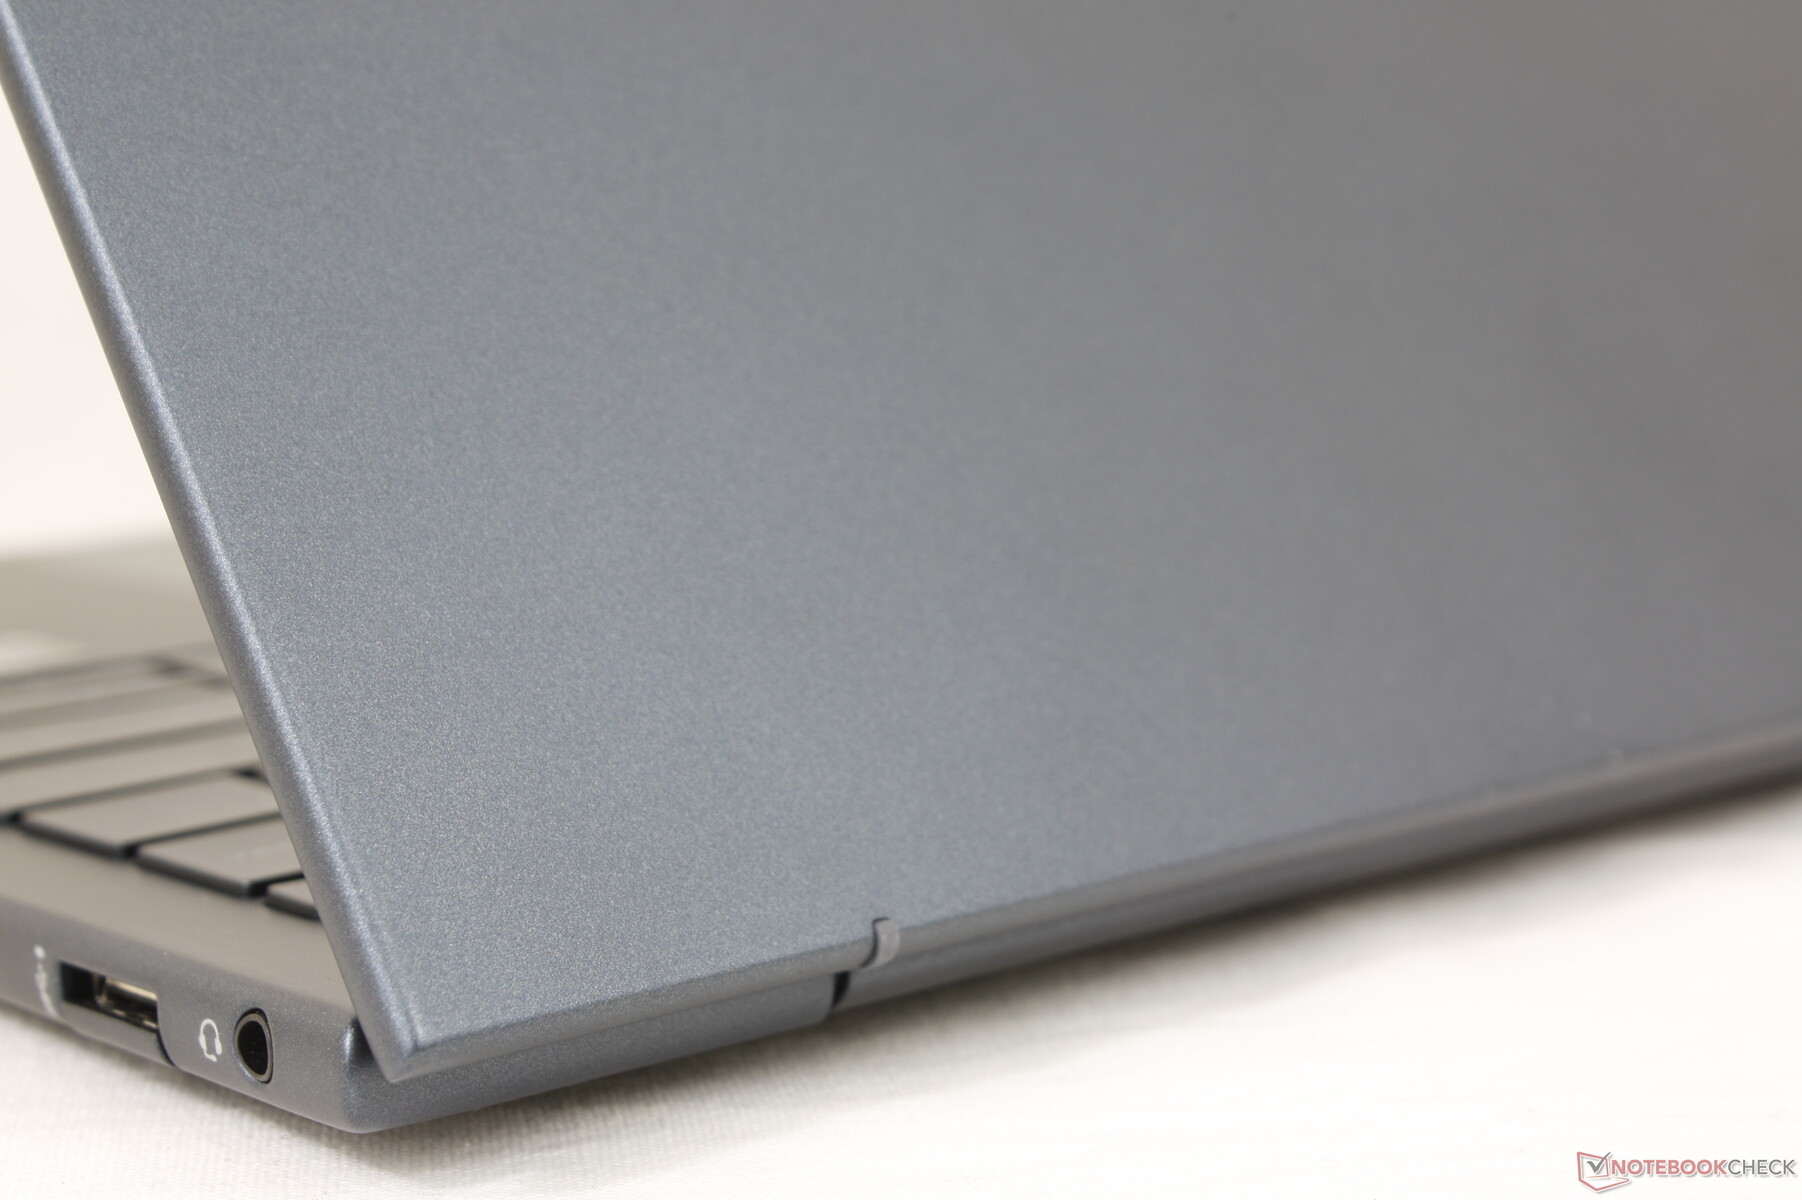
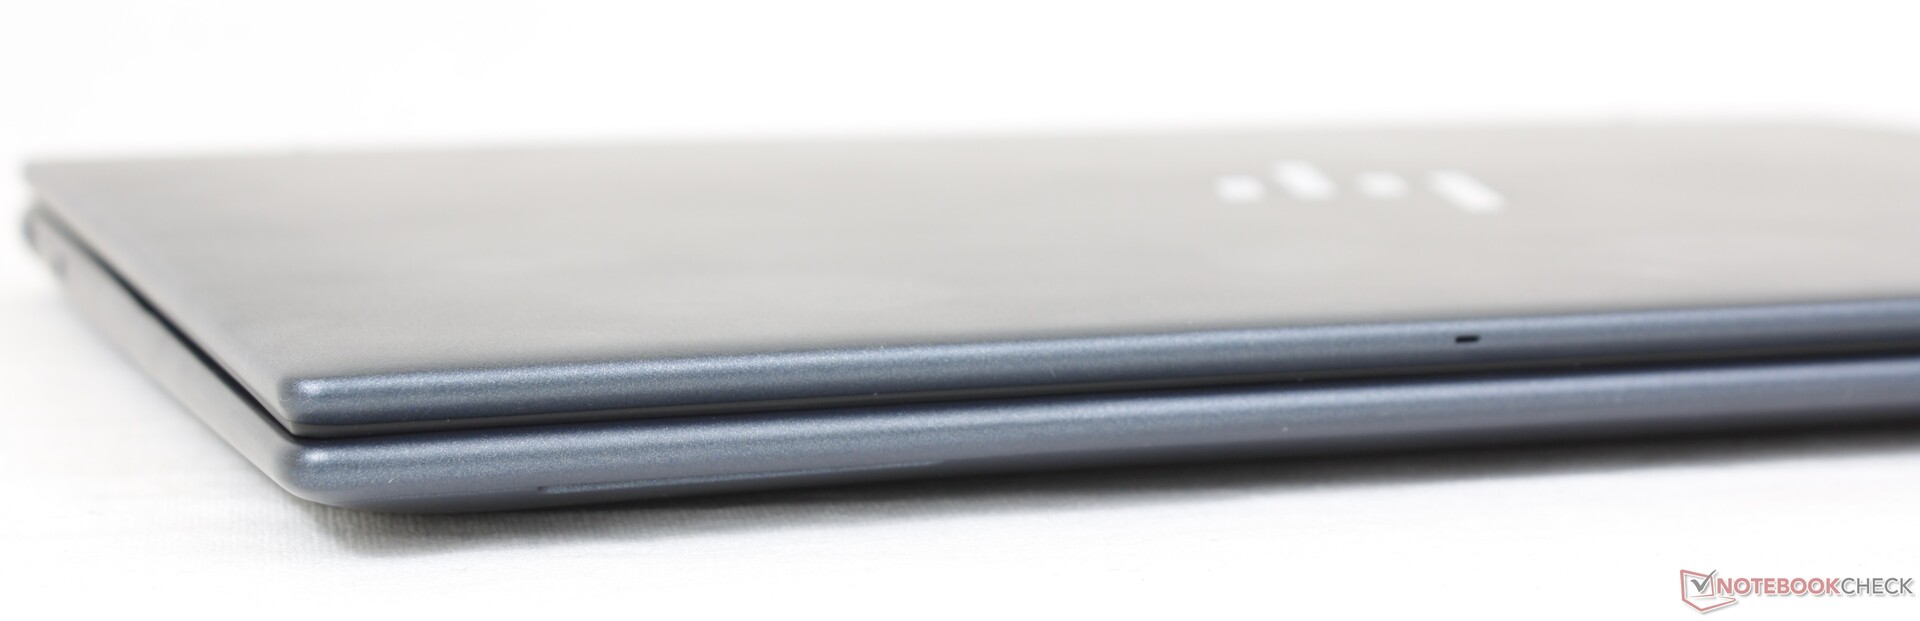
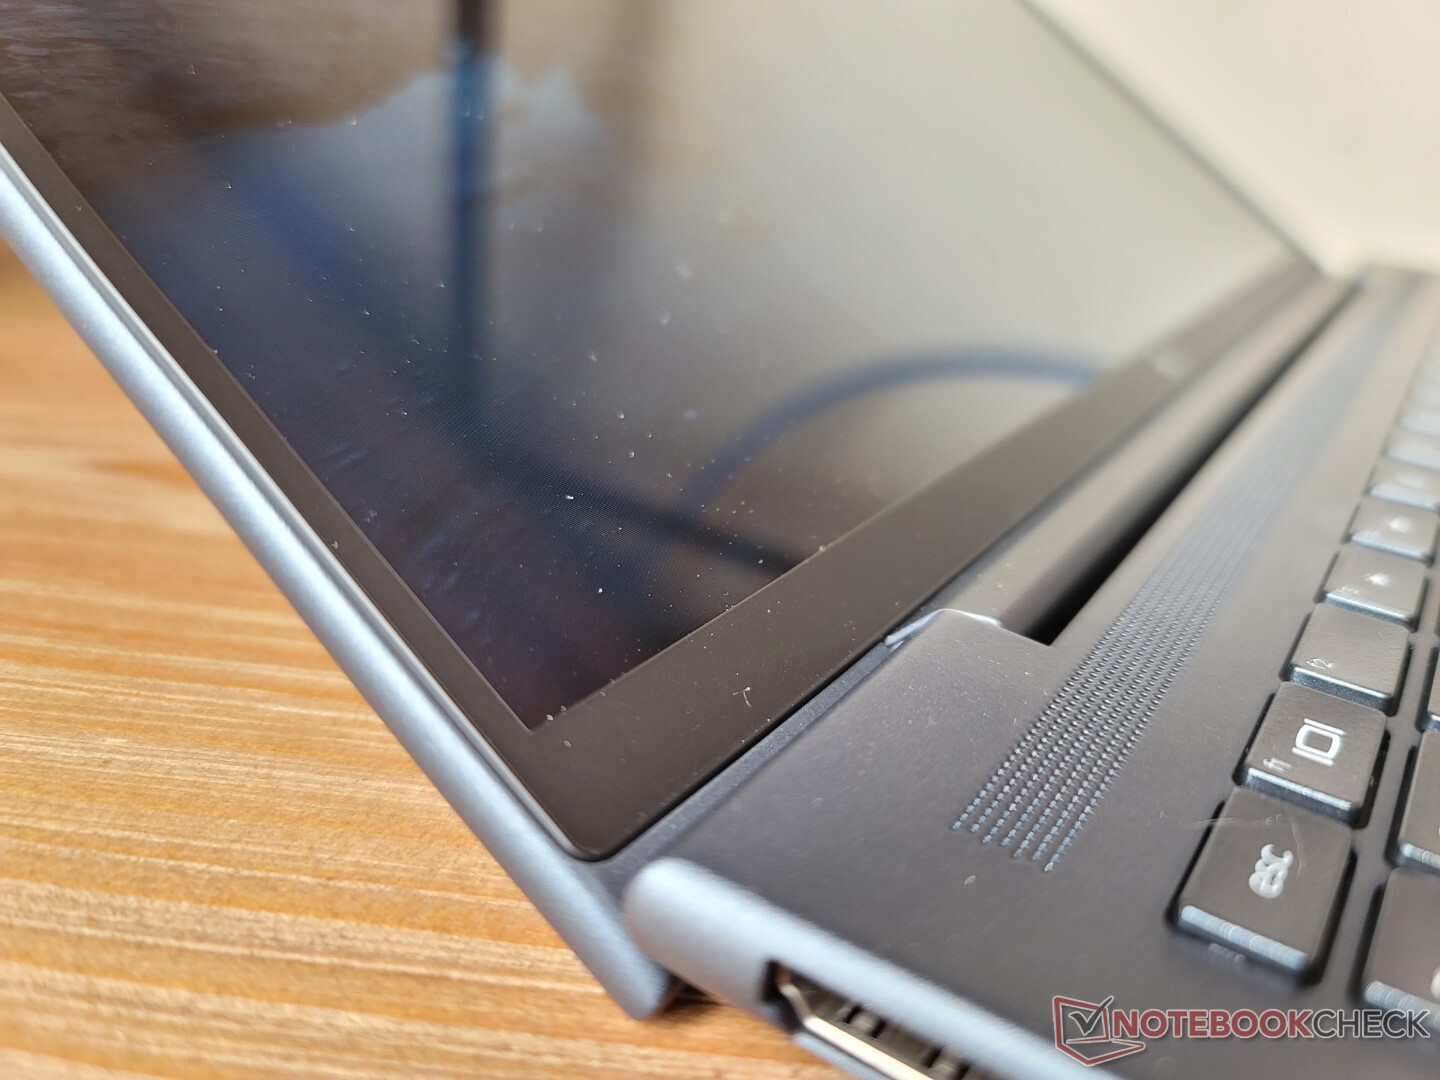
案例 - 底座强,盖子弱
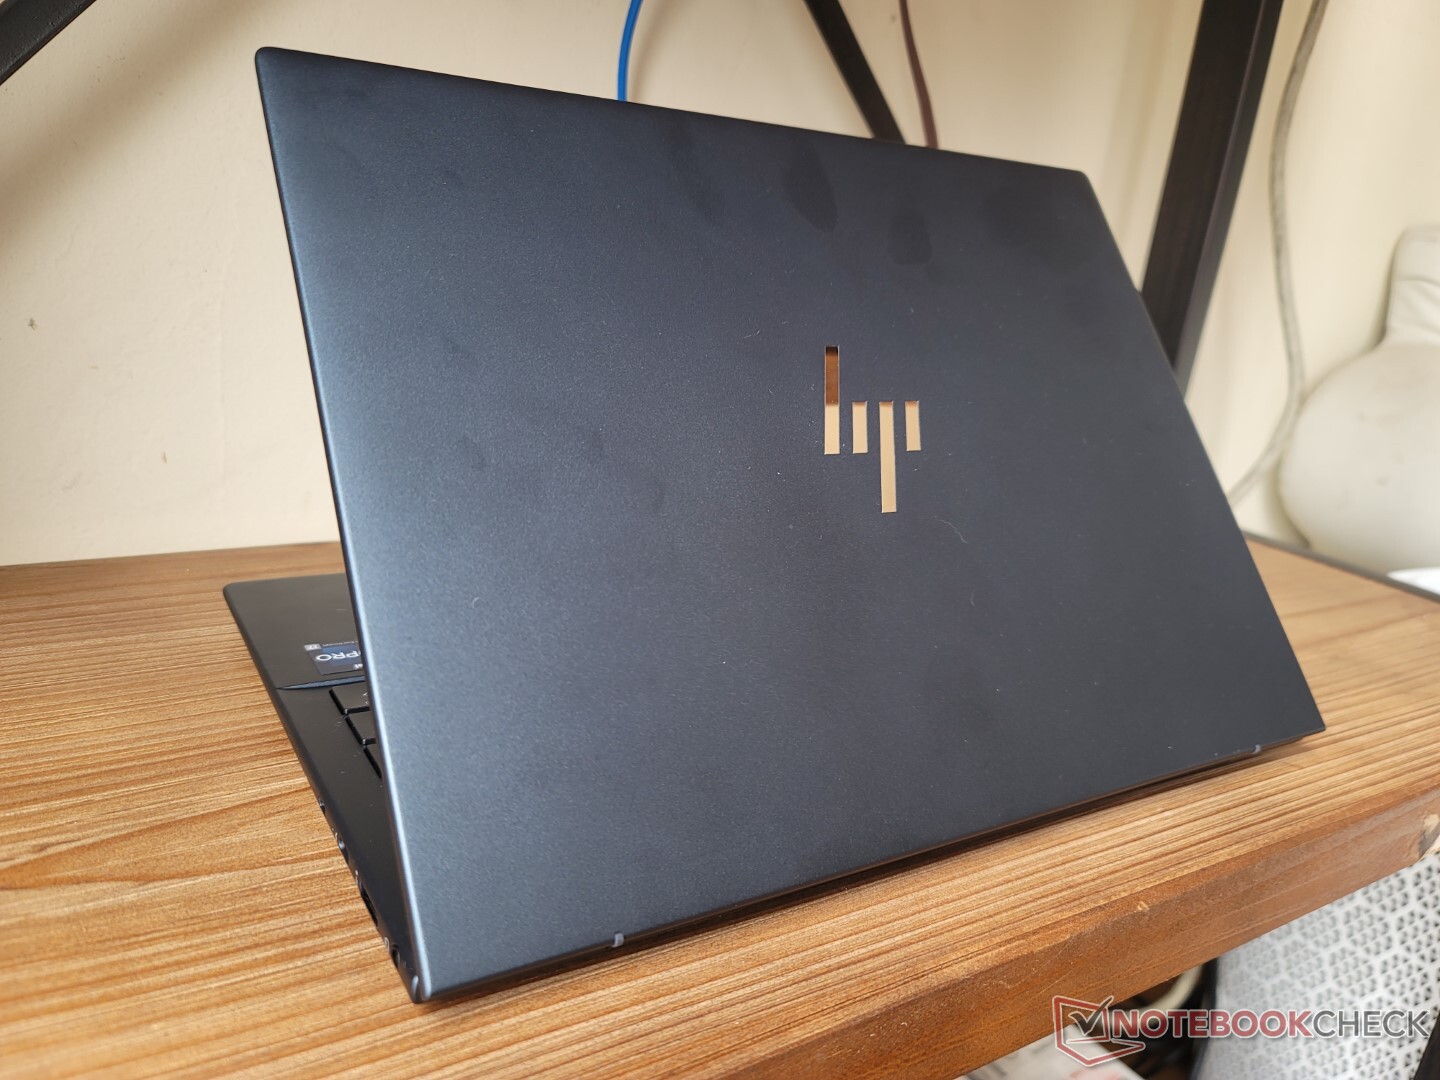
金属底盘在底座和键盘中心周围保持坚固和刚性。然而,盖子就不一样了,因为它的扭动和弯曲就像在LG手机上的盖子一样容易。 LG gram或 三星Galaxy Book.在外盖中央施加压力,比Spectre的盖子更容易使表面变形。非常低的重量和缺乏任何大猩猩玻璃加固,导致蜻蜓G3的盖子较弱。
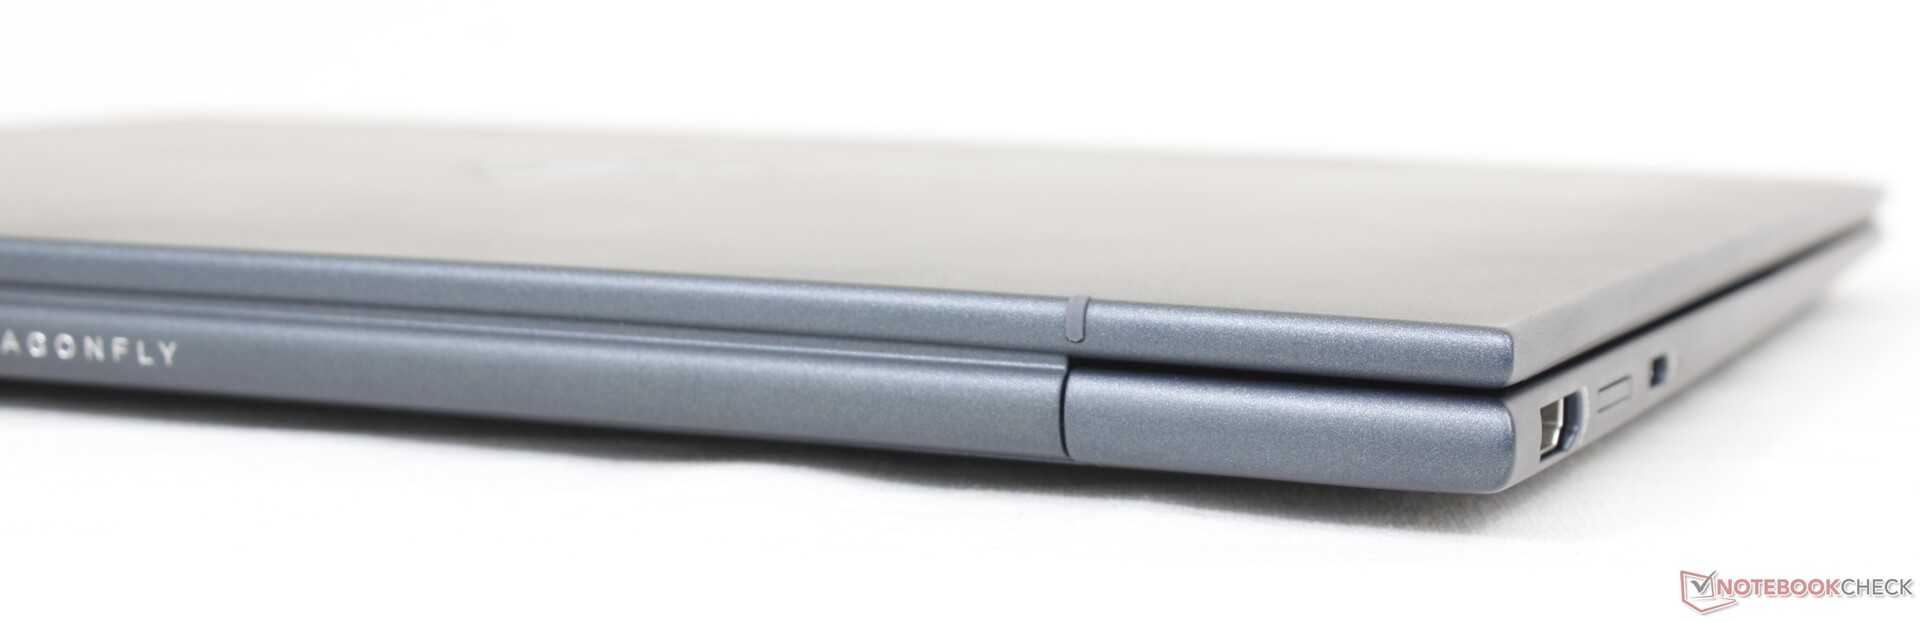
值得注意的是,蜻蜓G3并没有像2020年最初推出的机型那样提供任何充满活力的颜色选择。相比之下,新的颜色选择已经变得更加哑光和无光泽。对于一个名为 "蜻蜓 "的系列来说,它的颜色正变得与典型的EliteBook机型过于相似。
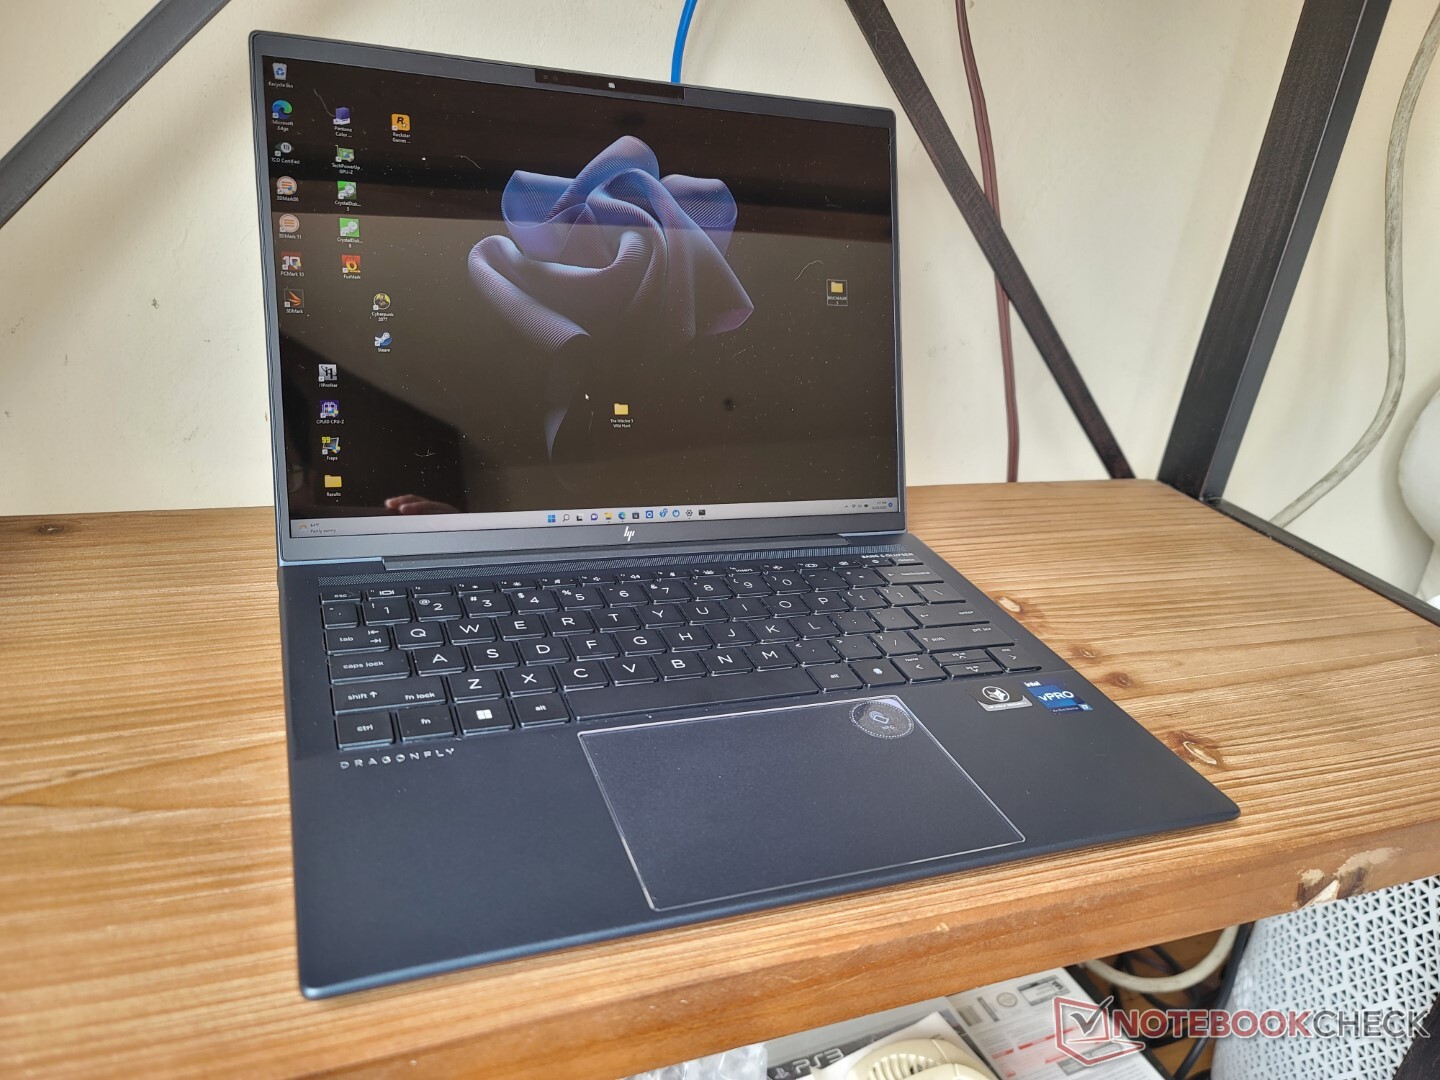
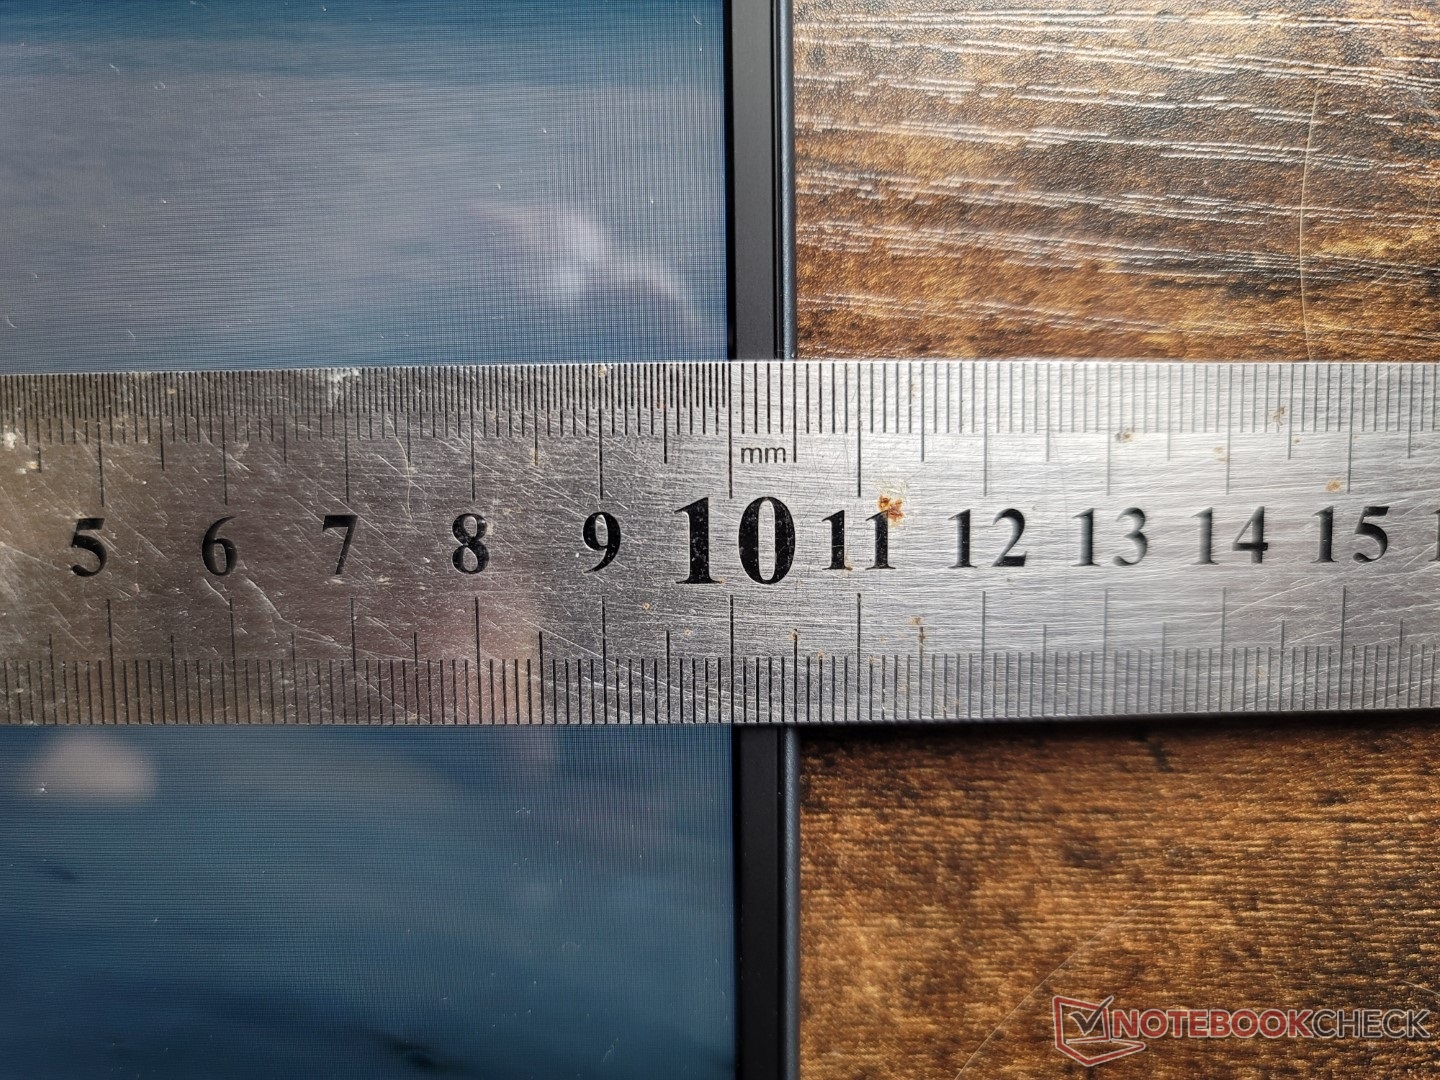
由于采用了新的13.5英寸外形尺寸,新机型比即将发布的Dragonfly Max长了20多毫米,但值得庆幸的是,尽管体积更大,但它的重量并没有增加,只有1.2公斤。也许不令人惊讶的是,尺寸几乎与最近的13.5英寸Spectre x360 13.5相同。
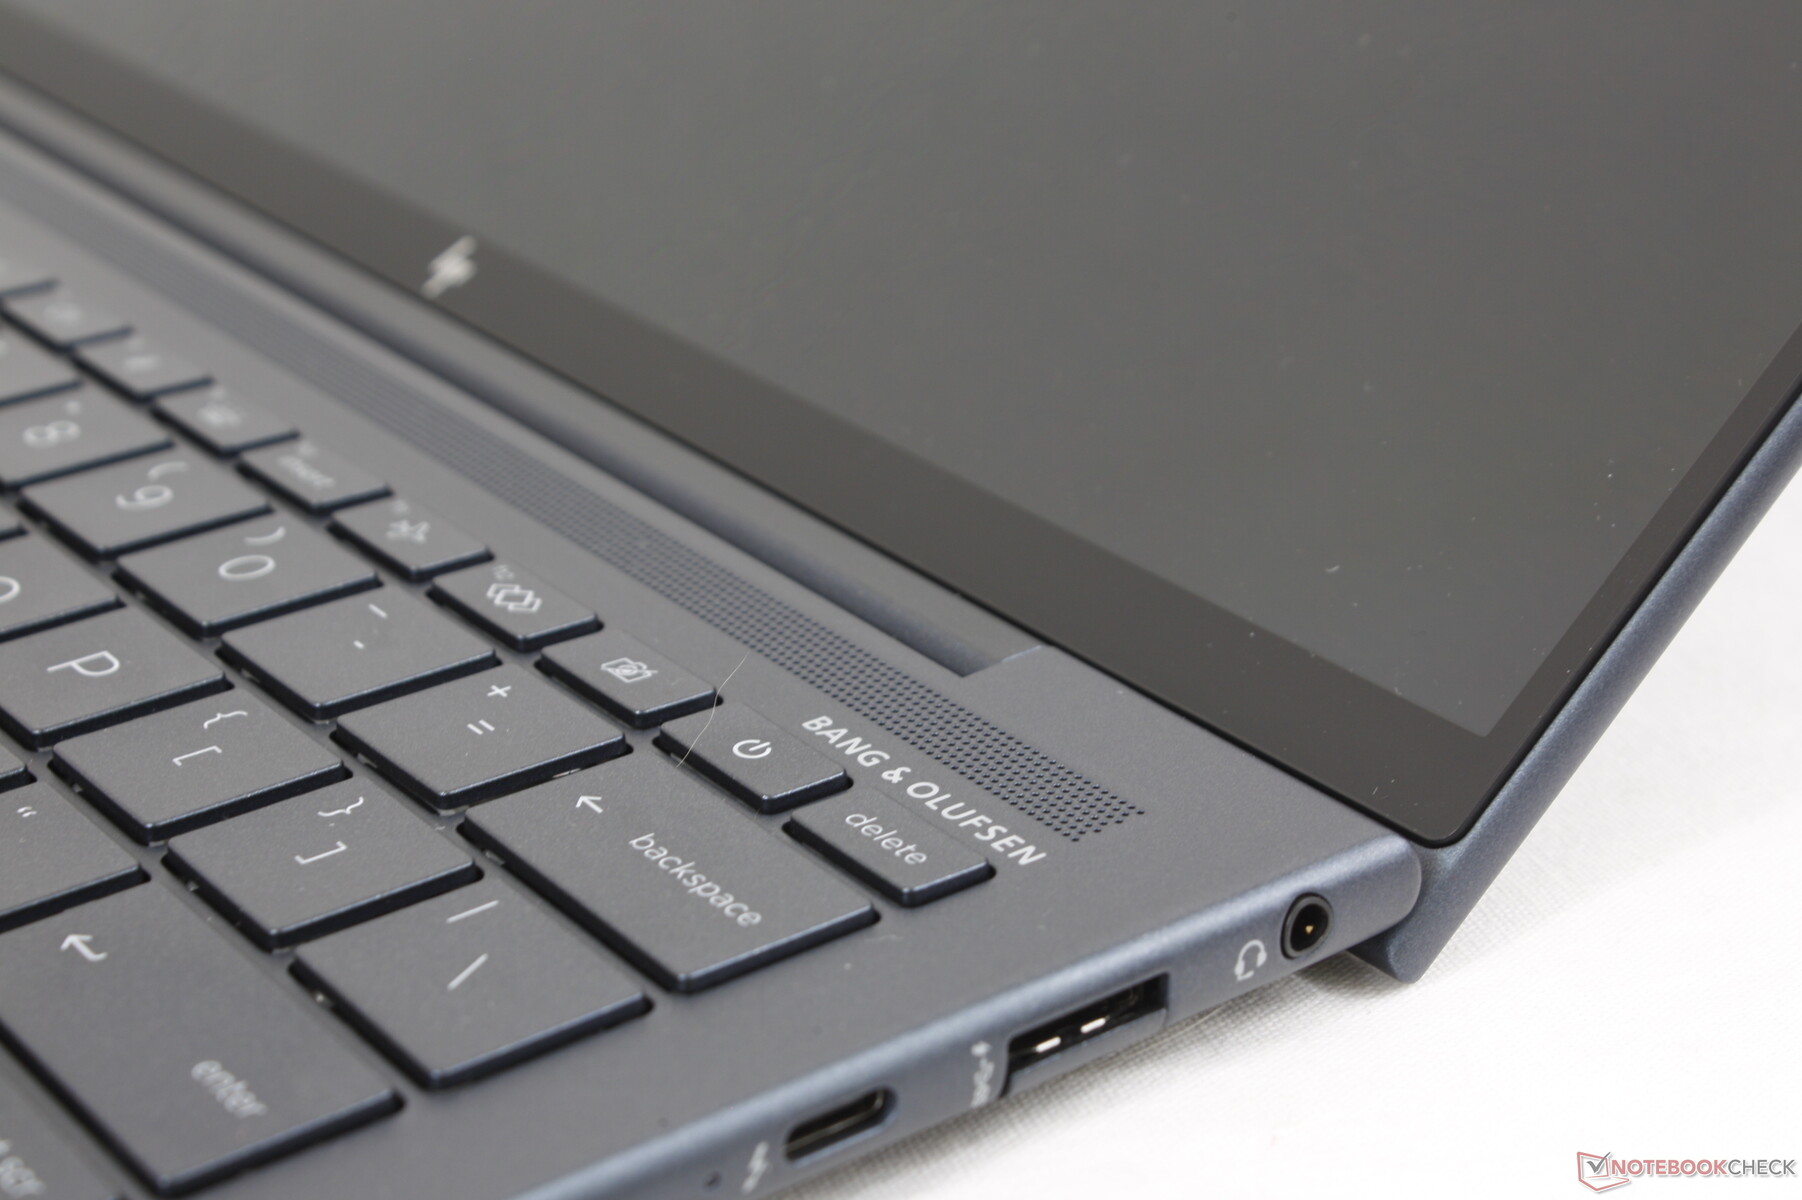
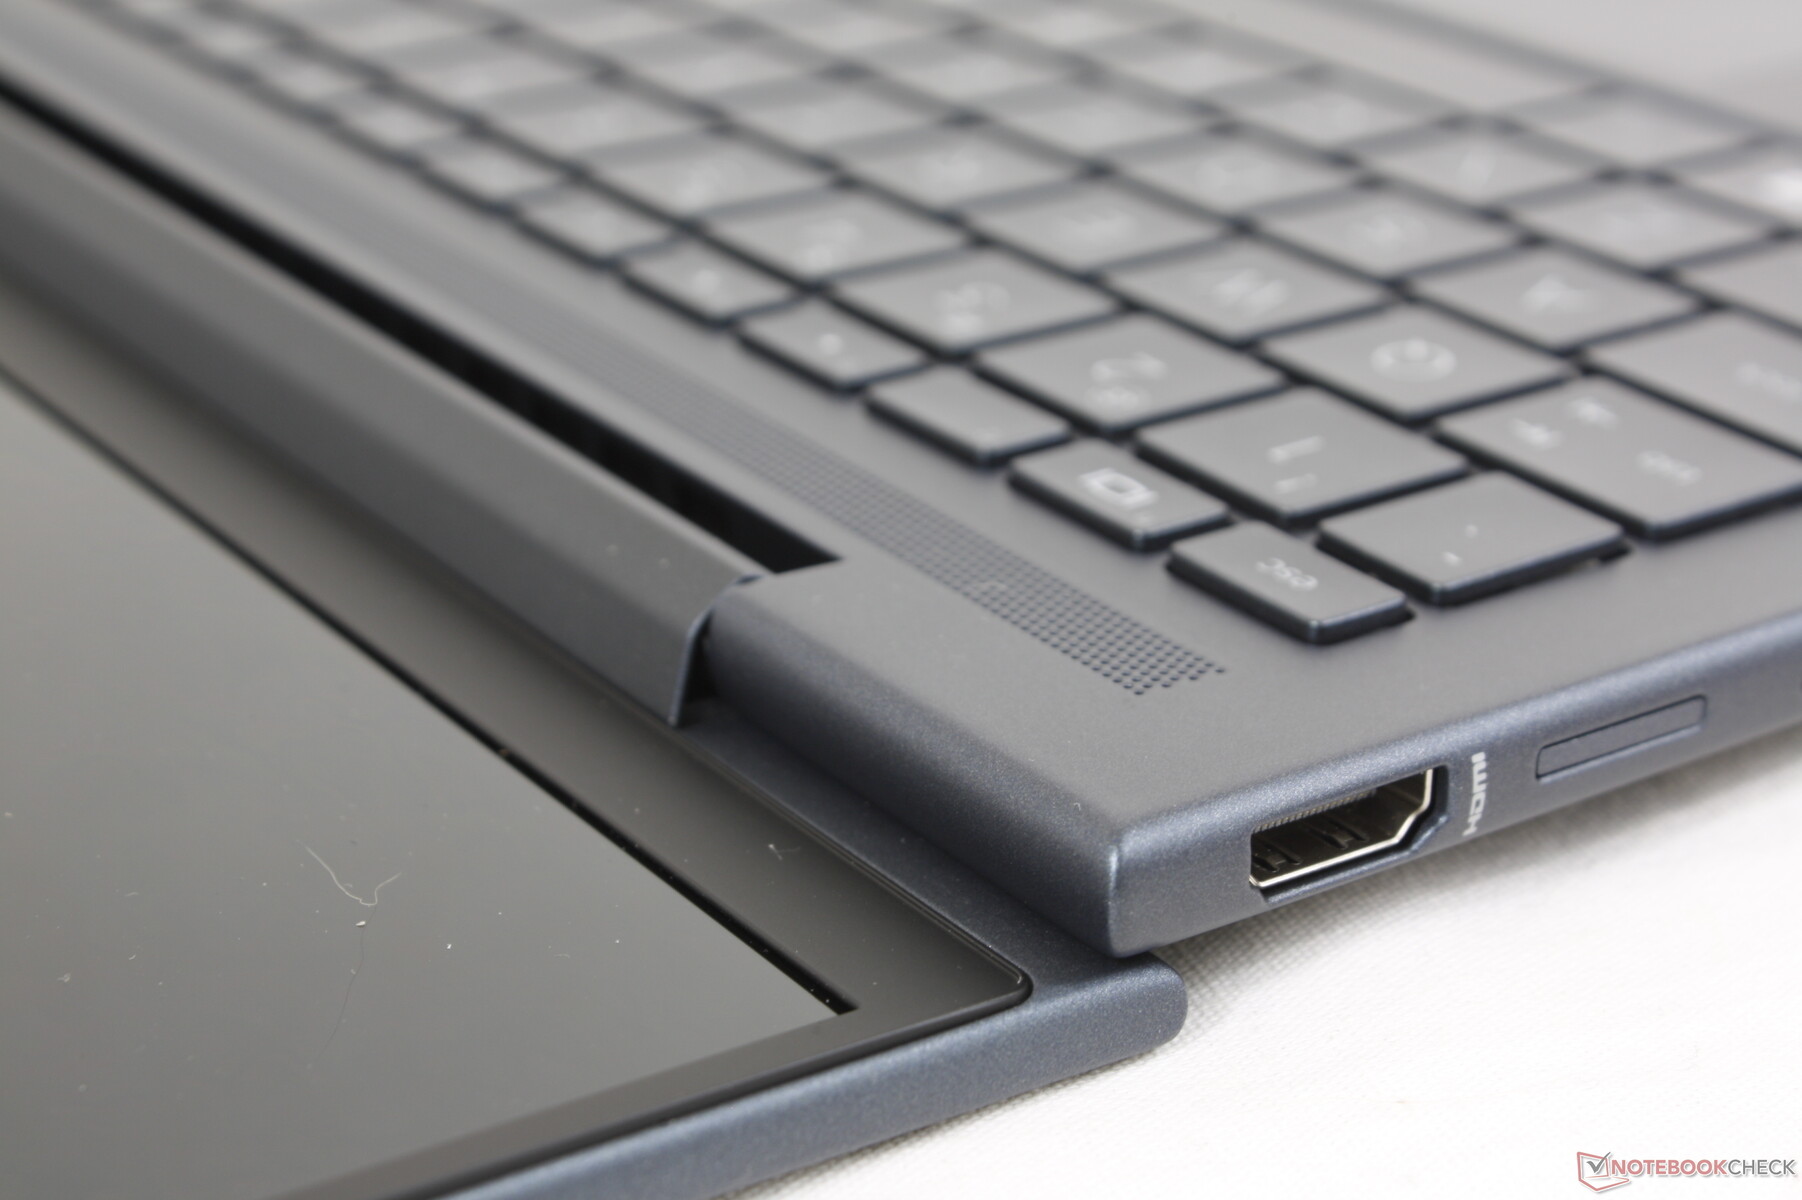
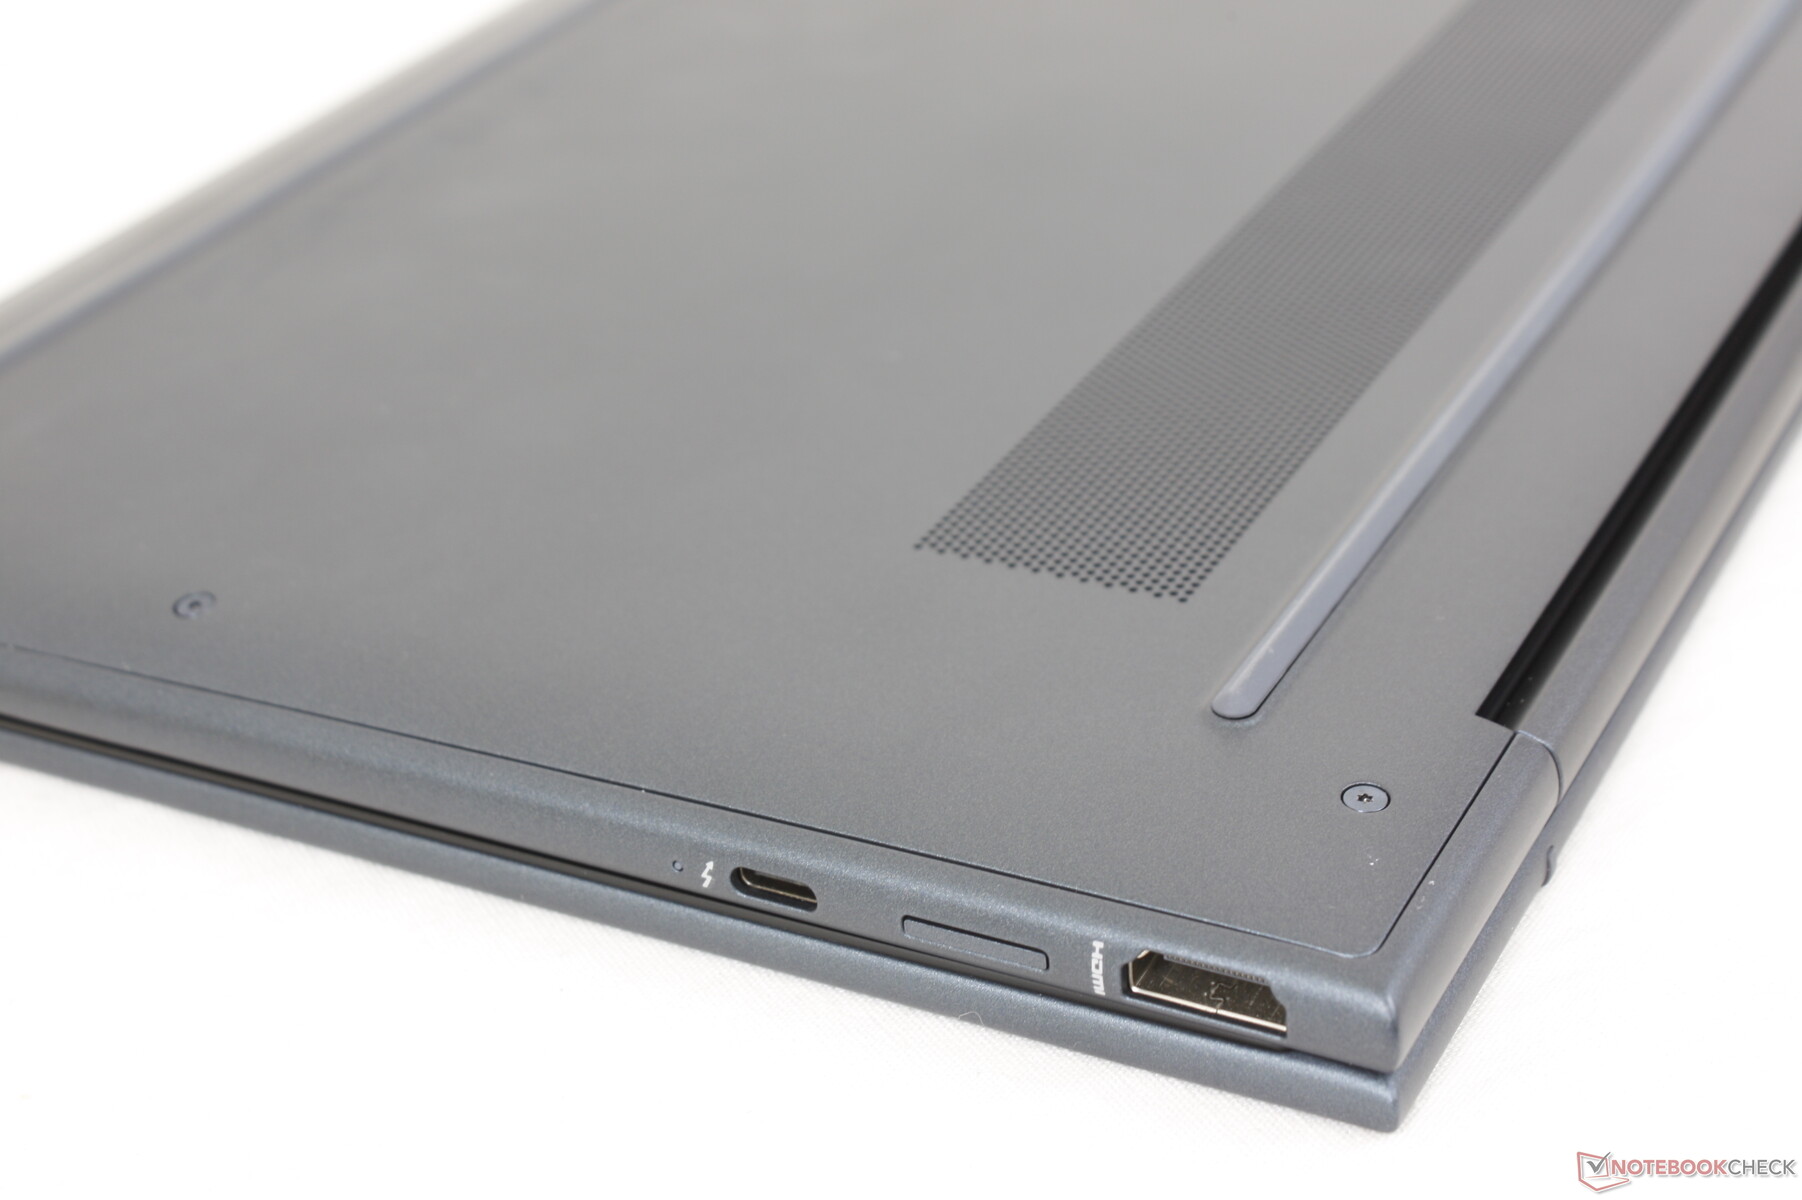
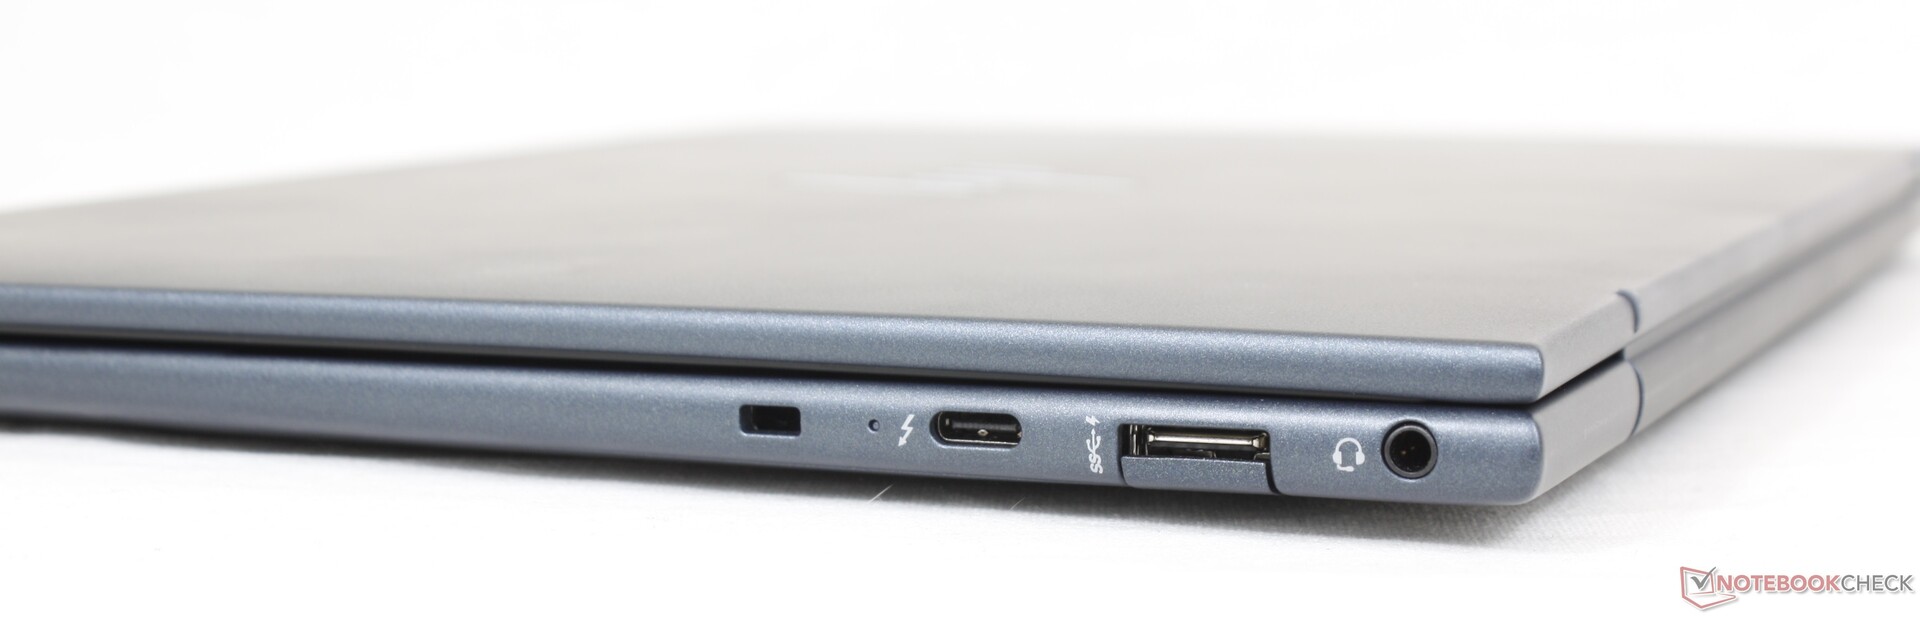
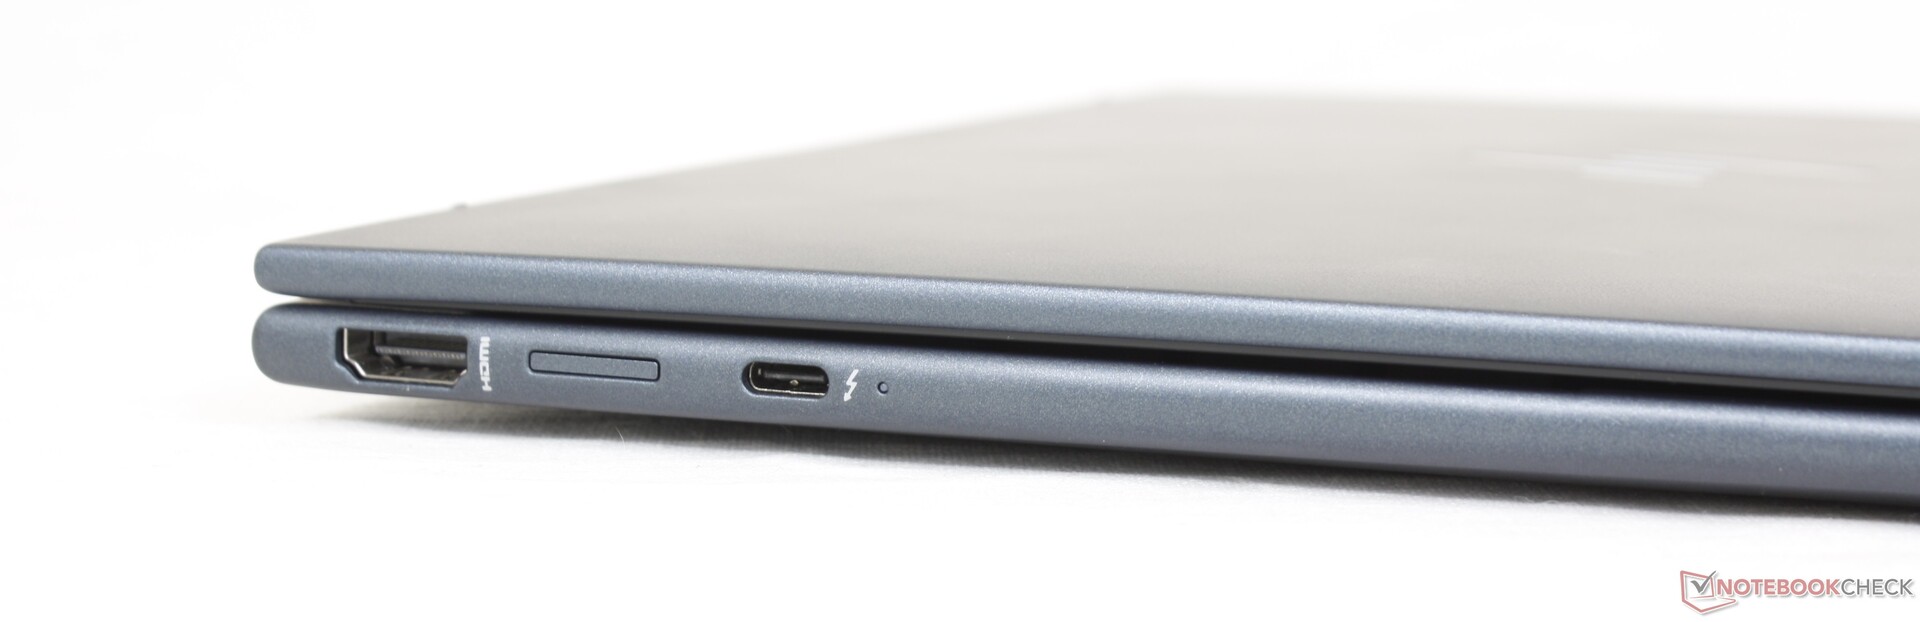
连接性 - 支持Thunderbolt 4
端口选项基本上与Dragonfly Max相同,但重新安排的效果更好。例如,两个USB-C端口,现在沿着笔记本电脑的左右边缘,而不是只沿着右边缘,以允许在笔记本电脑的任何一侧充电。
由于惠普正在推动自己的无线QuickDrop软件解决方案,所以又没有集成的SD卡读卡器。QuickDrop对智能手机来说足够好用,但依赖SD卡的专用相机用户仍然不走运。
沟通
英特尔AX211是Wi-Fi 6E和蓝牙5.2连接的标准配置。当与我们的6GHz网络配对时,我们经历了出色的接收传输率,但传输率可以更稳定。
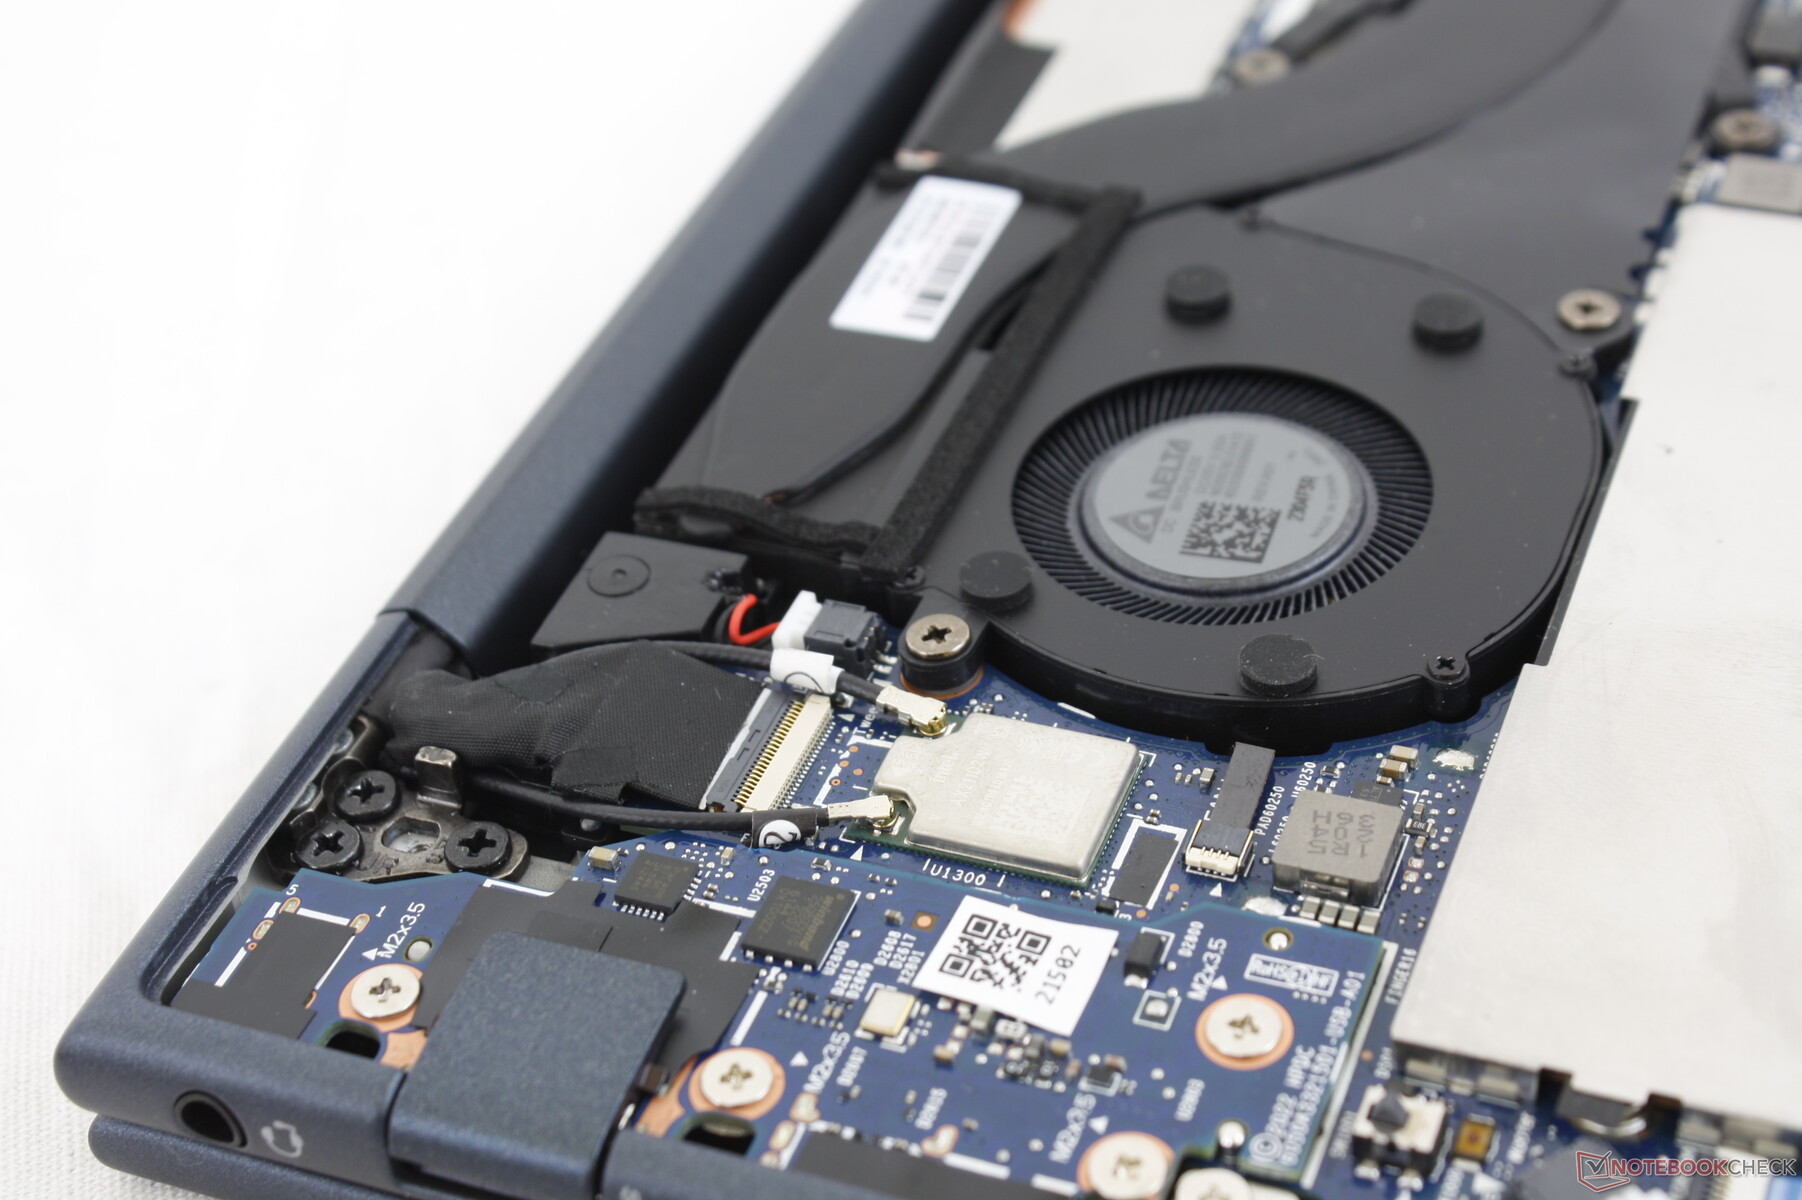
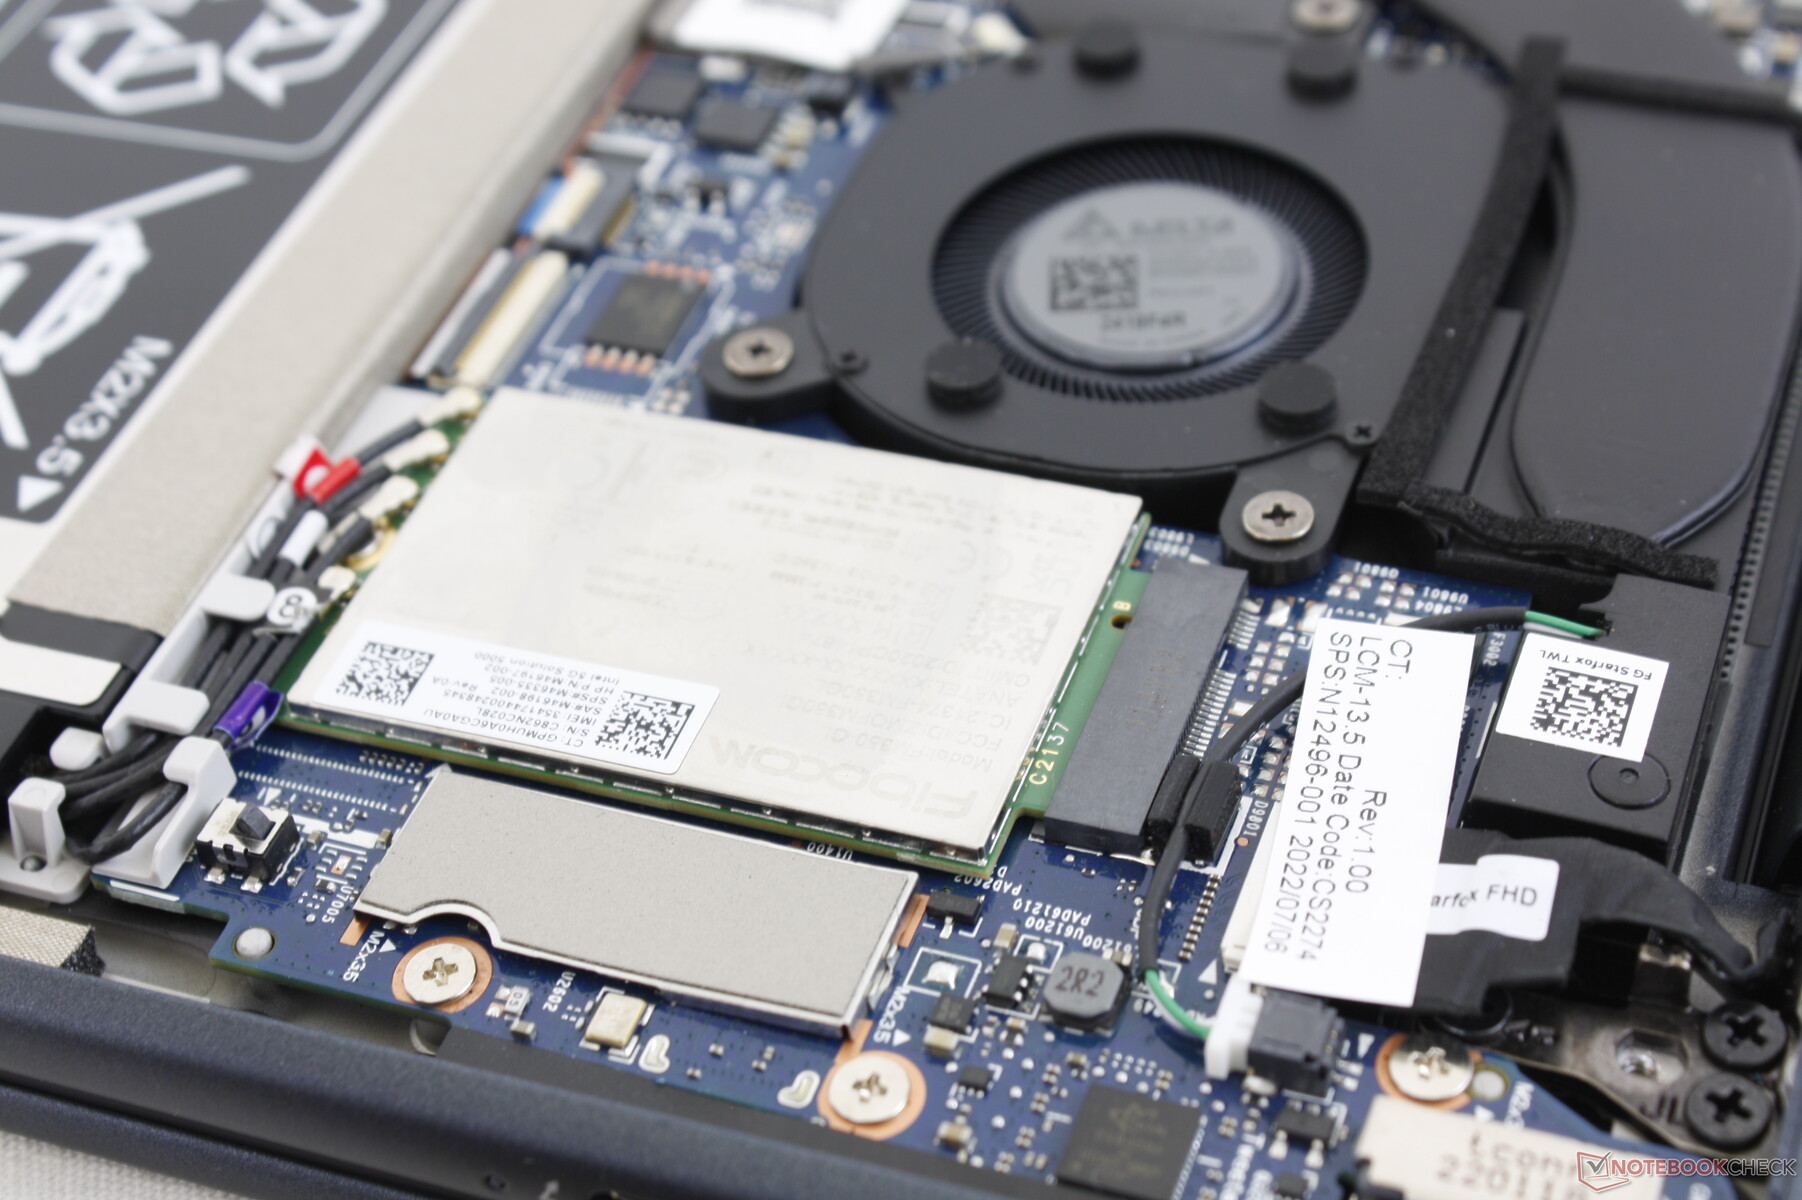
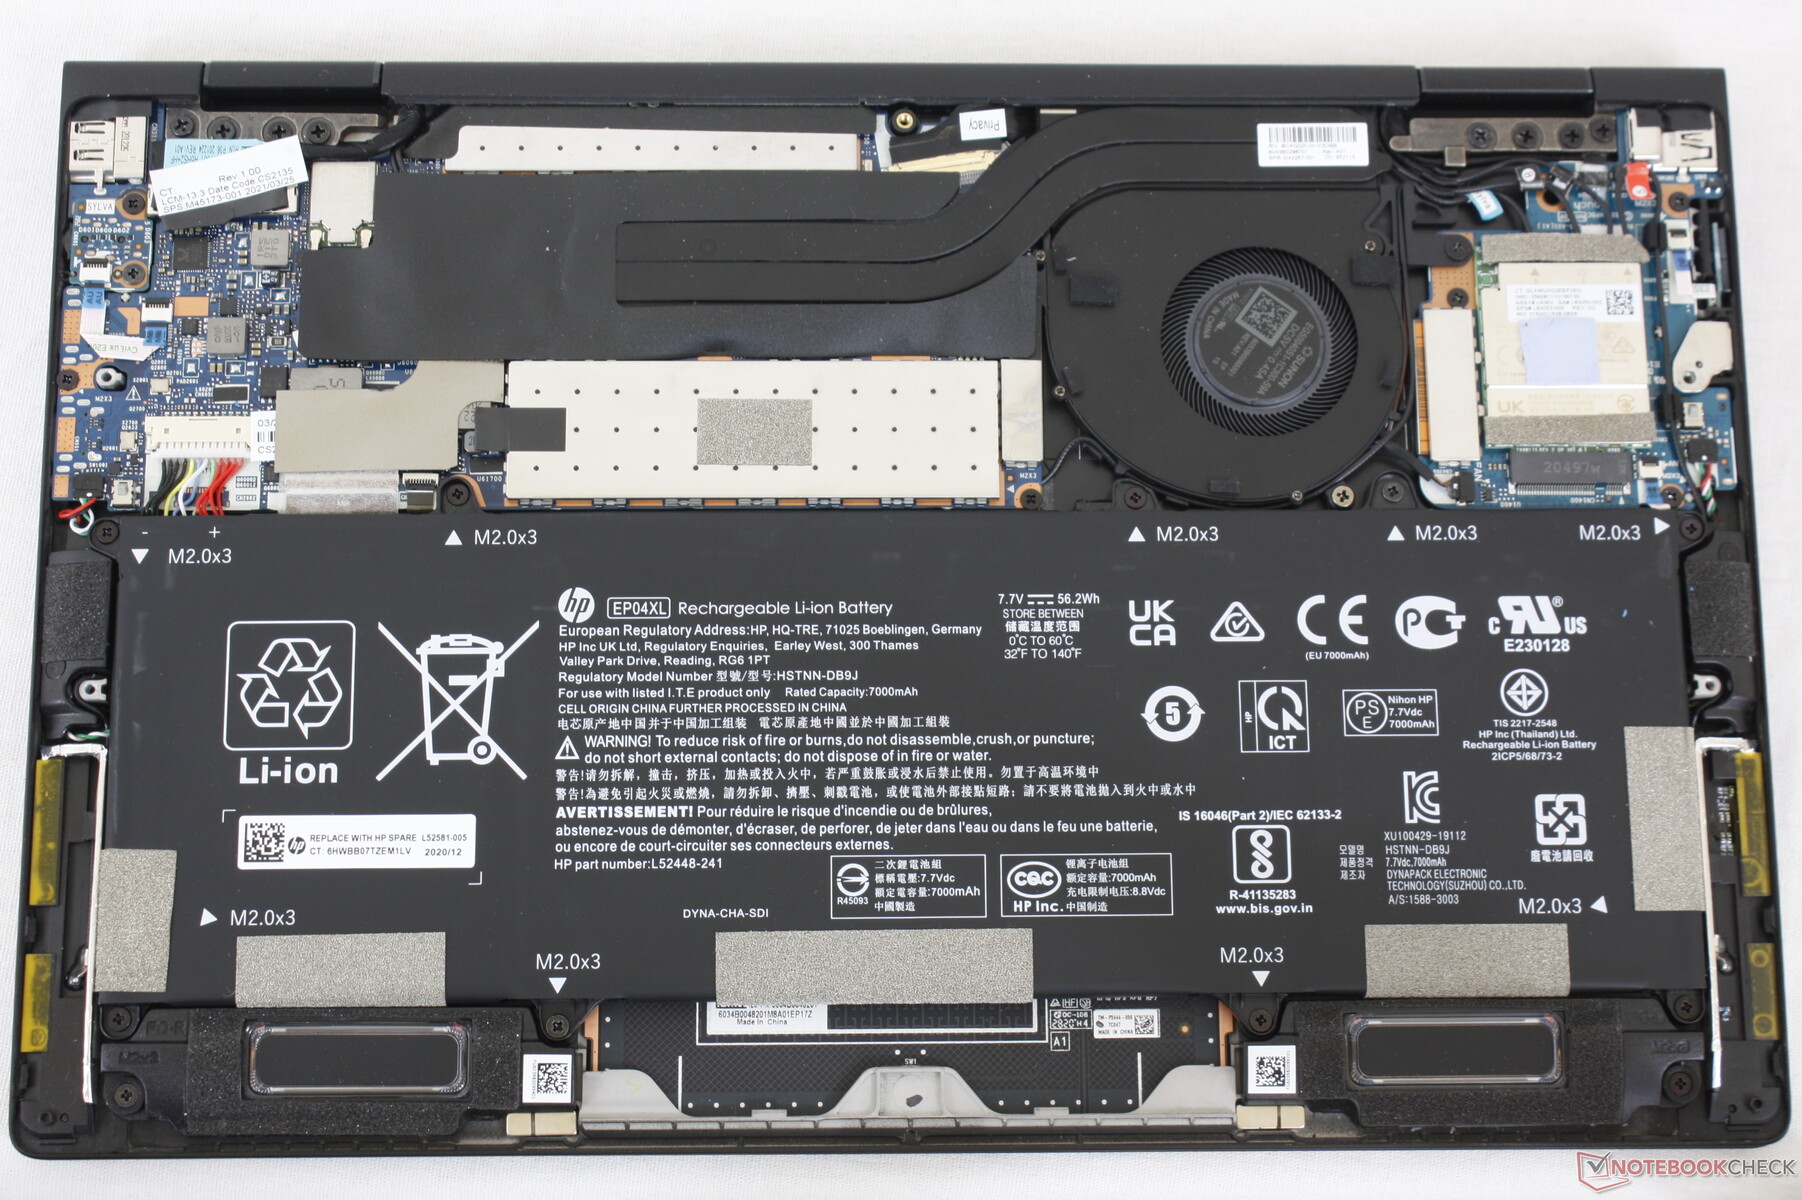
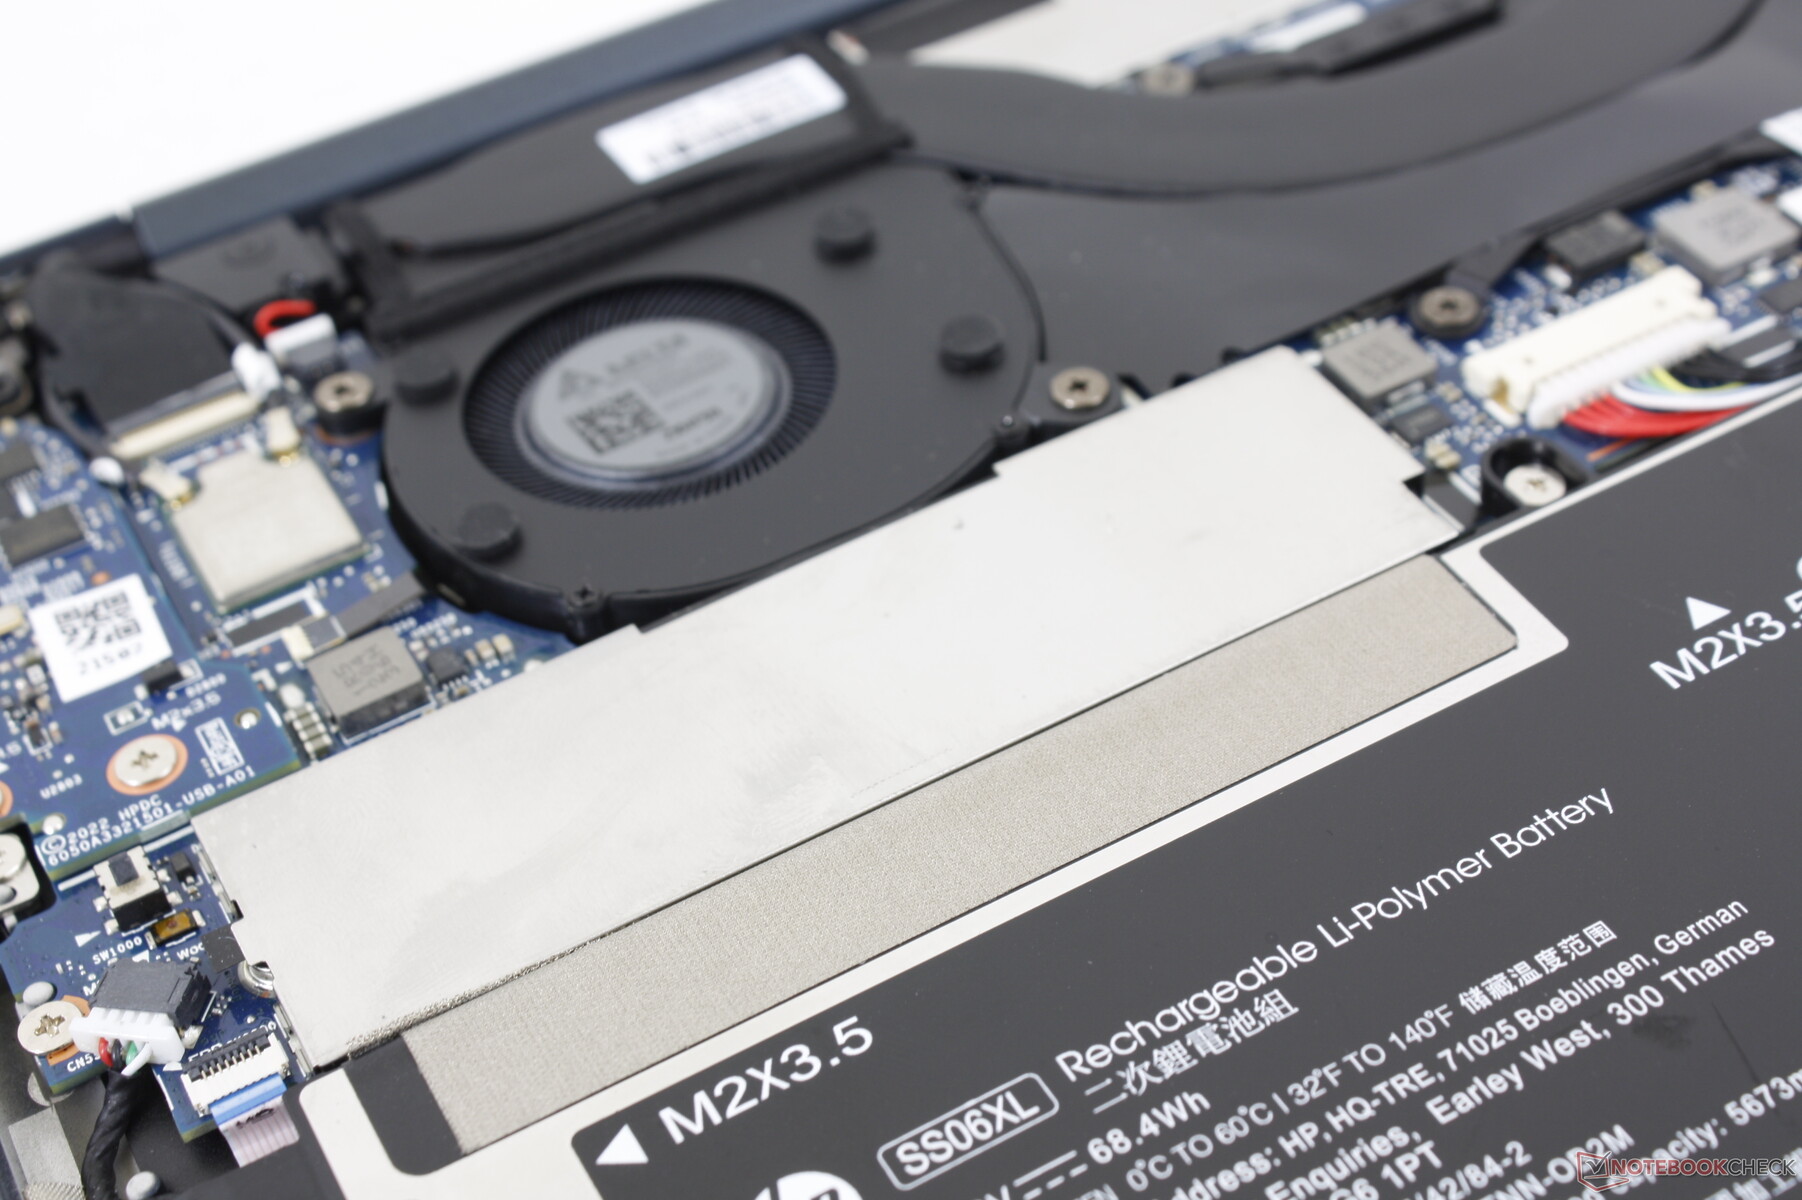
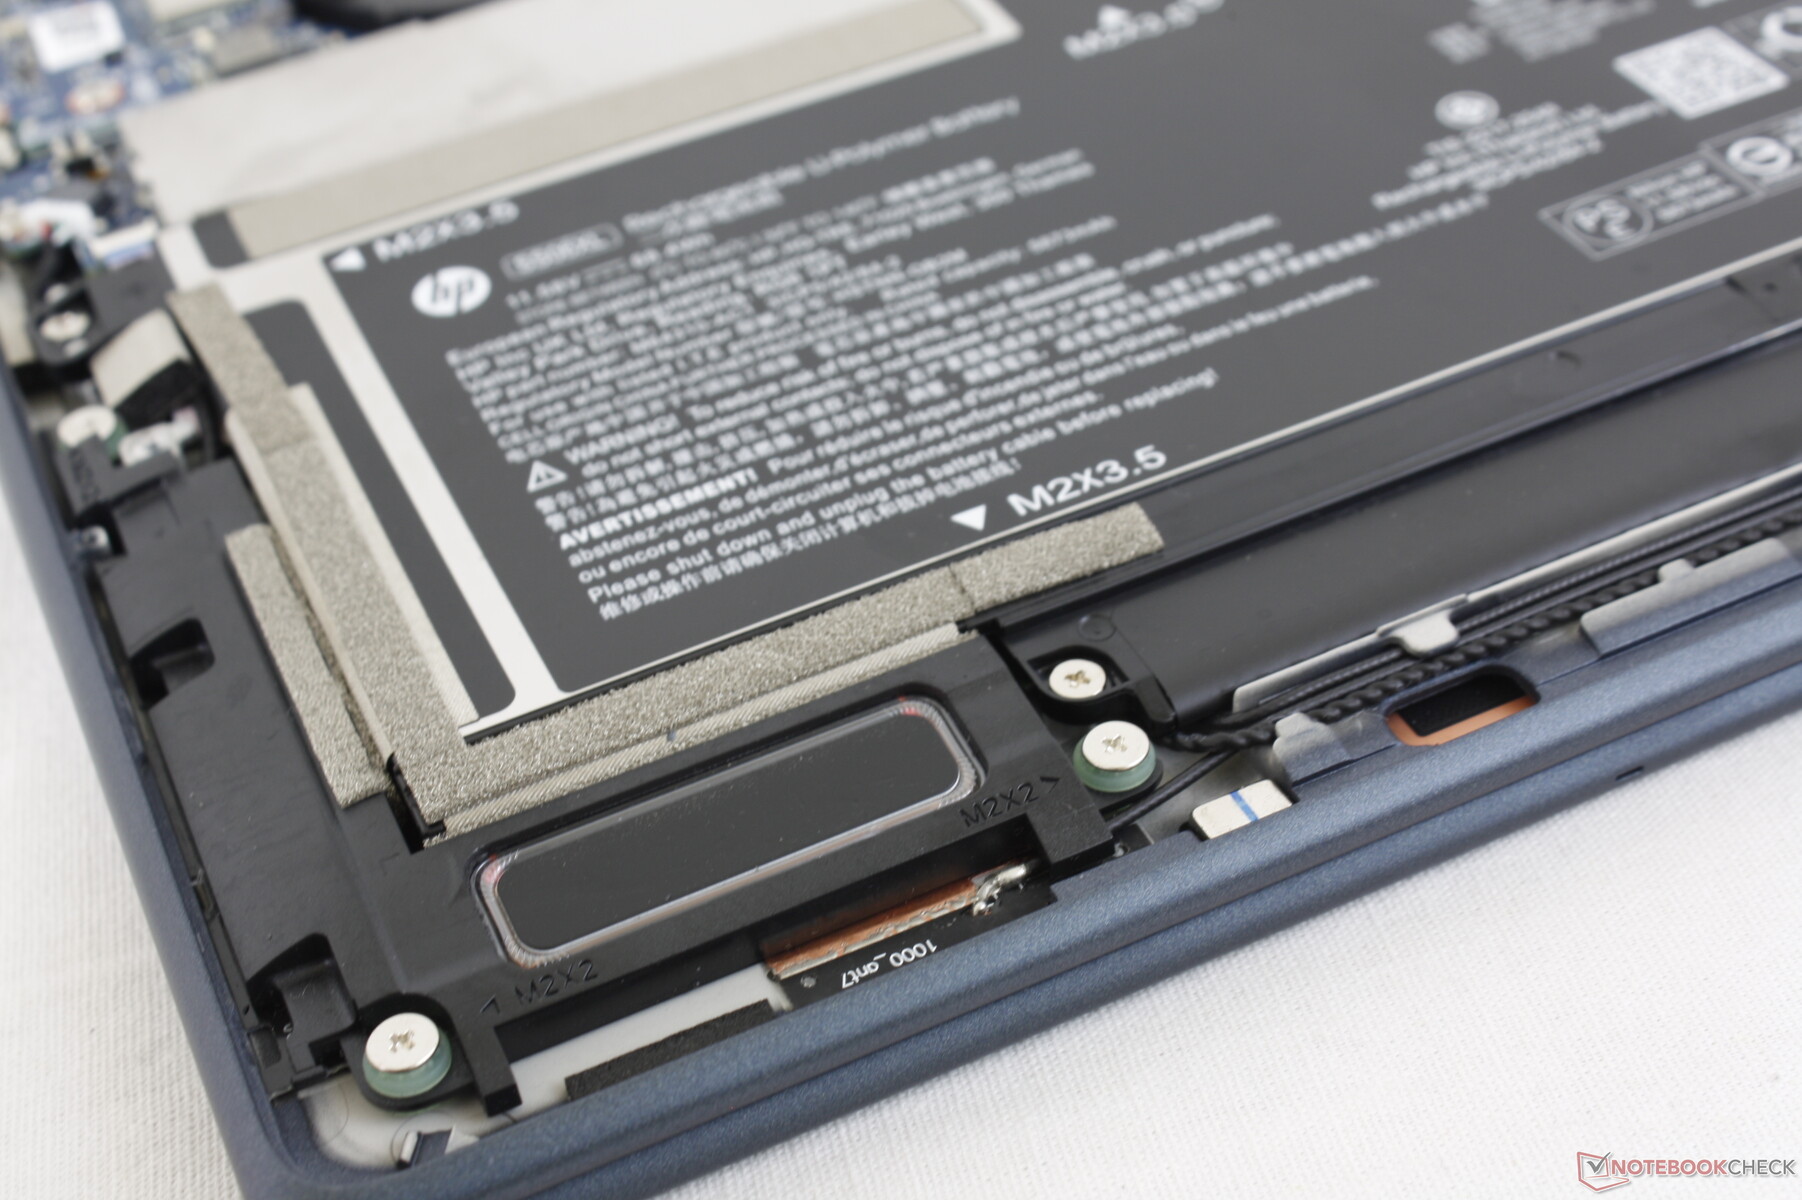
英特尔XMM 7560 R+或5G 5000 WWAN模块是可选的。WWAN模块是可拆卸的,而WLAN模块不是,如下图所示。
| Networking | |
| iperf3 transmit AX12 | |
| Lenovo ThinkPad X1 Titanium Yoga G1 20QA001RGE | |
| HP Spectre x360 14t-ea000 | |
| HP EliteBook Folio 13.5-3G2L2EA | |
| iperf3 receive AX12 | |
| Lenovo ThinkPad X1 Titanium Yoga G1 20QA001RGE | |
| HP Spectre x360 14t-ea000 | |
| HP EliteBook Folio 13.5-3G2L2EA | |
| iperf3 receive AXE11000 6GHz | |
| Dell XPS 13 Plus 9320 i5-1240p | |
| Framework Laptop 13.5 12th Gen Intel | |
| HP Elite Dragonfly G3 | |
| iperf3 transmit AXE11000 6GHz | |
| Framework Laptop 13.5 12th Gen Intel | |
| HP Elite Dragonfly G3 | |
| Dell XPS 13 Plus 9320 i5-1240p | |
网络摄像头 - 5MP标准
尽管去年的Dragonfly Max也配备了一个500万像素的网络摄像头,但Dragonfly G3上的摄像头明显更清晰,整体上更明亮,是我们在任何笔记本电脑上看到的最好的集成网络摄像头之一,无论屏幕大小如何。快门和红外都是为了保护隐私和支持你好而存在的。


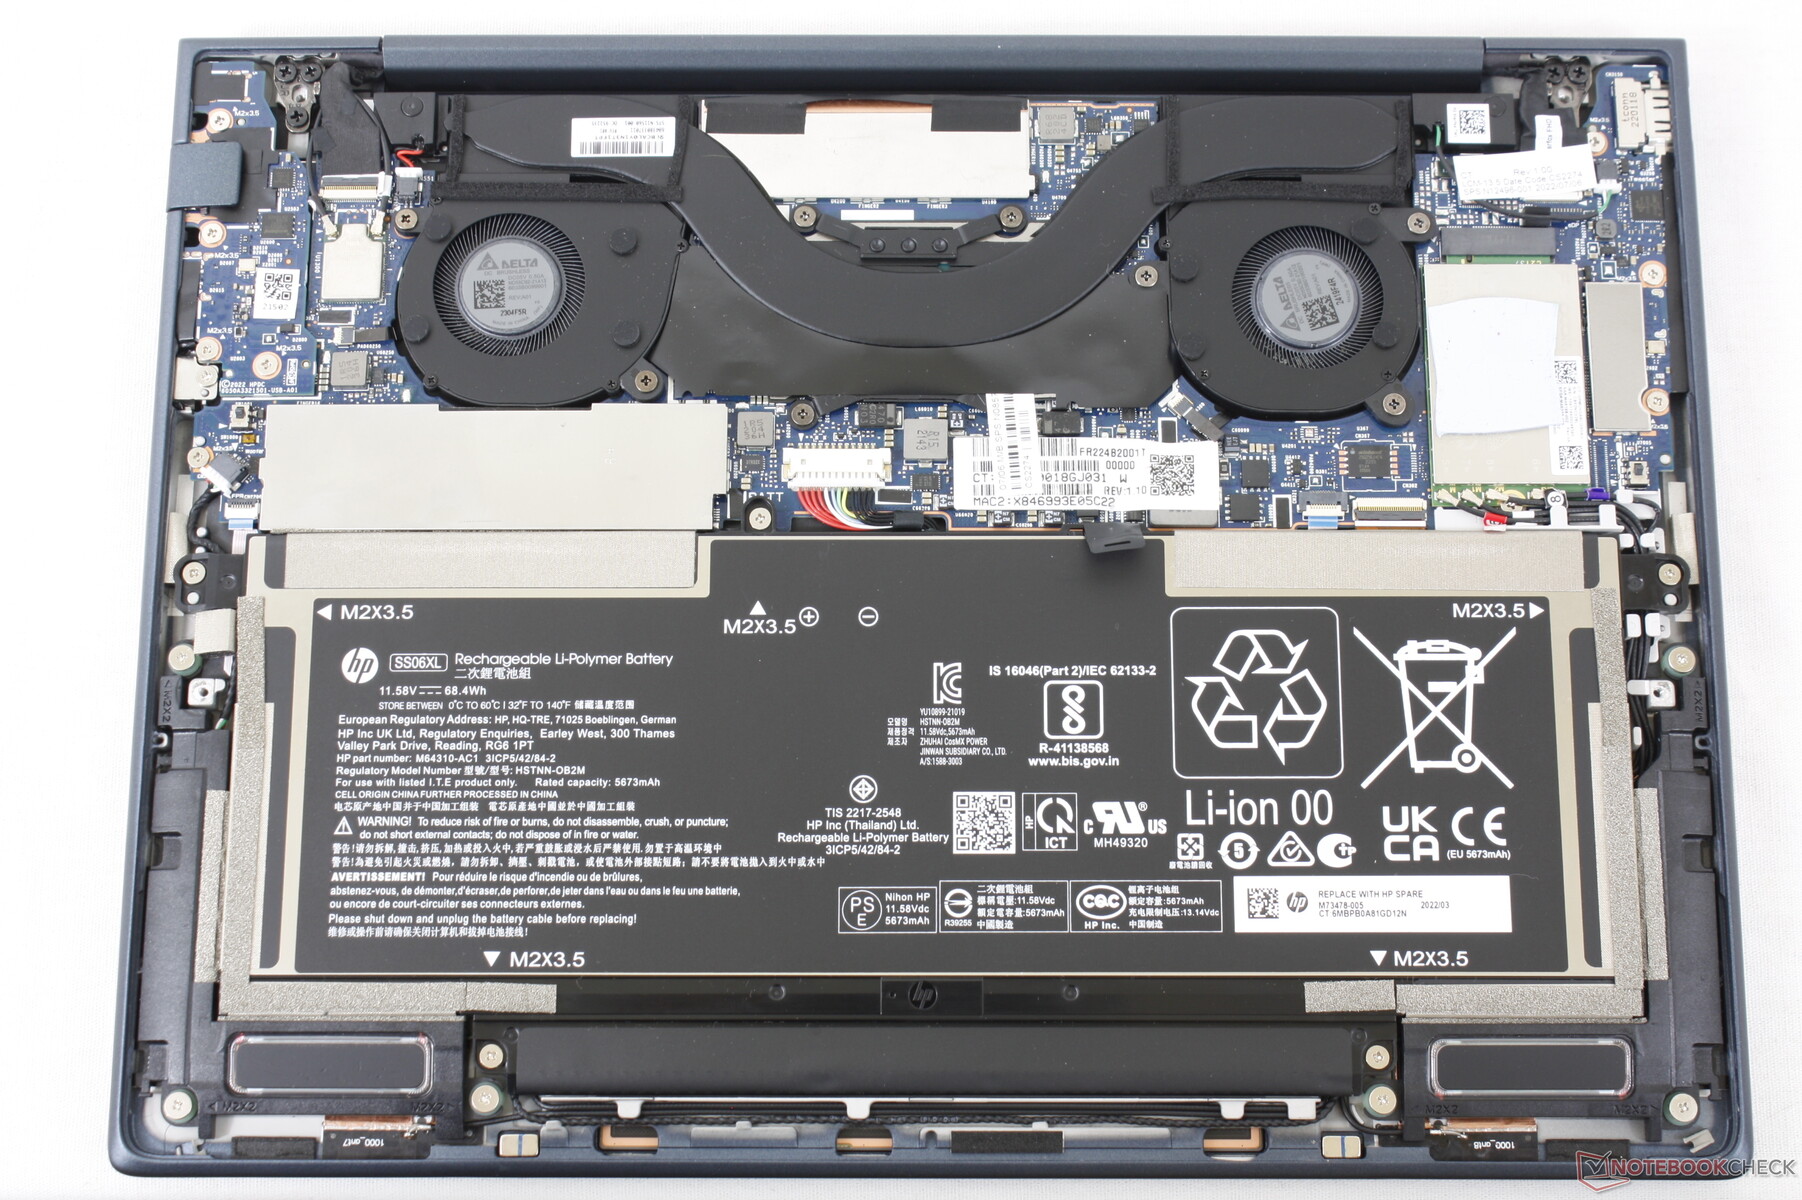
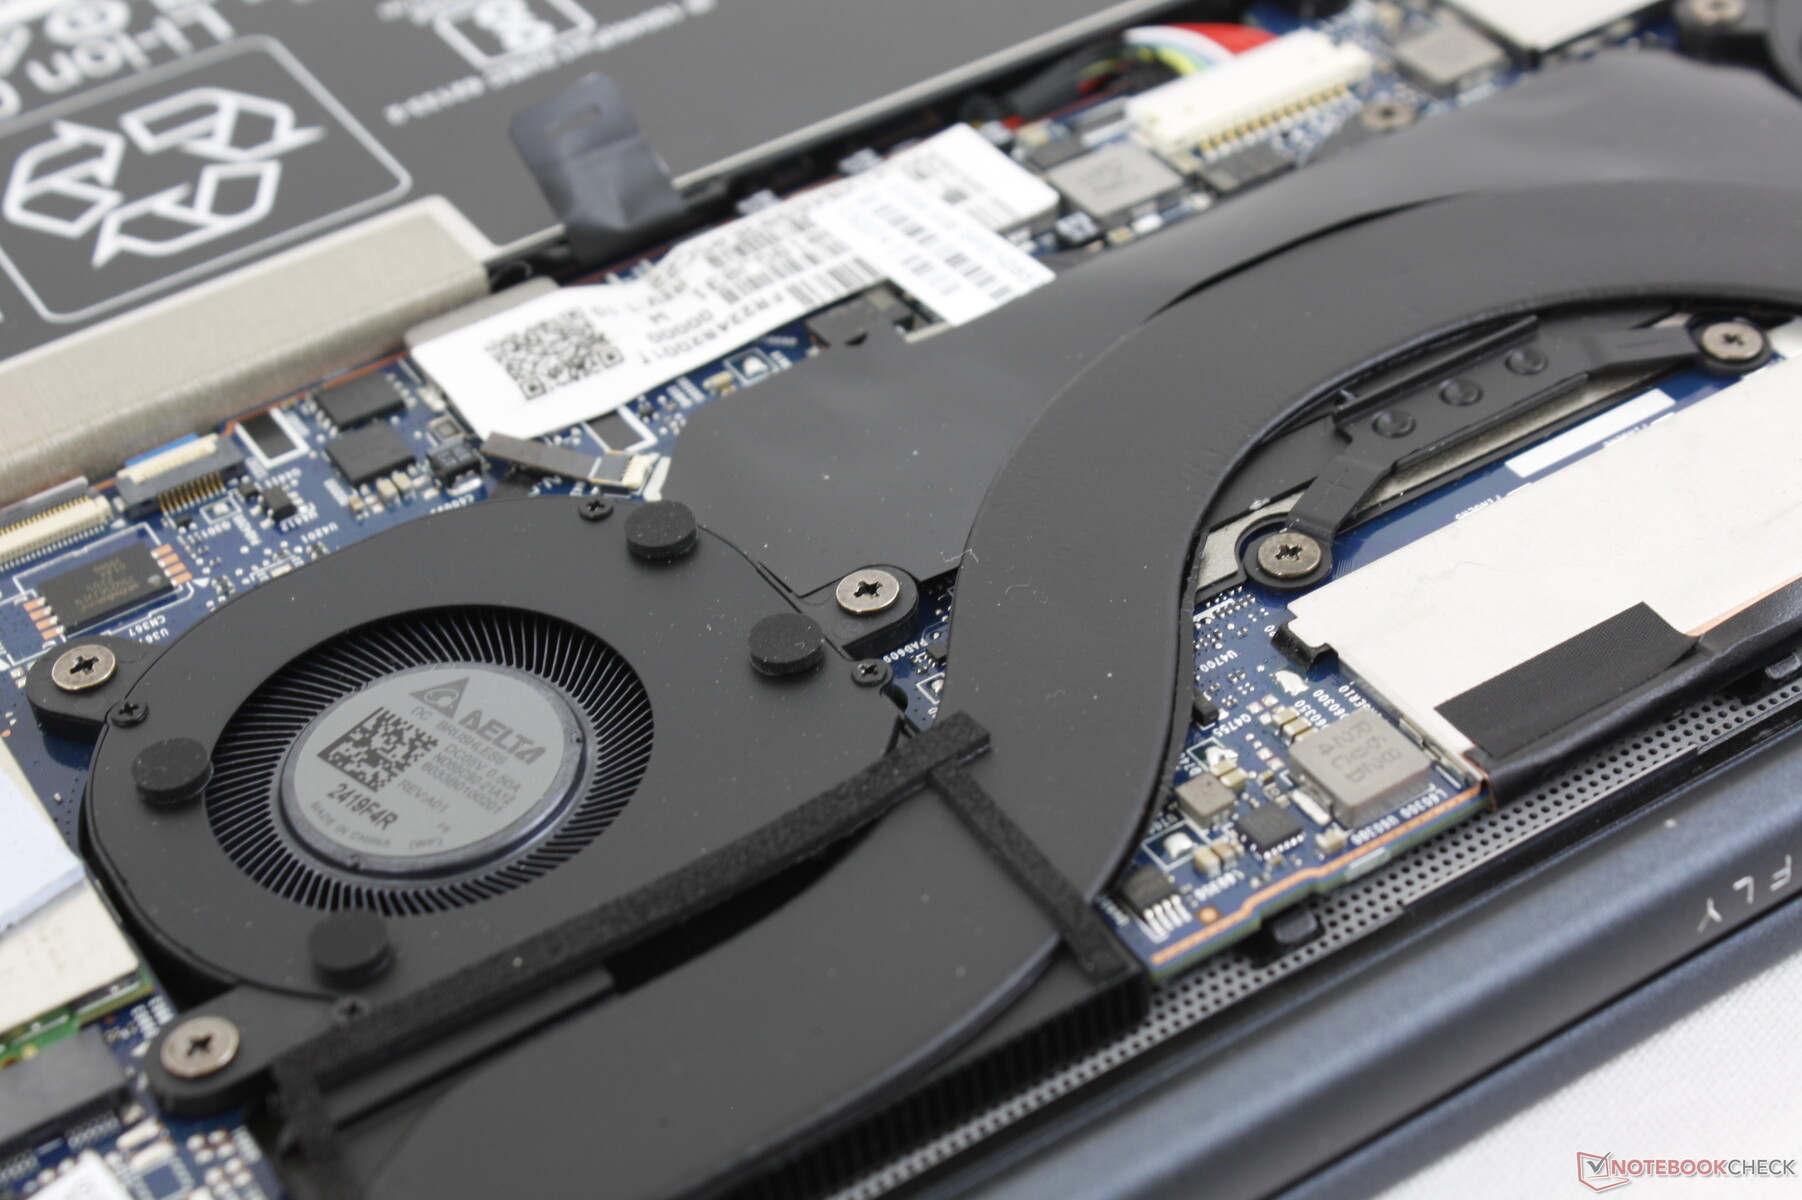
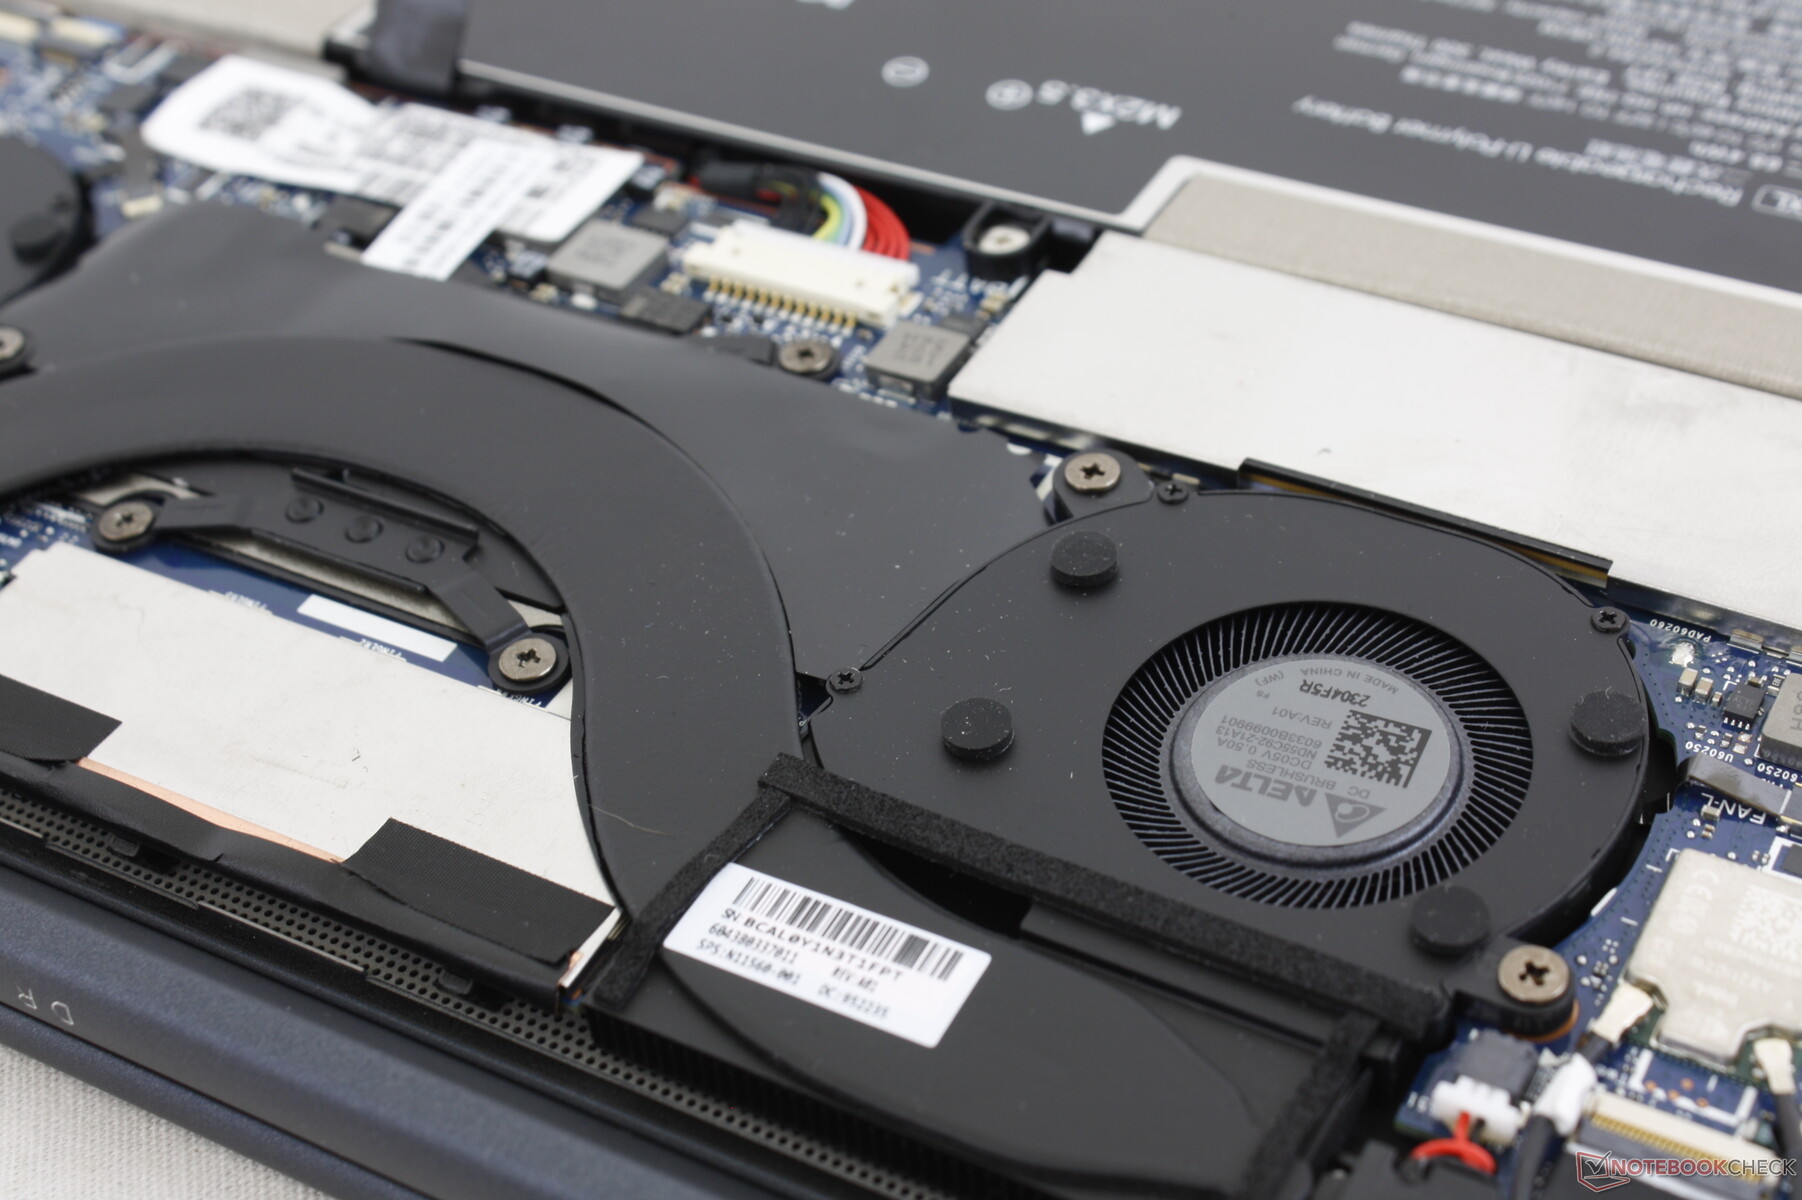
维护
底部面板仅由四颗可触及的T5 Torx螺丝固定,便于维修。用户可以根据需要更换电池、M.2 WWAN或M.2 SSD,而内存模块是固定的。
配件和保修
除了交流电适配器和文件之外,盒子里没有任何额外的东西。如果能有一个类似于某些Spectre机型所配备的手提箱就更好了。
如果在美国购买,基本的一年有限制造商保修是标准的。我们发现这很令人失望,因为蜻蜓是惠普的旗舰商务笔记本之一,预计会有3年的基本保修。例如,戴尔Latitude 7330,有一个3年的保修期,没有额外的费用。
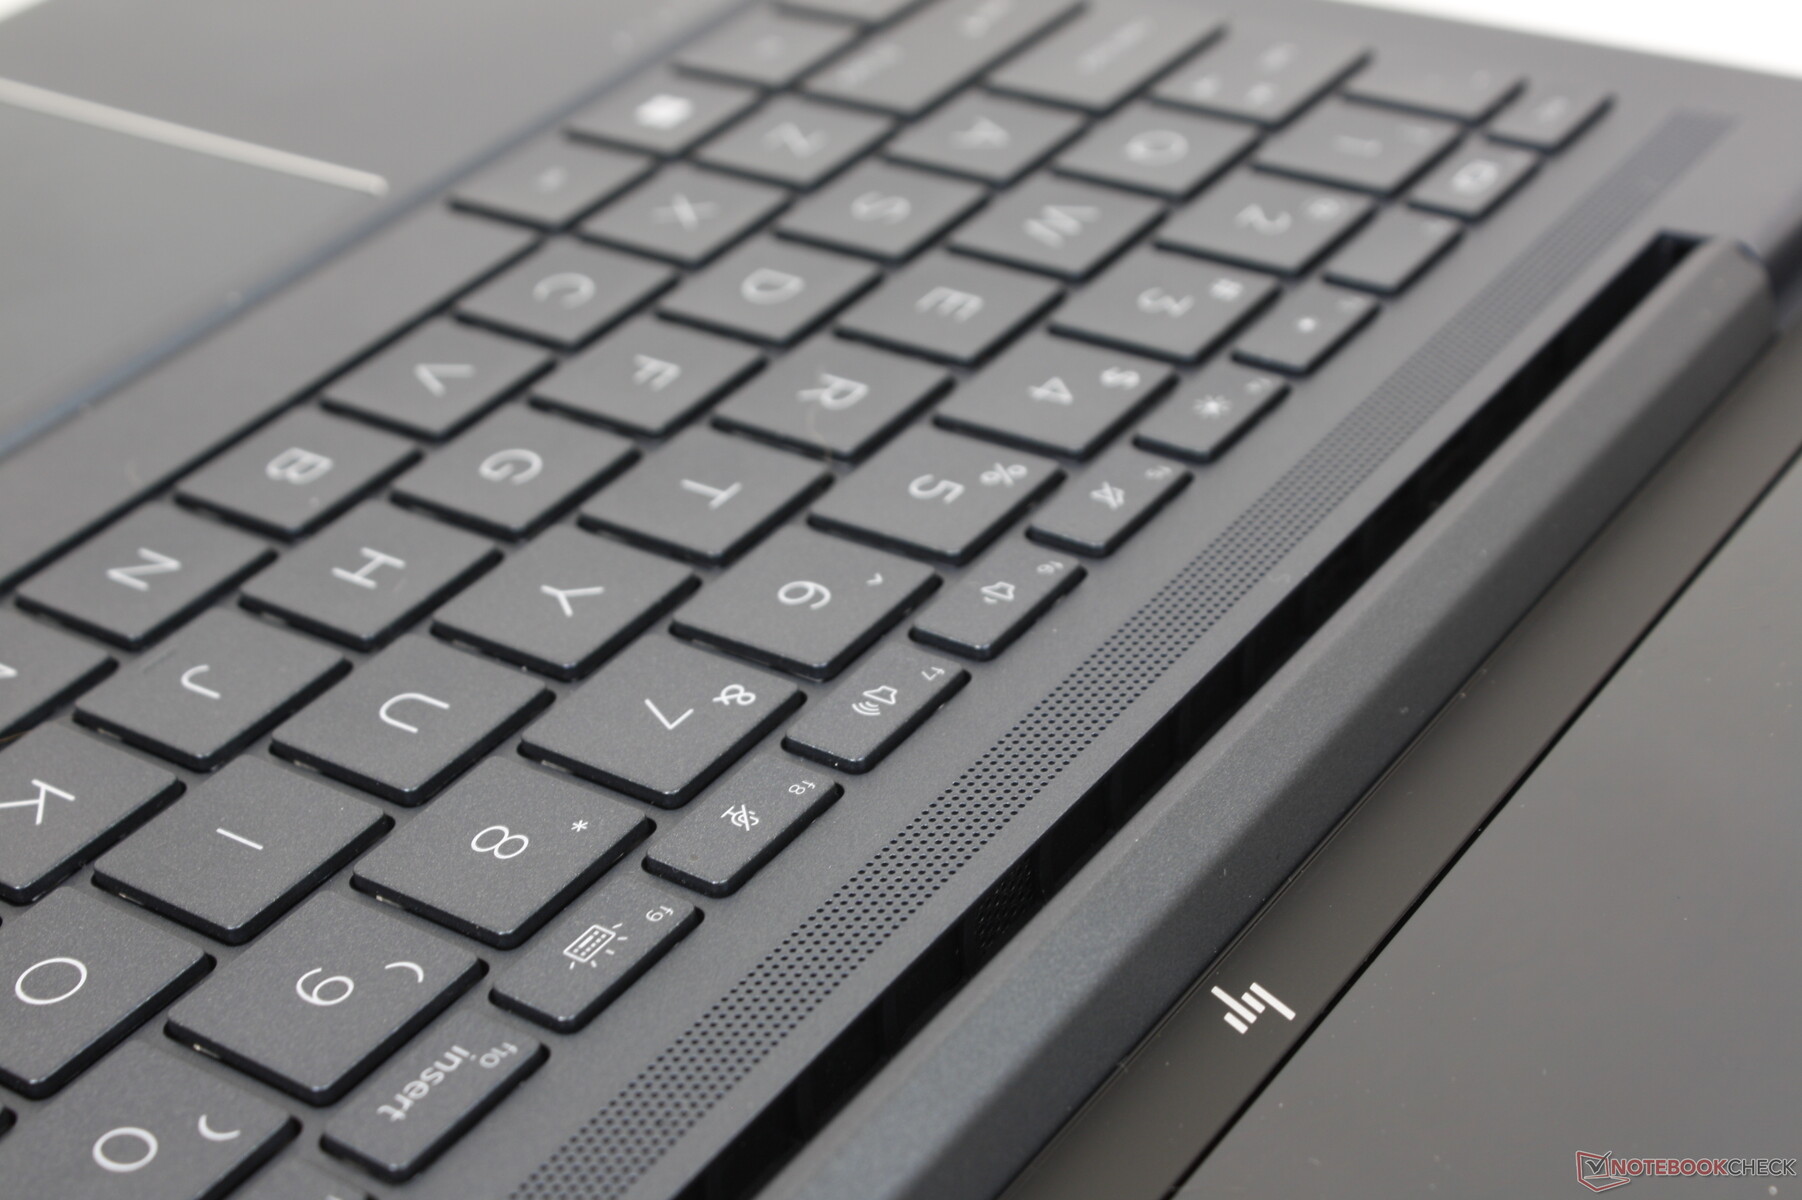
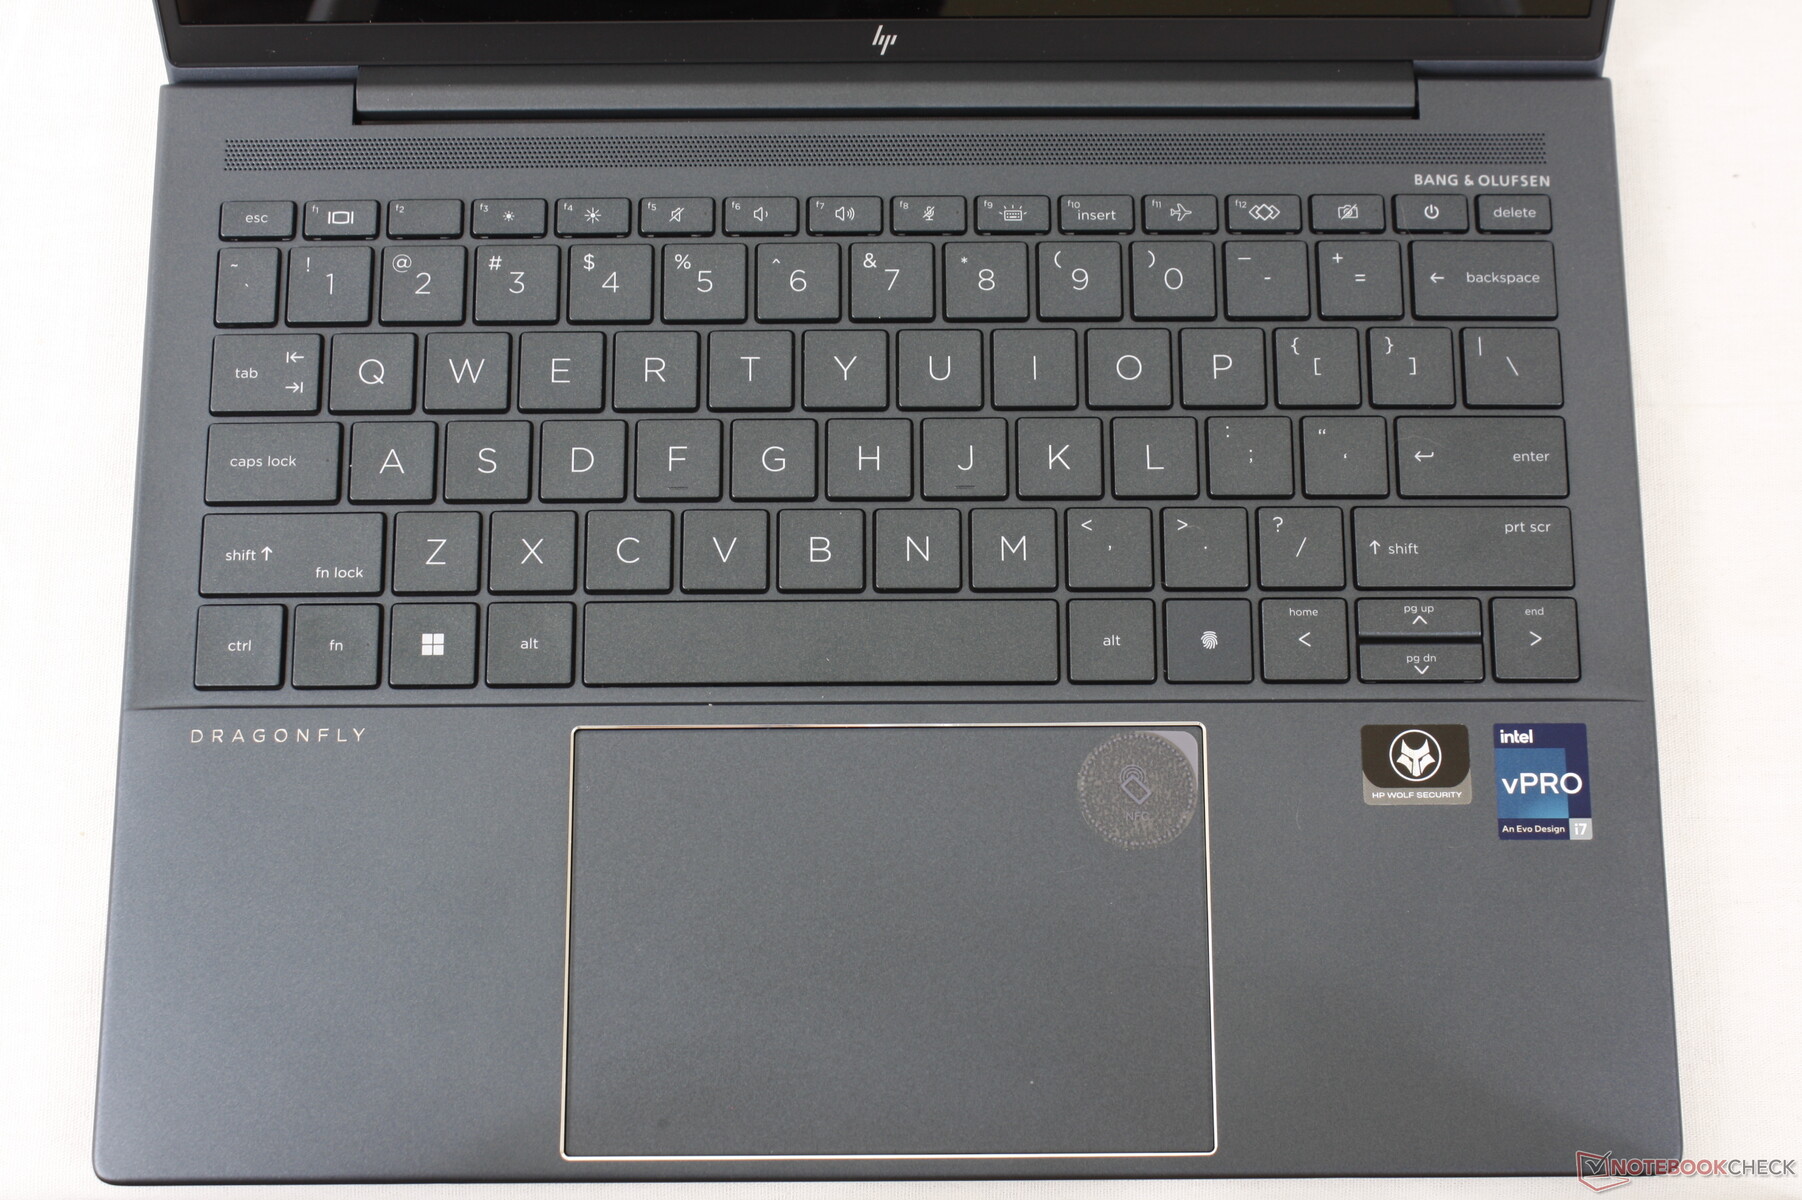
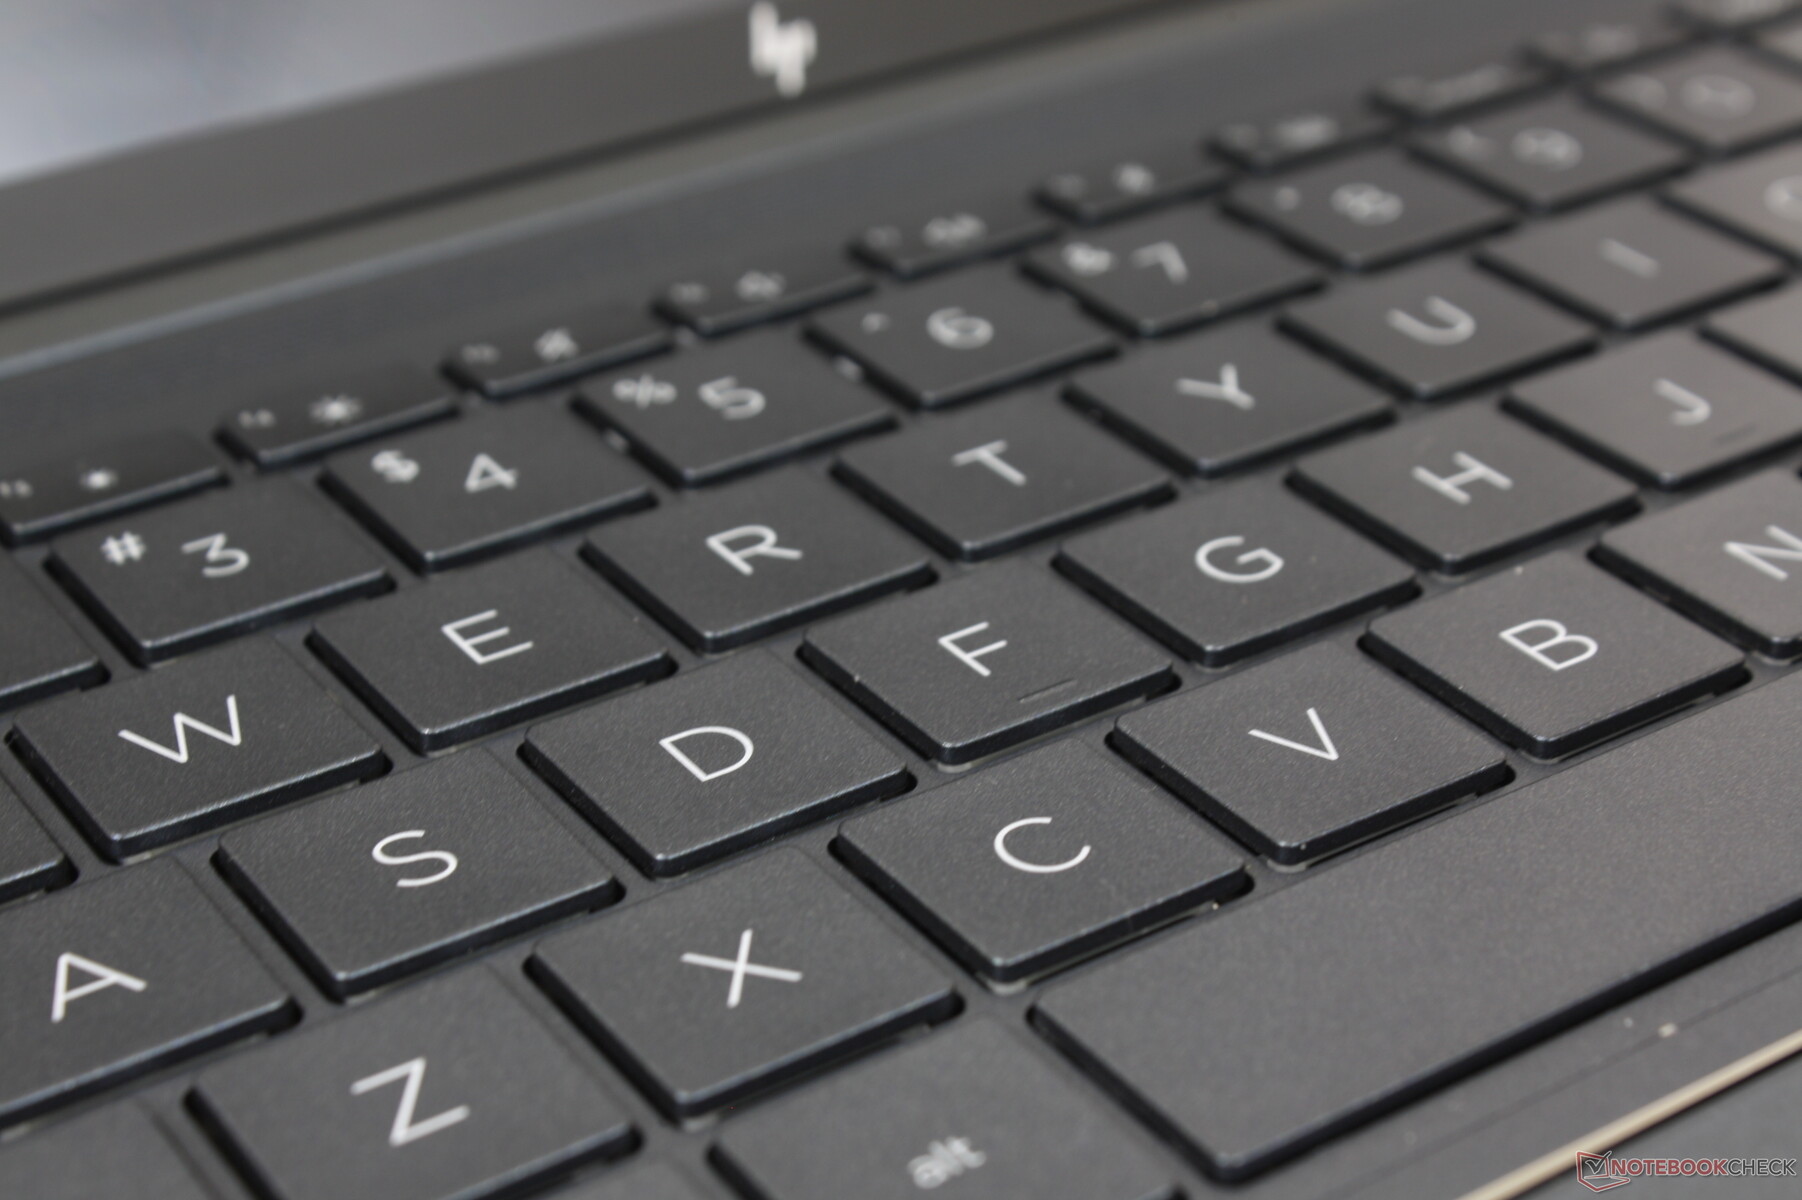
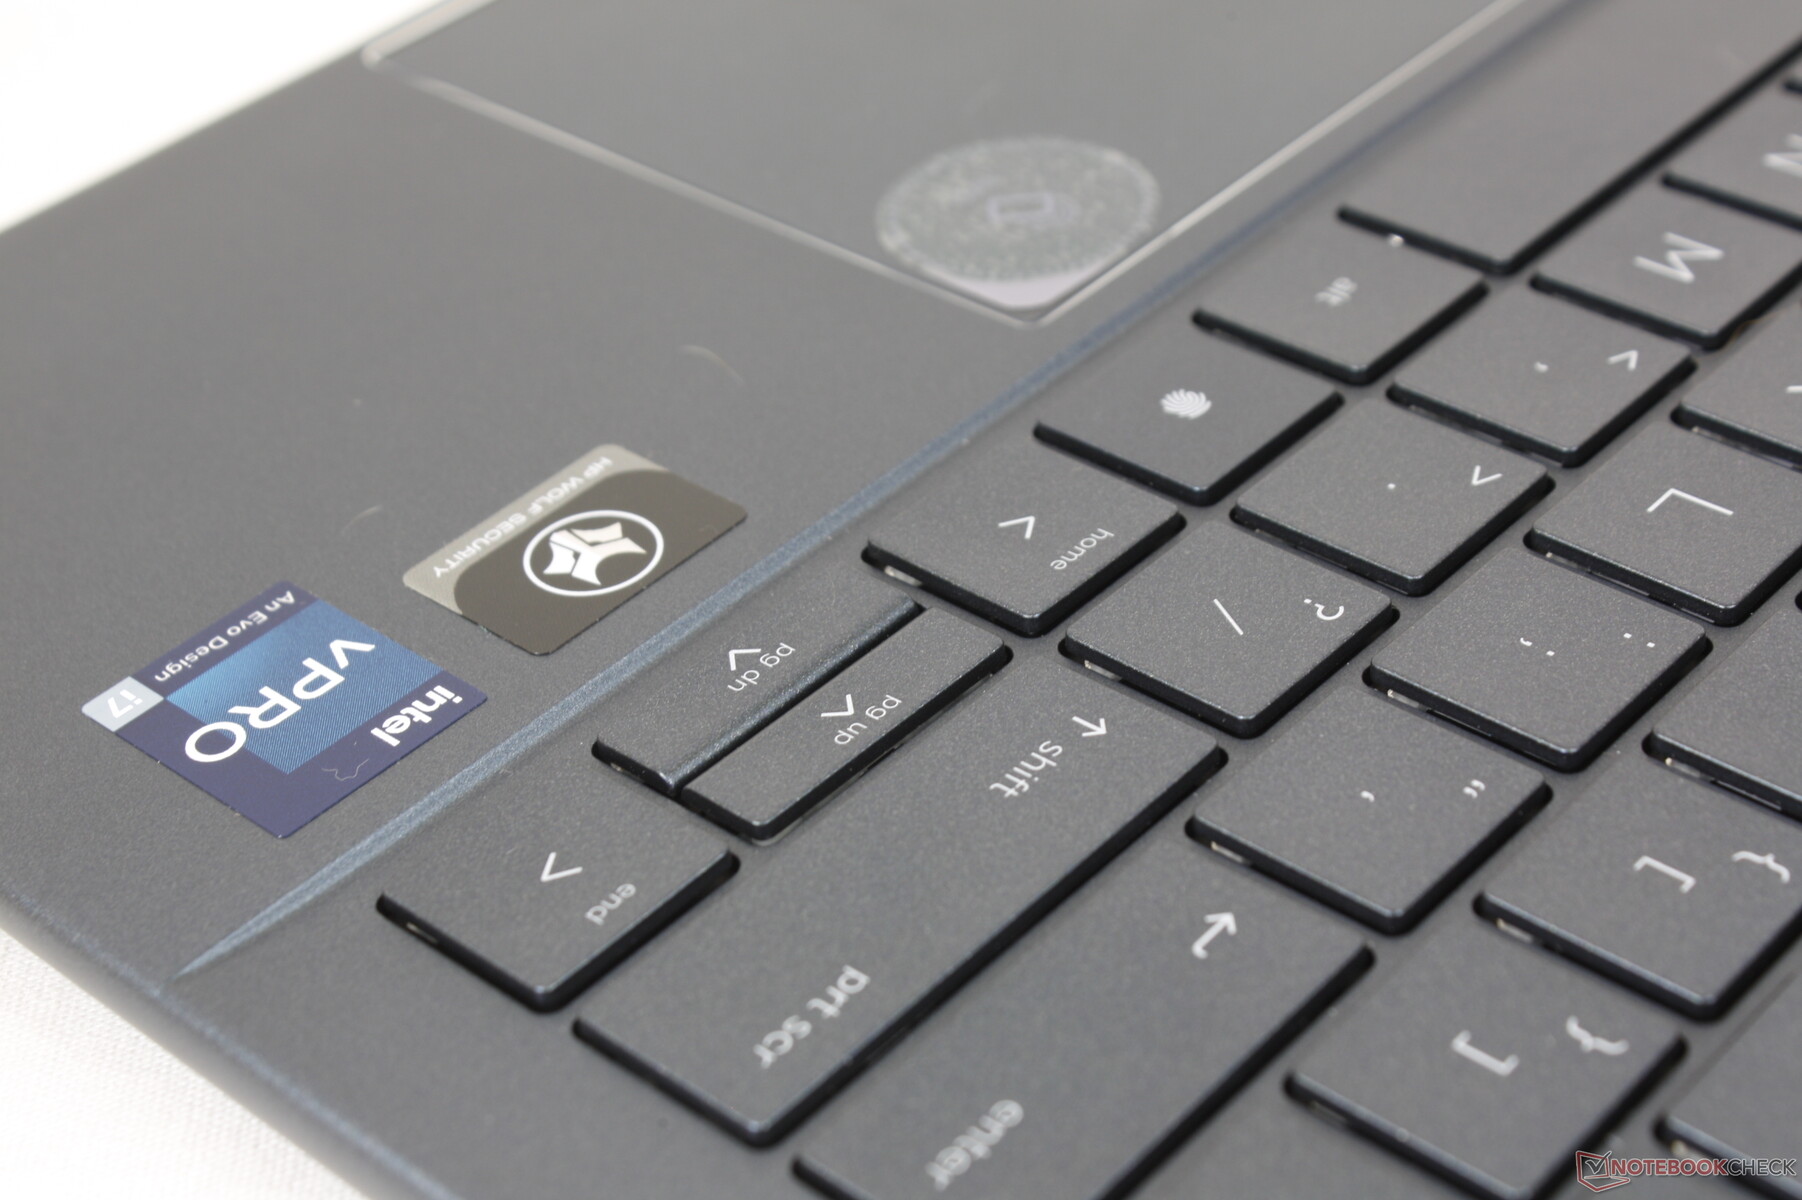
输入设备--更大的字母,更大的点击板
键盘
Spectre和EliteBook/Dragonfly型号之间的打字体验几乎是相同的。如果你以前在Spectre笔记本上打过字,那么你就会知道对Dragonfly G3的期待。反馈很敏锐,而且似乎比ThinkPad X1 Nano Gen 2的行程更深。 狭窄的上下键可能是键盘最糟糕的部分。
如果配置了Sure View,F2键将有一个切换选项用于显示。否则,该键将没有辅助功能,如我们的下图所示。
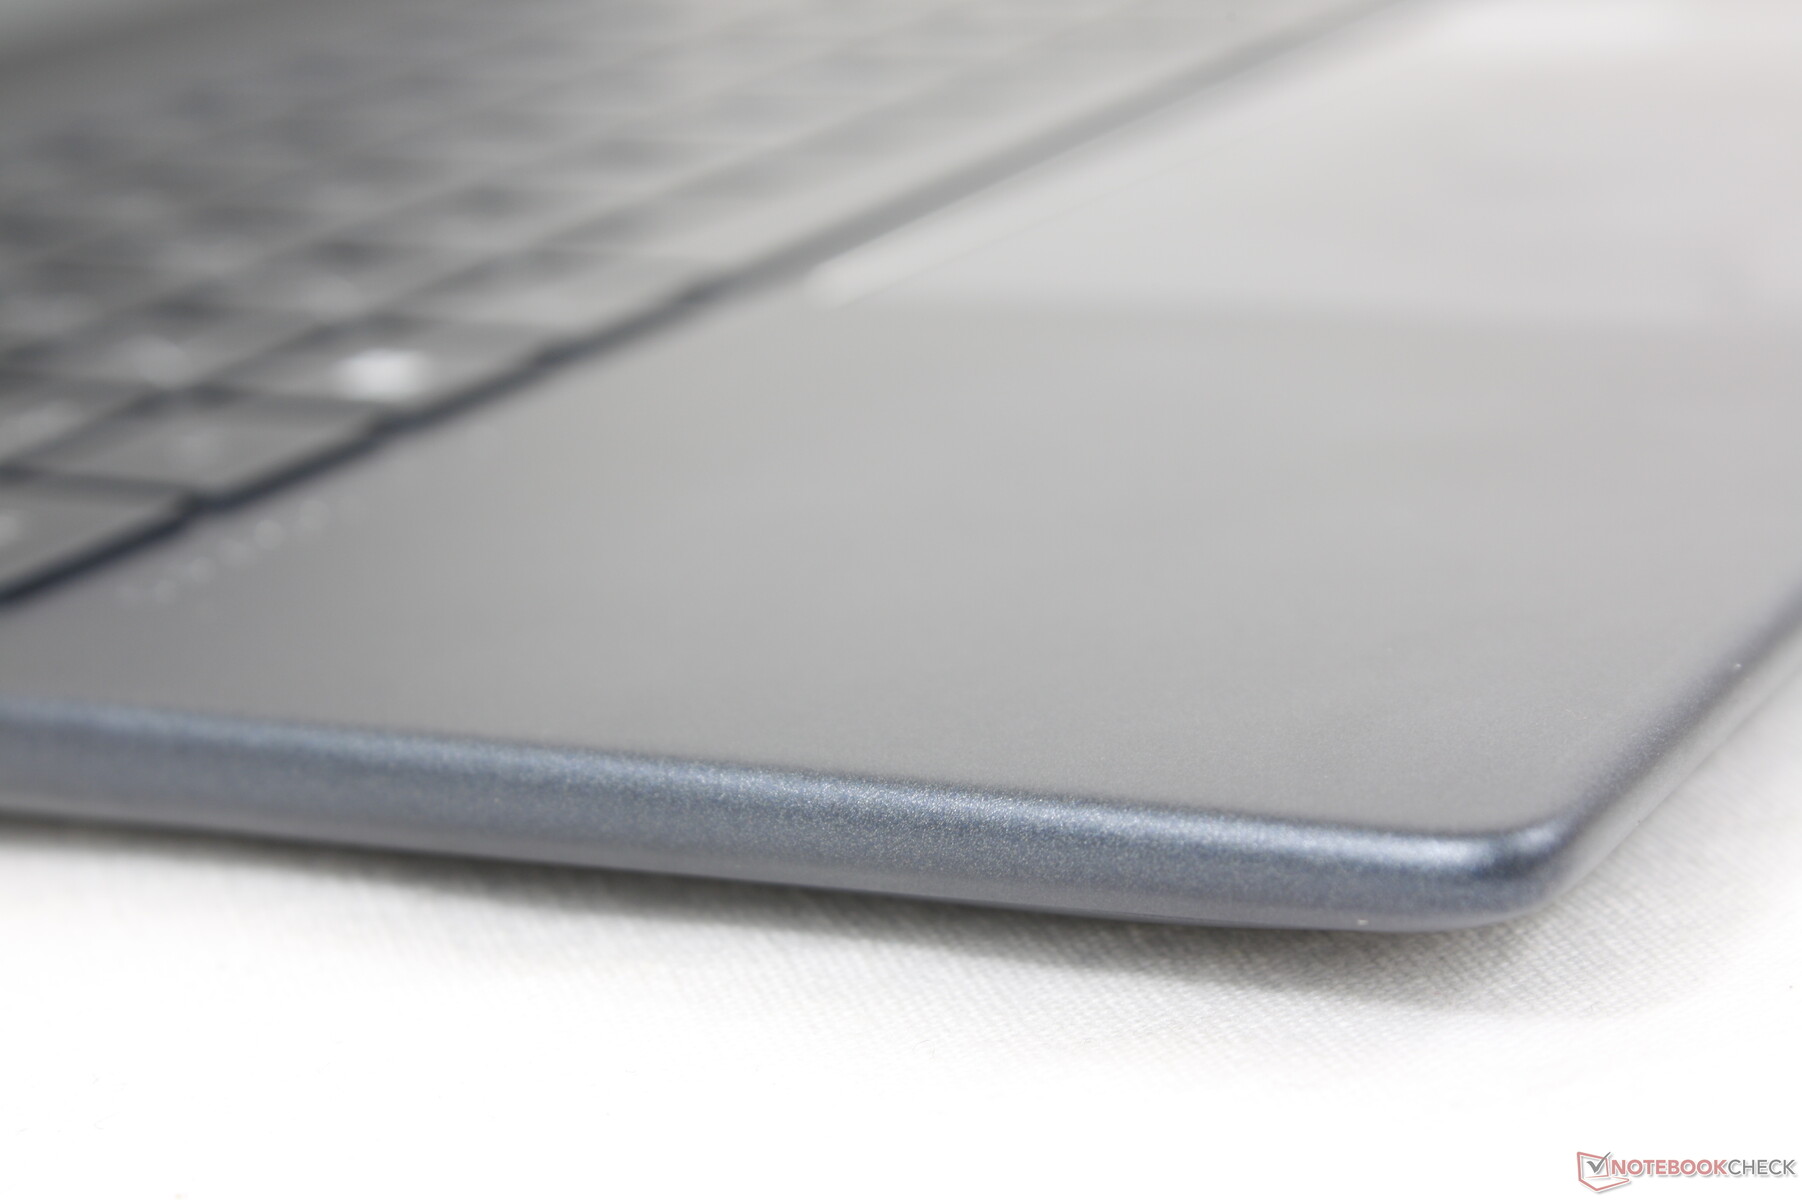
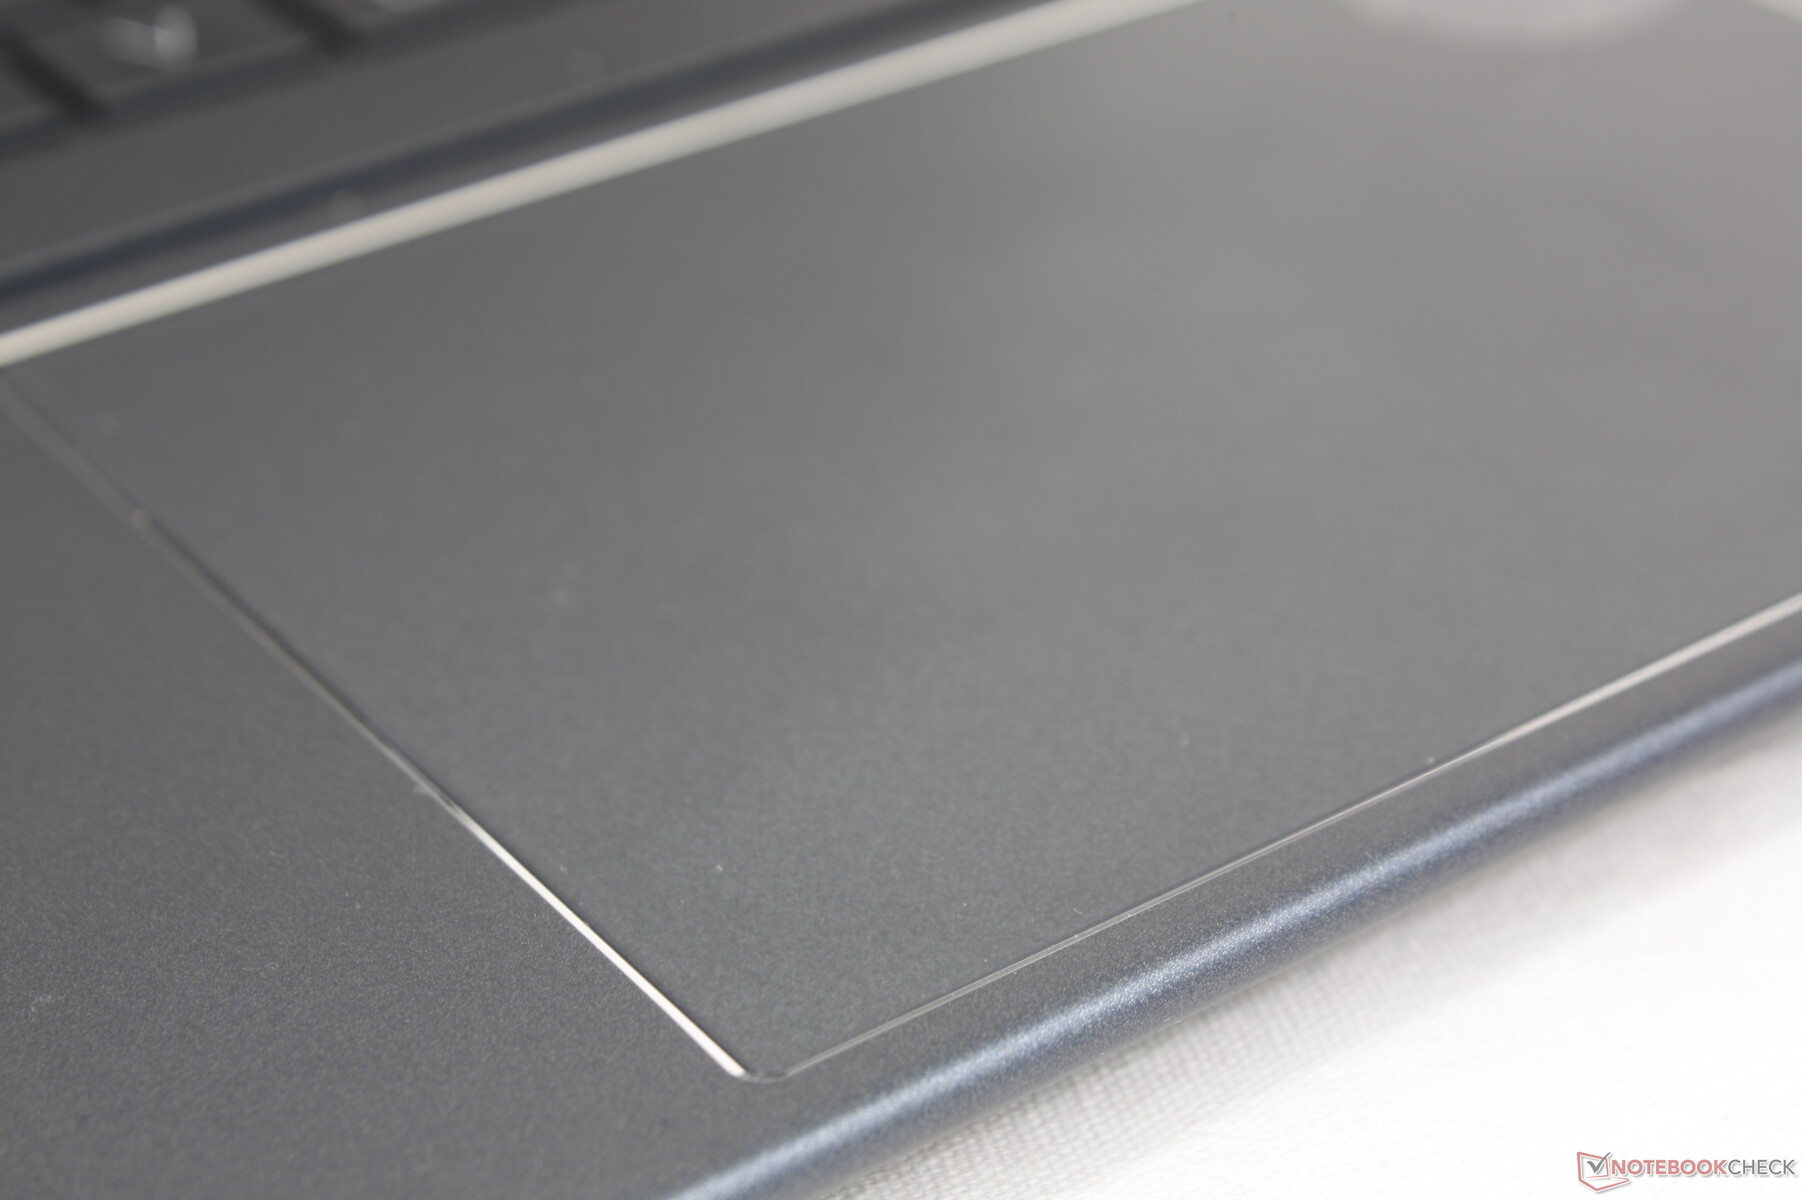
触摸板
点击板比Dragonfly Max的点击板大,更容易控制光标(12 x 8厘米对11 x 6.5厘米)。在点击板上按压时的反馈很浅,但令人满意,尽管比预期更安静的咔哒声。
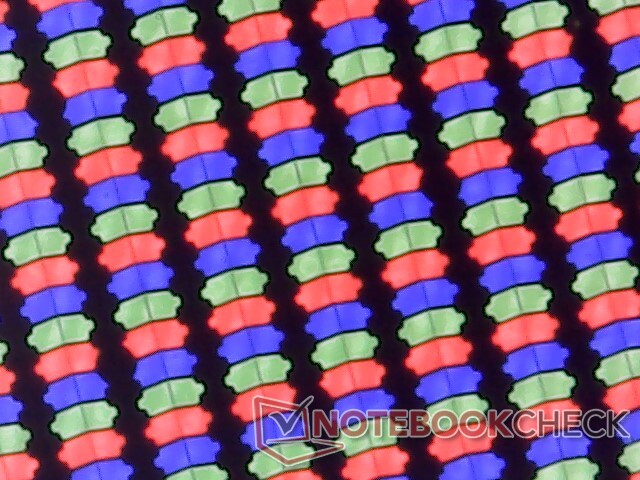
显示 - 有很多选择
共有六种13.5英寸显示屏可供选择,具体如下。
- 1920 x 1280, 400尼特, 光面, 非触摸, IPS
- 1920 x 1280, 400尼特, 光面, 触摸, IPS
- 1920 x 1280, 400尼特, 哑光, 触摸, IPS
- 1920 x 1280,1000尼特,Sure View,哑光,非触摸,IPS
- 1920 x 1280,1000尼特,Sure View,亚光,触摸,IPS
- 3000 x 2000,400尼特,光面,触摸,OLED
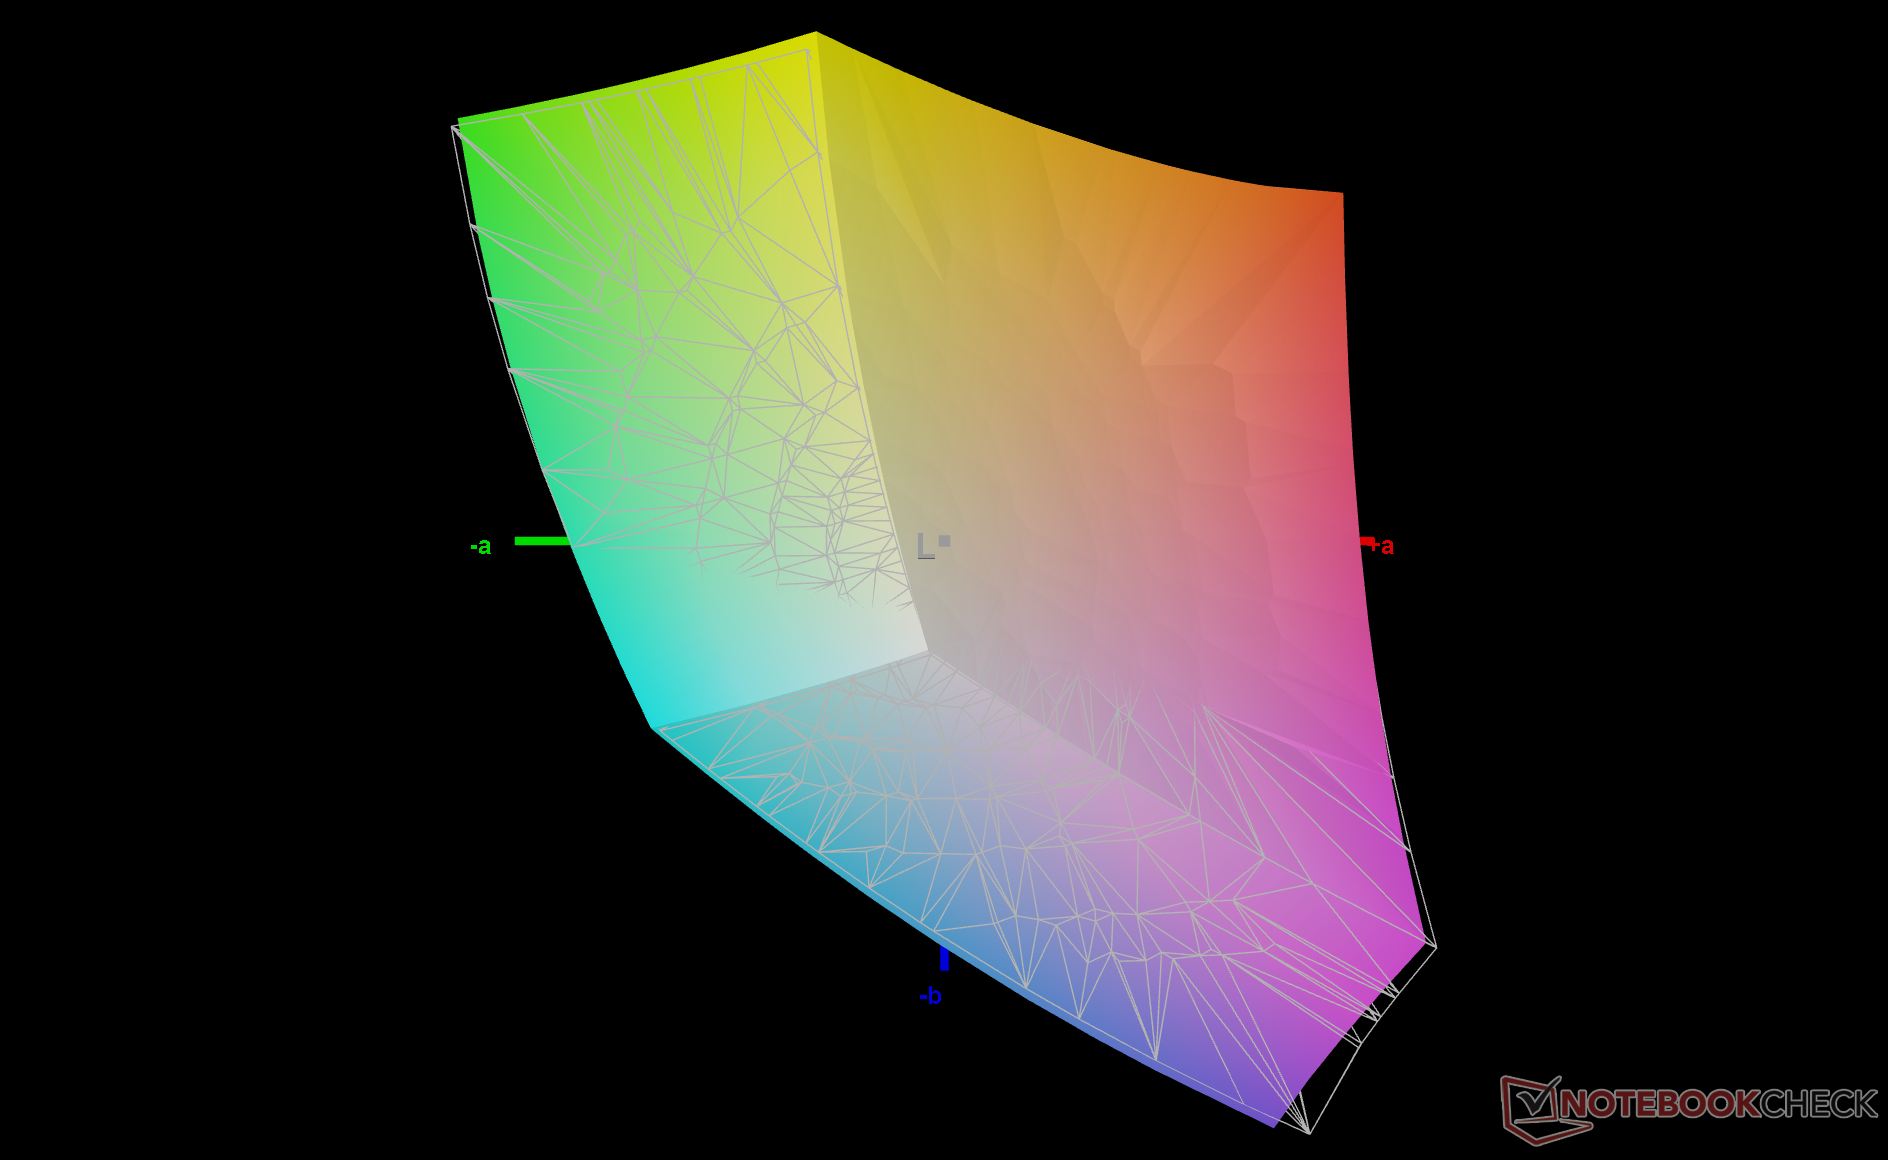
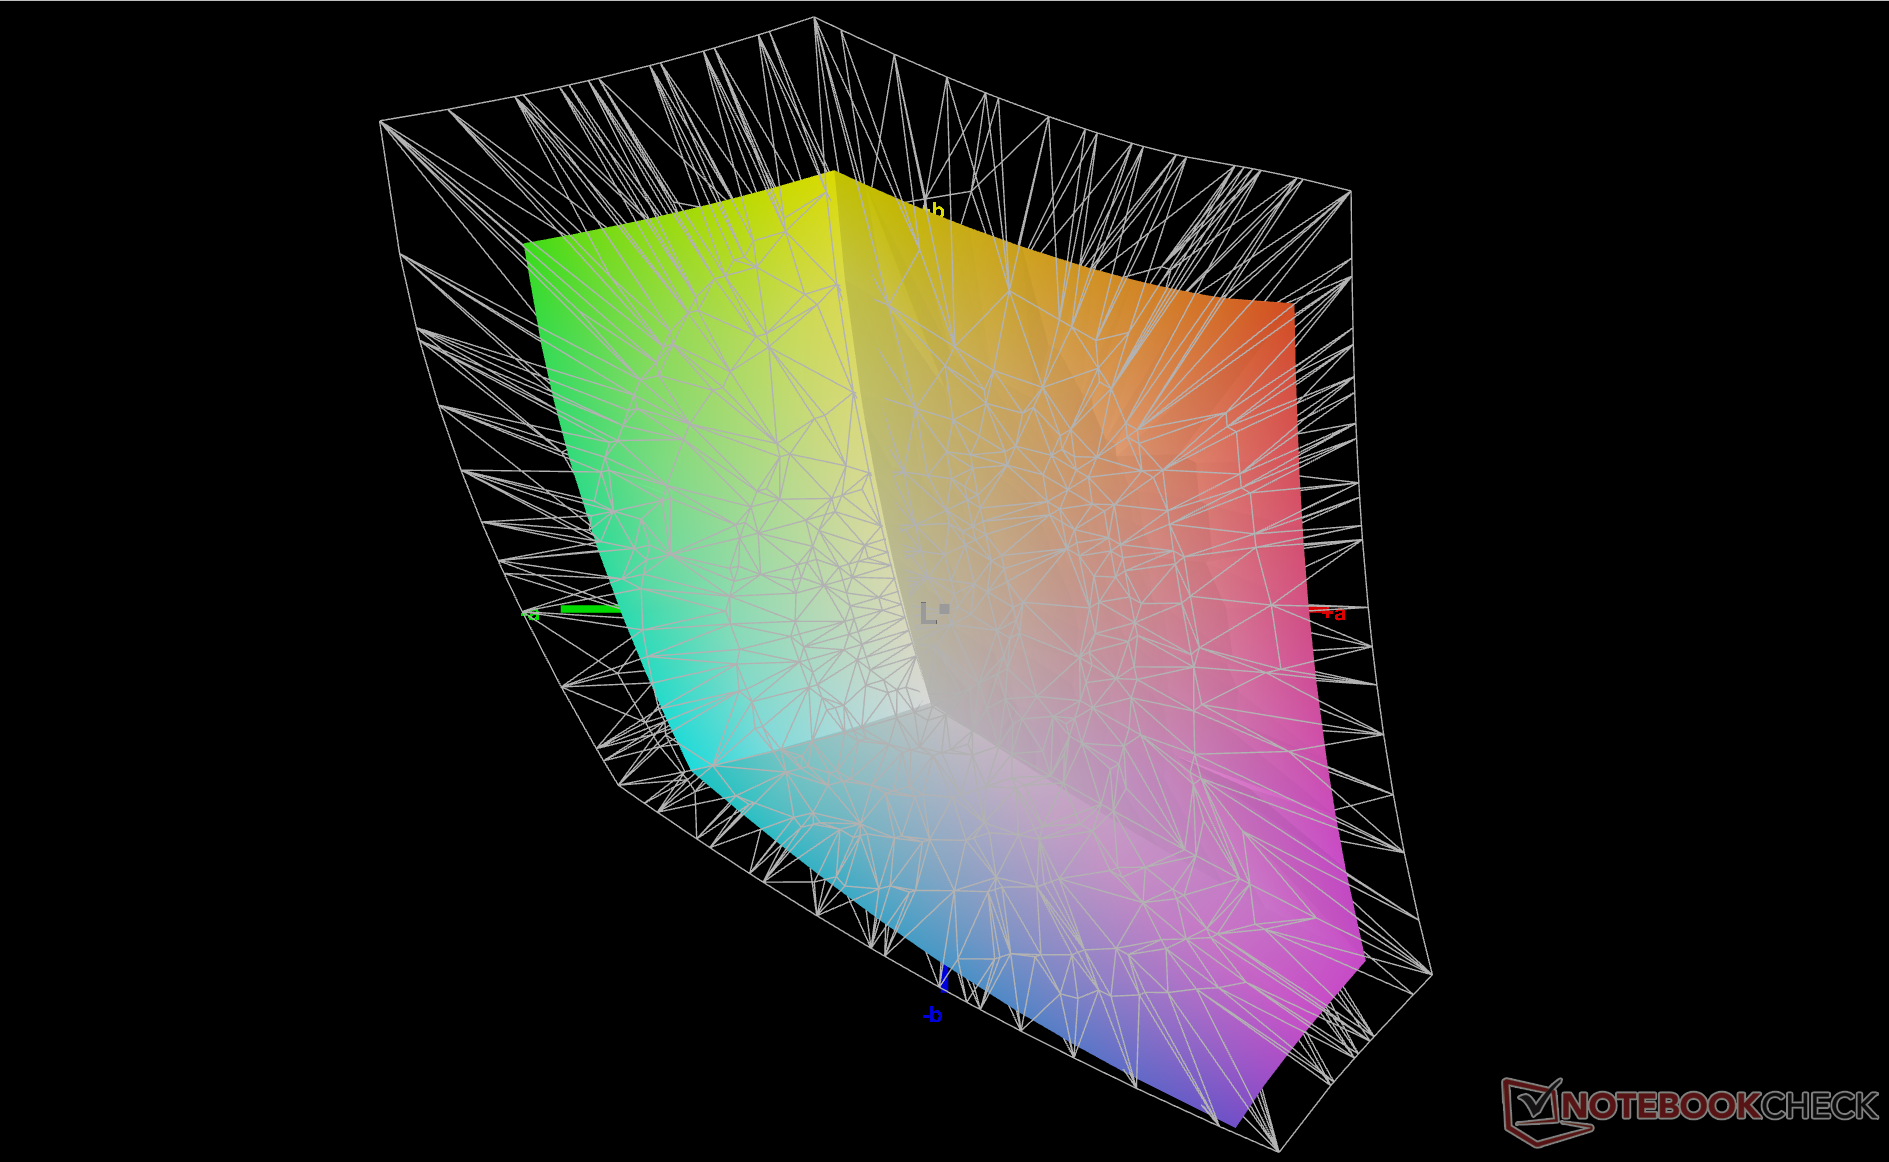
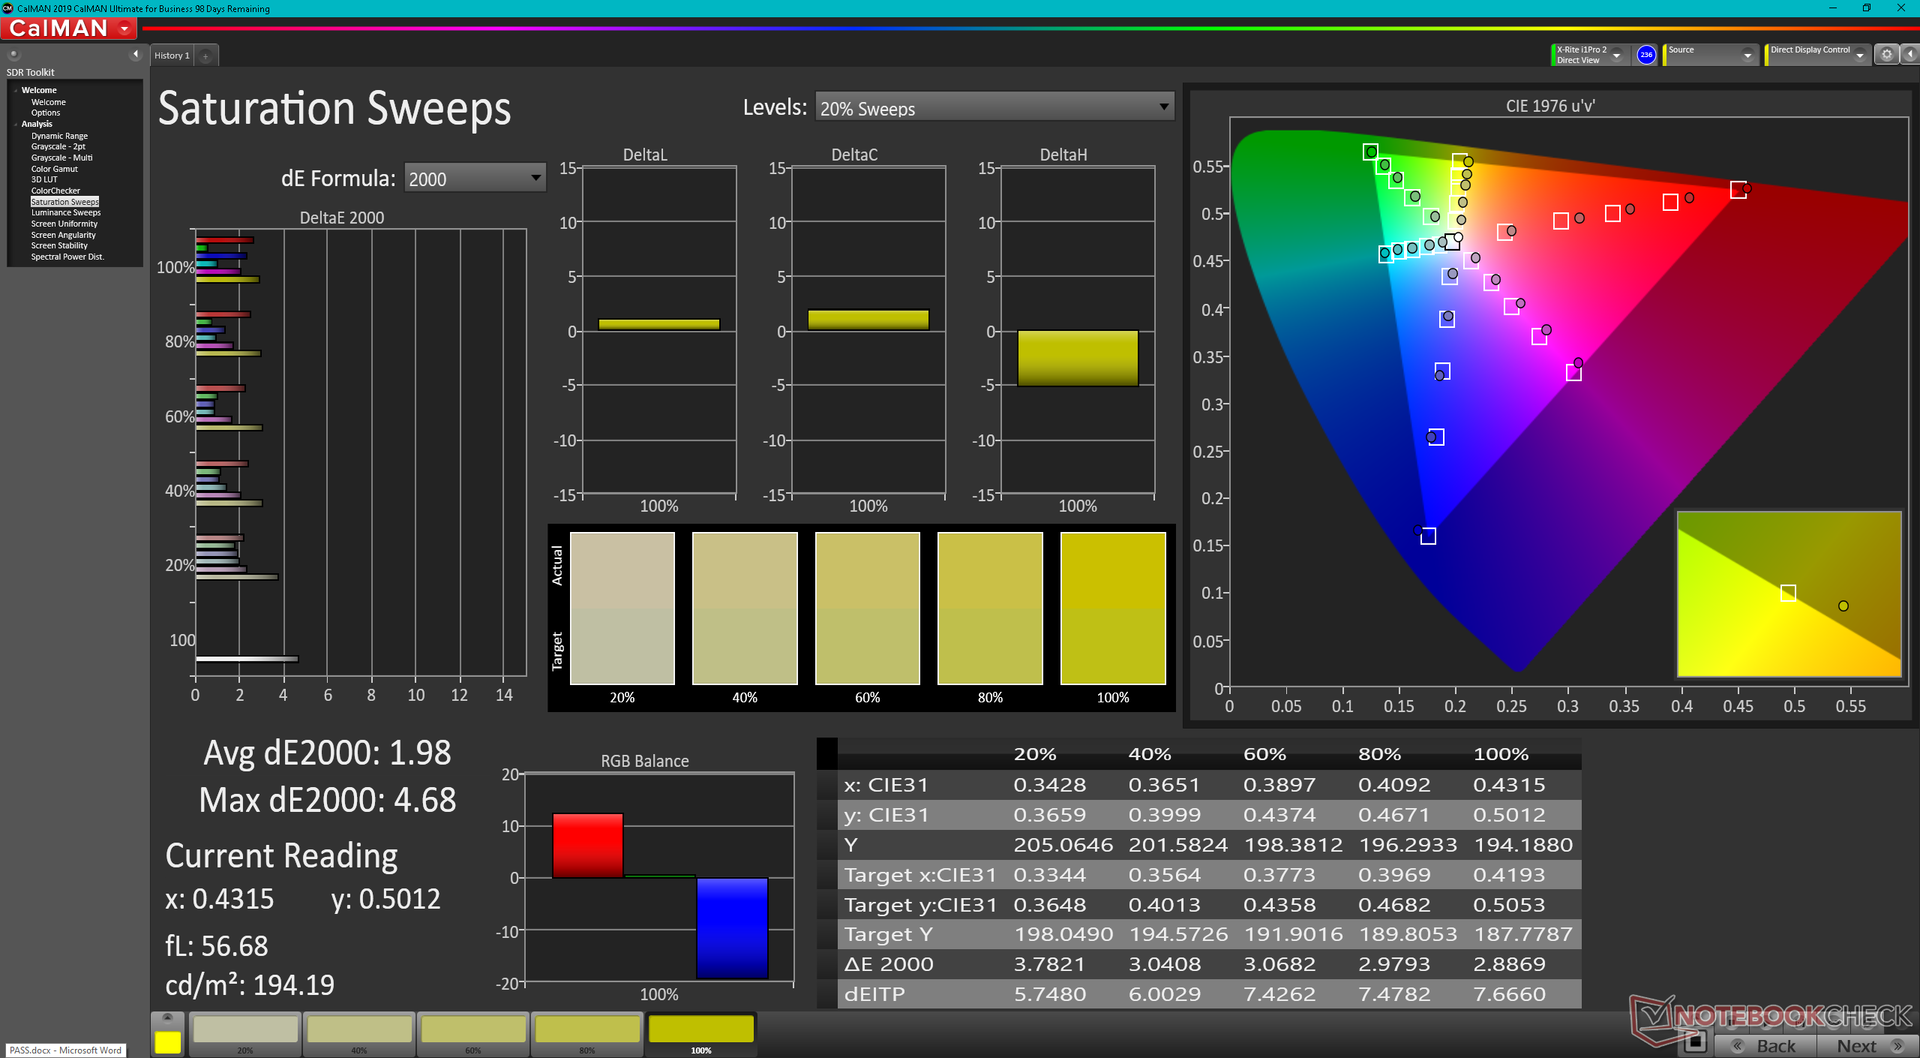
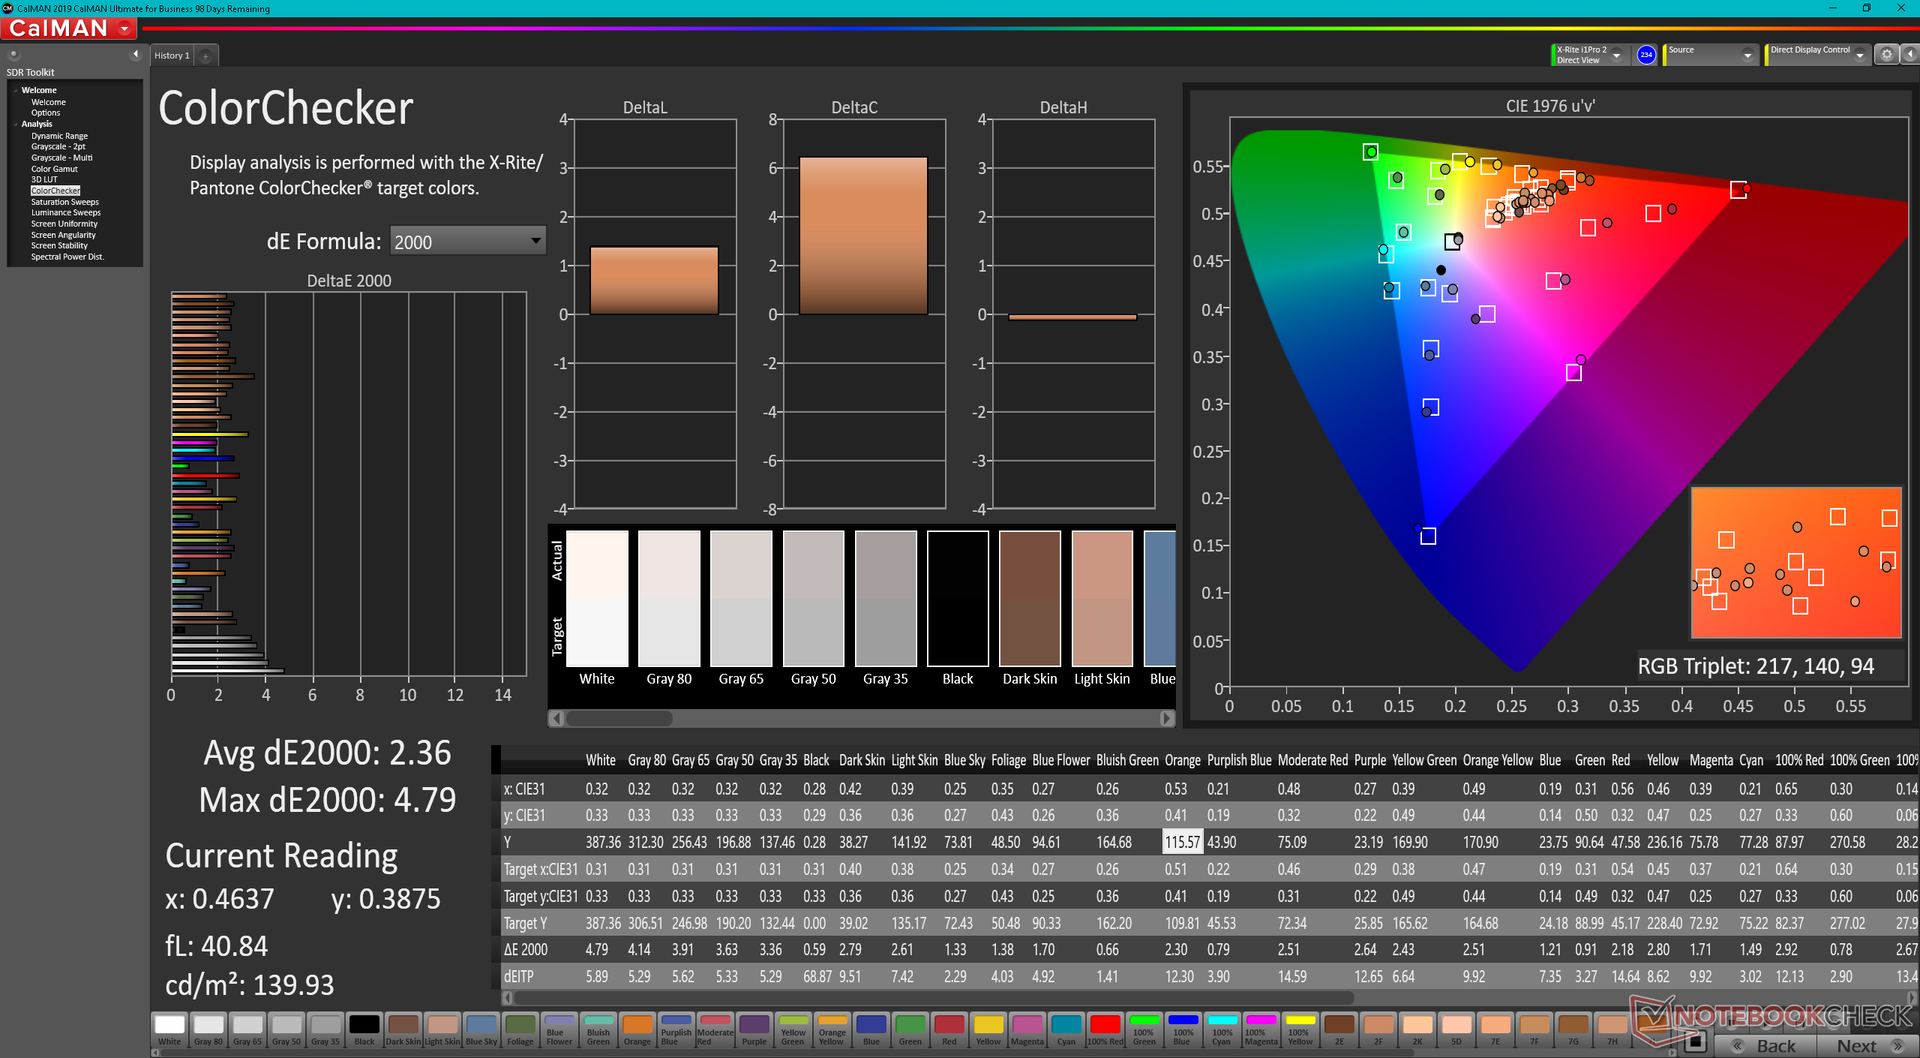
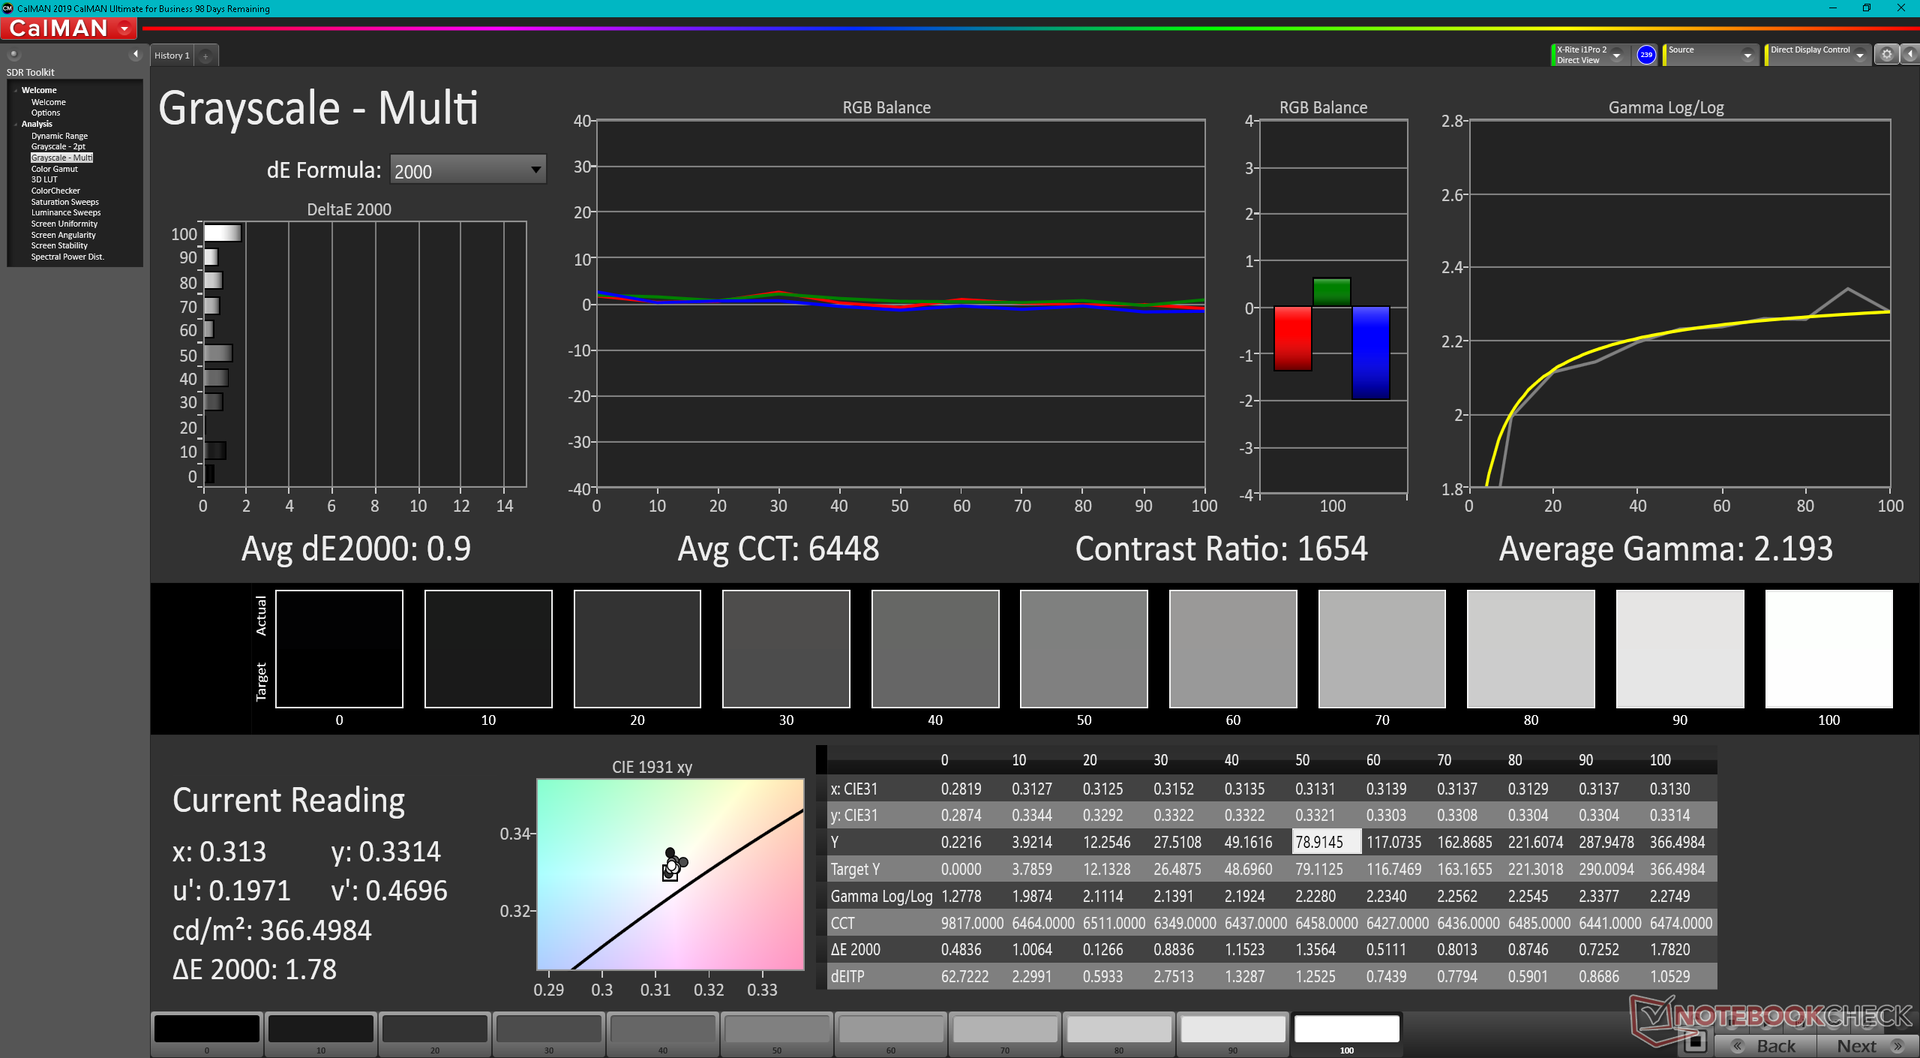
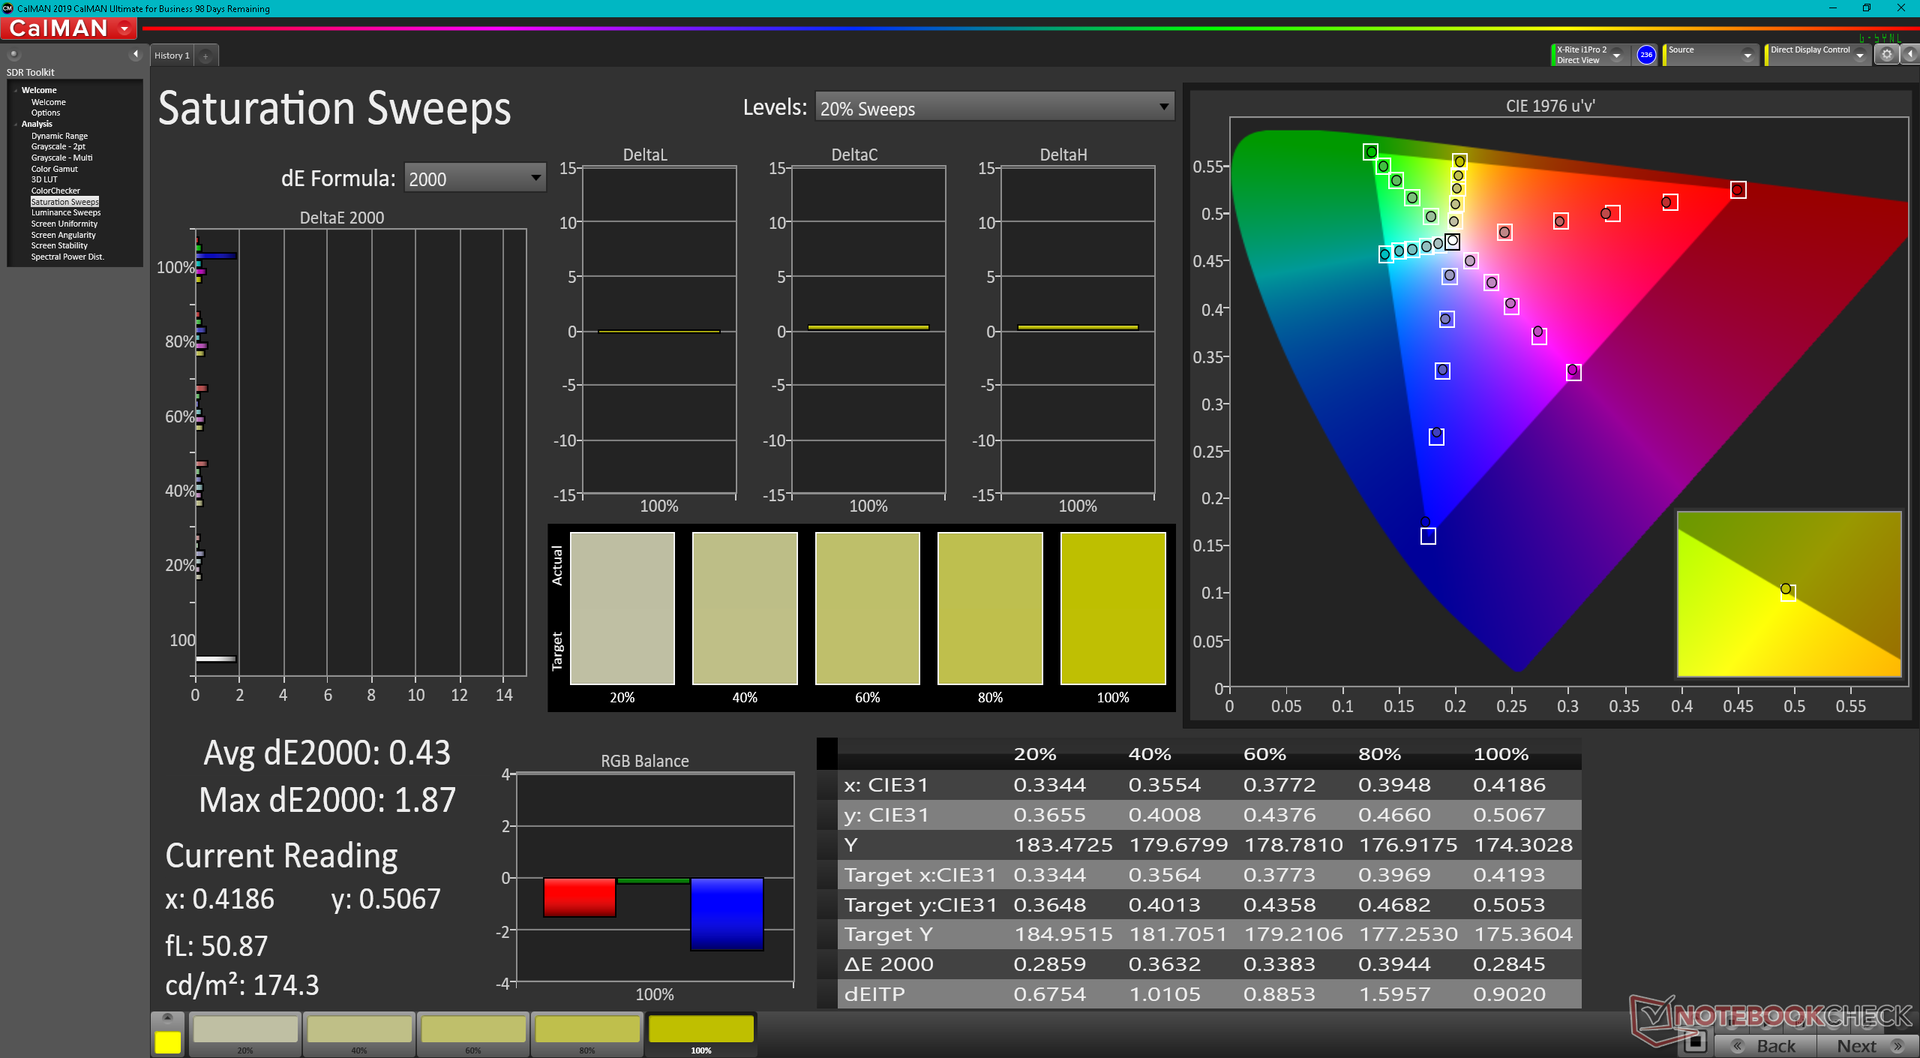
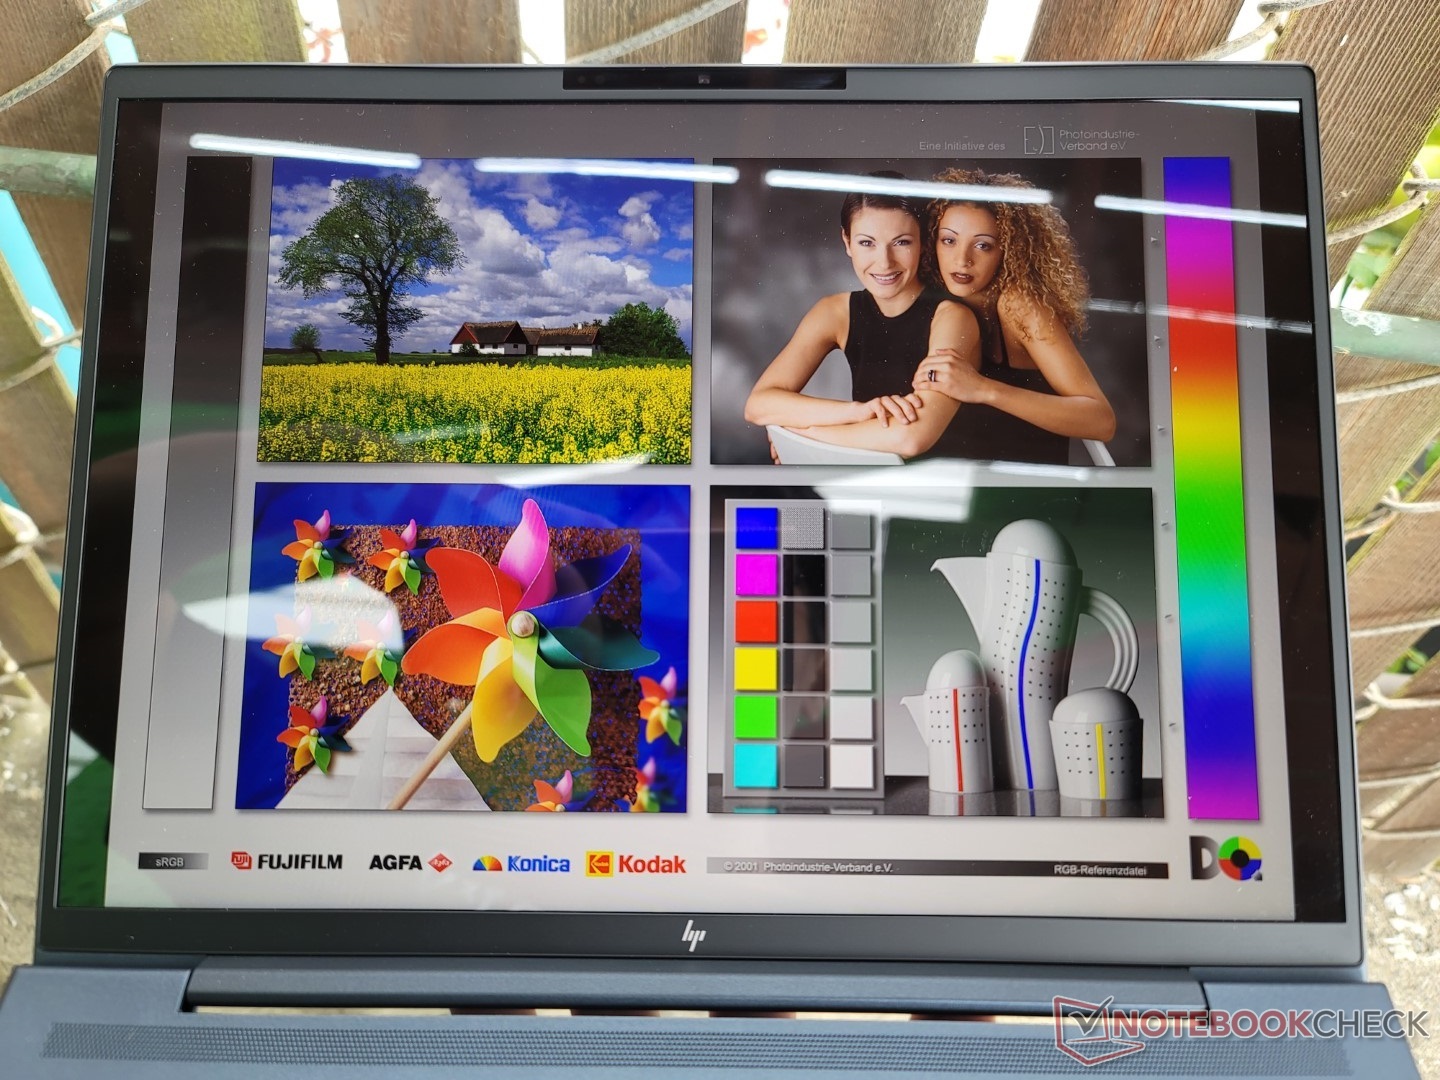
我们下面的测量结果只反映了上面黑体字的配置。有趣的是,我们的设备采用的是奇美面板,而不是13.5英寸Spectre x360上的LG飞利浦面板,但它们之间的核心属性几乎是一样的,包括全sRGB覆盖,高对比度~1500:1,以及非常缓慢的黑白和灰白响应时间。如果在蜻蜓G3上运行任何快节奏的游戏,预计会出现一些明显的重影。即使在我们的评测单元上使用基本显示选项,图像质量也很清晰和鲜艳。 对于更深的颜色,我们怀疑OLED选项可以提供完整的P3覆盖,就像在2022 Spectre x360 13.5 。
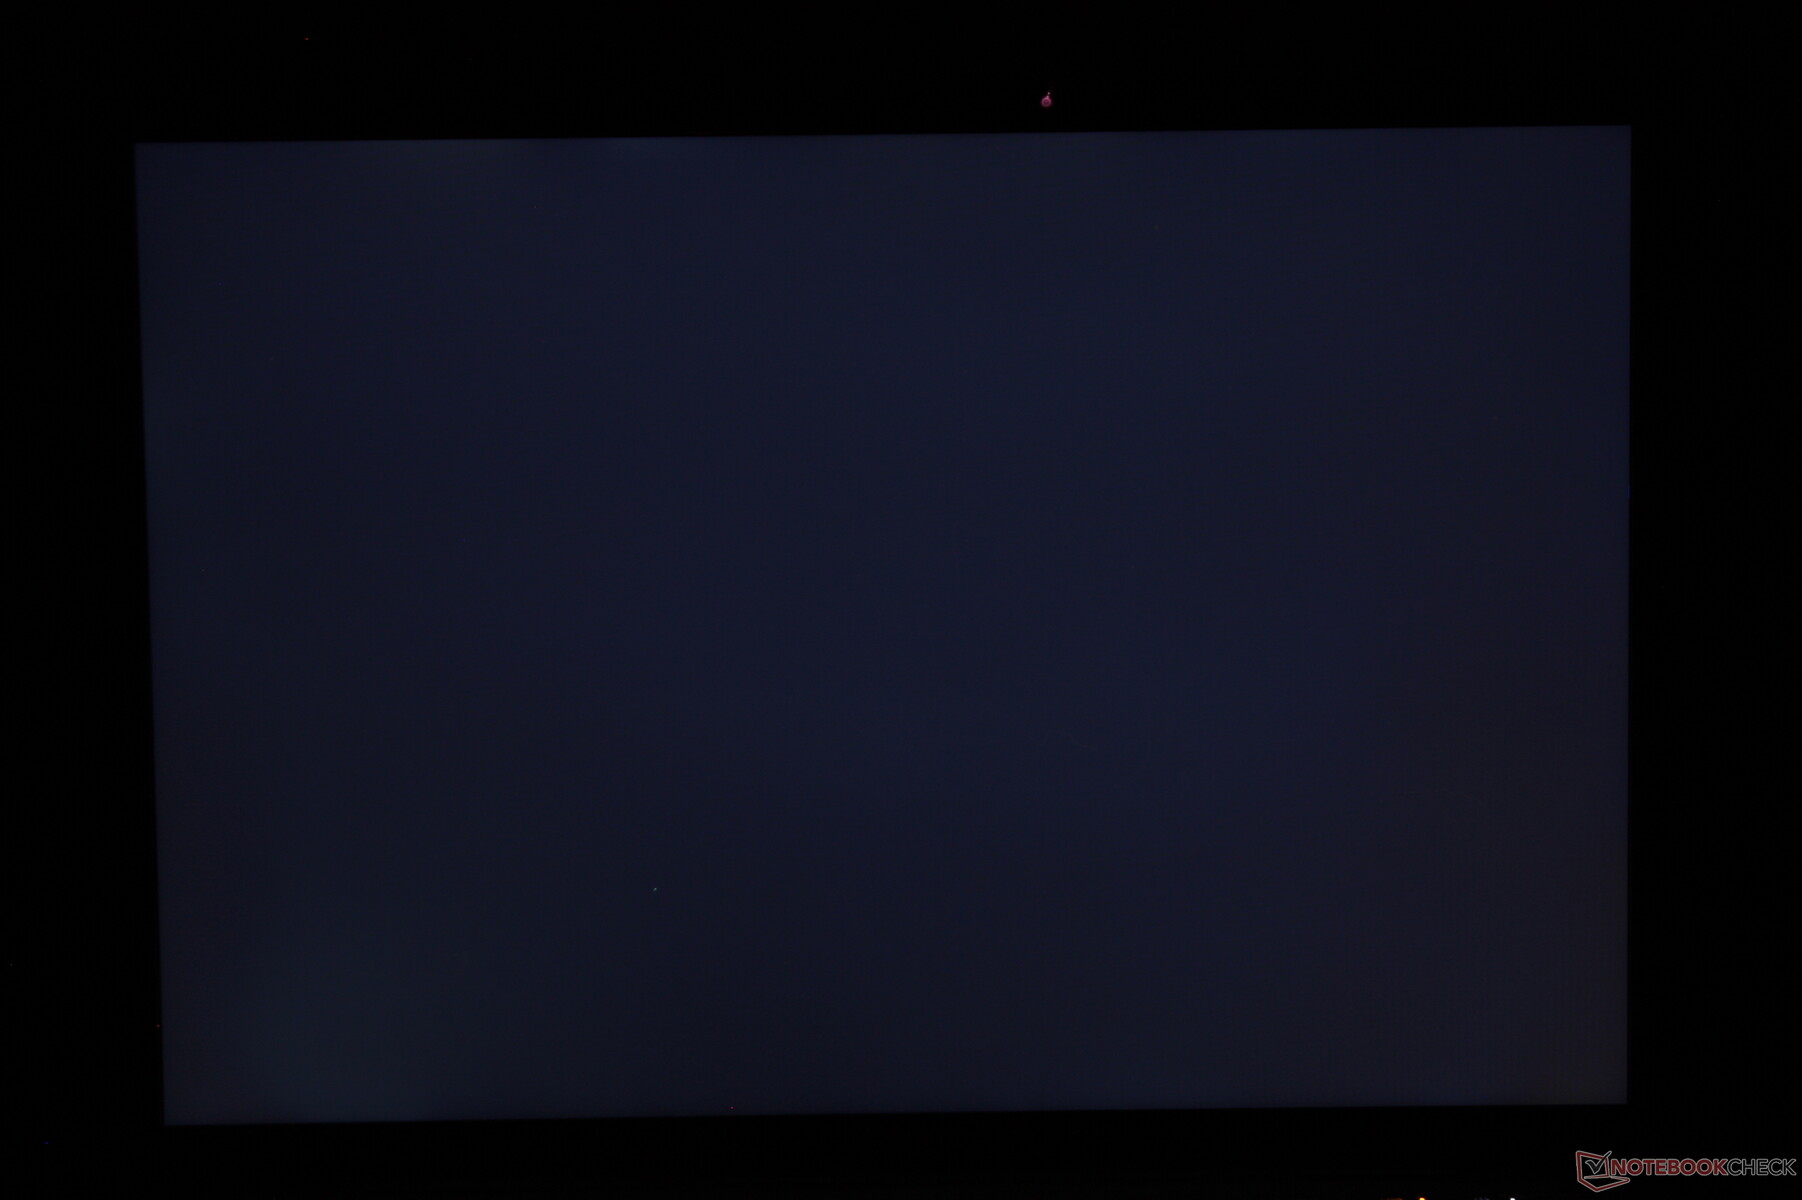
亮度分布可以更好。我们的屏幕左下角只有314尼特,而右上角是389尼特,角对角的亮度下降了20%。虽然这种差异在常规使用中并不令人分心,但我们期待像这样的高端笔记本电脑能有更好的表现。
| |||||||||||||||||||||||||
Brightness Distribution: 80 %
Center on Battery: 387.2 cd/m²
Contrast: 1489:1 (Black: 0.26 cd/m²)
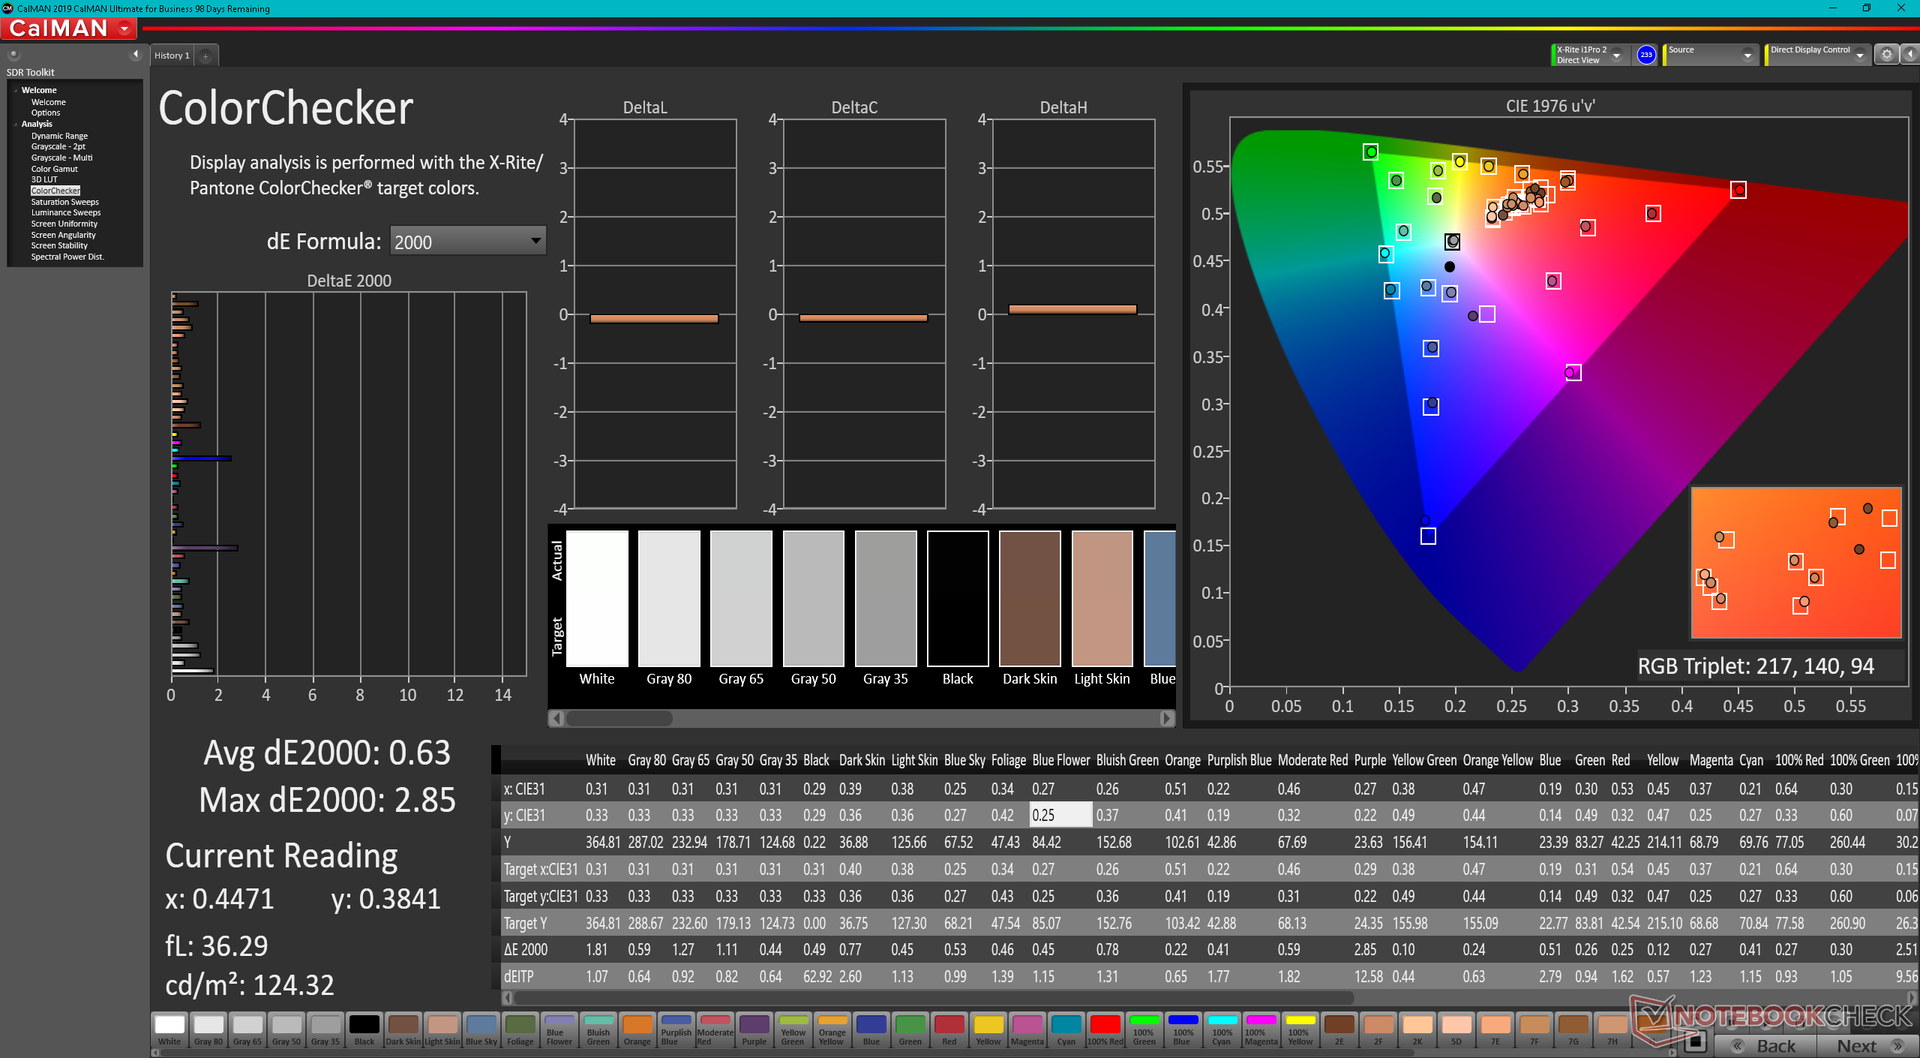
ΔE ColorChecker Calman: 2.36 | ∀{0.5-29.43 Ø4.71}
calibrated: 0.63
ΔE Greyscale Calman: 3 | ∀{0.09-98 Ø4.96}
69.9% AdobeRGB 1998 (Argyll 3D)
98.3% sRGB (Argyll 3D)
68% Display P3 (Argyll 3D)
Gamma: 2.17
CCT: 6137 K
| HP Elite Dragonfly G3 Chi Mei CMN13C0, IPS, 1920x1280, 13.5" | HP Spectre x360 14t-ea000 LG Philips LGD0663, IPS, 1920x1280, 13.5" | Dell XPS 13 Plus 9320 i5-1240p Sharp SHP1548 LQ134N1, IPS, 1920x1200, 13.4" | Framework Laptop 13.5 12th Gen Intel BOE CQ NE135FBM-N41, IPS, 2256x1504, 13.5" | HP EliteBook Folio 13.5-3G2L2EA LGD0663, IPS, 1920x1280, 13.5" | Lenovo ThinkPad X1 Titanium Yoga G1 20QA001RGE LPM135M467, IPS, 2256x1504, 13.5" | |
|---|---|---|---|---|---|---|
| Display | -2% | 1% | 2% | |||
| Display P3 Coverage (%) | 68 | 65.8 -3% | 69 1% | 69.9 3% | ||
| sRGB Coverage (%) | 98.3 | 98.2 0% | 99 1% | 99.4 1% | ||
| AdobeRGB 1998 Coverage (%) | 69.9 | 67.9 -3% | 71 2% | 71.1 2% | ||
| Response Times | -18% | 26% | 27% | 18% | 13% | |
| Response Time Grey 50% / Grey 80% * (ms) | 50.8 ? | 62 ? -22% | 45 ? 11% | 34.7 ? 32% | 44 ? 13% | 53.6 ? -6% |
| Response Time Black / White * (ms) | 35.2 ? | 39.6 ? -13% | 21 ? 40% | 27.5 ? 22% | 27 ? 23% | 24 ? 32% |
| PWM Frequency (Hz) | ||||||
| Screen | -22% | -52% | -13% | -23% | 17% | |
| Brightness middle (cd/m²) | 387.2 | 443.5 15% | 498 29% | 449.6 16% | 250 -35% | 466 20% |
| Brightness (cd/m²) | 360 | 394 9% | 460 28% | 431 20% | 226 -37% | 454 26% |
| Brightness Distribution (%) | 80 | 78 -2% | 85 6% | 90 13% | 82 2% | 94 18% |
| Black Level * (cd/m²) | 0.26 | 0.17 35% | 0.53 -104% | 0.31 -19% | 0.215 17% | 0.23 12% |
| Contrast (:1) | 1489 | 2609 75% | 940 -37% | 1450 -3% | 1163 -22% | 2026 36% |
| Colorchecker dE 2000 * | 2.36 | 2.7 -14% | 3.65 -55% | 2.76 -17% | 3.59 -52% | 2.1 11% |
| Colorchecker dE 2000 max. * | 4.79 | 4.36 9% | 7.11 -48% | 7.96 -66% | 5.9 -23% | 4.5 6% |
| Colorchecker dE 2000 calibrated * | 0.63 | 2.61 -314% | 2.16 -243% | 0.58 8% | ||
| Greyscale dE 2000 * | 3 | 3.4 -13% | 4.25 -42% | 5.2 -73% | 3.99 -33% | 2.7 10% |
| Gamma | 2.17 101% | 2.09 105% | 2.45 90% | 2.23 99% | 2.98 74% | 2.08 106% |
| CCT | 6137 106% | 6144 106% | 6690 97% | 6475 100% | 6765 96% | 6210 105% |
| Color Space (Percent of AdobeRGB 1998) (%) | 62.1 | 61.1 | ||||
| Color Space (Percent of sRGB) (%) | 98.5 | 94.9 | ||||
| Total Average (Program / Settings) | -14% /
-17% | -8% /
-29% | 5% /
-4% | -3% /
-15% | 15% /
17% |
* ... smaller is better
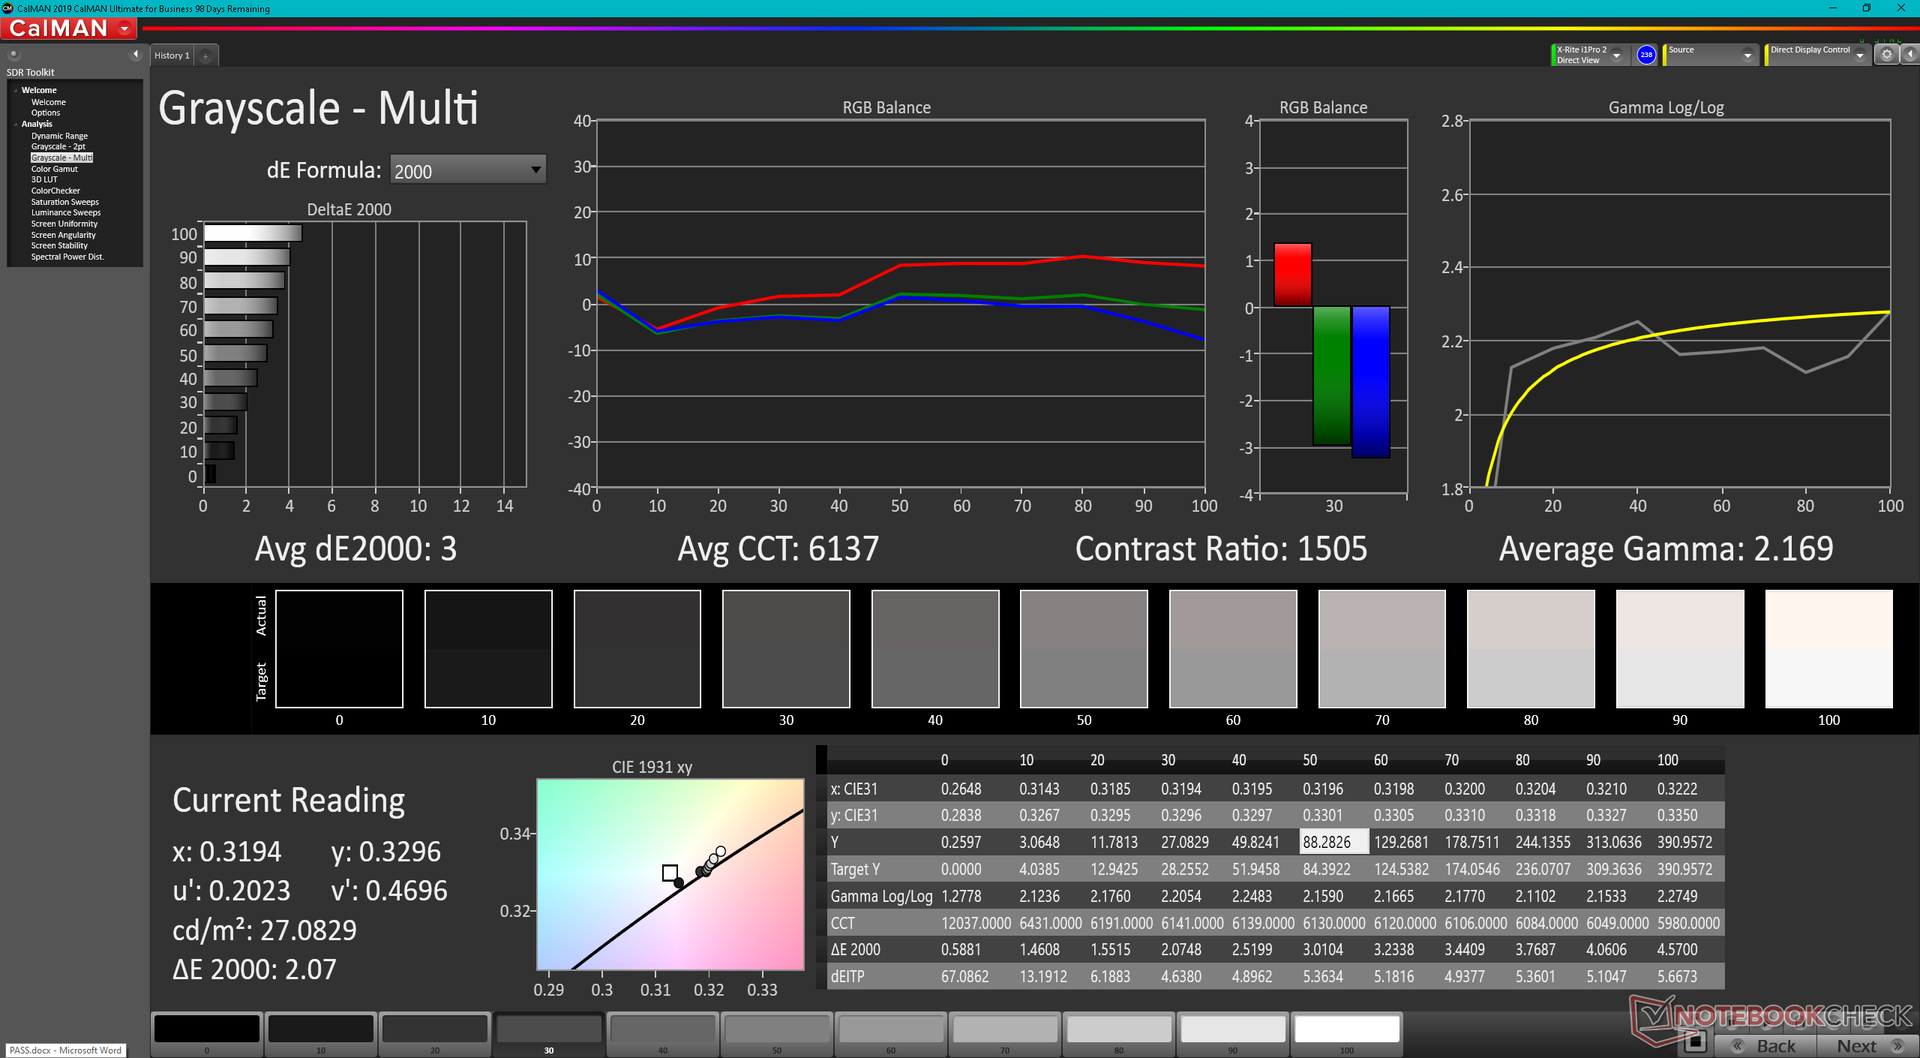
该显示器开箱即被校准,灰度和色彩的平均DeltaE值分别为3和2.36。自己校准显示器将进一步提高平均DeltaE值,使其低于1。
Display Response Times
| ↔ Response Time Black to White | ||
|---|---|---|
| 35.2 ms ... rise ↗ and fall ↘ combined | ↗ 18.8 ms rise | 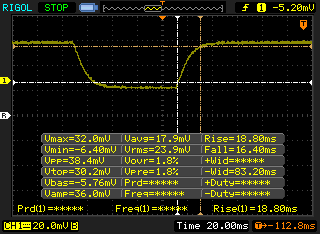 |
| ↘ 16.4 ms fall | ||
| The screen shows slow response rates in our tests and will be unsatisfactory for gamers. In comparison, all tested devices range from 0.1 (minimum) to 240 (maximum) ms. » 93 % of all devices are better. This means that the measured response time is worse than the average of all tested devices (19.8 ms). | ||
| ↔ Response Time 50% Grey to 80% Grey | ||
| 50.8 ms ... rise ↗ and fall ↘ combined | ↗ 27.2 ms rise | 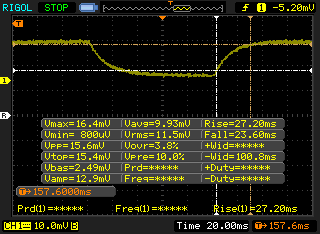 |
| ↘ 23.6 ms fall | ||
| The screen shows slow response rates in our tests and will be unsatisfactory for gamers. In comparison, all tested devices range from 0.165 (minimum) to 636 (maximum) ms. » 87 % of all devices are better. This means that the measured response time is worse than the average of all tested devices (31 ms). | ||
Screen Flickering / PWM (Pulse-Width Modulation)
| Screen flickering / PWM not detected | 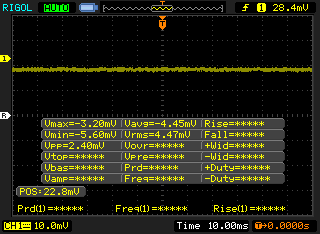 | ||
In comparison: 52 % of all tested devices do not use PWM to dim the display. If PWM was detected, an average of 7757 (minimum: 5 - maximum: 343500) Hz was measured. | |||
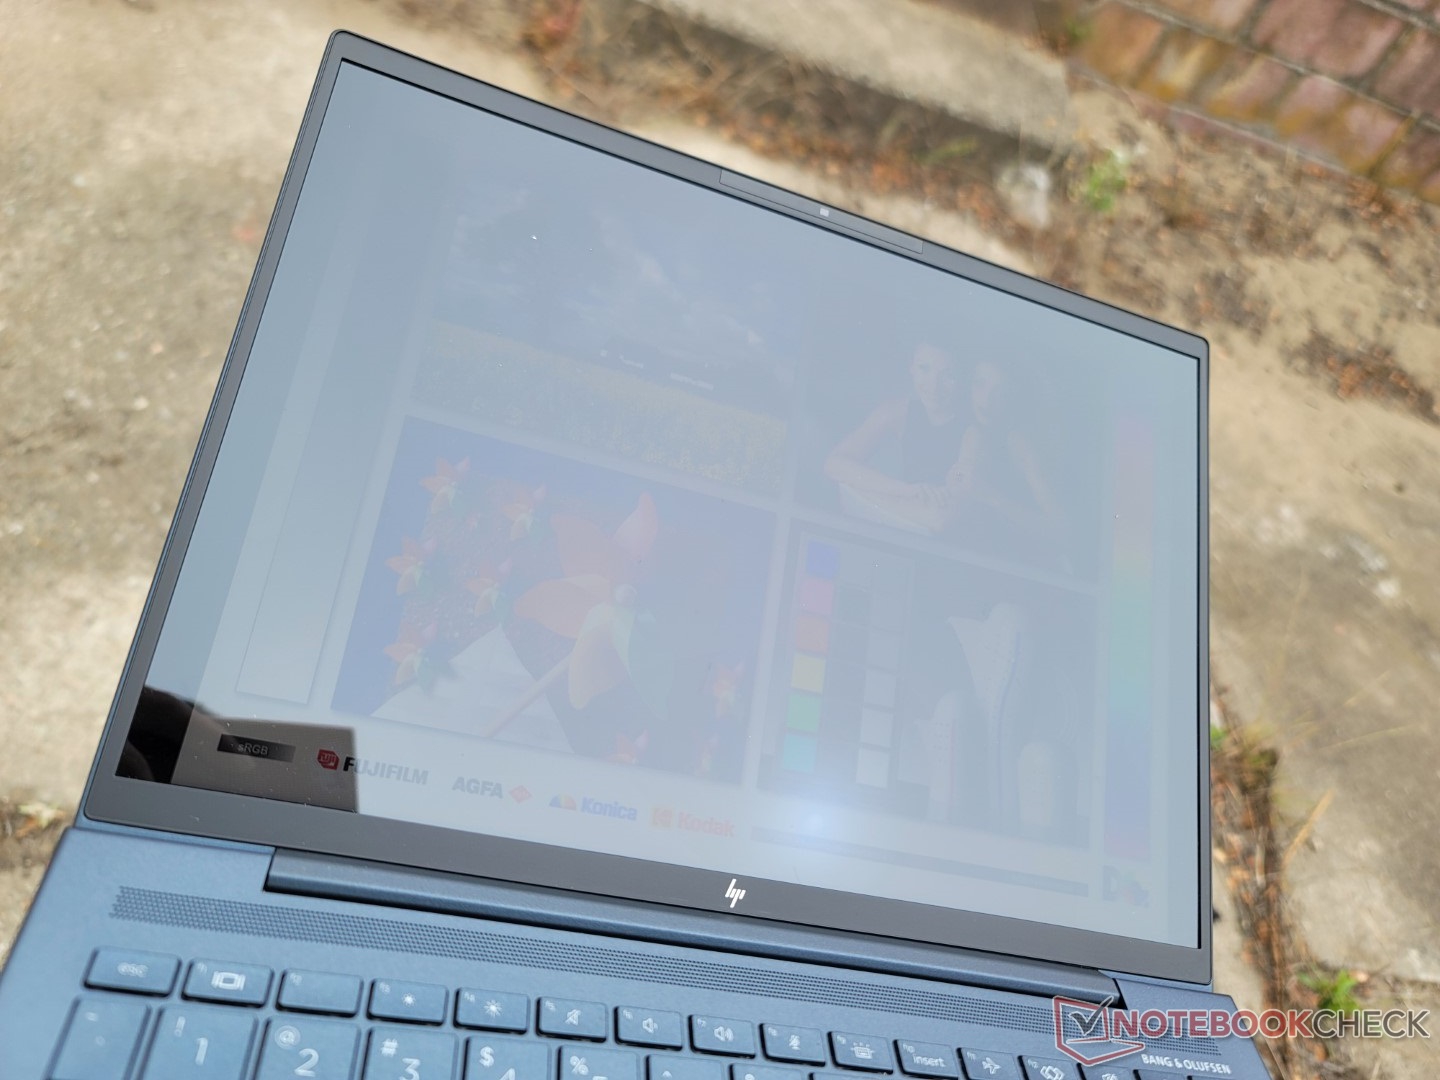
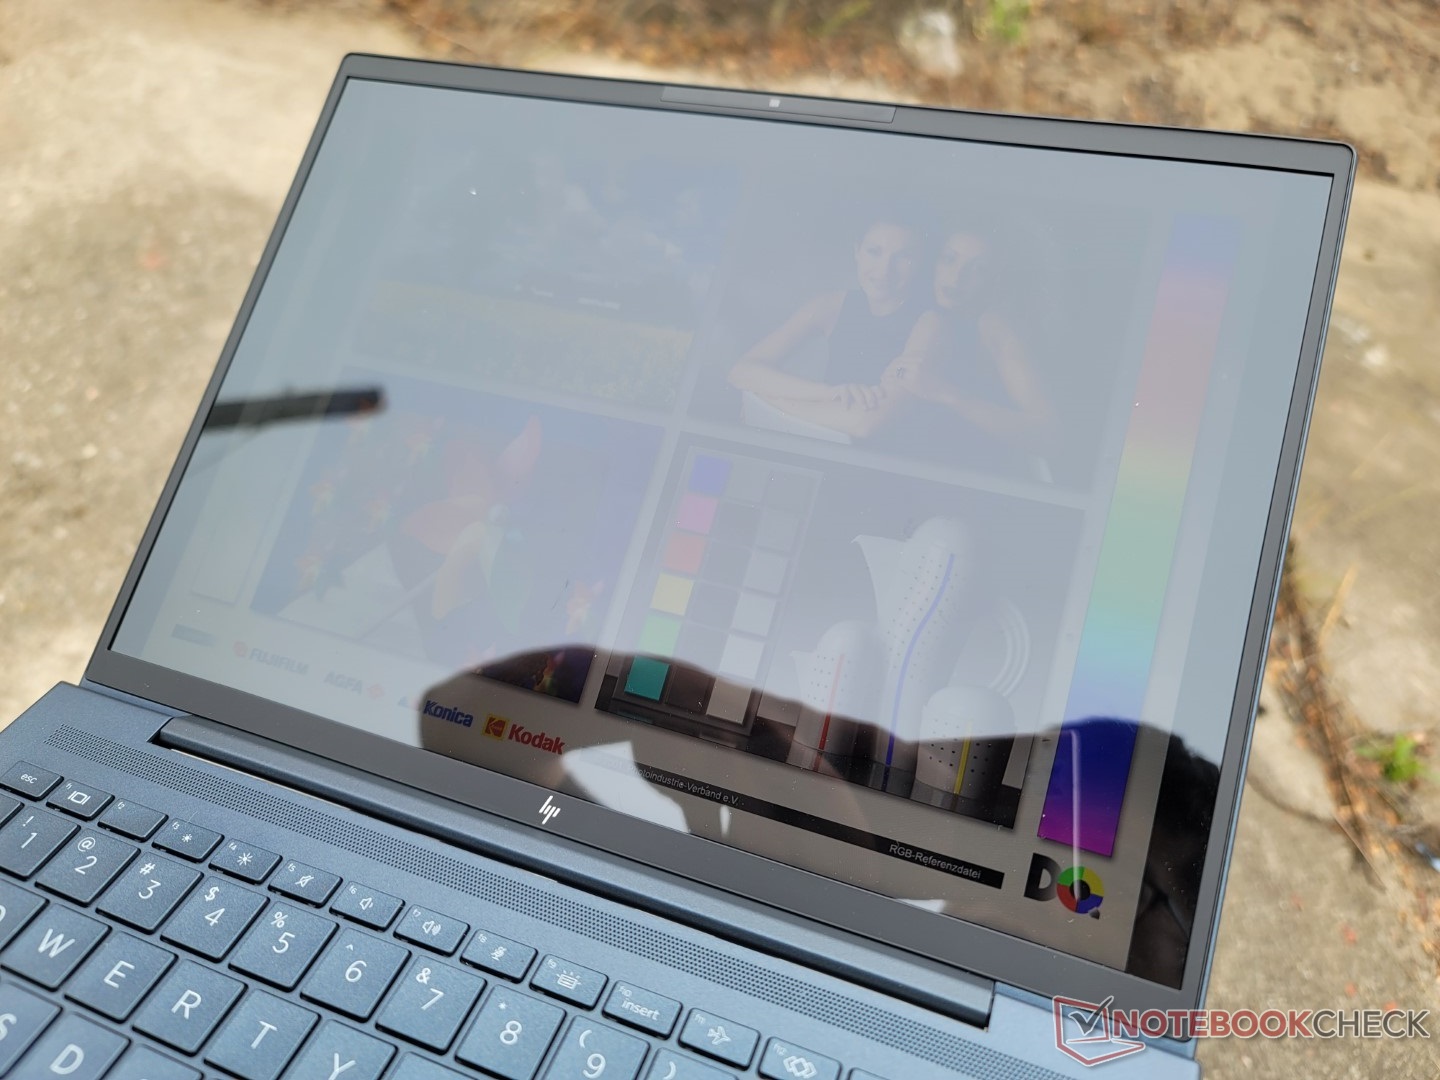
在大多数明亮的户外条件下,基本的400尼特屏幕只是勉强可以看到。惠普提供了其标志性的1000尼特面板作为选项,以提高户外可视性,但不幸的是,这些面板与Sure View挂钩,这对一些用户来说可能是不可取的。 对某些用户来说是不可取的.

性能 - 英特尔第12代产品
测试条件
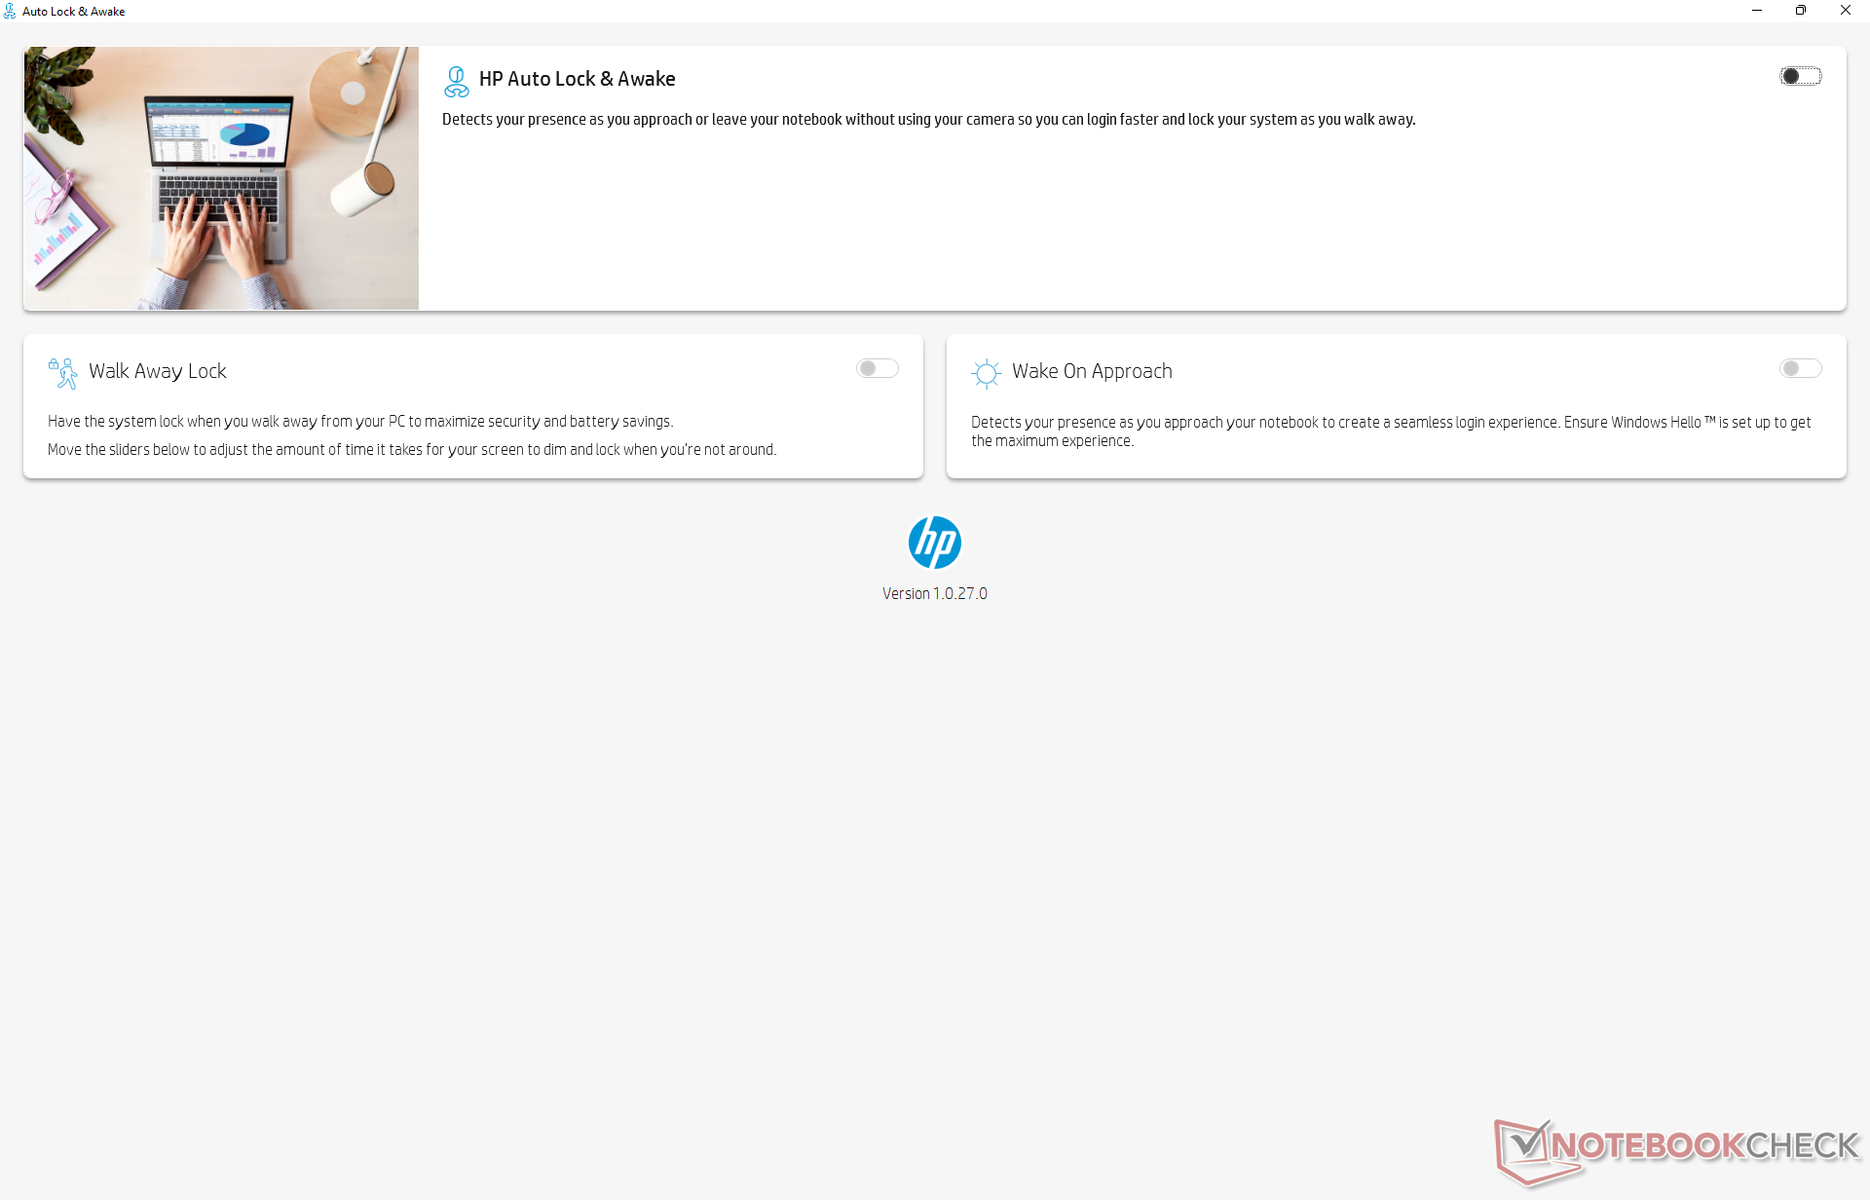
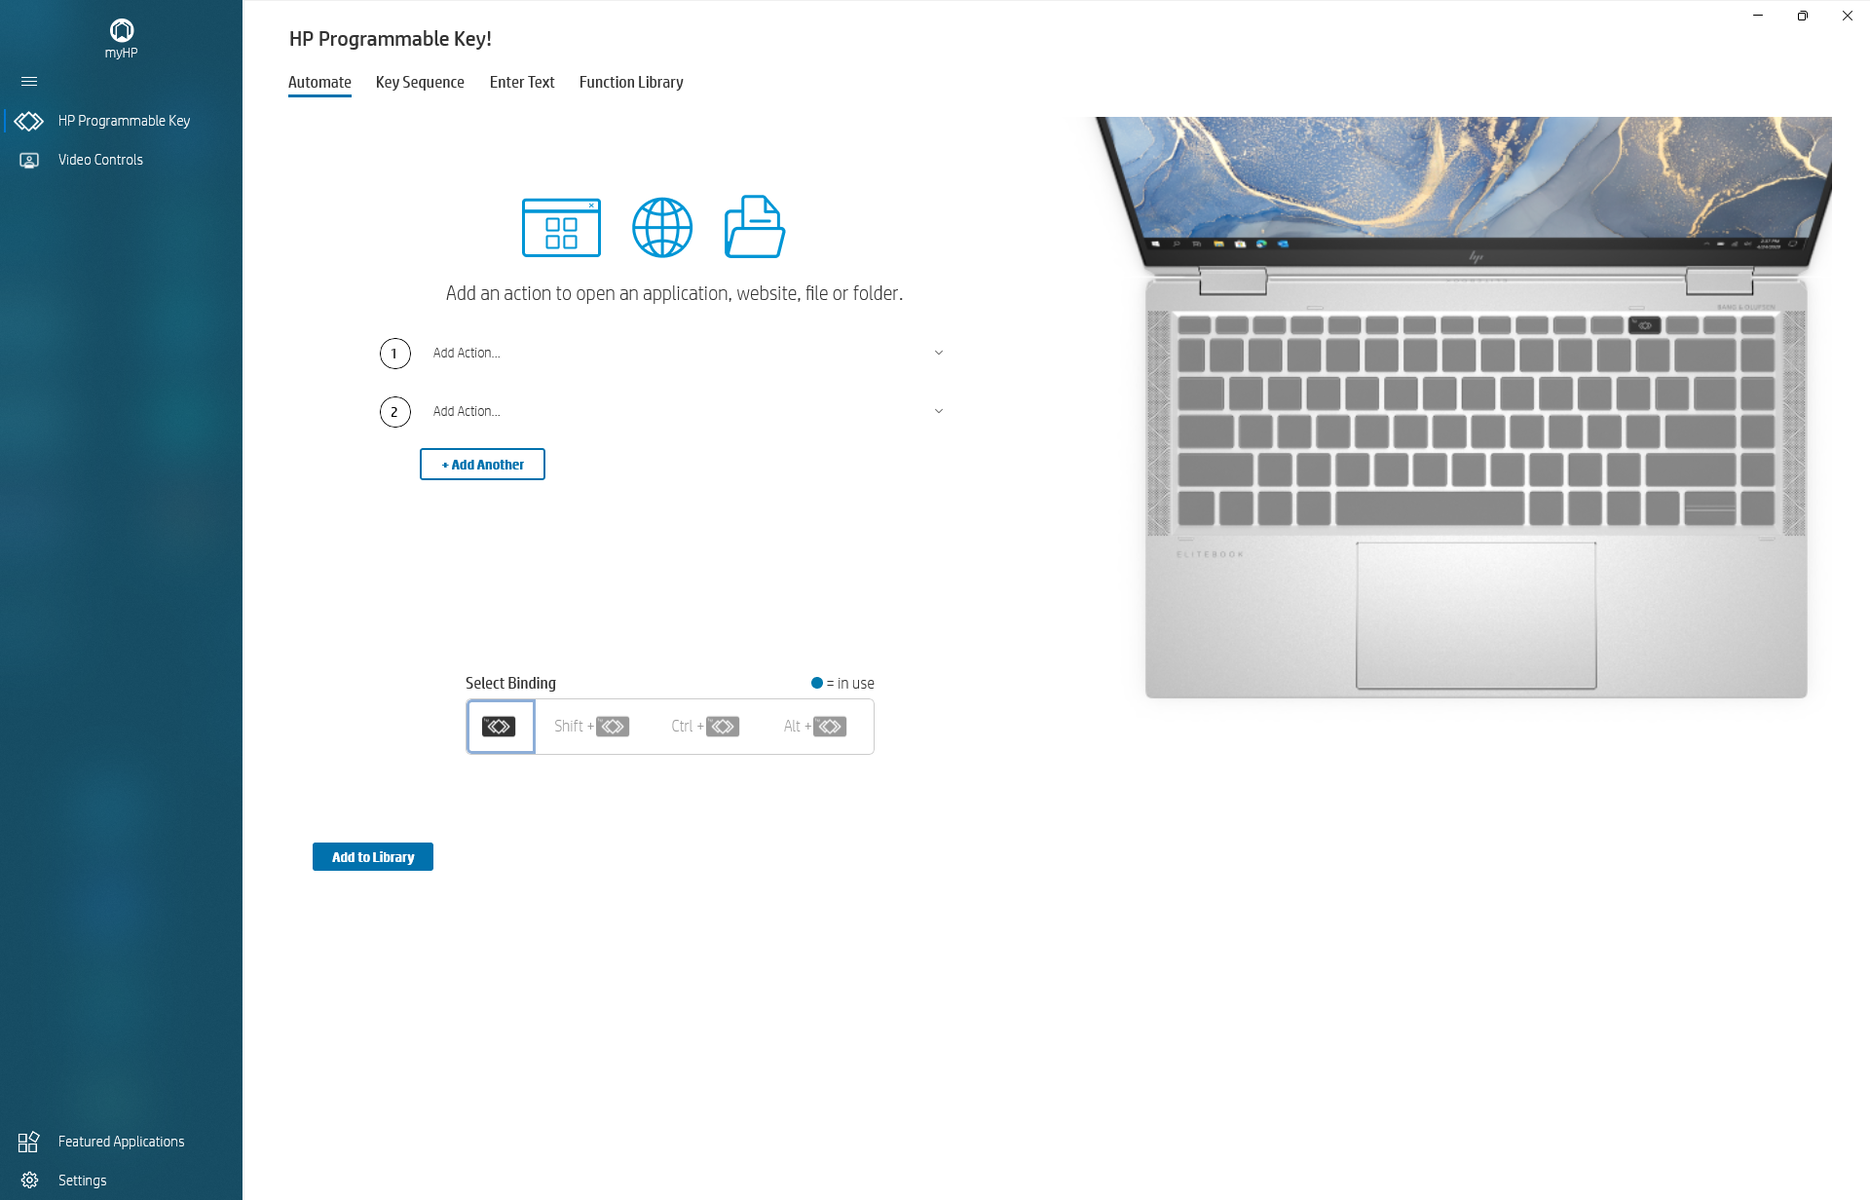
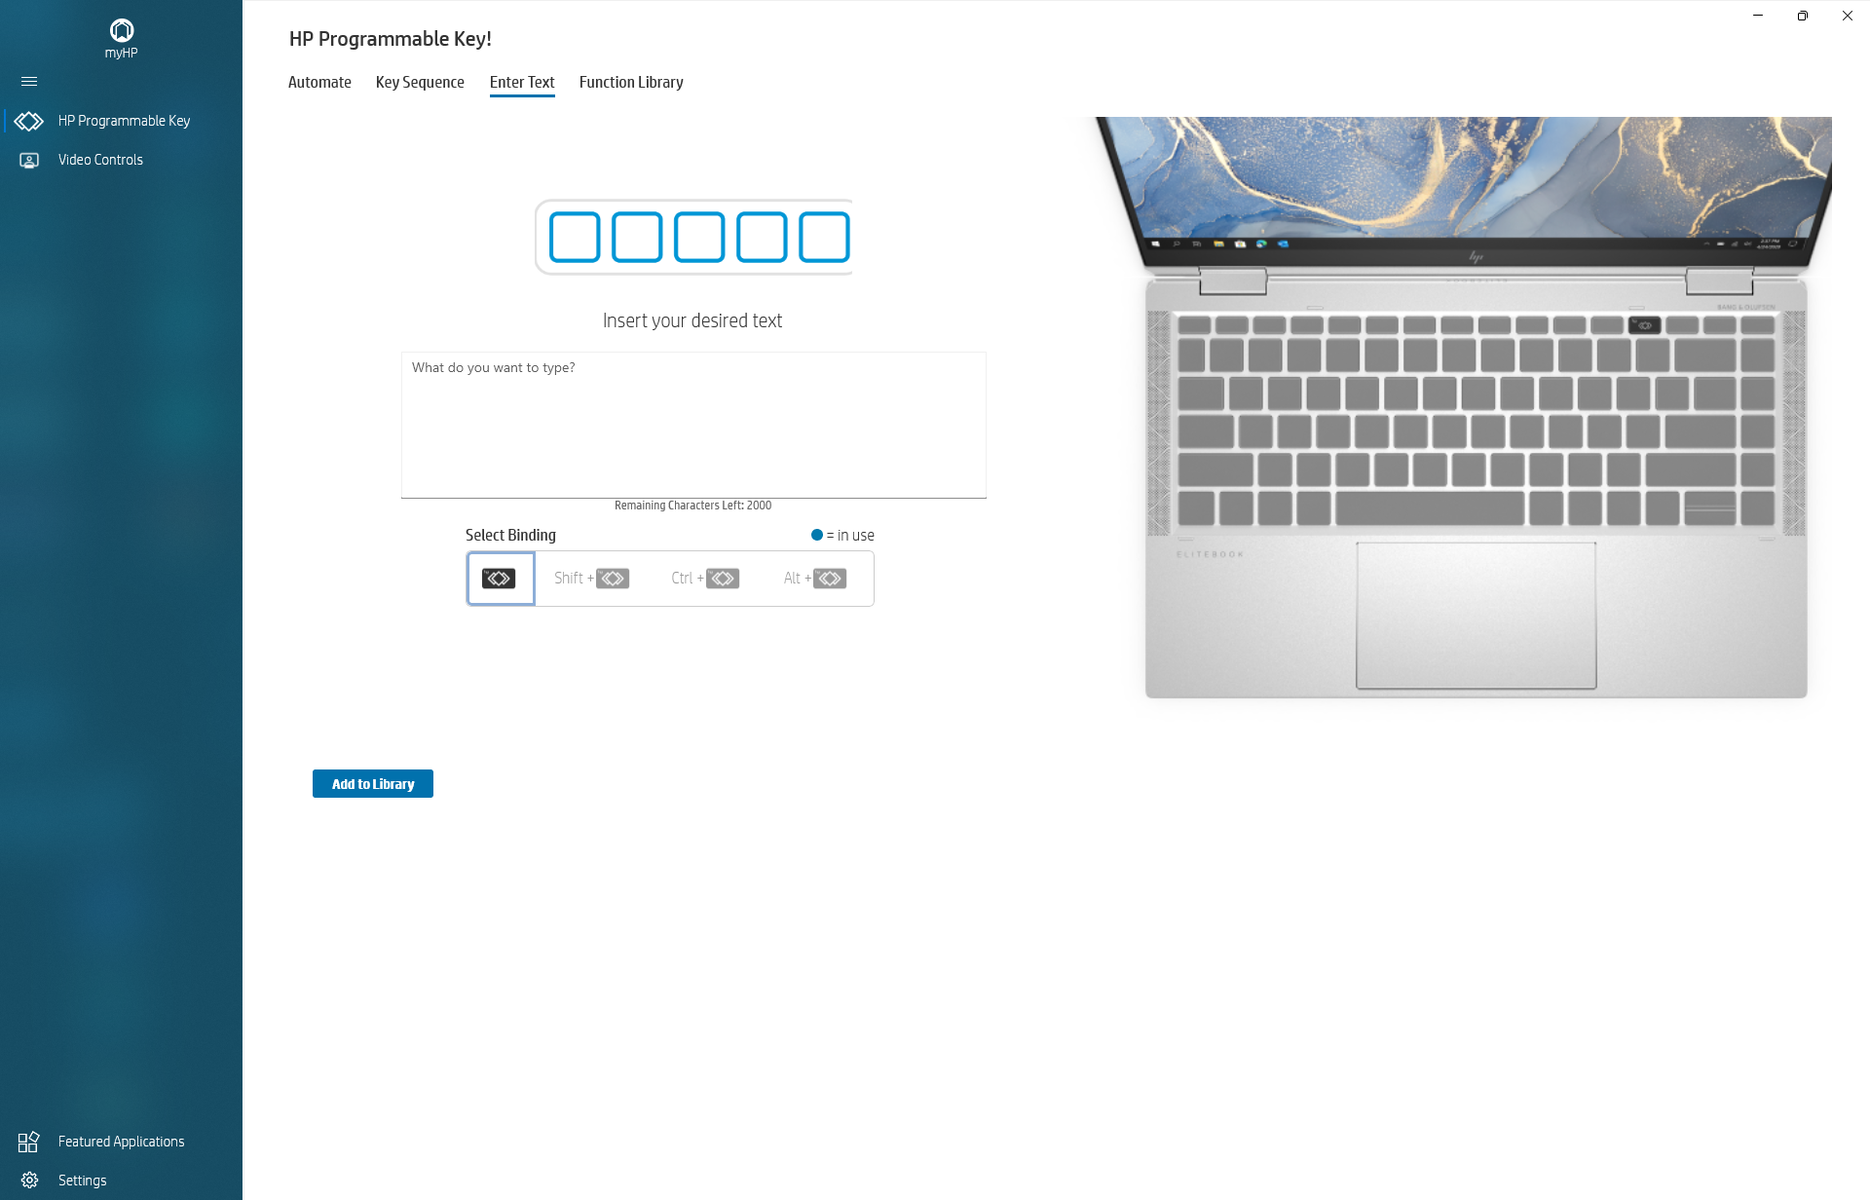
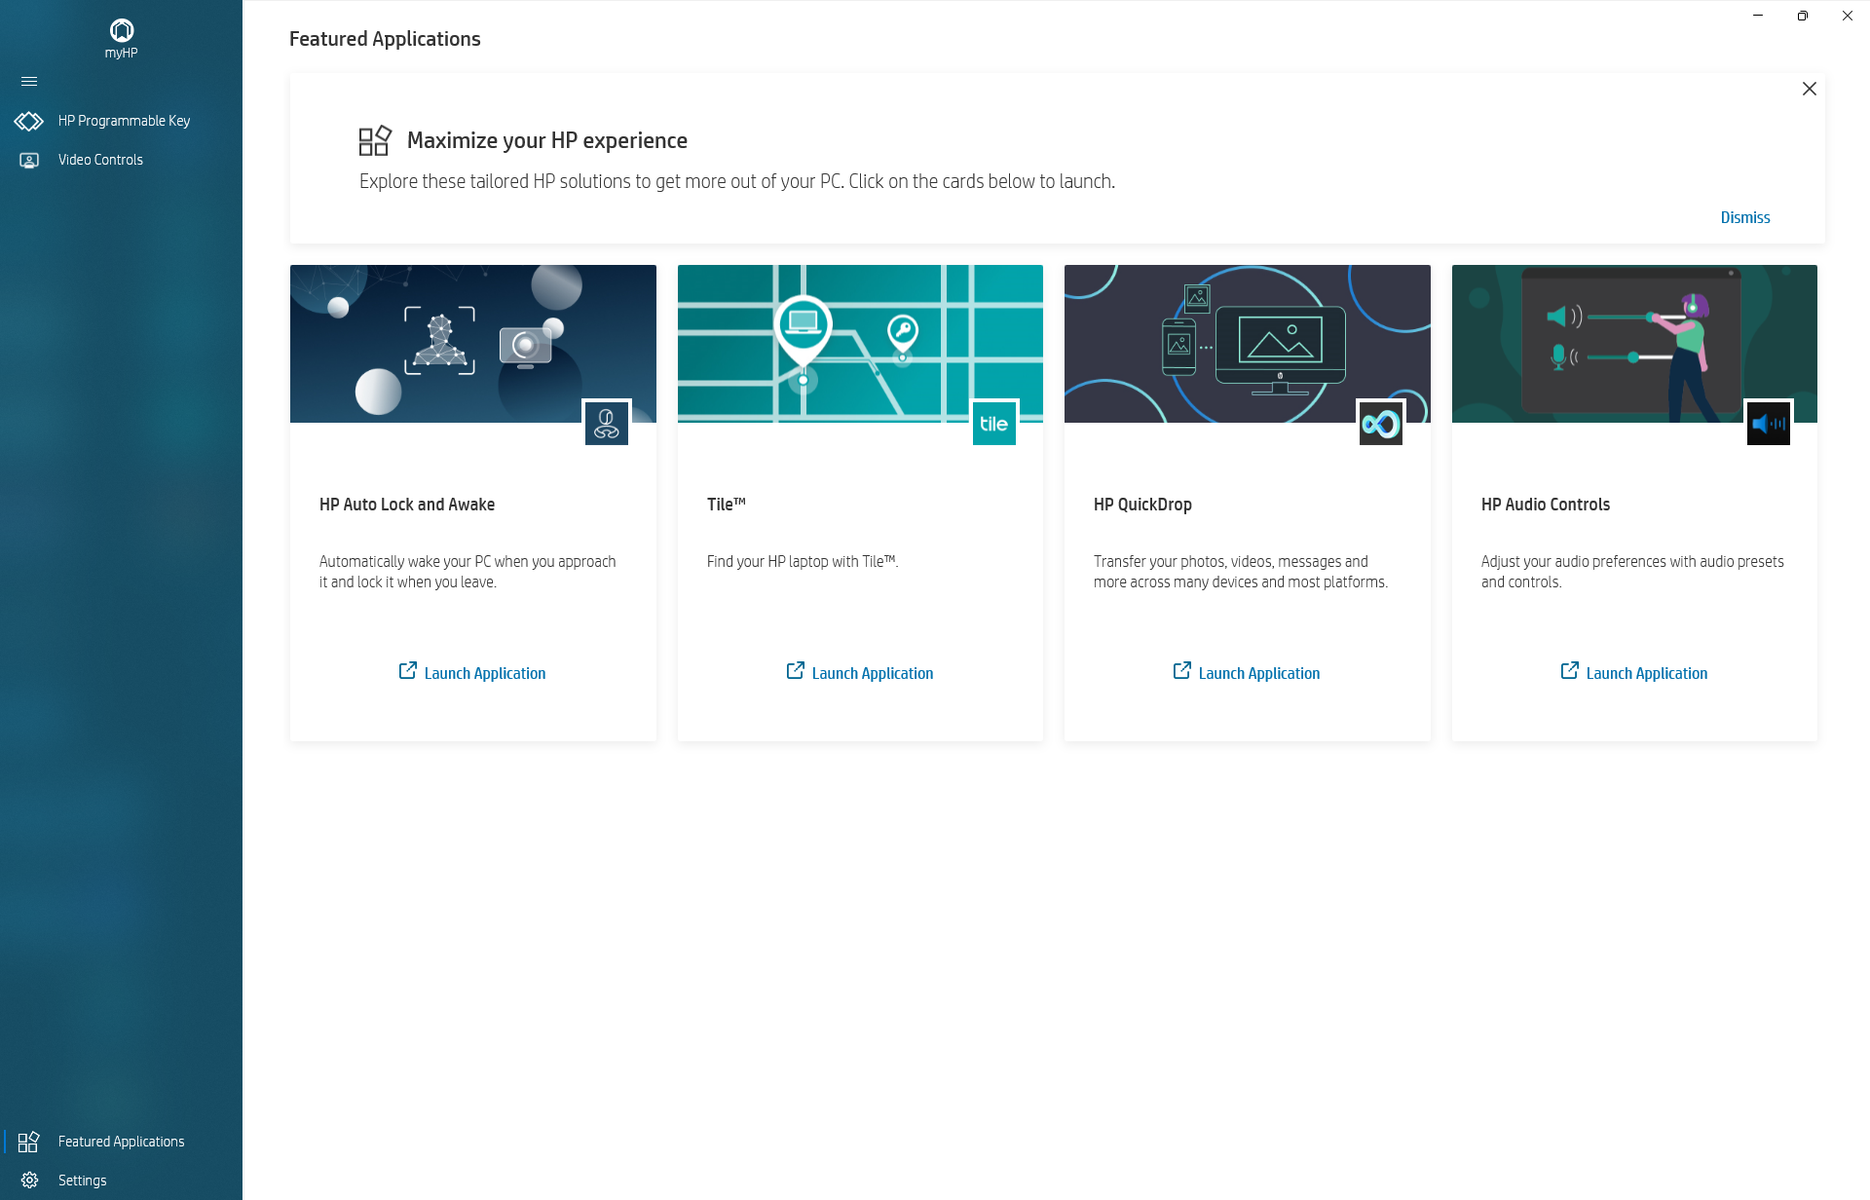
在运行以下任何基准测试之前,我们的设备通过Windows设置为性能模式。在Spectre和Envy笔记本上预装的惠普命令中心,并没有出现在以商业为中心的蜻蜓上。相反,该机型配备了惠普可编程按键、自动锁定和唤醒、磁贴、QuickDrop和音频控制。我们建议熟悉可编程钥匙和自动锁定和唤醒,因为它们对日常工作最有用的功能。后者利用红外技术,如果检测到用户在摄像头前,就会自动登录或退出,类似于更高端的戴尔Latitude 型号。下面是一些程序的屏幕截图。

处理器
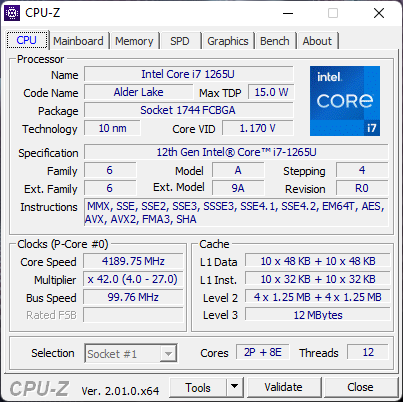
到目前为止,我们测试的三台笔记本电脑中,有的配备了 酷睿i7-1265U中,我们的Dragonfly G3是最慢的,差距很大。蜻蜓G3中的酷睿i7-1265U 戴尔Latitude 9430 2合1 在单线程和多线程基准测试中分别比我们的惠普高出20%和50%。事实上 酷睿i7-1255U在我们的Spectre x360 13.5中比我们的Core i7-1265U-powered Dragonfly G3快40%,即使考虑到任何性能节流。
循环运行CineBench R15 xT显示了有限的Turbo Boost潜力,因为CPU性能在第一次循环后会下降约19%。同样的CPU在 Latitude 7330 在进行同样的循环测试时,能够保持更高的分数和更快的性能,正如我们下面的对比图所示。
从我们的酷睿i7-1265U降级到酷睿i5-1235U SKU,预计将影响性能约25%。
Cinebench R15 Multi Loop
Cinebench R23: Multi Core | Single Core
Cinebench R15: CPU Multi 64Bit | CPU Single 64Bit
Blender: v2.79 BMW27 CPU
7-Zip 18.03: 7z b 4 | 7z b 4 -mmt1
Geekbench 5.5: Multi-Core | Single-Core
HWBOT x265 Benchmark v2.2: 4k Preset
LibreOffice : 20 Documents To PDF
R Benchmark 2.5: Overall mean
| Cinebench R20 / CPU (Multi Core) | |
| Framework Laptop 13.5 12th Gen Intel | |
| Dell Latitude 9430 2-in-1 | |
| Dell XPS 13 Plus 9320 i5-1240p | |
| HP Pavilion Aero 13 be0097nr | |
| Lenovo Yoga 6 13ALC6 | |
| Average Intel Core i7-1265U (1669 - 3584, n=10) | |
| Lenovo IdeaPad S540-13ARE-82DL000YGE | |
| Dell XPS 13 7390 Core i7-10710U | |
| HP Elite Dragonfly G3 | |
| HP Spectre x360 14t-ea000 | |
| VAIO FE 14.1 VWNC51429-SL | |
| Dell Latitude 5320-TM4V2 | |
| Asus VivoBook S13 S333JA-DS51 | |
| HP Envy 13-ba0001ng | |
| Lenovo ThinkPad X1 Titanium Yoga G1 20QA001RGE | |
| Cinebench R20 / CPU (Single Core) | |
| Dell Latitude 9430 2-in-1 | |
| Framework Laptop 13.5 12th Gen Intel | |
| Average Intel Core i7-1265U (528 - 701, n=10) | |
| Dell XPS 13 Plus 9320 i5-1240p | |
| HP Elite Dragonfly G3 | |
| VAIO FE 14.1 VWNC51429-SL | |
| HP Pavilion Aero 13 be0097nr | |
| HP Spectre x360 14t-ea000 | |
| Dell Latitude 5320-TM4V2 | |
| Lenovo Yoga 6 13ALC6 | |
| Lenovo ThinkPad X1 Titanium Yoga G1 20QA001RGE | |
| Dell XPS 13 7390 Core i7-10710U | |
| Lenovo IdeaPad S540-13ARE-82DL000YGE | |
| HP Envy 13-ba0001ng | |
| Asus VivoBook S13 S333JA-DS51 | |
| Cinebench R23 / Multi Core | |
| Framework Laptop 13.5 12th Gen Intel | |
| Dell XPS 13 Plus 9320 i5-1240p | |
| Dell Latitude 9430 2-in-1 | |
| HP Pavilion Aero 13 be0097nr | |
| Average Intel Core i7-1265U (4332 - 9219, n=10) | |
| Lenovo Yoga 6 13ALC6 | |
| HP Elite Dragonfly G3 | |
| VAIO FE 14.1 VWNC51429-SL | |
| Dell Latitude 5320-TM4V2 | |
| Asus VivoBook S13 S333JA-DS51 | |
| Lenovo ThinkPad X1 Titanium Yoga G1 20QA001RGE | |
| Cinebench R23 / Single Core | |
| Dell Latitude 9430 2-in-1 | |
| Framework Laptop 13.5 12th Gen Intel | |
| Dell XPS 13 Plus 9320 i5-1240p | |
| Average Intel Core i7-1265U (1144 - 1820, n=10) | |
| HP Elite Dragonfly G3 | |
| VAIO FE 14.1 VWNC51429-SL | |
| HP Pavilion Aero 13 be0097nr | |
| Dell Latitude 5320-TM4V2 | |
| Lenovo ThinkPad X1 Titanium Yoga G1 20QA001RGE | |
| Lenovo Yoga 6 13ALC6 | |
| Asus VivoBook S13 S333JA-DS51 | |
| Cinebench R15 / CPU Multi 64Bit | |
| Framework Laptop 13.5 12th Gen Intel | |
| Dell XPS 13 Plus 9320 i5-1240p | |
| Dell Latitude 9430 2-in-1 | |
| HP Pavilion Aero 13 be0097nr | |
| Lenovo IdeaPad S540-13ARE-82DL000YGE | |
| Average Intel Core i7-1265U (706 - 1572, n=10) | |
| HP Elite Dragonfly G3 | |
| Lenovo Yoga 6 13ALC6 | |
| Dell XPS 13 7390 Core i7-10710U | |
| HP Spectre x360 14t-ea000 | |
| VAIO FE 14.1 VWNC51429-SL | |
| Lenovo ThinkPad X1 Titanium Yoga G1 20QA001RGE | |
| Dell Latitude 5320-TM4V2 | |
| Asus VivoBook S13 S333JA-DS51 | |
| HP Envy 13-ba0001ng | |
| Cinebench R15 / CPU Single 64Bit | |
| Dell Latitude 9430 2-in-1 | |
| Framework Laptop 13.5 12th Gen Intel | |
| Average Intel Core i7-1265U (165.3 - 260, n=10) | |
| HP Pavilion Aero 13 be0097nr | |
| Dell XPS 13 Plus 9320 i5-1240p | |
| HP Elite Dragonfly G3 | |
| VAIO FE 14.1 VWNC51429-SL | |
| HP Spectre x360 14t-ea000 | |
| Lenovo ThinkPad X1 Titanium Yoga G1 20QA001RGE | |
| Dell Latitude 5320-TM4V2 | |
| Lenovo Yoga 6 13ALC6 | |
| Dell XPS 13 7390 Core i7-10710U | |
| HP Envy 13-ba0001ng | |
| Lenovo IdeaPad S540-13ARE-82DL000YGE | |
| Asus VivoBook S13 S333JA-DS51 | |
| Blender / v2.79 BMW27 CPU | |
| Lenovo ThinkPad X1 Titanium Yoga G1 20QA001RGE | |
| HP Envy 13-ba0001ng | |
| Asus VivoBook S13 S333JA-DS51 | |
| VAIO FE 14.1 VWNC51429-SL | |
| Dell Latitude 5320-TM4V2 | |
| HP Spectre x360 14t-ea000 | |
| Dell XPS 13 7390 Core i7-10710U | |
| HP Elite Dragonfly G3 | |
| Average Intel Core i7-1265U (364 - 684, n=10) | |
| Lenovo IdeaPad S540-13ARE-82DL000YGE | |
| Lenovo Yoga 6 13ALC6 | |
| Dell XPS 13 Plus 9320 i5-1240p | |
| HP Pavilion Aero 13 be0097nr | |
| Framework Laptop 13.5 12th Gen Intel | |
| 7-Zip 18.03 / 7z b 4 | |
| Framework Laptop 13.5 12th Gen Intel | |
| HP Pavilion Aero 13 be0097nr | |
| Dell XPS 13 Plus 9320 i5-1240p | |
| Lenovo Yoga 6 13ALC6 | |
| Dell Latitude 9430 2-in-1 | |
| Lenovo IdeaPad S540-13ARE-82DL000YGE | |
| Average Intel Core i7-1265U (20087 - 38715, n=10) | |
| HP Elite Dragonfly G3 | |
| Dell XPS 13 7390 Core i7-10710U | |
| HP Spectre x360 14t-ea000 | |
| Dell Latitude 5320-TM4V2 | |
| VAIO FE 14.1 VWNC51429-SL | |
| Asus VivoBook S13 S333JA-DS51 | |
| HP Envy 13-ba0001ng | |
| Lenovo ThinkPad X1 Titanium Yoga G1 20QA001RGE | |
| 7-Zip 18.03 / 7z b 4 -mmt1 | |
| Framework Laptop 13.5 12th Gen Intel | |
| Dell Latitude 9430 2-in-1 | |
| HP Pavilion Aero 13 be0097nr | |
| Average Intel Core i7-1265U (4614 - 5617, n=10) | |
| HP Spectre x360 14t-ea000 | |
| HP Elite Dragonfly G3 | |
| Dell XPS 13 Plus 9320 i5-1240p | |
| VAIO FE 14.1 VWNC51429-SL | |
| HP Envy 13-ba0001ng | |
| Lenovo ThinkPad X1 Titanium Yoga G1 20QA001RGE | |
| Lenovo Yoga 6 13ALC6 | |
| Dell Latitude 5320-TM4V2 | |
| Dell XPS 13 7390 Core i7-10710U | |
| Lenovo IdeaPad S540-13ARE-82DL000YGE | |
| Asus VivoBook S13 S333JA-DS51 | |
| Geekbench 5.5 / Multi-Core | |
| Framework Laptop 13.5 12th Gen Intel | |
| Dell Latitude 9430 2-in-1 | |
| HP Elite Dragonfly G3 | |
| Average Intel Core i7-1265U (5022 - 8981, n=10) | |
| VAIO FE 14.1 VWNC51429-SL | |
| Lenovo IdeaPad S540-13ARE-82DL000YGE | |
| HP Spectre x360 14t-ea000 | |
| Lenovo ThinkPad X1 Titanium Yoga G1 20QA001RGE | |
| Dell Latitude 5320-TM4V2 | |
| Dell XPS 13 Plus 9320 i5-1240p | |
| Asus VivoBook S13 S333JA-DS51 | |
| HP Envy 13-ba0001ng | |
| HP EliteBook Folio 13.5-3G2L2EA | |
| Geekbench 5.5 / Single-Core | |
| Dell Latitude 9430 2-in-1 | |
| Framework Laptop 13.5 12th Gen Intel | |
| Average Intel Core i7-1265U (1429 - 1806, n=10) | |
| VAIO FE 14.1 VWNC51429-SL | |
| Dell XPS 13 Plus 9320 i5-1240p | |
| HP Spectre x360 14t-ea000 | |
| HP Elite Dragonfly G3 | |
| Lenovo ThinkPad X1 Titanium Yoga G1 20QA001RGE | |
| Dell Latitude 5320-TM4V2 | |
| HP Envy 13-ba0001ng | |
| Asus VivoBook S13 S333JA-DS51 | |
| Lenovo IdeaPad S540-13ARE-82DL000YGE | |
| HP EliteBook Folio 13.5-3G2L2EA | |
| HWBOT x265 Benchmark v2.2 / 4k Preset | |
| Framework Laptop 13.5 12th Gen Intel | |
| Dell XPS 13 Plus 9320 i5-1240p | |
| Dell Latitude 9430 2-in-1 | |
| HP Pavilion Aero 13 be0097nr | |
| Lenovo Yoga 6 13ALC6 | |
| Lenovo IdeaPad S540-13ARE-82DL000YGE | |
| Average Intel Core i7-1265U (5.09 - 10.6, n=10) | |
| HP Elite Dragonfly G3 | |
| HP Spectre x360 14t-ea000 | |
| Dell XPS 13 7390 Core i7-10710U | |
| Asus VivoBook S13 S333JA-DS51 | |
| VAIO FE 14.1 VWNC51429-SL | |
| HP Envy 13-ba0001ng | |
| Lenovo ThinkPad X1 Titanium Yoga G1 20QA001RGE | |
| LibreOffice / 20 Documents To PDF | |
| Lenovo IdeaPad S540-13ARE-82DL000YGE | |
| Dell XPS 13 Plus 9320 i5-1240p | |
| Lenovo Yoga 6 13ALC6 | |
| HP Elite Dragonfly G3 | |
| Asus VivoBook S13 S333JA-DS51 | |
| Dell Latitude 5320-TM4V2 | |
| HP Envy 13-ba0001ng | |
| HP Pavilion Aero 13 be0097nr | |
| HP Spectre x360 14t-ea000 | |
| VAIO FE 14.1 VWNC51429-SL | |
| Average Intel Core i7-1265U (44 - 61.6, n=10) | |
| Lenovo ThinkPad X1 Titanium Yoga G1 20QA001RGE | |
| Dell Latitude 9430 2-in-1 | |
| Framework Laptop 13.5 12th Gen Intel | |
| R Benchmark 2.5 / Overall mean | |
| Asus VivoBook S13 S333JA-DS51 | |
| HP Envy 13-ba0001ng | |
| Dell Latitude 5320-TM4V2 | |
| Lenovo ThinkPad X1 Titanium Yoga G1 20QA001RGE | |
| Lenovo IdeaPad S540-13ARE-82DL000YGE | |
| HP Spectre x360 14t-ea000 | |
| Lenovo Yoga 6 13ALC6 | |
| HP Pavilion Aero 13 be0097nr | |
| HP Elite Dragonfly G3 | |
| VAIO FE 14.1 VWNC51429-SL | |
| Dell XPS 13 Plus 9320 i5-1240p | |
| Average Intel Core i7-1265U (0.4666 - 0.578, n=10) | |
| Dell Latitude 9430 2-in-1 | |
| Framework Laptop 13.5 12th Gen Intel | |
Cinebench R23: Multi Core | Single Core
Cinebench R15: CPU Multi 64Bit | CPU Single 64Bit
Blender: v2.79 BMW27 CPU
7-Zip 18.03: 7z b 4 | 7z b 4 -mmt1
Geekbench 5.5: Multi-Core | Single-Core
HWBOT x265 Benchmark v2.2: 4k Preset
LibreOffice : 20 Documents To PDF
R Benchmark 2.5: Overall mean
* ... smaller is better
AIDA64: FP32 Ray-Trace | FPU Julia | CPU SHA3 | CPU Queen | FPU SinJulia | FPU Mandel | CPU AES | CPU ZLib | FP64 Ray-Trace | CPU PhotoWorxx
| Performance rating | |
| Framework Laptop 13.5 12th Gen Intel | |
| Dell XPS 13 Plus 9320 i5-1240p | |
| Average Intel Core i7-1265U | |
| HP Elite Dragonfly G3 | |
| Lenovo ThinkPad X1 Titanium Yoga G1 20QA001RGE | |
| AIDA64 / FP32 Ray-Trace | |
| Average Intel Core i7-1265U (2619 - 8178, n=10) | |
| HP Elite Dragonfly G3 | |
| Framework Laptop 13.5 12th Gen Intel | |
| Dell XPS 13 Plus 9320 i5-1240p | |
| Lenovo ThinkPad X1 Titanium Yoga G1 20QA001RGE | |
| AIDA64 / FPU Julia | |
| Average Intel Core i7-1265U (12909 - 41649, n=10) | |
| HP Elite Dragonfly G3 | |
| Framework Laptop 13.5 12th Gen Intel | |
| Dell XPS 13 Plus 9320 i5-1240p | |
| Lenovo ThinkPad X1 Titanium Yoga G1 20QA001RGE | |
| AIDA64 / CPU SHA3 | |
| Framework Laptop 13.5 12th Gen Intel | |
| Dell XPS 13 Plus 9320 i5-1240p | |
| Average Intel Core i7-1265U (824 - 2183, n=10) | |
| HP Elite Dragonfly G3 | |
| Lenovo ThinkPad X1 Titanium Yoga G1 20QA001RGE | |
| AIDA64 / CPU Queen | |
| Framework Laptop 13.5 12th Gen Intel | |
| Dell XPS 13 Plus 9320 i5-1240p | |
| Average Intel Core i7-1265U (63615 - 67065, n=10) | |
| HP Elite Dragonfly G3 | |
| Lenovo ThinkPad X1 Titanium Yoga G1 20QA001RGE | |
| AIDA64 / FPU SinJulia | |
| Framework Laptop 13.5 12th Gen Intel | |
| Dell XPS 13 Plus 9320 i5-1240p | |
| Average Intel Core i7-1265U (3105 - 5135, n=10) | |
| HP Elite Dragonfly G3 | |
| Lenovo ThinkPad X1 Titanium Yoga G1 20QA001RGE | |
| AIDA64 / FPU Mandel | |
| Average Intel Core i7-1265U (6967 - 20804, n=10) | |
| HP Elite Dragonfly G3 | |
| Framework Laptop 13.5 12th Gen Intel | |
| Dell XPS 13 Plus 9320 i5-1240p | |
| Lenovo ThinkPad X1 Titanium Yoga G1 20QA001RGE | |
| AIDA64 / CPU AES | |
| Framework Laptop 13.5 12th Gen Intel | |
| Lenovo ThinkPad X1 Titanium Yoga G1 20QA001RGE | |
| Dell XPS 13 Plus 9320 i5-1240p | |
| Average Intel Core i7-1265U (19489 - 42966, n=10) | |
| HP Elite Dragonfly G3 | |
| AIDA64 / CPU ZLib | |
| Framework Laptop 13.5 12th Gen Intel | |
| Dell XPS 13 Plus 9320 i5-1240p | |
| Average Intel Core i7-1265U (314 - 632, n=10) | |
| HP Elite Dragonfly G3 | |
| Lenovo ThinkPad X1 Titanium Yoga G1 20QA001RGE | |
| AIDA64 / FP64 Ray-Trace | |
| Average Intel Core i7-1265U (1473 - 4376, n=10) | |
| HP Elite Dragonfly G3 | |
| Framework Laptop 13.5 12th Gen Intel | |
| Dell XPS 13 Plus 9320 i5-1240p | |
| Lenovo ThinkPad X1 Titanium Yoga G1 20QA001RGE | |
| AIDA64 / CPU PhotoWorxx | |
| Lenovo ThinkPad X1 Titanium Yoga G1 20QA001RGE | |
| HP Elite Dragonfly G3 | |
| Dell XPS 13 Plus 9320 i5-1240p | |
| Average Intel Core i7-1265U (20213 - 47031, n=10) | |
| Framework Laptop 13.5 12th Gen Intel | |
系统性能
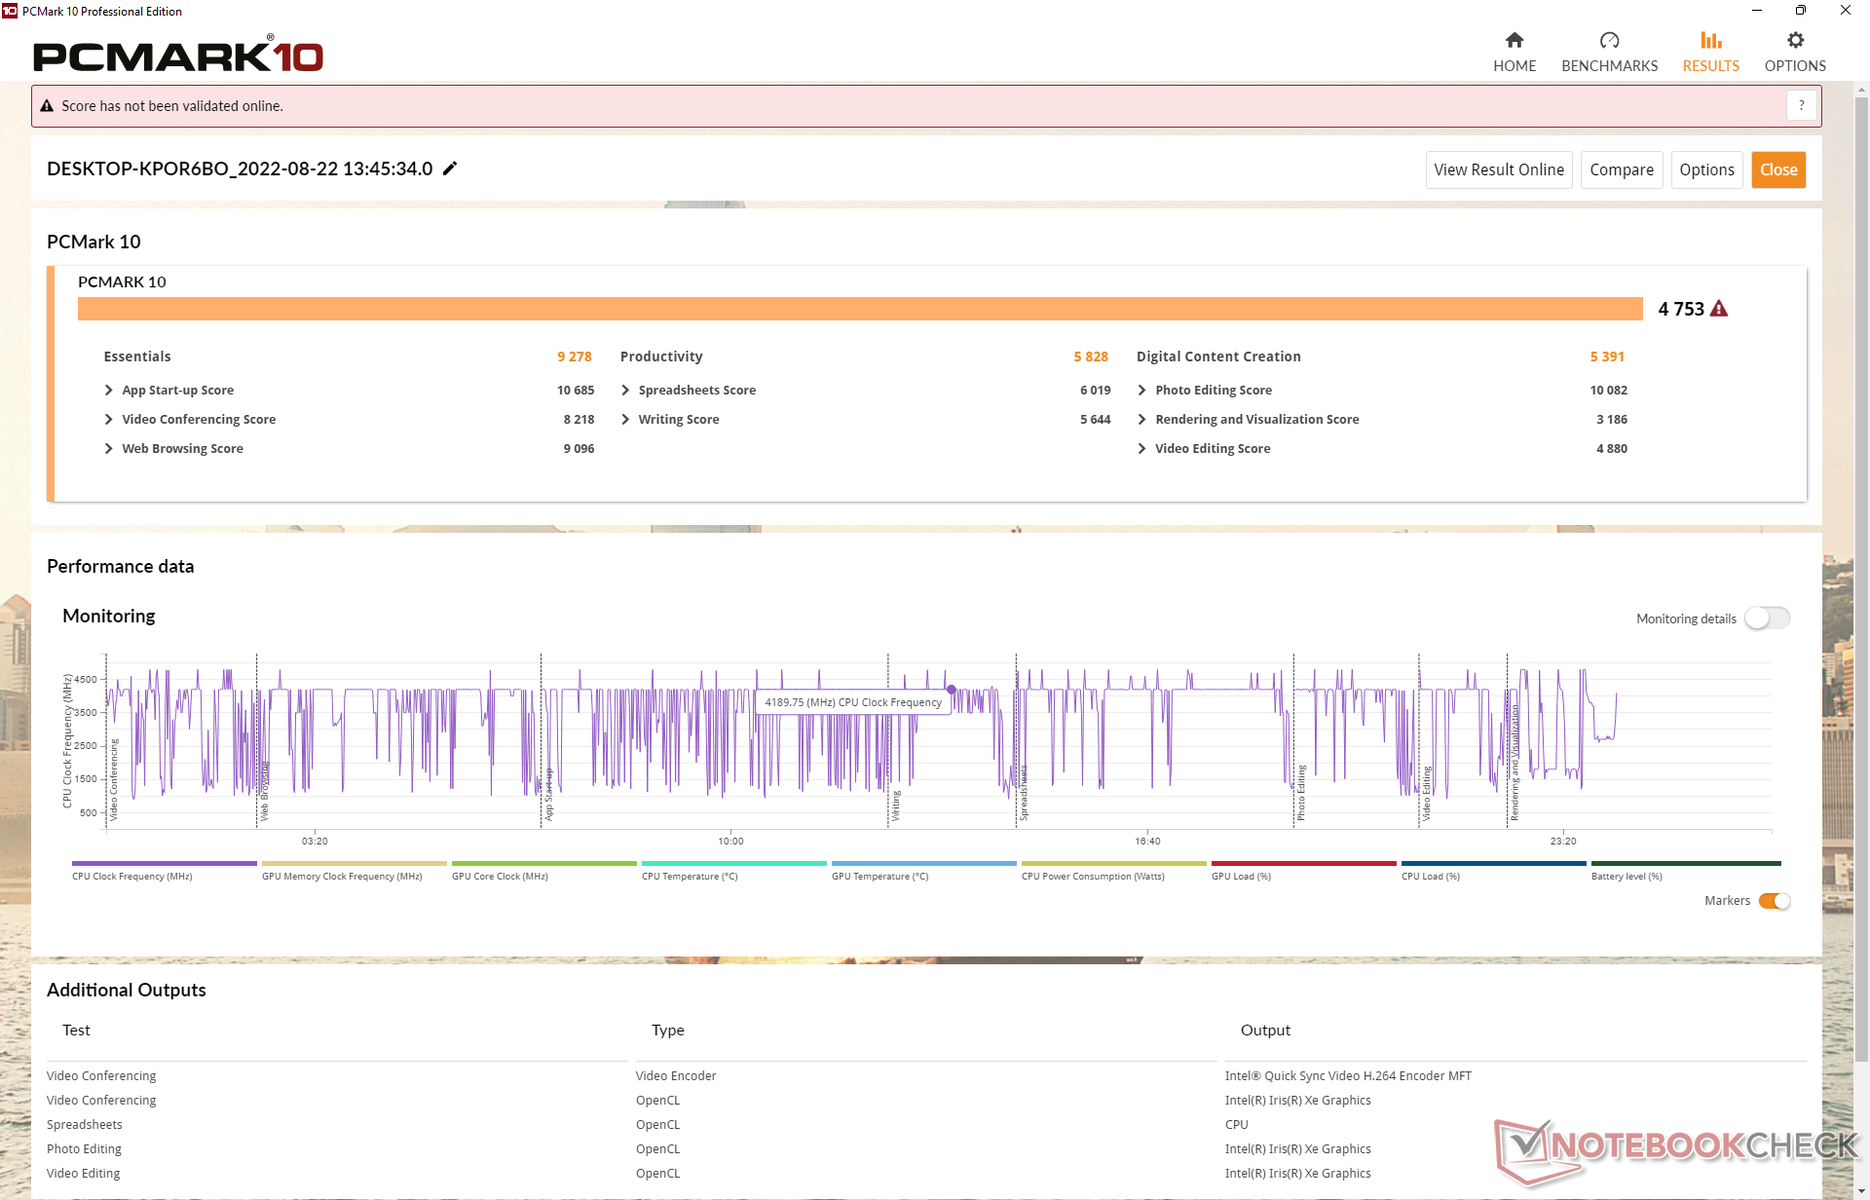
有趣的是,PCMark的结果比我们在配备上一代酷睿i7处理器的Spectre x360 14上记录的结果略低。不要指望蜻蜓G3在浏览、视频流或运行其他要求不高的工作负载时能有明显的速度。
CrossMark: Overall | Productivity | Creativity | Responsiveness
| PCMark 10 / Score | |
| Framework Laptop 13.5 12th Gen Intel | |
| Average Intel Core i7-1265U, Intel Iris Xe Graphics G7 96EUs (4753 - 5766, n=7) | |
| HP Spectre x360 14t-ea000 | |
| Dell XPS 13 Plus 9320 i5-1240p | |
| HP Elite Dragonfly G3 | |
| Lenovo ThinkPad X1 Titanium Yoga G1 20QA001RGE | |
| PCMark 10 / Essentials | |
| Framework Laptop 13.5 12th Gen Intel | |
| Average Intel Core i7-1265U, Intel Iris Xe Graphics G7 96EUs (9278 - 11418, n=7) | |
| Lenovo ThinkPad X1 Titanium Yoga G1 20QA001RGE | |
| HP Spectre x360 14t-ea000 | |
| HP Elite Dragonfly G3 | |
| Dell XPS 13 Plus 9320 i5-1240p | |
| PCMark 10 / Productivity | |
| Framework Laptop 13.5 12th Gen Intel | |
| HP Spectre x360 14t-ea000 | |
| Average Intel Core i7-1265U, Intel Iris Xe Graphics G7 96EUs (5828 - 7311, n=7) | |
| Lenovo ThinkPad X1 Titanium Yoga G1 20QA001RGE | |
| Dell XPS 13 Plus 9320 i5-1240p | |
| HP Elite Dragonfly G3 | |
| PCMark 10 / Digital Content Creation | |
| Framework Laptop 13.5 12th Gen Intel | |
| Average Intel Core i7-1265U, Intel Iris Xe Graphics G7 96EUs (5127 - 6330, n=7) | |
| Dell XPS 13 Plus 9320 i5-1240p | |
| HP Elite Dragonfly G3 | |
| HP Spectre x360 14t-ea000 | |
| Lenovo ThinkPad X1 Titanium Yoga G1 20QA001RGE | |
| CrossMark / Overall | |
| Framework Laptop 13.5 12th Gen Intel | |
| Average Intel Core i7-1265U, Intel Iris Xe Graphics G7 96EUs (1301 - 1615, n=7) | |
| Dell XPS 13 Plus 9320 i5-1240p | |
| HP Elite Dragonfly G3 | |
| CrossMark / Productivity | |
| Framework Laptop 13.5 12th Gen Intel | |
| Average Intel Core i7-1265U, Intel Iris Xe Graphics G7 96EUs (1230 - 1586, n=7) | |
| Dell XPS 13 Plus 9320 i5-1240p | |
| HP Elite Dragonfly G3 | |
| CrossMark / Creativity | |
| Framework Laptop 13.5 12th Gen Intel | |
| Average Intel Core i7-1265U, Intel Iris Xe Graphics G7 96EUs (1413 - 1706, n=7) | |
| Dell XPS 13 Plus 9320 i5-1240p | |
| HP Elite Dragonfly G3 | |
| CrossMark / Responsiveness | |
| Framework Laptop 13.5 12th Gen Intel | |
| Average Intel Core i7-1265U, Intel Iris Xe Graphics G7 96EUs (1193 - 1521, n=7) | |
| Dell XPS 13 Plus 9320 i5-1240p | |
| HP Elite Dragonfly G3 | |
| PCMark 10 Score | 4753 points | |
Help | ||
| AIDA64 / Memory Copy | |
| HP Elite Dragonfly G3 | |
| Dell XPS 13 Plus 9320 i5-1240p | |
| Average Intel Core i7-1265U (40212 - 72204, n=10) | |
| Lenovo ThinkPad X1 Titanium Yoga G1 20QA001RGE | |
| Framework Laptop 13.5 12th Gen Intel | |
| AIDA64 / Memory Read | |
| Dell XPS 13 Plus 9320 i5-1240p | |
| HP Elite Dragonfly G3 | |
| Lenovo ThinkPad X1 Titanium Yoga G1 20QA001RGE | |
| Average Intel Core i7-1265U (41808 - 69493, n=10) | |
| Framework Laptop 13.5 12th Gen Intel | |
| AIDA64 / Memory Write | |
| Lenovo ThinkPad X1 Titanium Yoga G1 20QA001RGE | |
| Dell XPS 13 Plus 9320 i5-1240p | |
| Average Intel Core i7-1265U (41382 - 76027, n=10) | |
| HP Elite Dragonfly G3 | |
| Framework Laptop 13.5 12th Gen Intel | |
| AIDA64 / Memory Latency | |
| HP Elite Dragonfly G3 | |
| Average Intel Core i7-1265U (74.6 - 112.4, n=10) | |
| Lenovo ThinkPad X1 Titanium Yoga G1 20QA001RGE | |
| Framework Laptop 13.5 12th Gen Intel | |
* ... smaller is better
DPC延时
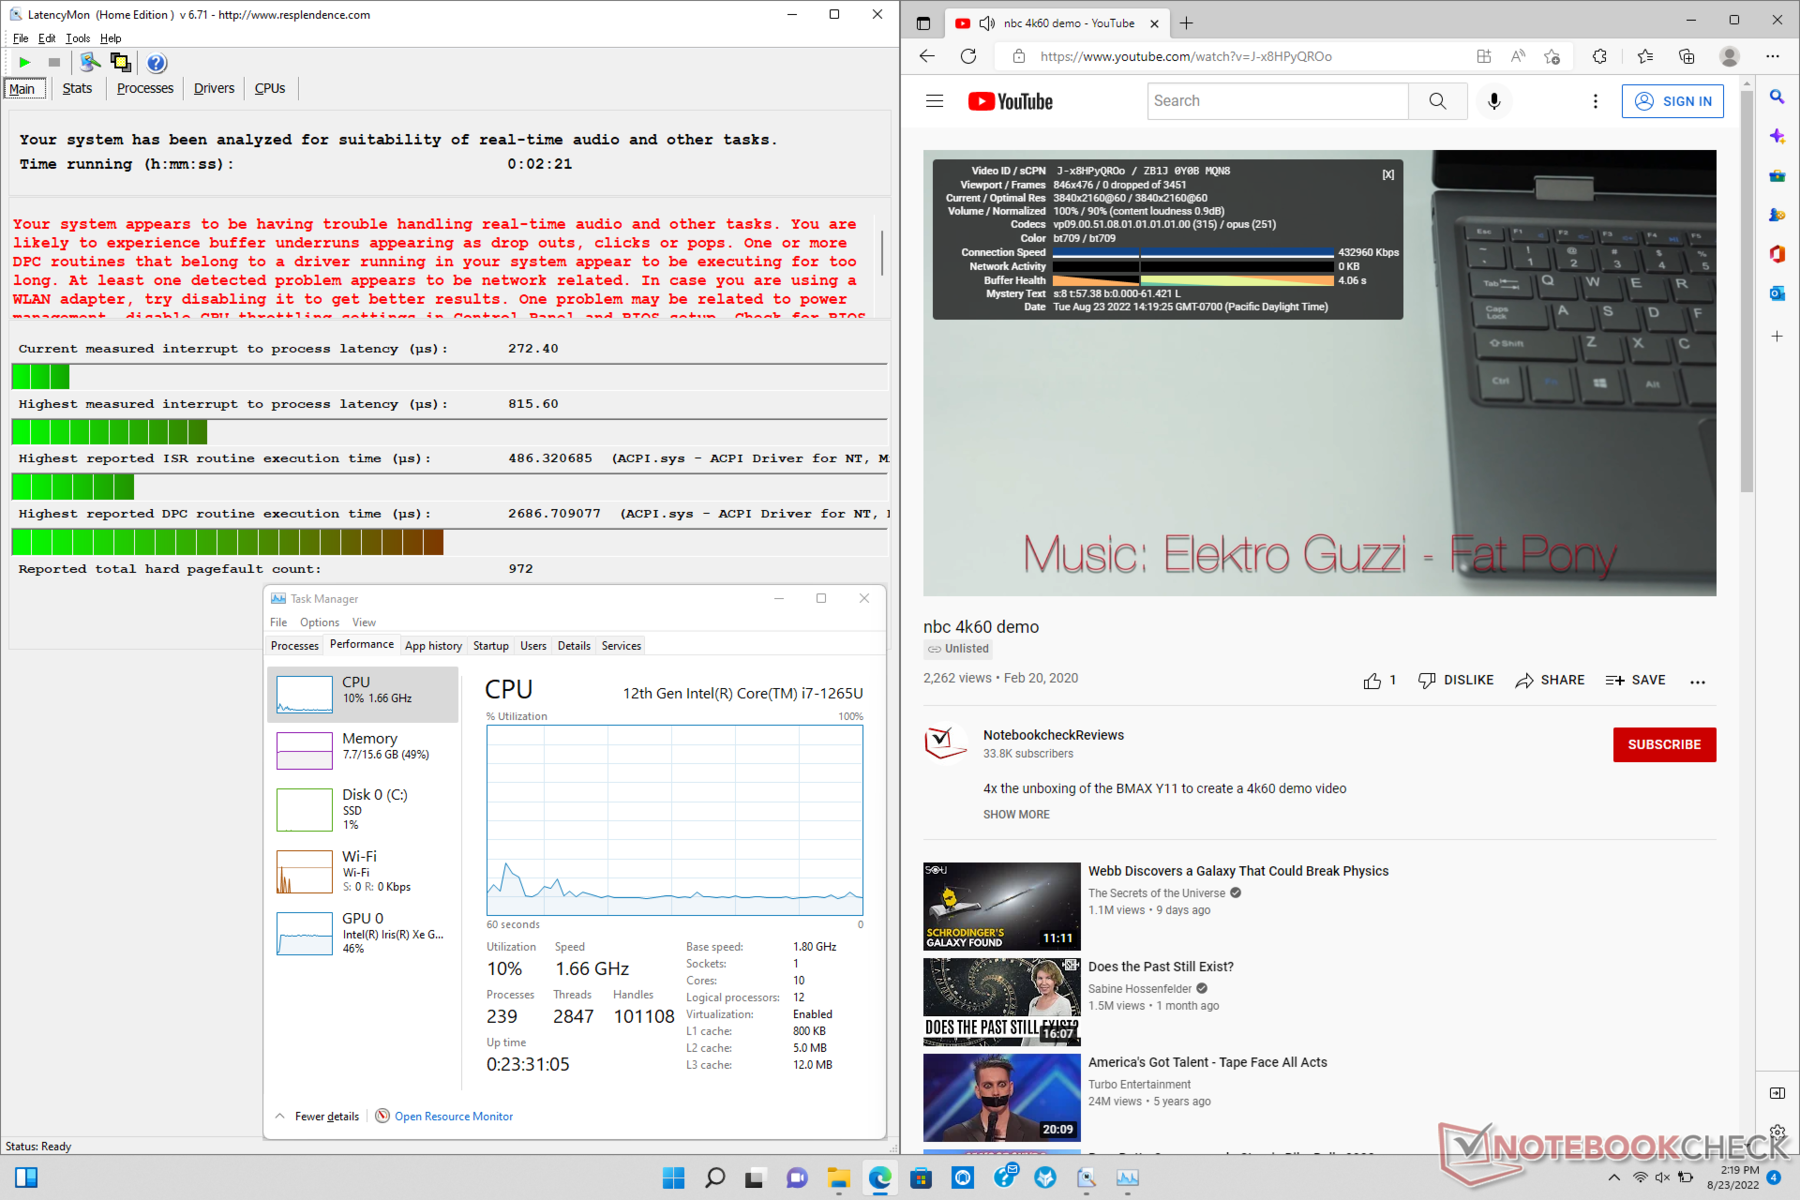
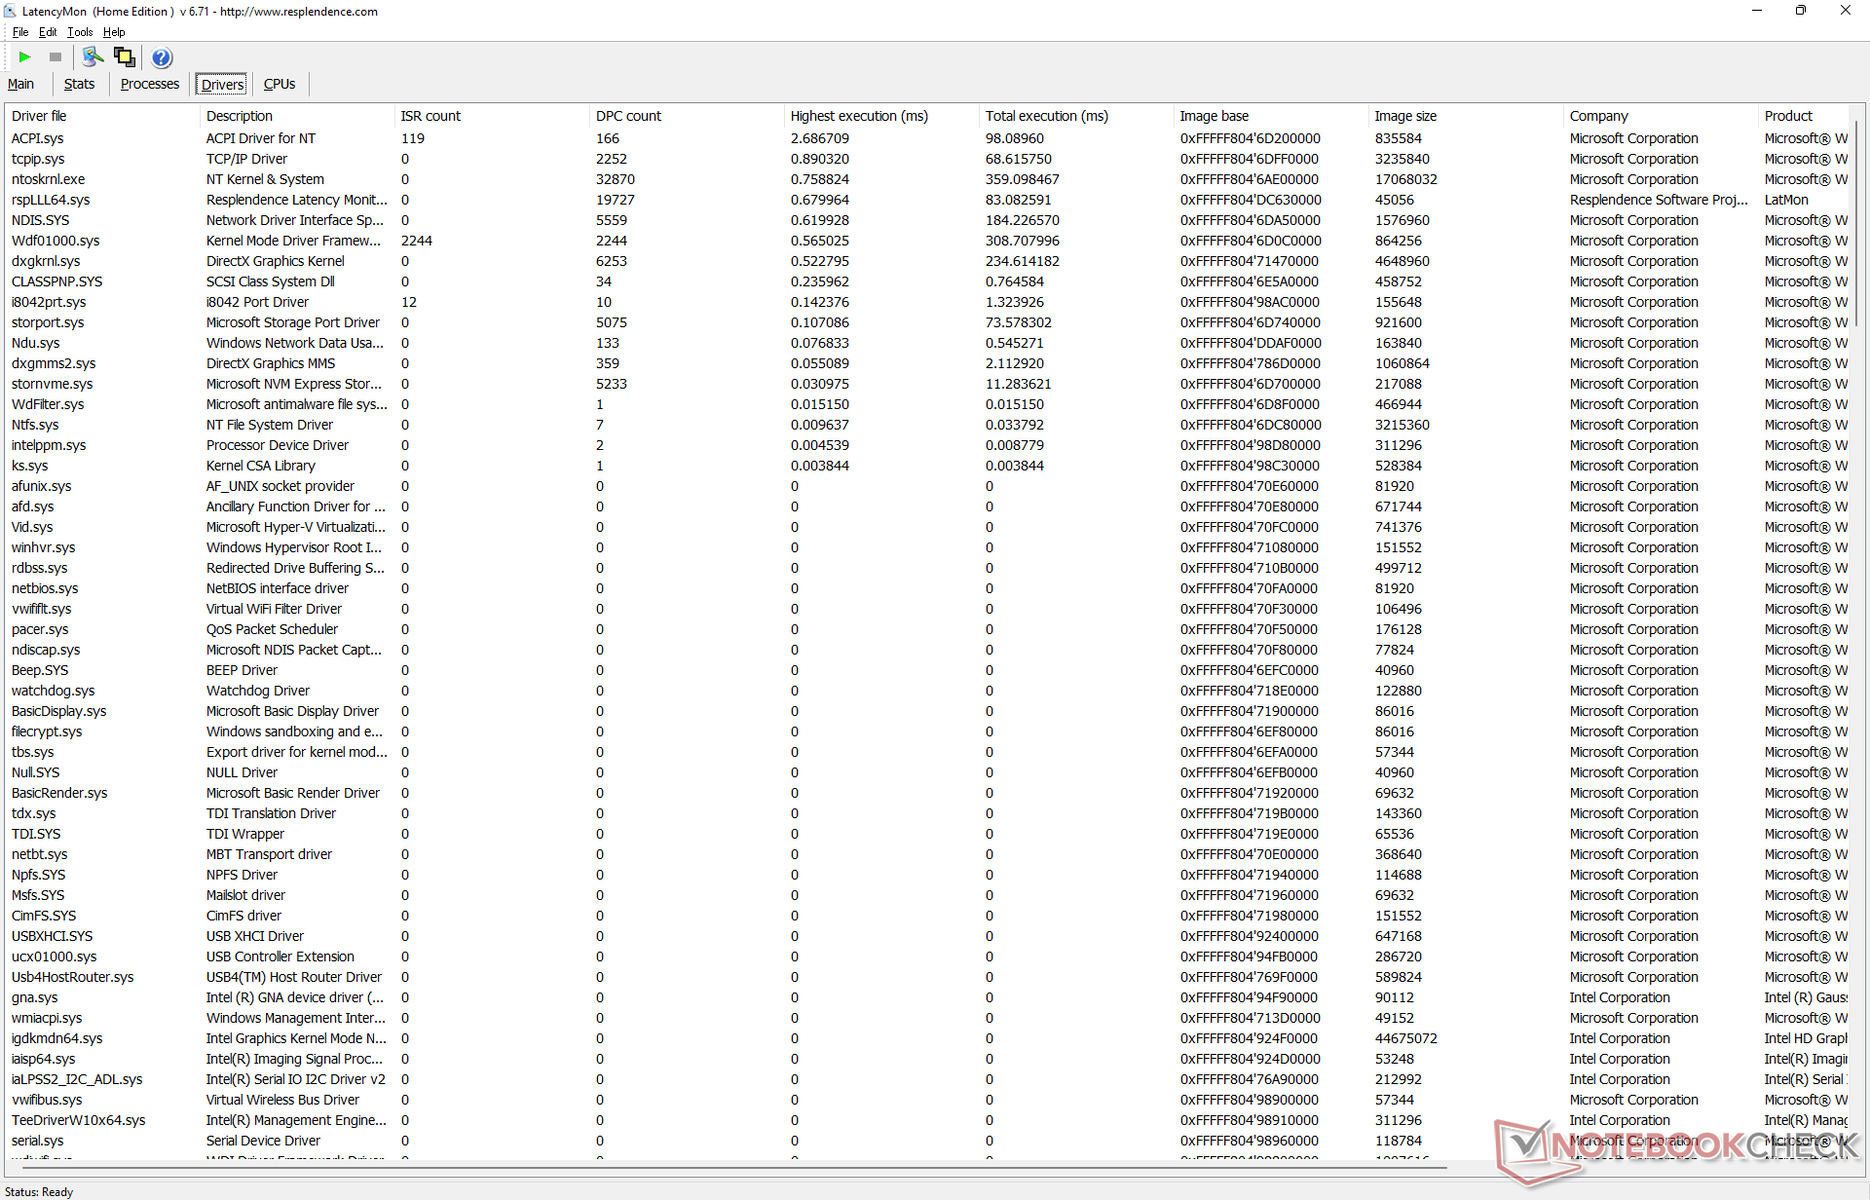
LatencyMon显示,在打开我们主页的多个浏览器标签时存在DPC问题。在我们的测试中,以60 FPS播放4K视频是完美的,没有丢帧。
| DPC Latencies / LatencyMon - interrupt to process latency (max), Web, Youtube, Prime95 | |
| Dell XPS 13 Plus 9320 i5-1240p | |
| HP Spectre x360 14t-ea000 | |
| Lenovo ThinkPad X1 Titanium Yoga G1 20QA001RGE | |
| Framework Laptop 13.5 12th Gen Intel | |
| HP Elite Dragonfly G3 | |
* ... smaller is better
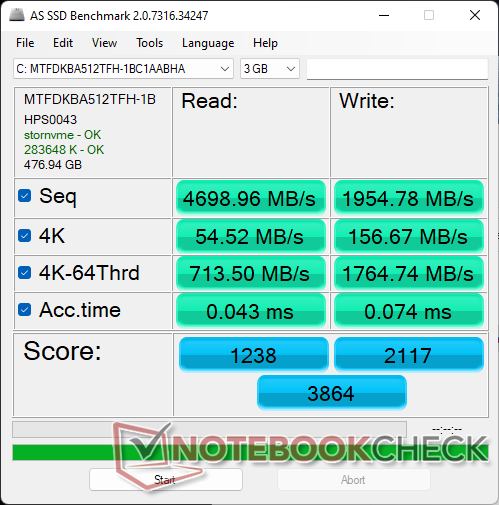
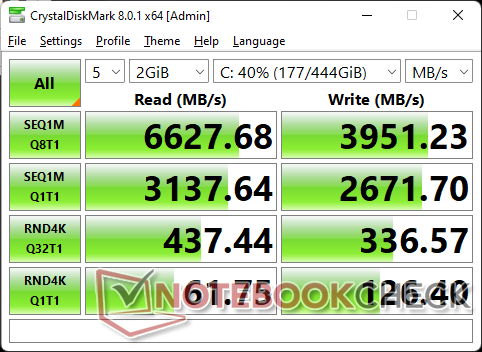
存储设备
惠普提供的固态硬盘选项范围从256GB到1TB OPAL2 NVMe。我们的具体配置是配备 512GB美光MTFDKBA512TFHPCIe4固态硬盘,连续读取和写入速度分别约为6500 MB/s和4000 MB/s。在循环运行DiskSpd时,该驱动器不会表现出重大的性能节流问题。

* ... smaller is better
Disk Throttling: DiskSpd Read Loop, Queue Depth 8
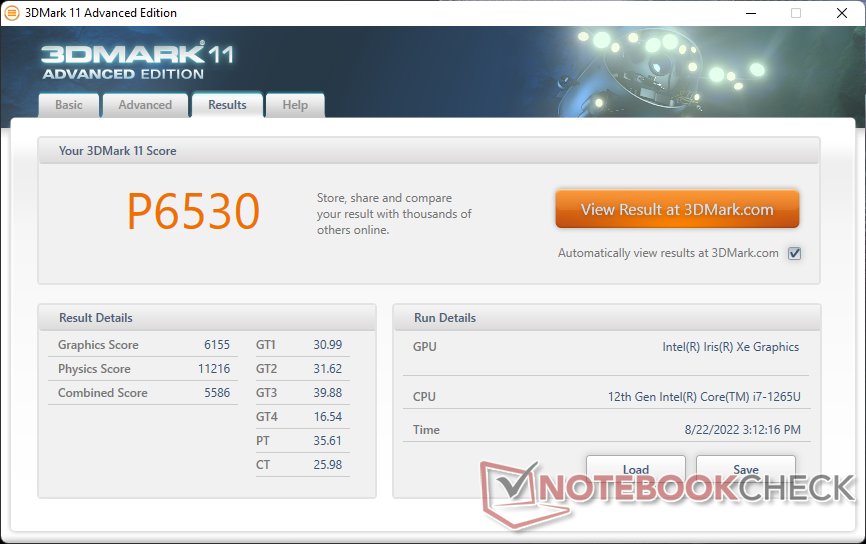
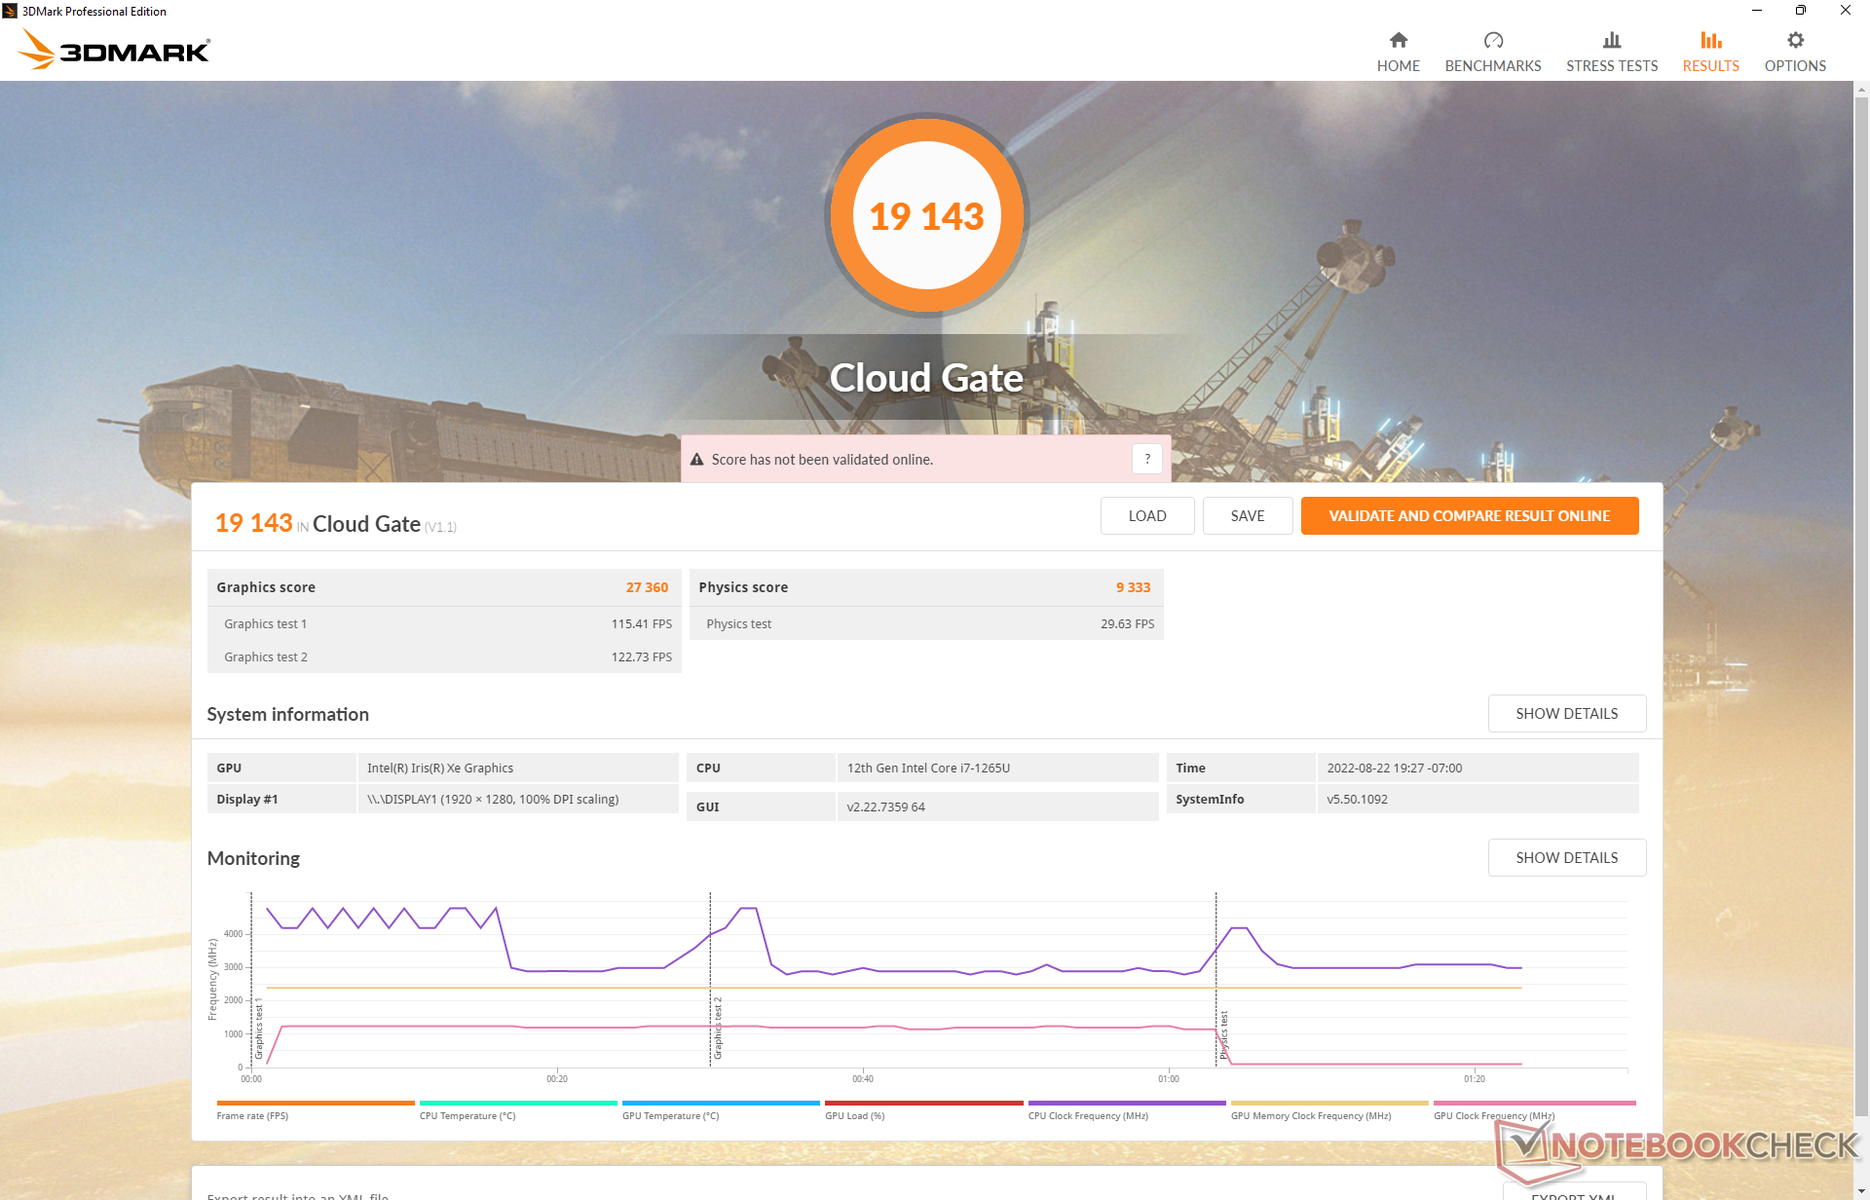
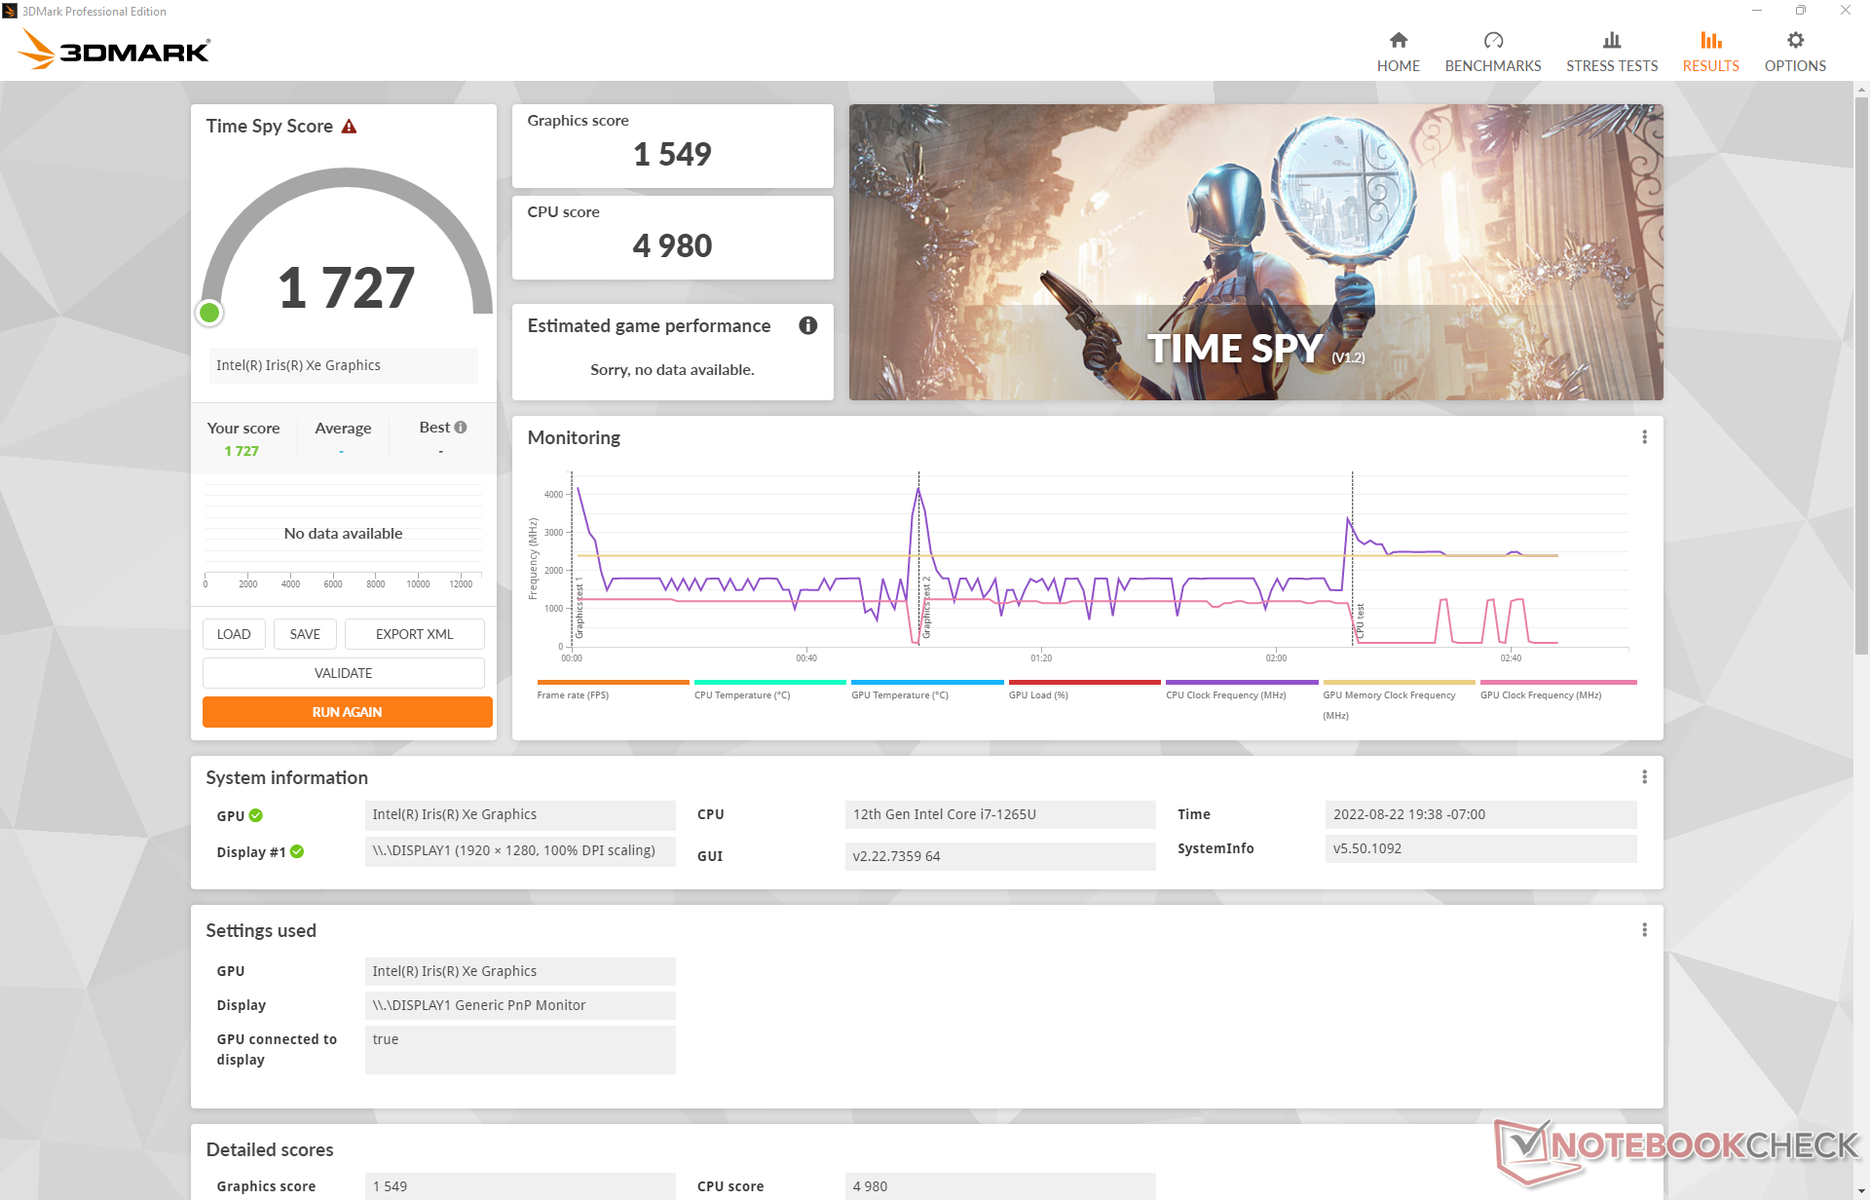
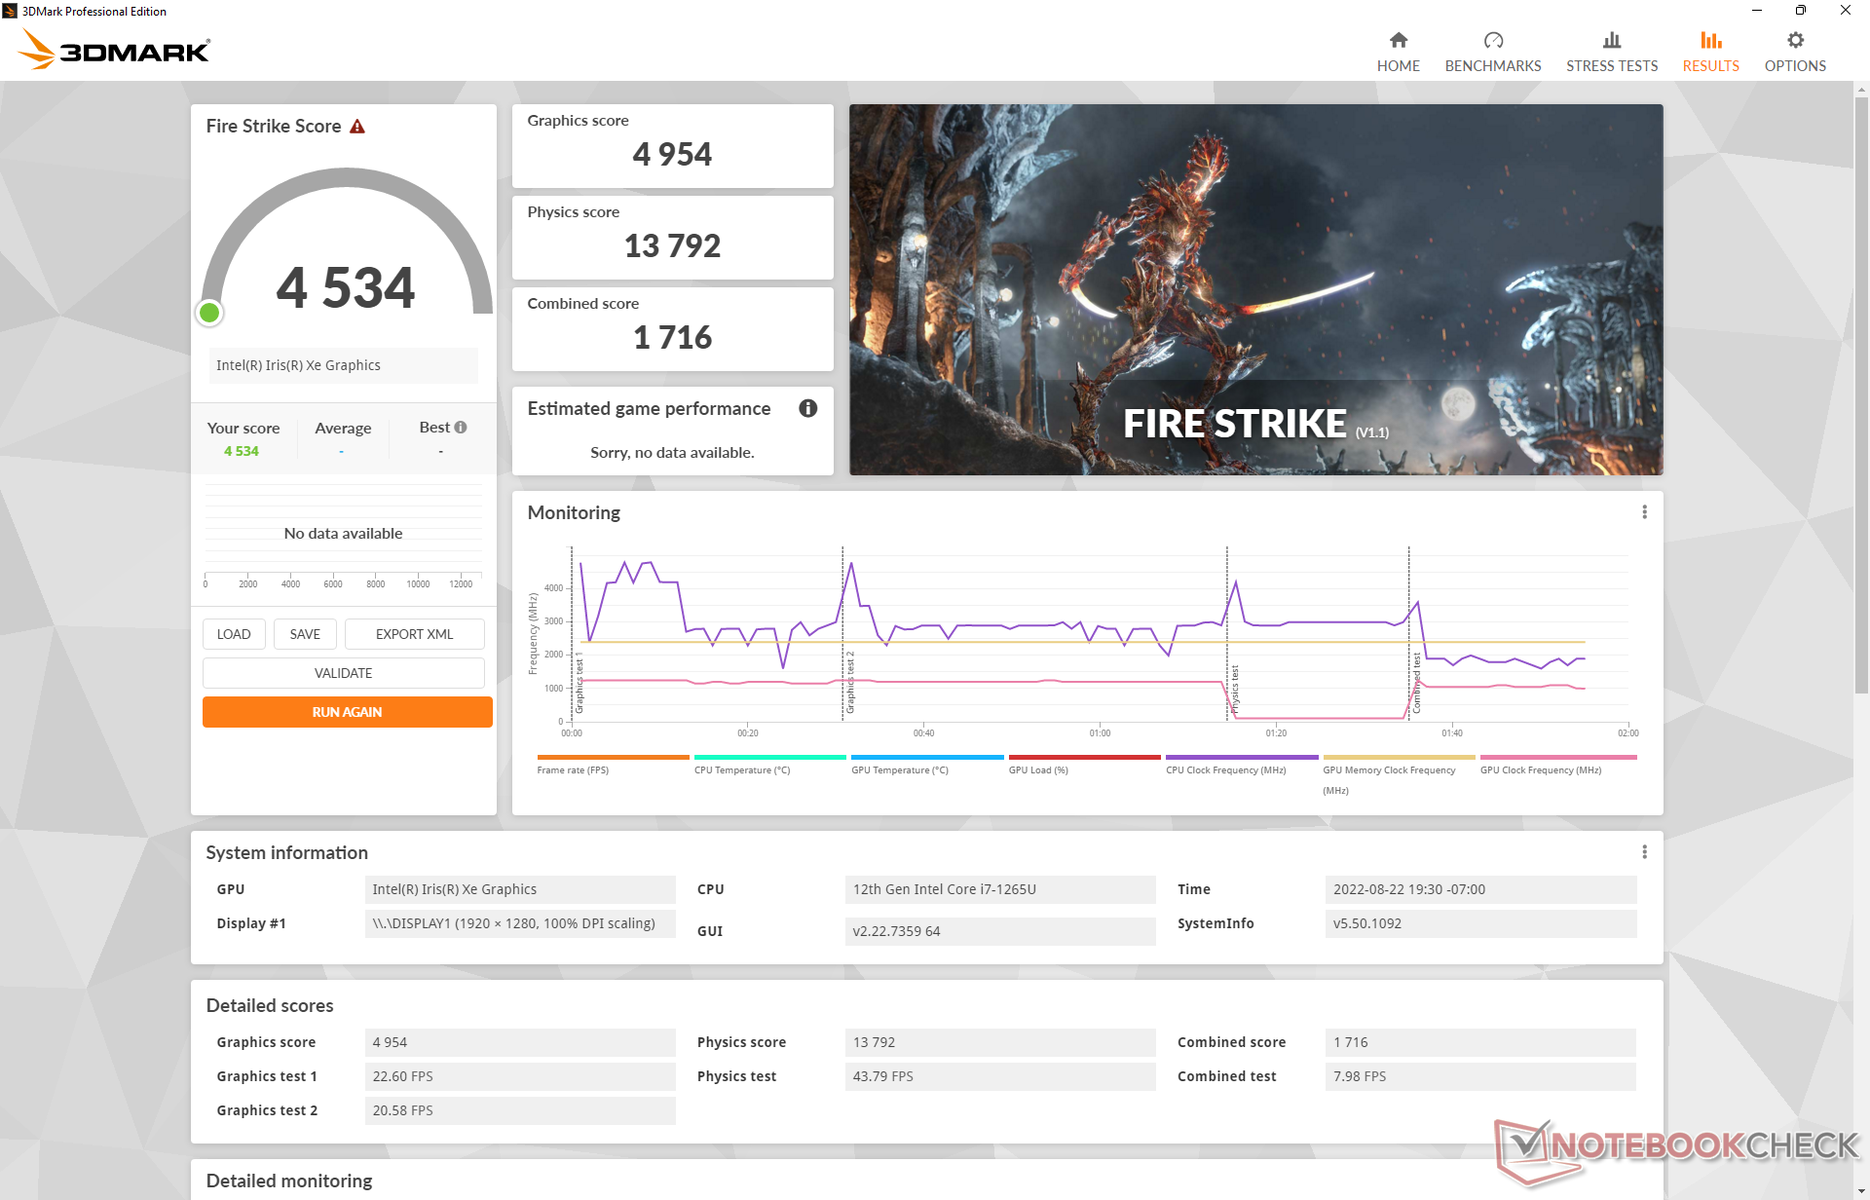
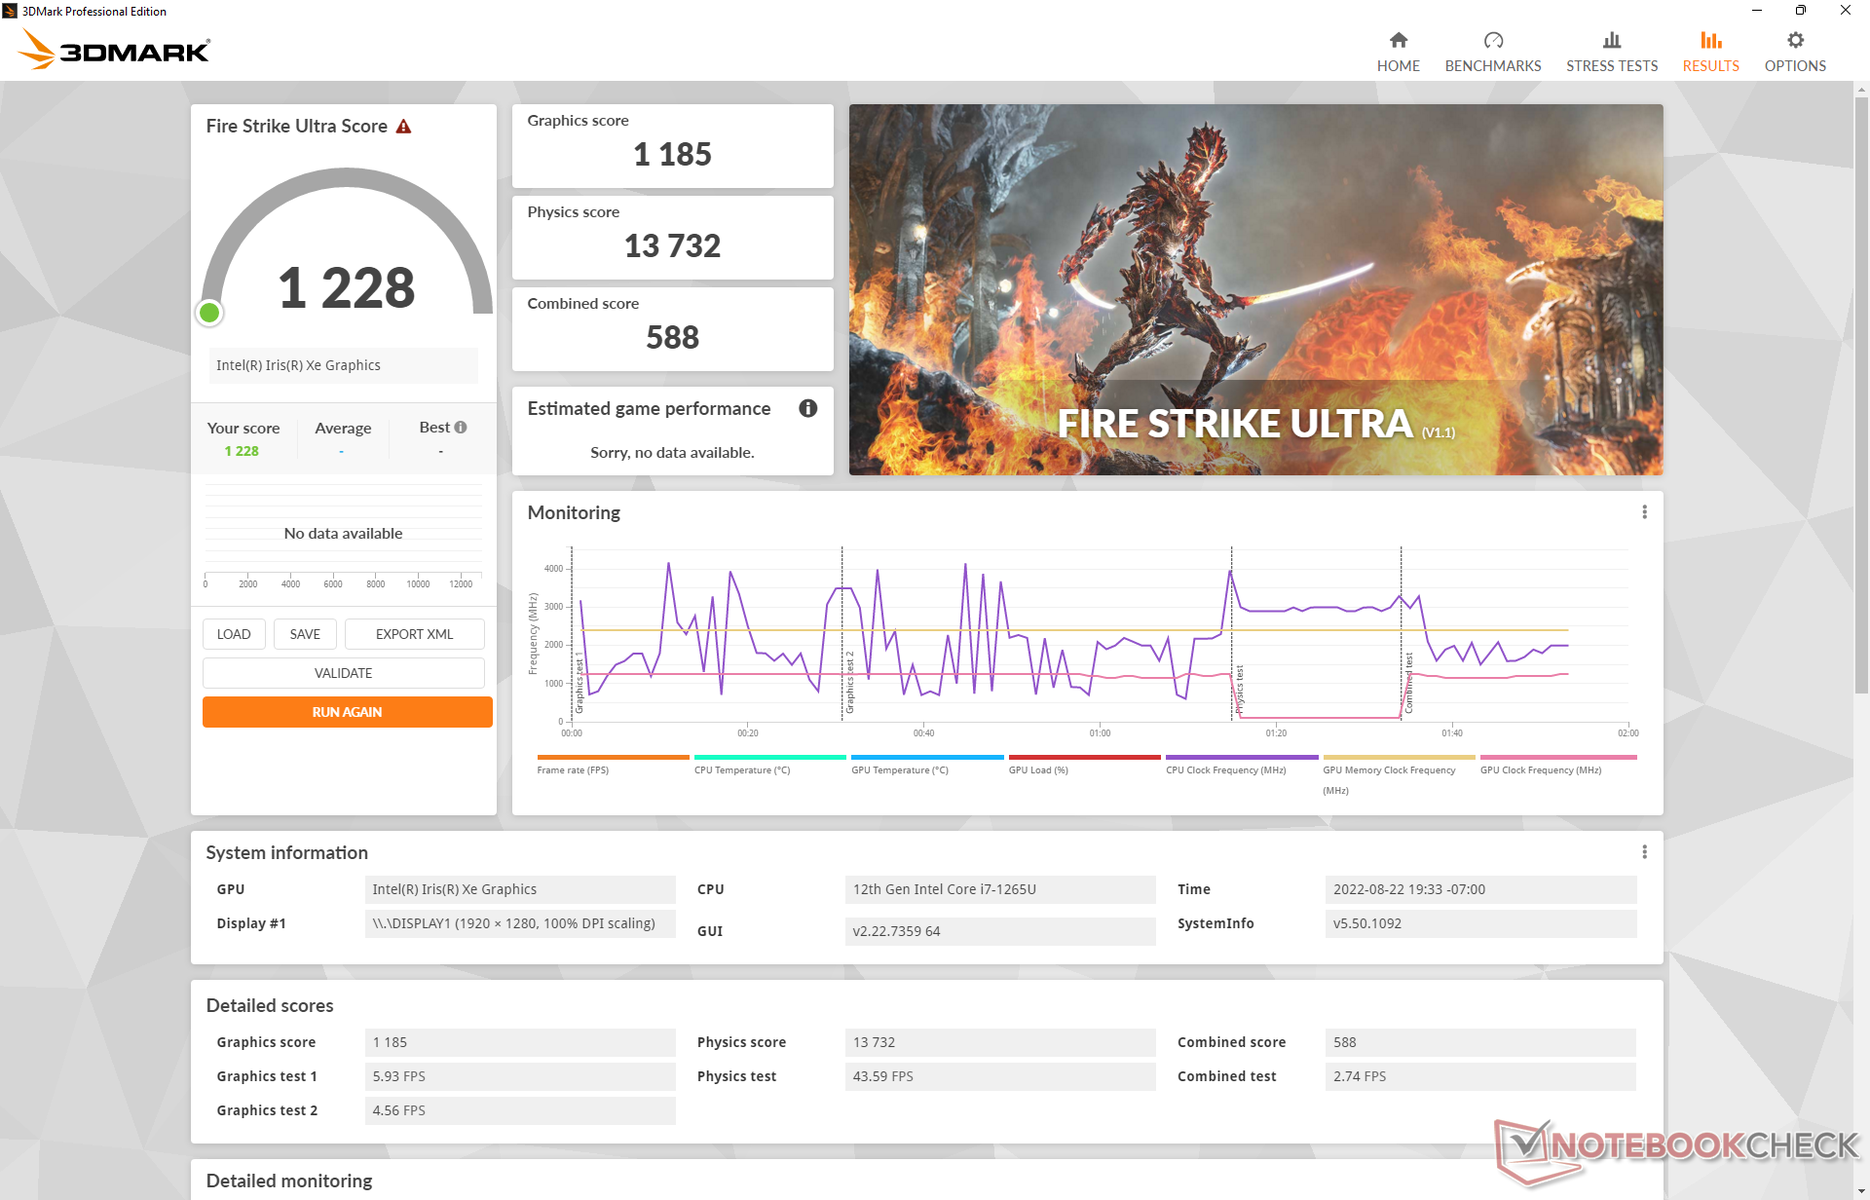
GPU性能
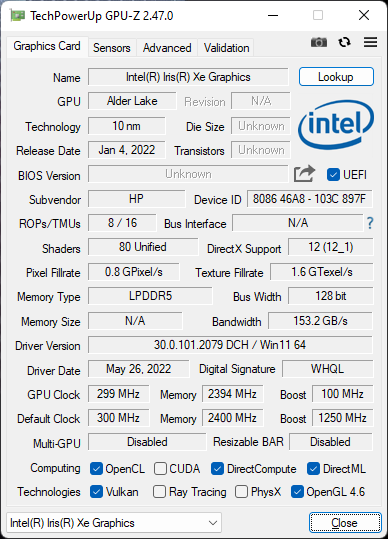
集成的 Iris Xe 96 EUs相对于其他具有相同GPU的笔记本电脑,它的表现是我们所期望的。这很好,因为它意味着惠普没有人为地把图形性能控制得太严重,但它也令人失望,因为它意味着用户不应该期望比上一代Core i7-1165G7系列有任何显著的GPU收益。
| 3DMark 11 - 1280x720 Performance GPU | |
| Framework Laptop 13.5 12th Gen Intel | |
| HP Spectre x360 14t-ea000 | |
| Average Intel Iris Xe Graphics G7 96EUs (2867 - 7676, n=209) | |
| HP Elite Dragonfly G3 | |
| HP Pavilion Aero 13 be0097nr | |
| Lenovo Yoga 6 13ALC6 | |
| Lenovo ThinkPad X1 Titanium Yoga G1 20QA001RGE | |
| HP Envy 13-ba0001ng | |
| Dell Latitude 5320-TM4V2 | |
| Dell XPS 13 Plus 9320 i5-1240p | |
| Lenovo IdeaPad S540-13ARE-82DL000YGE | |
| Asus VivoBook S13 S333JA-DS51 | |
| HP EliteBook Folio 13.5-3G2L2EA | |
| Dell XPS 13 7390 Core i7-10710U | |
| 3DMark 11 Performance | 6530 points | |
| 3DMark Cloud Gate Standard Score | 19143 points | |
| 3DMark Fire Strike Score | 4534 points | |
| 3DMark Time Spy Score | 1727 points | |
Help | ||
| Cyberpunk 2077 1.6 | |
| 1920x1080 Low Preset | |
| Framework Laptop 13.5 12th Gen Intel | |
| HP Elite Dragonfly G3 | |
| Average Intel Iris Xe Graphics G7 96EUs (13 - 25.9, n=42) | |
| 1920x1080 Medium Preset | |
| Framework Laptop 13.5 12th Gen Intel | |
| HP Elite Dragonfly G3 | |
| Average Intel Iris Xe Graphics G7 96EUs (10.8 - 21.7, n=37) | |
| 1920x1080 High Preset | |
| Framework Laptop 13.5 12th Gen Intel | |
| HP Elite Dragonfly G3 | |
| Average Intel Iris Xe Graphics G7 96EUs (9.8 - 16.9, n=34) | |
Witcher 3 FPS Chart
| low | med. | high | ultra | |
|---|---|---|---|---|
| GTA V (2015) | 90.6 | 79.2 | 23.3 | 10.2 |
| The Witcher 3 (2015) | 76.1 | 52 | 28.4 | 13.8 |
| Dota 2 Reborn (2015) | 97.4 | 71.1 | 57 | 50.9 |
| Final Fantasy XV Benchmark (2018) | 39.7 | 22.7 | 15.8 | |
| X-Plane 11.11 (2018) | 37.3 | 34.7 | 31.2 | |
| Strange Brigade (2018) | 84.9 | 39.3 | 31.4 | 25.4 |
| Cyberpunk 2077 1.6 (2022) | 19.8 | 16.8 | 12.8 | 10.2 |
排放 - 超静音
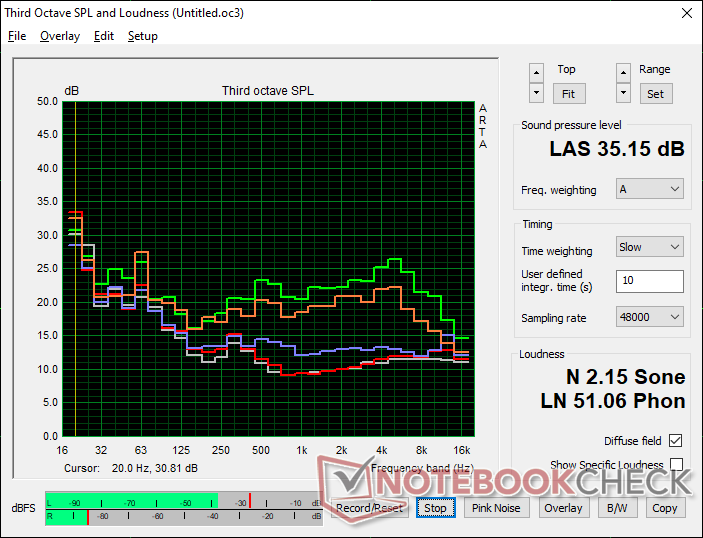
系统噪音
在Dragonfly Max上,我们发现风扇噪音比平均水平小,这与它比平均水平慢的CPU性能相一致。这一趋势在蜻蜓G3上继续,无论好坏。如下表所示,在最响亮的时候,我们只能记录到35dB(A)的风扇噪音,而竞争对手的型号则为40dB(A)或更大。重视CPU性能的用户可能会感到失望,而重视更安静的风扇的用户可能不会介意较慢的处理器。
Noise level
| Idle |
| 23.2 / 23.2 / 23.2 dB(A) |
| Load |
| 25.1 / 35.2 dB(A) |
 | ||
30 dB silent 40 dB(A) audible 50 dB(A) loud |
||
min: | ||
| HP Elite Dragonfly G3 Iris Xe G7 96EUs, i7-1265U, Micron 3400 MTFDKBA512TFH 512GB | HP Spectre x360 14t-ea000 Iris Xe G7 96EUs, i7-1165G7, Samsung SSD PM981a MZVLB512HBJQ | Dell XPS 13 Plus 9320 i5-1240p Iris Xe G7 80EUs, i5-1240P, Micron 3400 MTFDKBA512TFH 512GB | Framework Laptop 13.5 12th Gen Intel Iris Xe G7 96EUs, i7-1260P, WDC PC SN730 SDBPNTY-512G | HP EliteBook Folio 13.5-3G2L2EA Adreno 680, SD 8cx Gen 2 5G, Toshiba XG6 KXG60ZNV512G | Lenovo ThinkPad X1 Titanium Yoga G1 20QA001RGE Iris Xe G7 96EUs, i7-1160G7, Toshiba BG4 KBG40ZNT512G | |
|---|---|---|---|---|---|---|
| Noise | -12% | -23% | -25% | -11% | ||
| off / environment * (dB) | 22.8 | 25.8 -13% | 26 -14% | 22.8 -0% | 25.1 -10% | |
| Idle Minimum * (dB) | 23.2 | 25.9 -12% | 26.2 -13% | 23 1% | 25.1 -8% | |
| Idle Average * (dB) | 23.2 | 25.9 -12% | 26.2 -13% | 23 1% | 25.1 -8% | |
| Idle Maximum * (dB) | 23.2 | 25.9 -12% | 26.2 -13% | 23 1% | 27.1 -17% | |
| Load Average * (dB) | 25.1 | 26.4 -5% | 38.4 -53% | 47.3 -88% | 32.7 -30% | |
| Witcher 3 ultra * (dB) | 32 | 36.9 -15% | 47.3 -48% | 32.7 -2% | ||
| Load Maximum * (dB) | 35.2 | 41.5 -18% | 47.1 -34% | 49.8 -41% | 35.8 -2% |
* ... smaller is better
温度
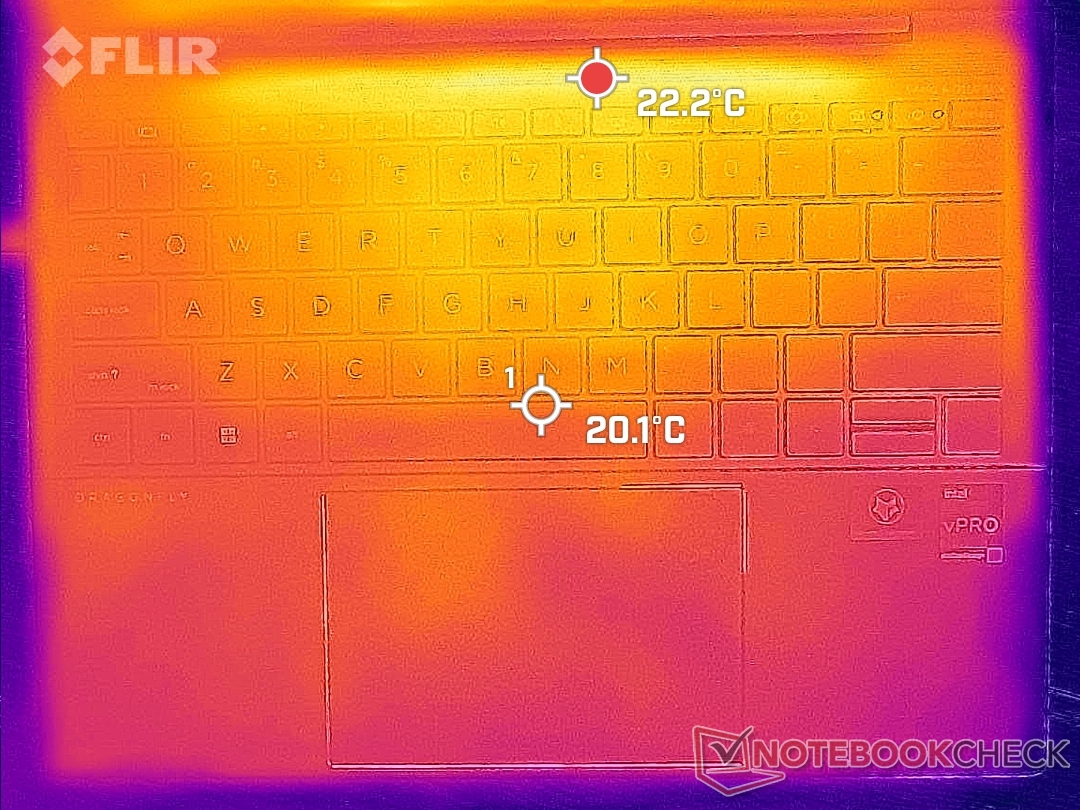
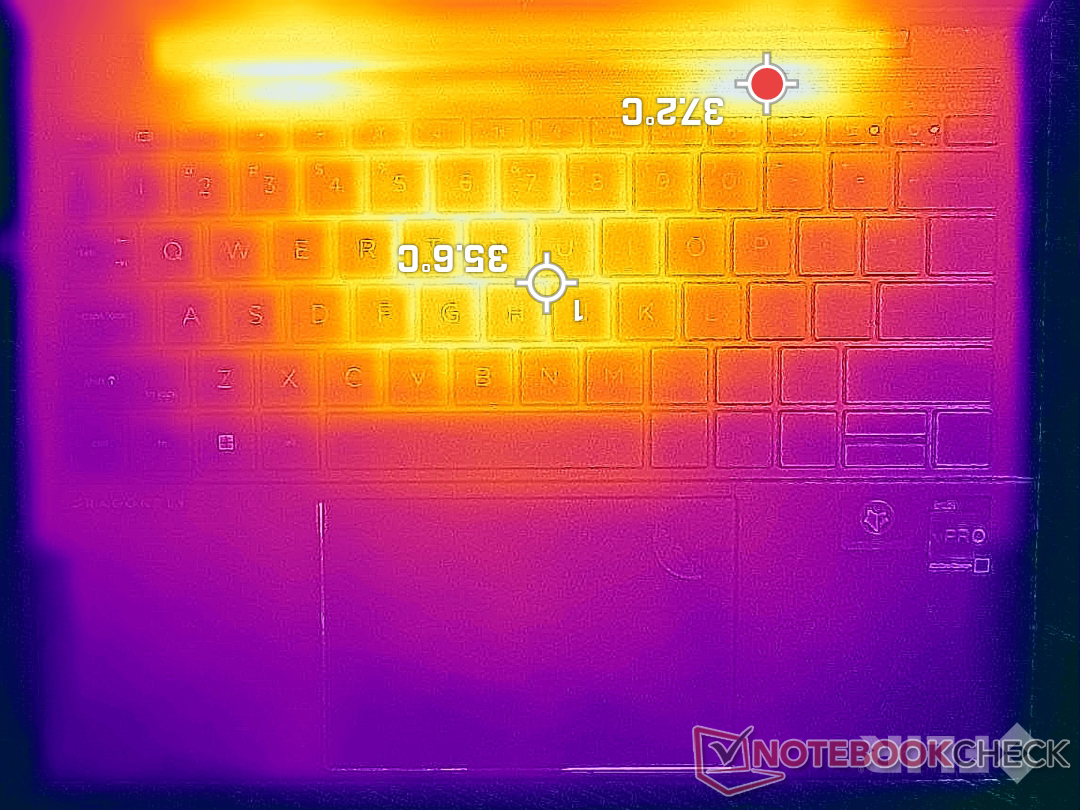
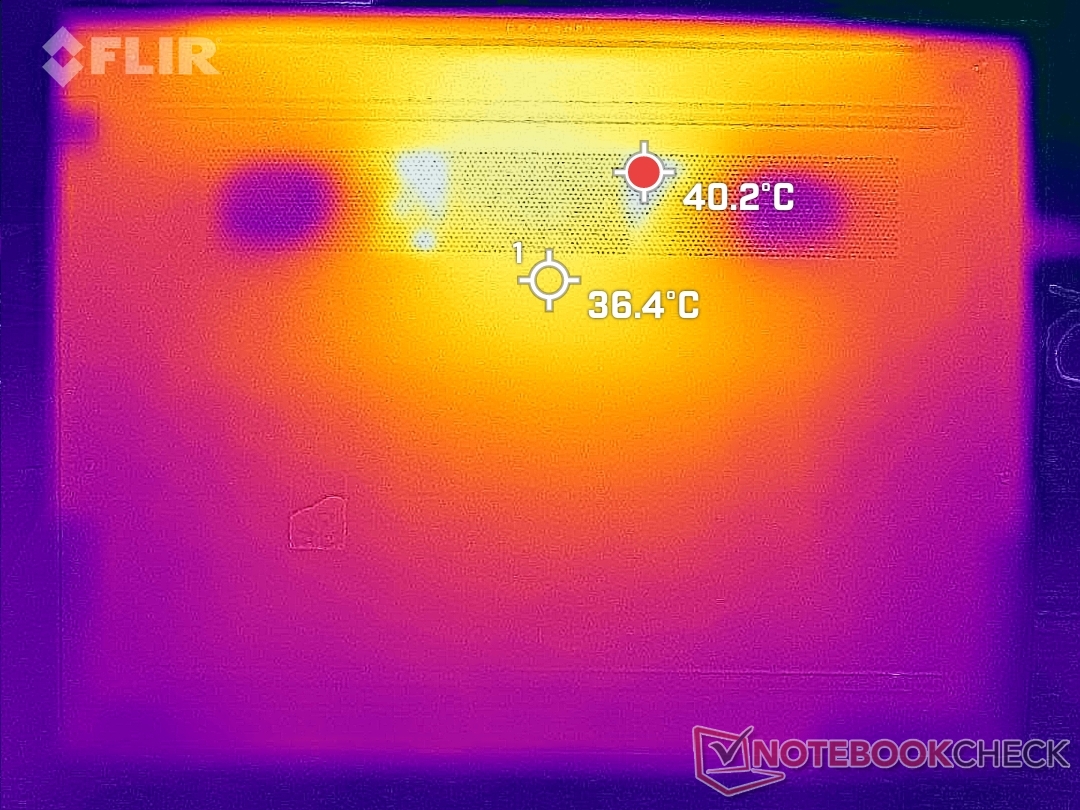
表面温度梯度比老式的更对称。 蜻蜓Max由于修改了冷却方案,表面温度梯度比老款Dragonfly Max更加对称。这意味着蜻蜓G3的热点离键盘中心最近,而不是在键盘的右半部分。当长时间处于高负荷状态时,这些区域的温度可高达40摄氏度,但值得庆幸的是,它们是朝向后方的,没有靠近掌托或点击板。
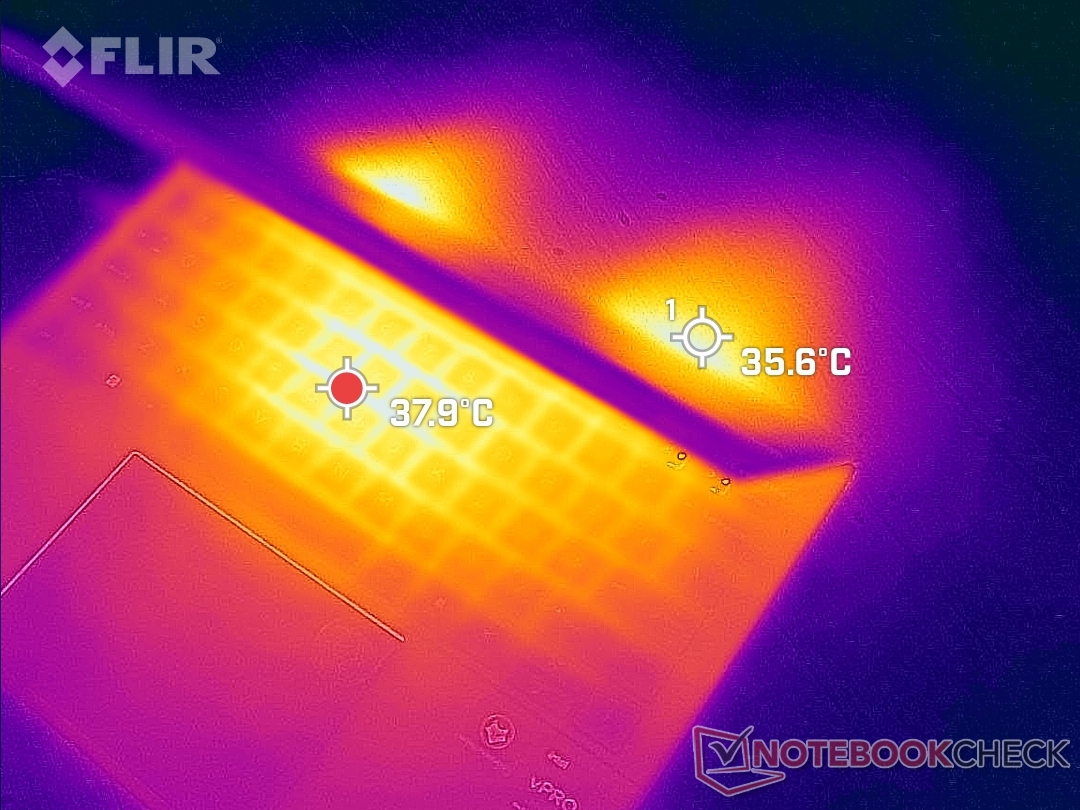
(+) The maximum temperature on the upper side is 39 °C / 102 F, compared to the average of 34.3 °C / 94 F, ranging from 21.2 to 62.5 °C for the class Office.
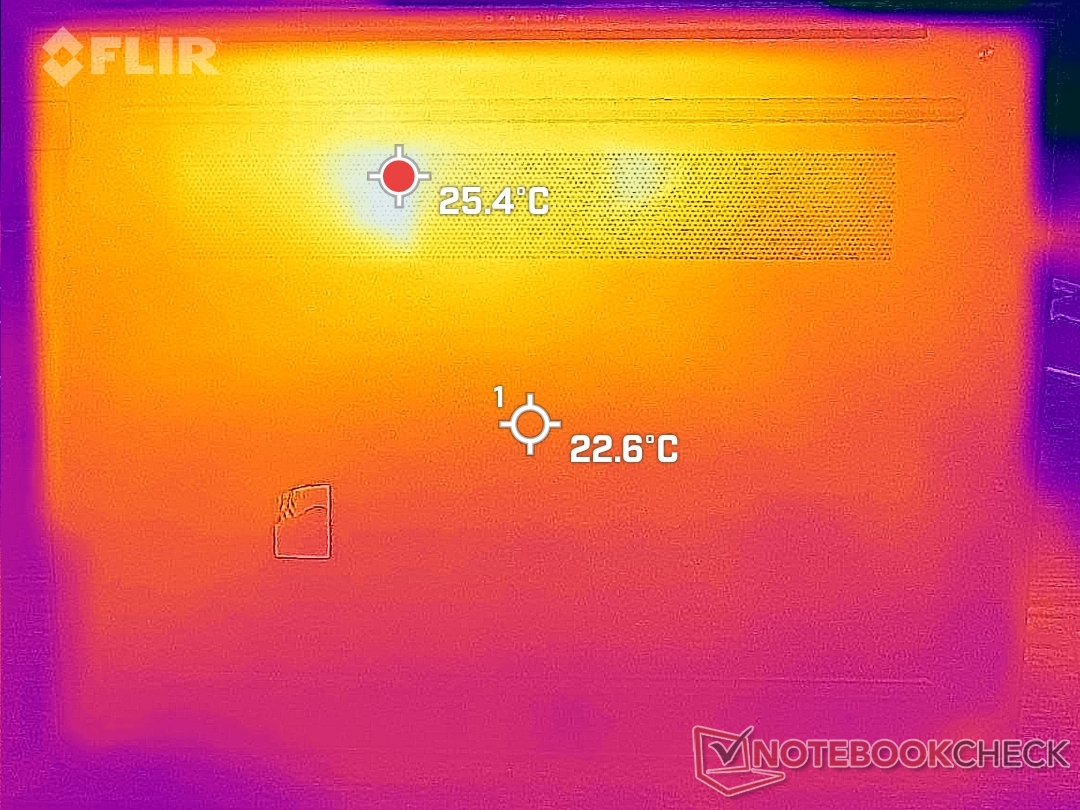
(±) The bottom heats up to a maximum of 42.2 °C / 108 F, compared to the average of 36.8 °C / 98 F
(+) In idle usage, the average temperature for the upper side is 25.4 °C / 78 F, compared to the device average of 29.5 °C / 85 F.
(+) The palmrests and touchpad are cooler than skin temperature with a maximum of 28.4 °C / 83.1 F and are therefore cool to the touch.
(±) The average temperature of the palmrest area of similar devices was 27.5 °C / 81.5 F (-0.9 °C / -1.6 F).
| HP Elite Dragonfly G3 Intel Core i7-1265U, Intel Iris Xe Graphics G7 96EUs | HP Spectre x360 14t-ea000 Intel Core i7-1165G7, Intel Iris Xe Graphics G7 96EUs | Dell XPS 13 Plus 9320 i5-1240p Intel Core i5-1240P, Intel Iris Xe Graphics G7 80EUs | Framework Laptop 13.5 12th Gen Intel Intel Core i7-1260P, Intel Iris Xe Graphics G7 96EUs | HP EliteBook Folio 13.5-3G2L2EA Qualcomm Snapdragon 8cx Gen 2 5G, Qualcomm Adreno 680 | Lenovo ThinkPad X1 Titanium Yoga G1 20QA001RGE Intel Core i7-1160G7, Intel Iris Xe Graphics G7 96EUs | |
|---|---|---|---|---|---|---|
| Heat | -9% | -37% | 3% | 11% | -7% | |
| Maximum Upper Side * (°C) | 39 | 40.4 -4% | 47.6 -22% | 36.8 6% | 34.3 12% | 46.5 -19% |
| Maximum Bottom * (°C) | 42.2 | 52.8 -25% | 57 -35% | 42.4 -0% | 35.4 16% | 45.2 -7% |
| Idle Upper Side * (°C) | 26.8 | 27.2 -1% | 38.8 -45% | 24.2 10% | 25.7 4% | 27.3 -2% |
| Idle Bottom * (°C) | 28.2 | 29.2 -4% | 41 -45% | 29 -3% | 25.1 11% | 27.7 2% |
* ... smaller is better
压力测试
在启动Prime95压力时,CPU时钟速率、温度和电路板功耗将分别飙升至3.7 GHz、100 C和54 W。然而,仅仅10到15秒后,时钟频率和板卡功耗就会下降,并分别稳定在2.1GHz和20W,以保持70C的更可控的核心温度。 戴尔Latitude 7330使用相同的酷睿i7-1265U CPU,将看到更高的稳定时钟频率、温度和主板功耗,分别为2.4 GHz、>80 C和25 W。与竞争对手相比,惠普在运行酷睿i7-1265U时更加保守。
当运行 Witcher 3代表苛刻的负载时,GPU时钟速率和温度将分别稳定在1097 MHz和65 C,而上述戴尔的时钟速率和温度则为1247 MHz和83 C。
在电池上运行限制了性能。在电池上进行的3DMark测试将返回物理和图形分数,分别为9619和5532分,而在主电源上则为11216和6155分。
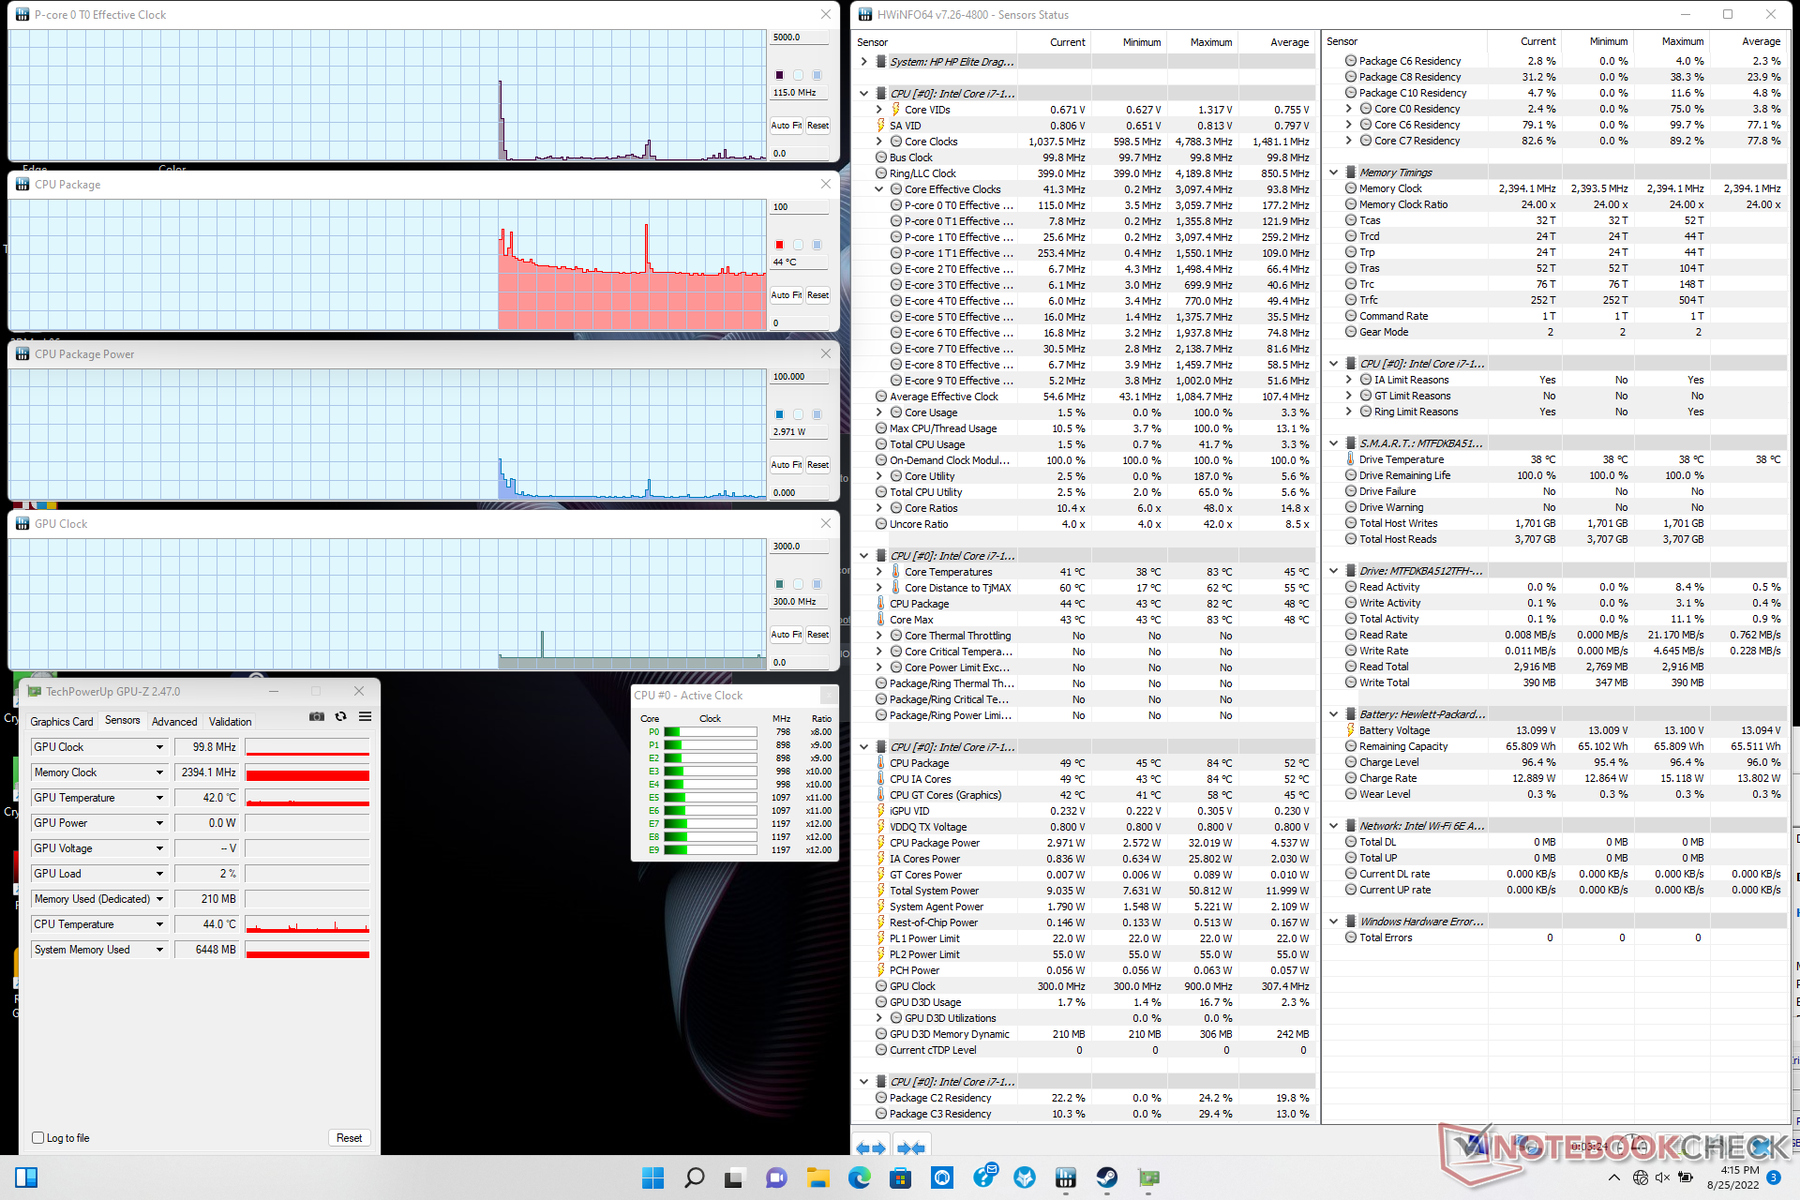
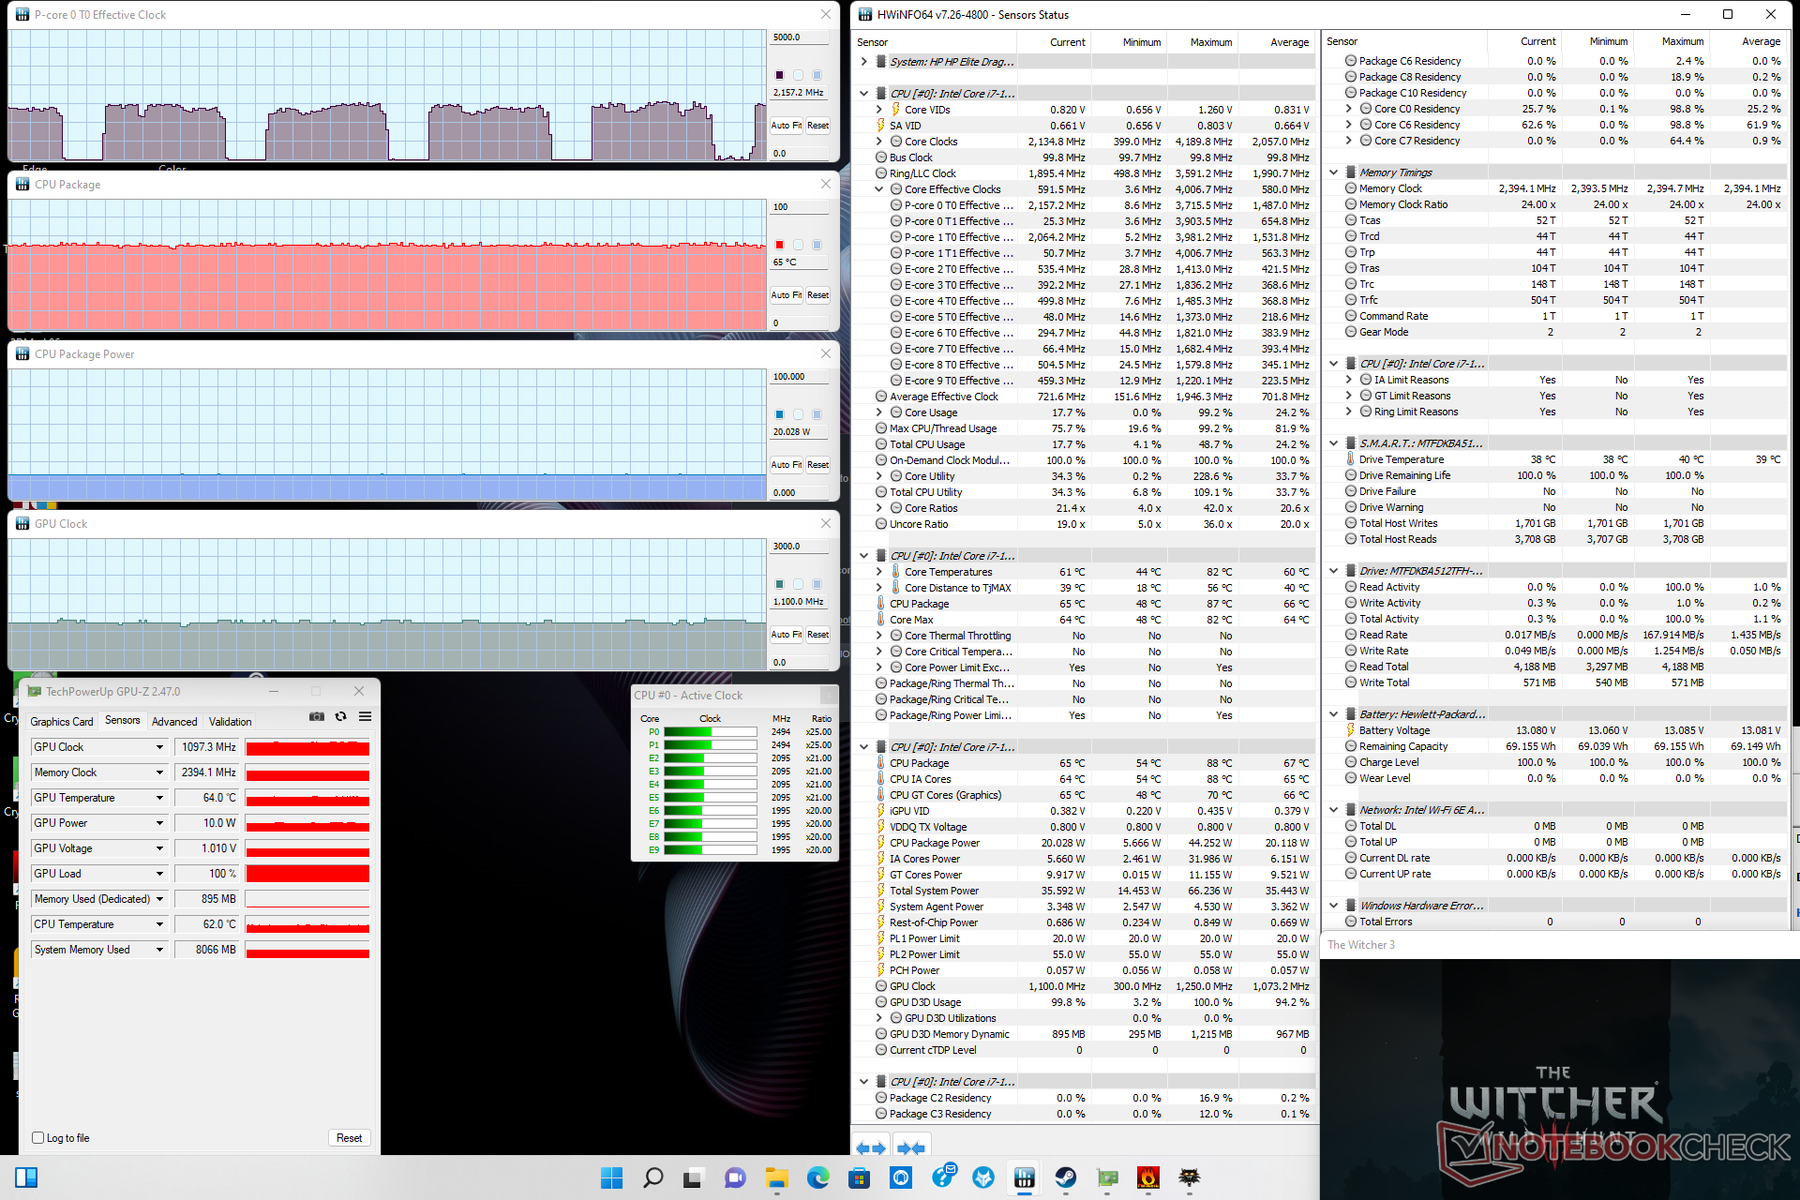
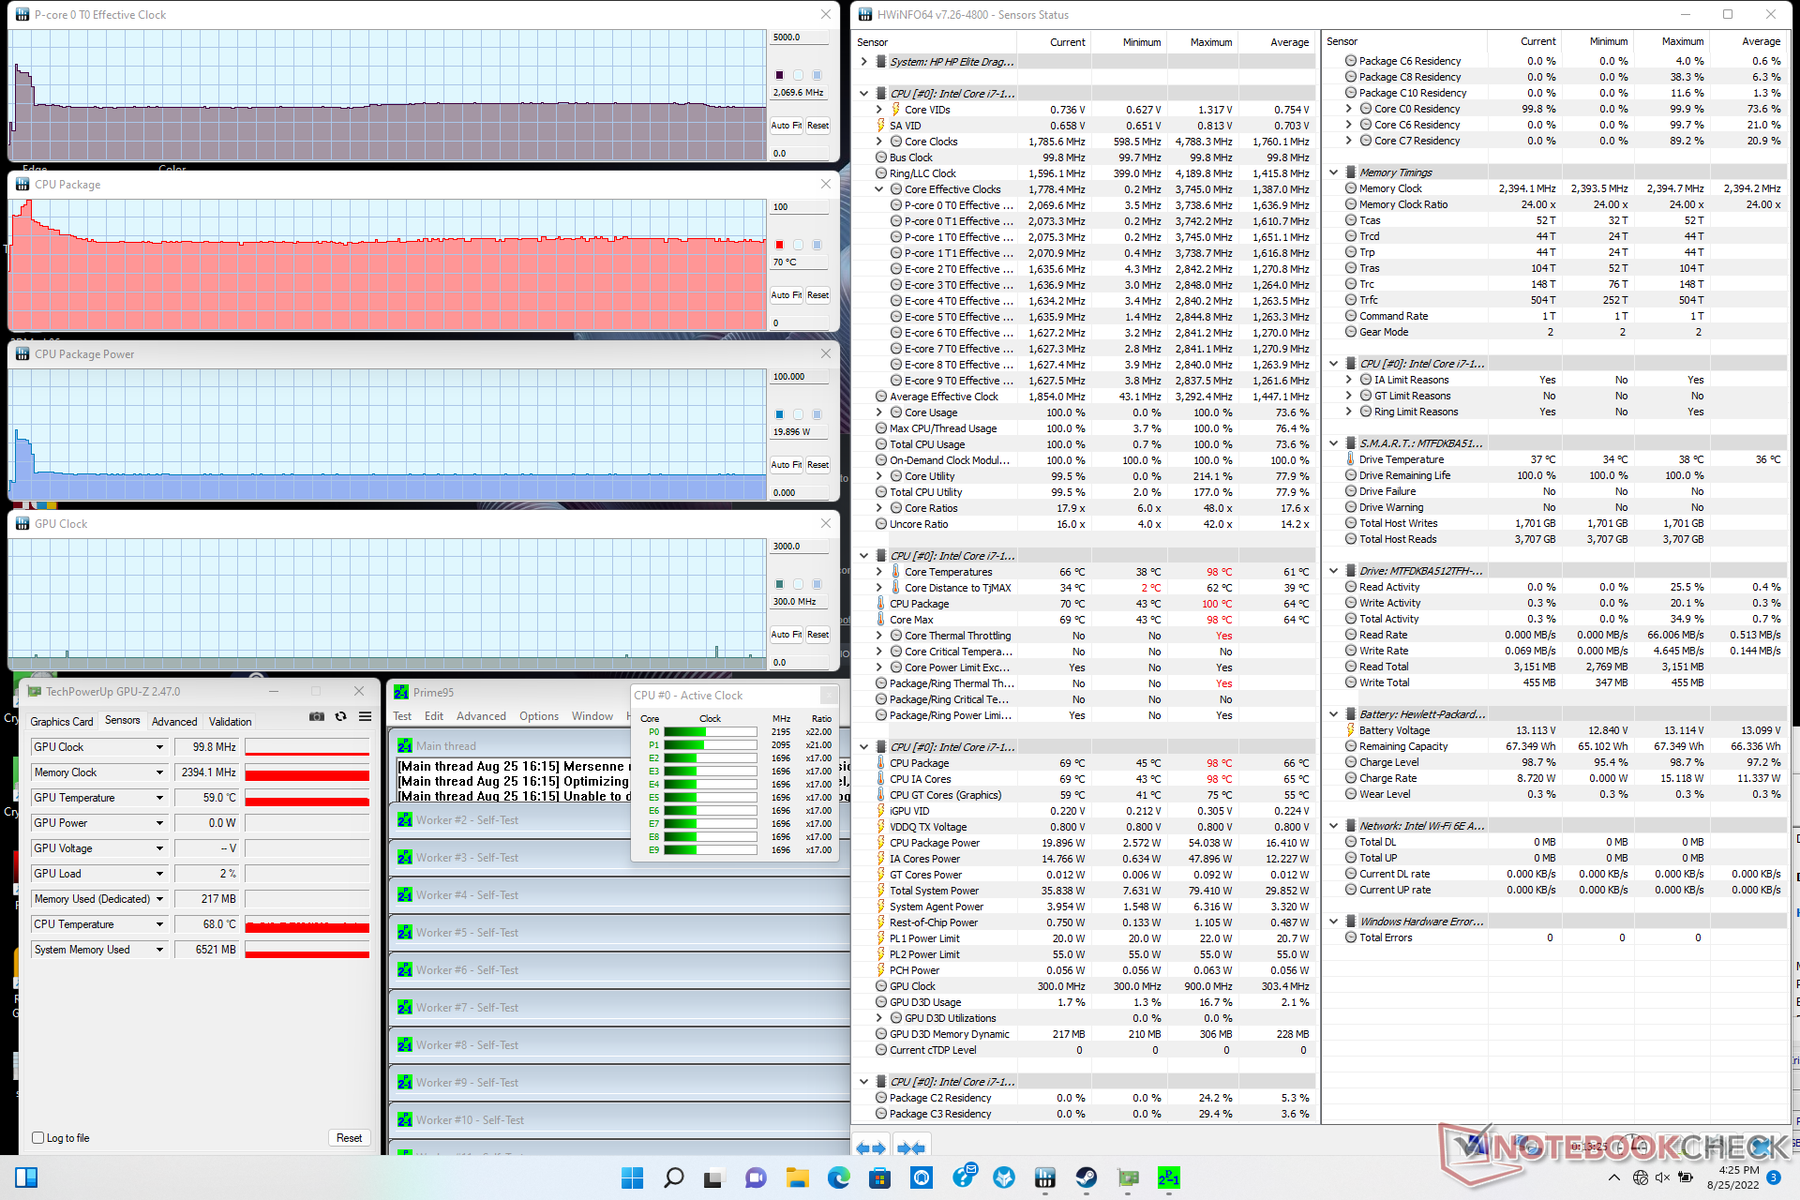
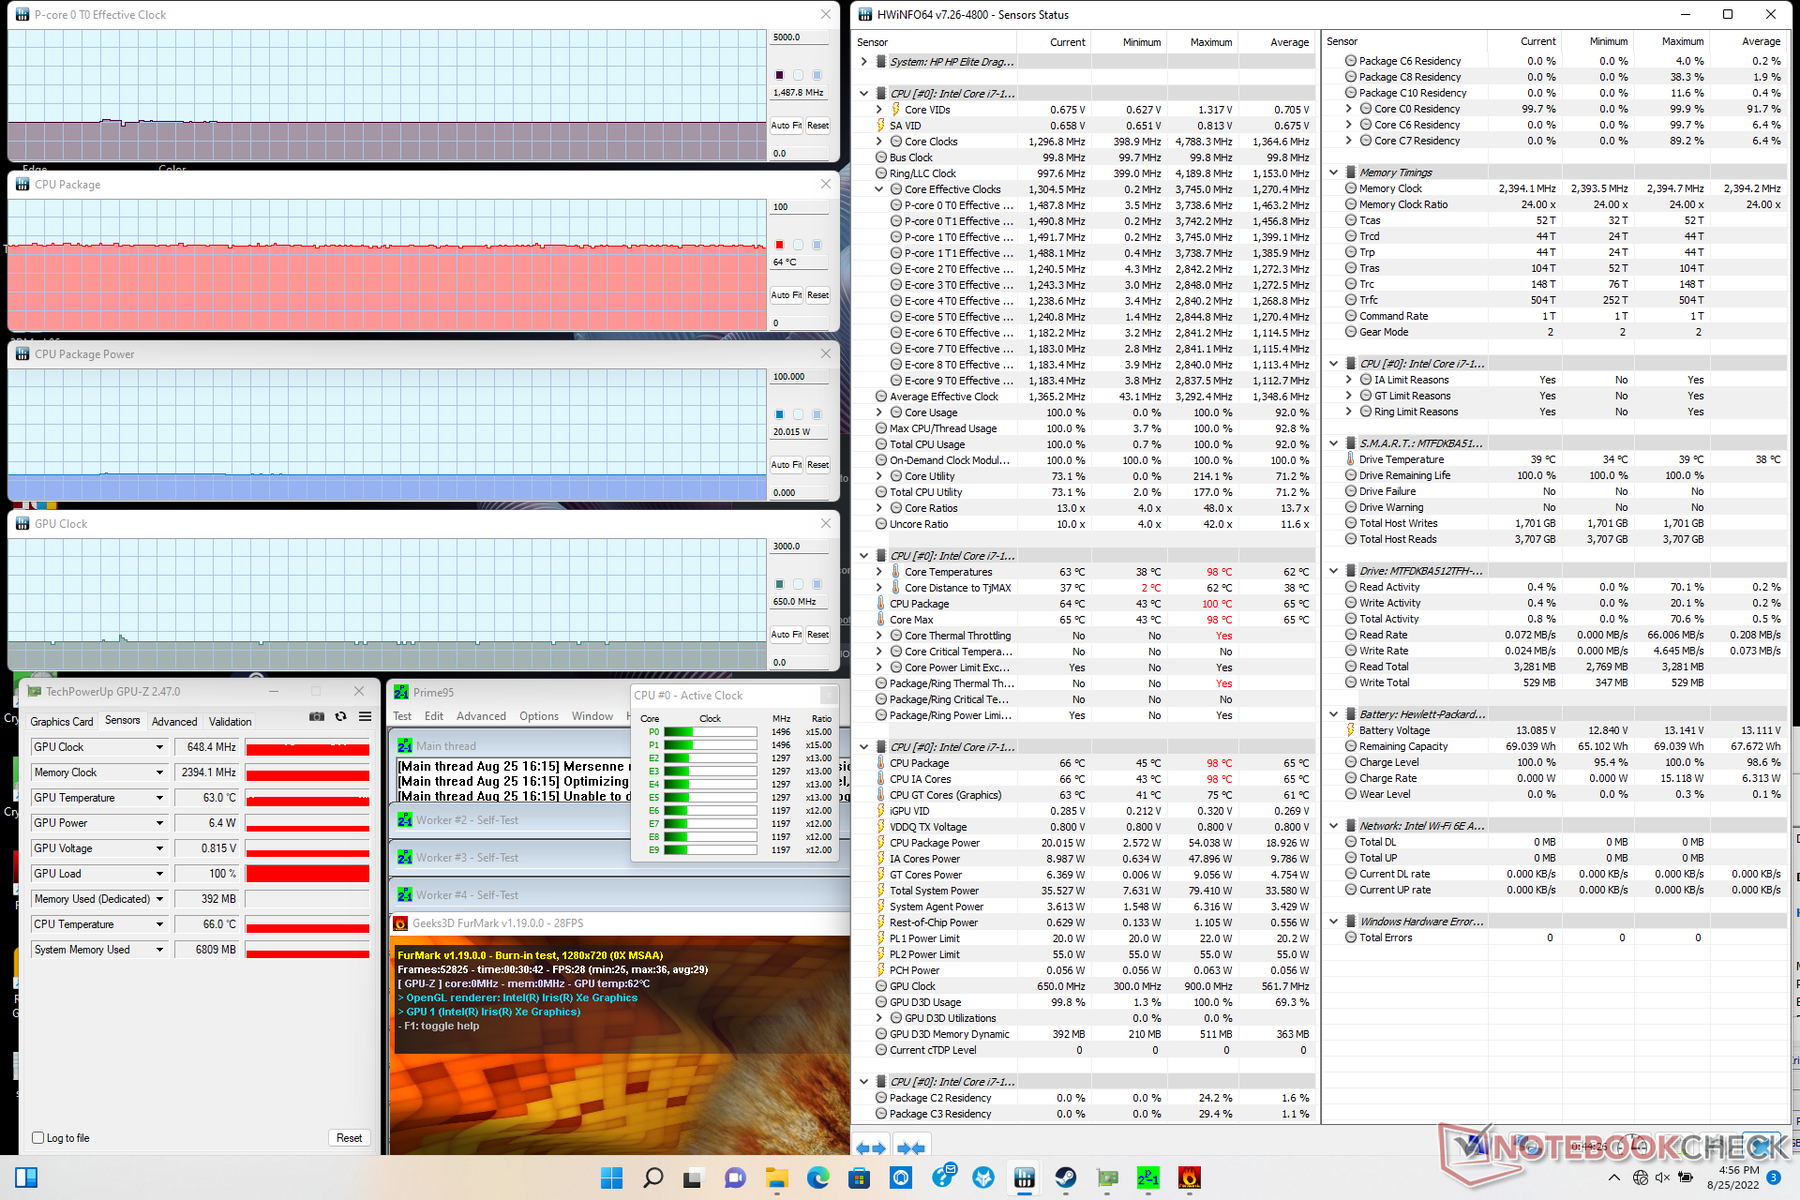
| CPU时钟(GHz) | GPU时钟(MHz) | CPU平均温度(℃) | |
| 系统空闲 | -- | -- | 2.1 |
| Prime95压力 | 2.1 | -- | 70 |
| Prime95 + FurMark 压力 | 1.5 | 648 | 64 |
| Witcher 3 应力 | ~2.1 | 1097 | 65 |
发言人
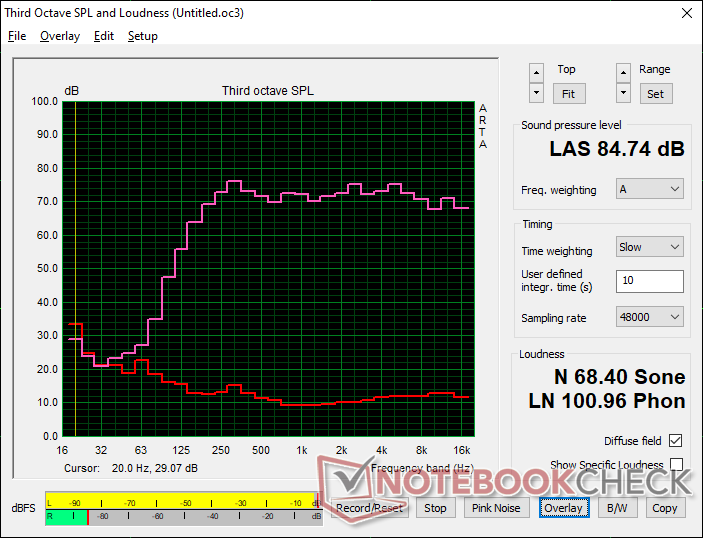
HP Elite Dragonfly G3 audio analysis
(+) | speakers can play relatively loud (84.7 dB)
Bass 100 - 315 Hz
(±) | reduced bass - on average 9.4% lower than median
(±) | linearity of bass is average (11.4% delta to prev. frequency)
Mids 400 - 2000 Hz
(+) | balanced mids - only 0.9% away from median
(+) | mids are linear (2.8% delta to prev. frequency)
Highs 2 - 16 kHz
(+) | balanced highs - only 2.1% away from median
(+) | highs are linear (3.9% delta to prev. frequency)
Overall 100 - 16.000 Hz
(+) | overall sound is linear (6.6% difference to median)
Compared to same class
» 0% of all tested devices in this class were better, 0% similar, 100% worse
» The best had a delta of 7%, average was 21%, worst was 53%
Compared to all devices tested
» 1% of all tested devices were better, 0% similar, 99% worse
» The best had a delta of 4%, average was 23%, worst was 134%
Apple MacBook Pro 16 2021 M1 Pro audio analysis
(+) | speakers can play relatively loud (84.7 dB)
Bass 100 - 315 Hz
(+) | good bass - only 3.8% away from median
(+) | bass is linear (5.2% delta to prev. frequency)
Mids 400 - 2000 Hz
(+) | balanced mids - only 1.3% away from median
(+) | mids are linear (2.1% delta to prev. frequency)
Highs 2 - 16 kHz
(+) | balanced highs - only 1.9% away from median
(+) | highs are linear (2.7% delta to prev. frequency)
Overall 100 - 16.000 Hz
(+) | overall sound is linear (4.6% difference to median)
Compared to same class
» 0% of all tested devices in this class were better, 0% similar, 100% worse
» The best had a delta of 5%, average was 17%, worst was 45%
Compared to all devices tested
» 0% of all tested devices were better, 0% similar, 100% worse
» The best had a delta of 4%, average was 23%, worst was 134%
能源管理
消耗功率
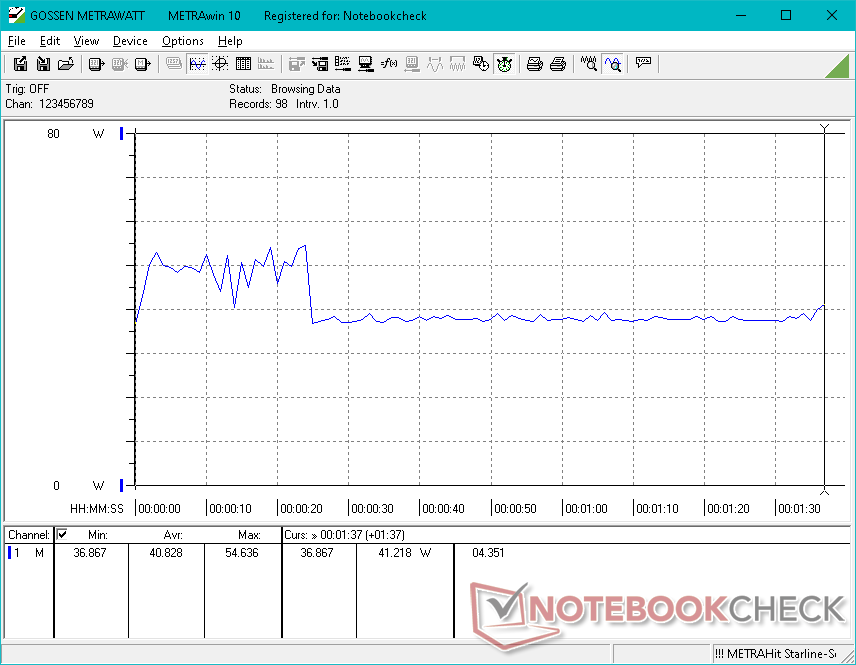
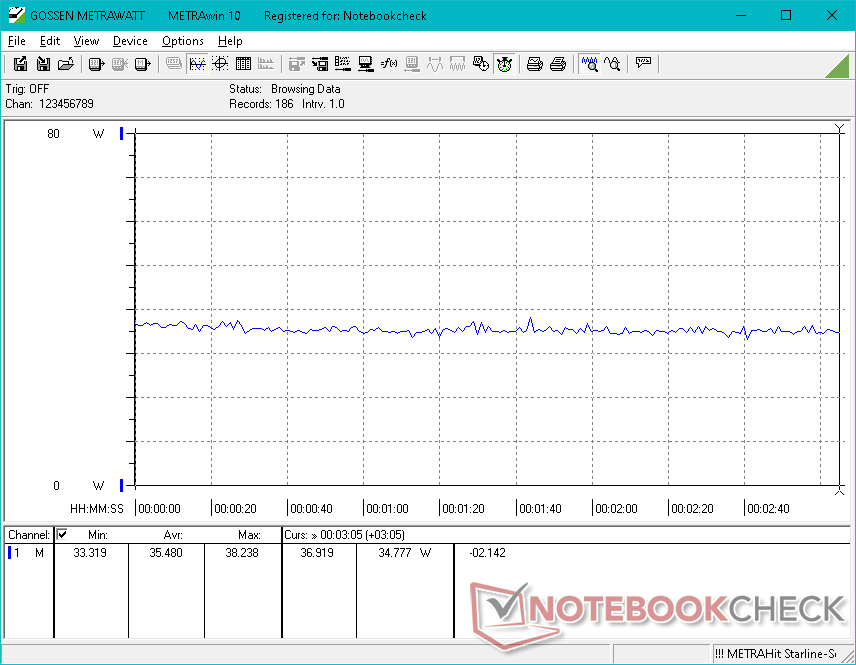
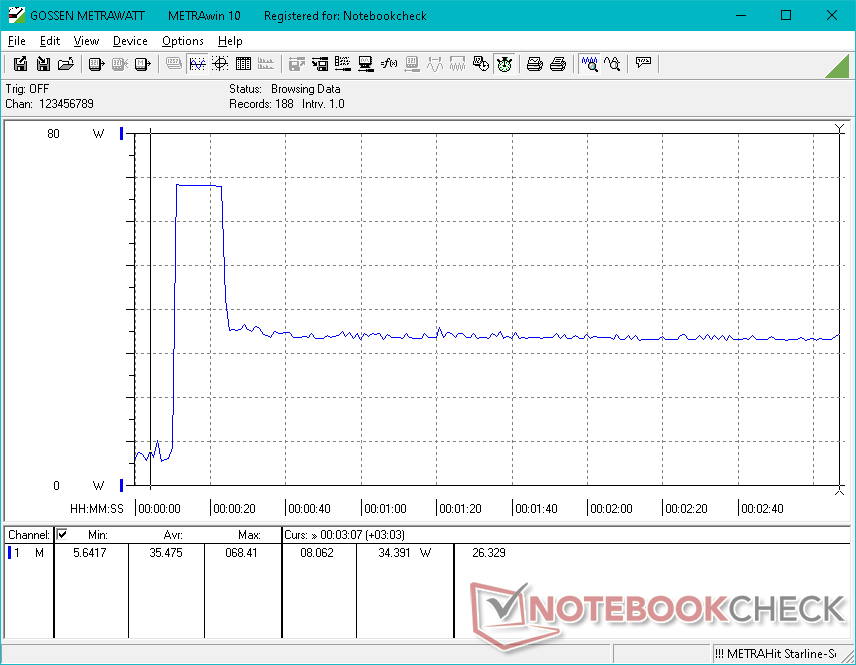
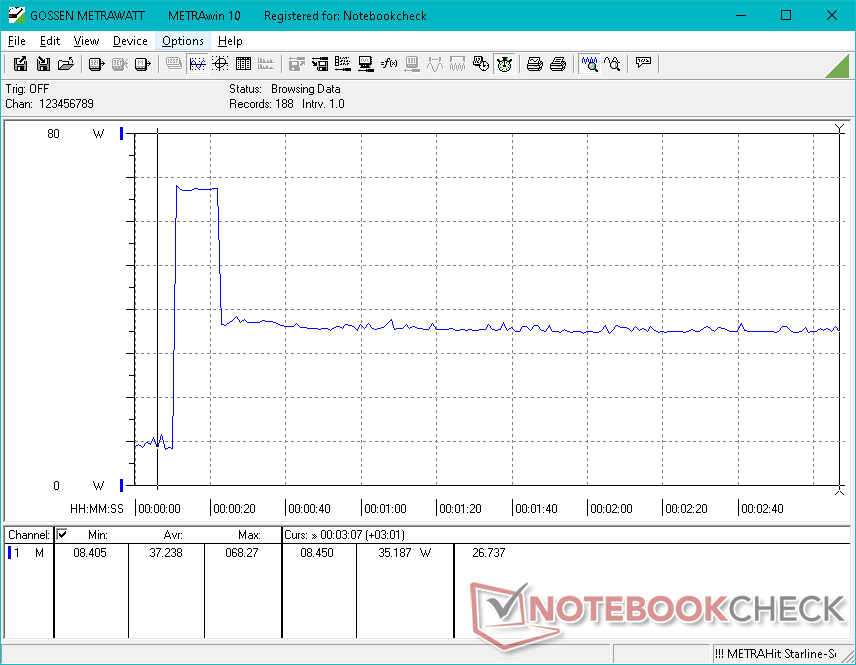
在运行网页浏览或视频流等要求不高的负载时,耗电量与配备相同CPU的戴尔Latitude 7330几乎相同。然而,在运行CPU密集型任务时,戴尔的系统要求更高,因为它能够比惠普的系统维持更高的时钟速率和TDP水平更久。总体消耗量与惠普的系统没有什么不同。 幽灵x360 14尽管多线程性能提高了15%至30%,但总体消耗与运行在上一代酷睿i7-1165G7上的Spectre x360 14没有什么不同。
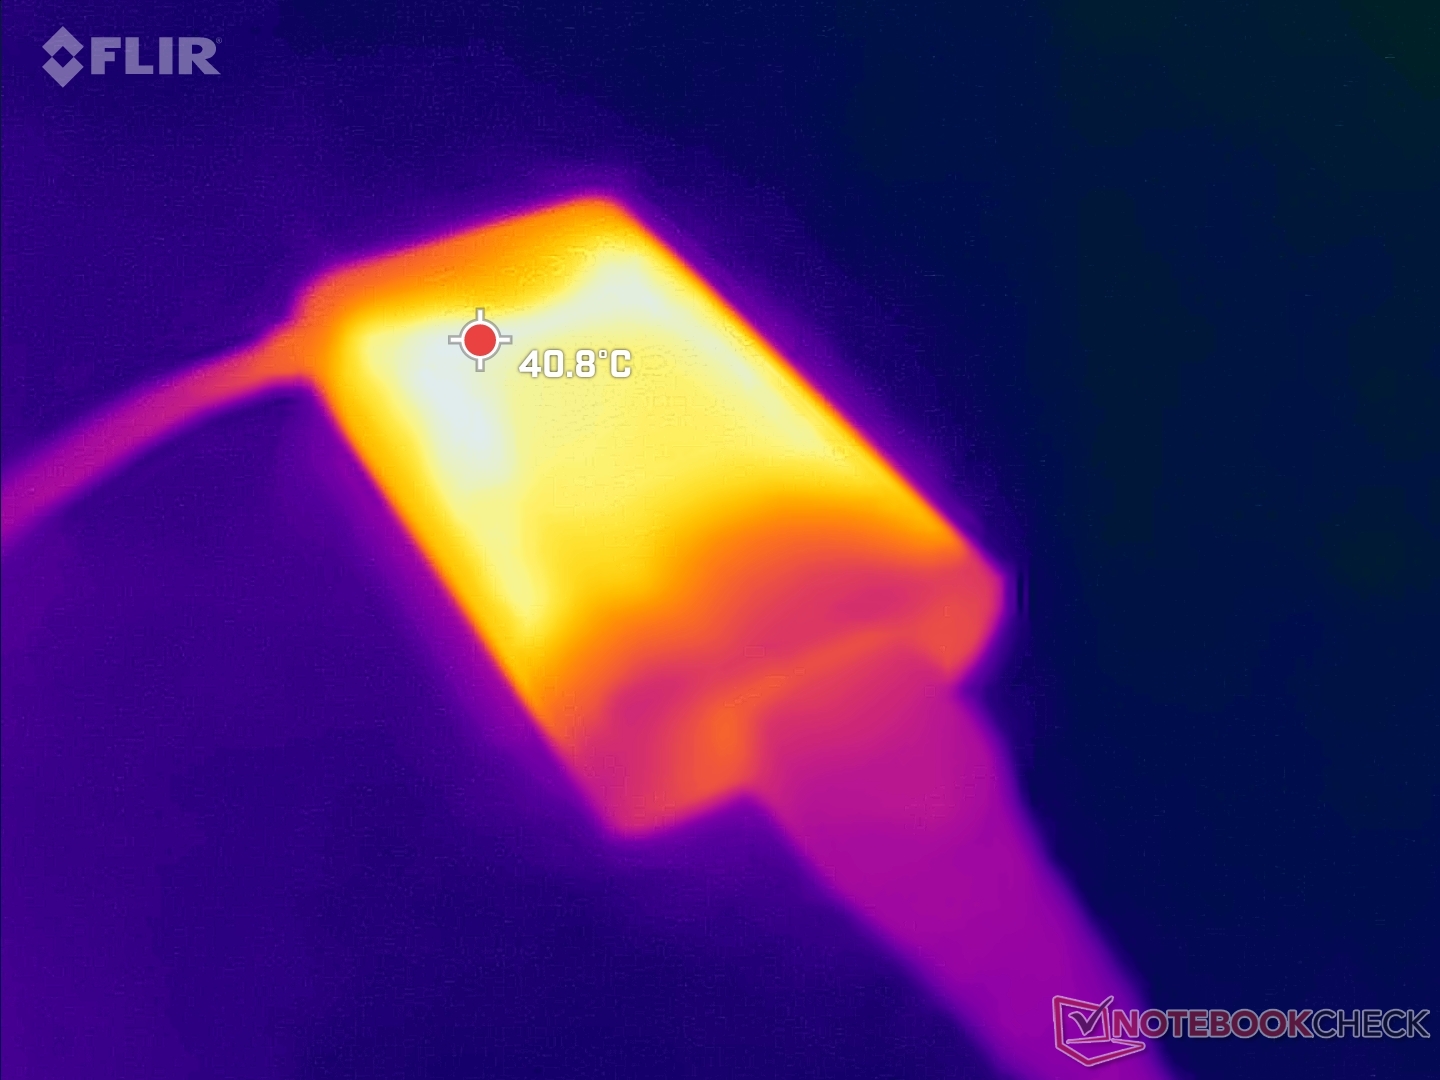
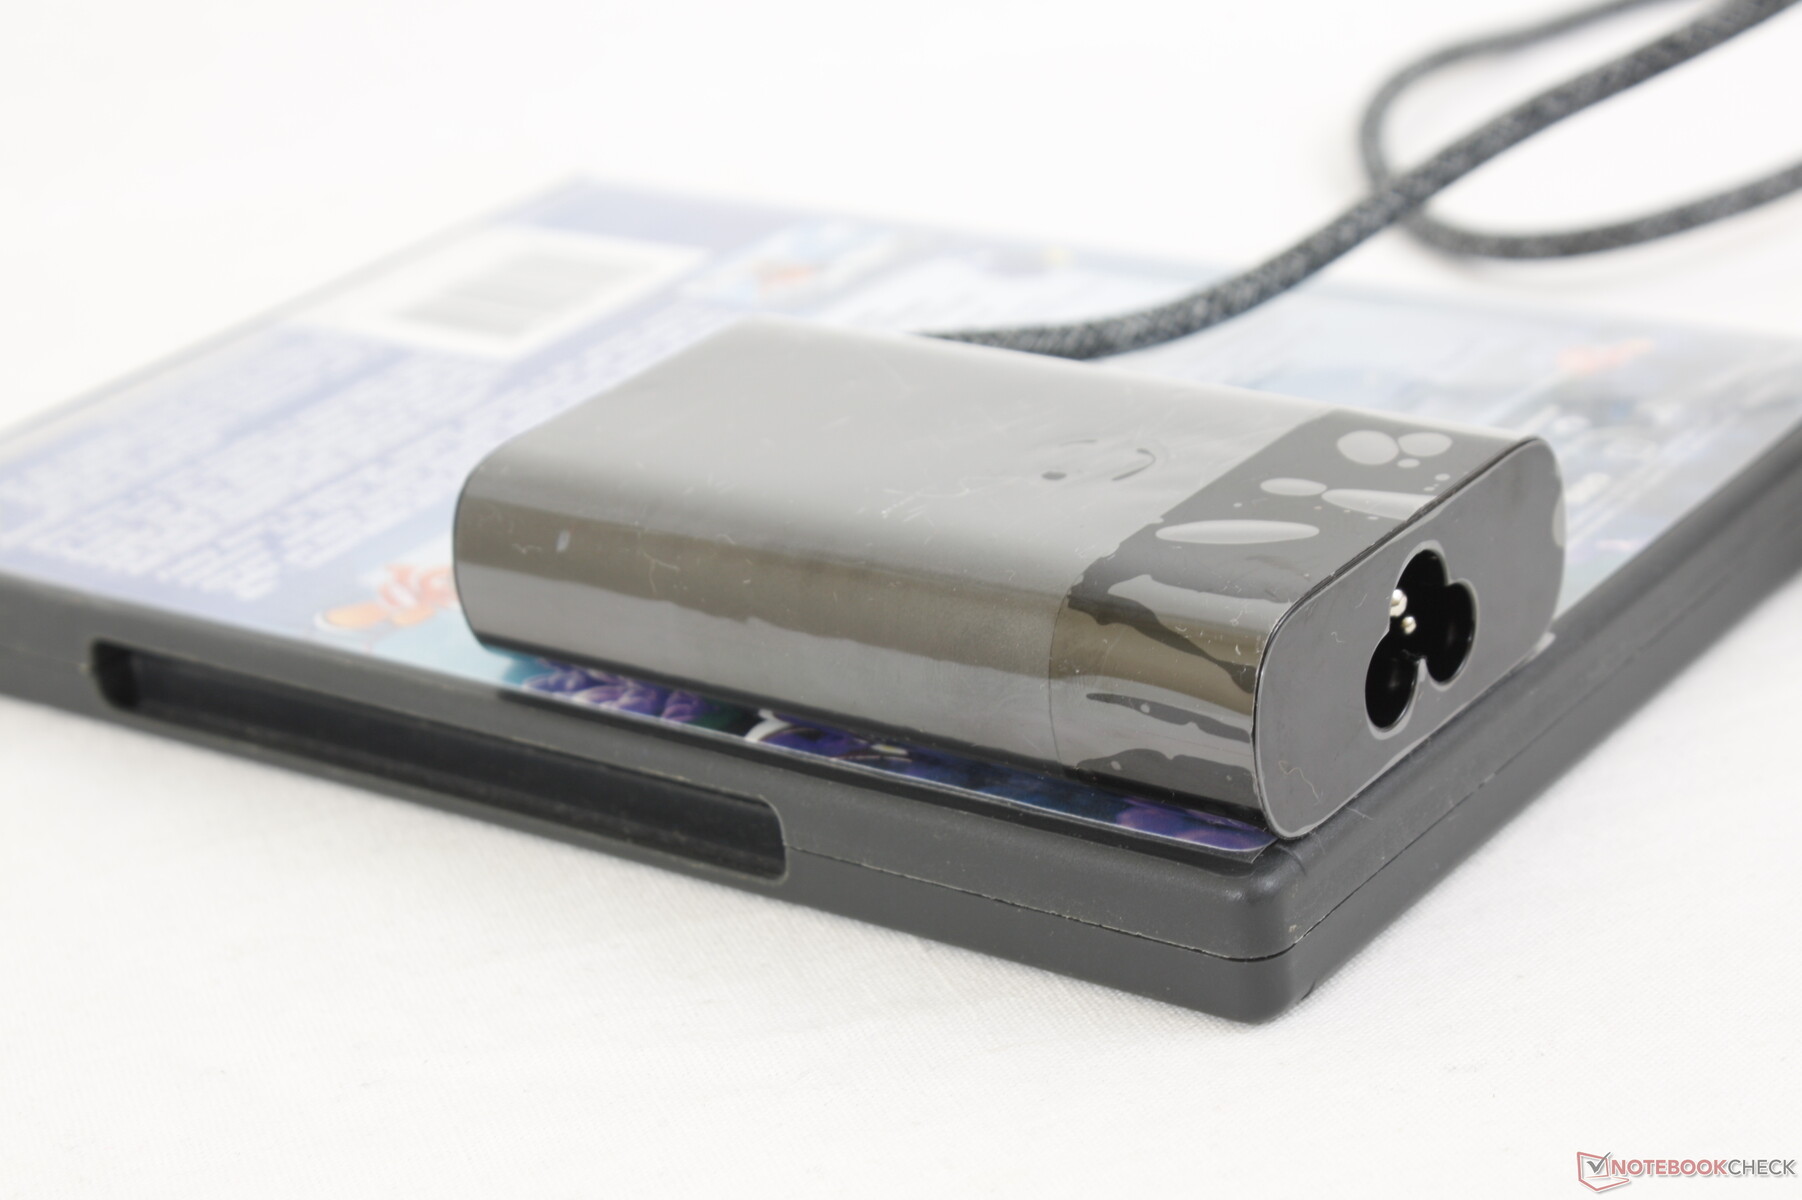
当CPU处于100%的利用率时,我们能够从小型(约8.8 x 5.3 x 2.1厘米)的65瓦交流适配器中记录到68.4瓦的临时最大功耗。散热限制使CPU无法在其最高的Turbo Boost时钟速率下长时间运行。
| Off / Standby | |
| Idle | |
| Load |
|
Key:
min: | |
| HP Elite Dragonfly G3 i7-1265U, Iris Xe G7 96EUs, Micron 3400 MTFDKBA512TFH 512GB, IPS, 1920x1280, 13.5" | HP Spectre x360 14t-ea000 i7-1165G7, Iris Xe G7 96EUs, Samsung SSD PM981a MZVLB512HBJQ, IPS, 1920x1280, 13.5" | Dell XPS 13 Plus 9320 i5-1240p i5-1240P, Iris Xe G7 80EUs, Micron 3400 MTFDKBA512TFH 512GB, IPS, 1920x1200, 13.4" | Framework Laptop 13.5 12th Gen Intel i7-1260P, Iris Xe G7 96EUs, WDC PC SN730 SDBPNTY-512G, IPS, 2256x1504, 13.5" | HP EliteBook Folio 13.5-3G2L2EA SD 8cx Gen 2 5G, Adreno 680, Toshiba XG6 KXG60ZNV512G, IPS, 1920x1280, 13.5" | Lenovo ThinkPad X1 Titanium Yoga G1 20QA001RGE i7-1160G7, Iris Xe G7 96EUs, Toshiba BG4 KBG40ZNT512G, IPS, 2256x1504, 13.5" | |
|---|---|---|---|---|---|---|
| Power Consumption | 9% | -70% | -34% | 46% | 0% | |
| Idle Minimum * (Watt) | 3.4 | 3 12% | 10 -194% | 5.3 -56% | 2.3 32% | 3.9 -15% |
| Idle Average * (Watt) | 5.6 | 5.1 9% | 12.3 -120% | 8.4 -50% | 3.7 34% | 7.3 -30% |
| Idle Maximum * (Watt) | 8.4 | 6.4 24% | 15.5 -85% | 11.2 -33% | 5.6 33% | 10.3 -23% |
| Load Average * (Watt) | 40.8 | 39.6 3% | 43 -5% | 57.4 -41% | 13 68% | 30.6 25% |
| Witcher 3 ultra * (Watt) | 35.5 | 39.6 -12% | 43.1 -21% | 46.7 -32% | 25.5 28% | |
| Load Maximum * (Watt) | 68.4 | 56.2 18% | 62.8 8% | 61.2 11% | 25 63% | 57.1 17% |
* ... smaller is better
Power Consumption Witcher 3 / Stresstest
Power Consumption external Monitor
电池寿命 - 长时间运行
电池容量从Dragonfly Max的56Wh增加到Dragonfly G3的68Wh。然而,WLAN的运行时间只是稍微长了一点,几乎是12小时。
从空电到满电大约需要90分钟。USB-C交流适配器也可用于为其他USB-C设备快速充电,包括智能手机和平板电脑。
| HP Elite Dragonfly G3 i7-1265U, Iris Xe G7 96EUs, 68 Wh | HP Spectre x360 14t-ea000 i7-1165G7, Iris Xe G7 96EUs, 66 Wh | Dell XPS 13 Plus 9320 i5-1240p i5-1240P, Iris Xe G7 80EUs, 55 Wh | Framework Laptop 13.5 12th Gen Intel i7-1260P, Iris Xe G7 96EUs, 55 Wh | HP EliteBook Folio 13.5-3G2L2EA SD 8cx Gen 2 5G, Adreno 680, 46 Wh | Lenovo ThinkPad X1 Titanium Yoga G1 20QA001RGE i7-1160G7, Iris Xe G7 96EUs, 44.5 Wh | |
|---|---|---|---|---|---|---|
| Battery runtime | -12% | -43% | -36% | 22% | -38% | |
| Reader / Idle (h) | 37.8 | 36.4 -4% | ||||
| WiFi v1.3 (h) | 11.8 | 11.8 0% | 8 -32% | 7.5 -36% | 14.6 24% | 8.4 -29% |
| Load (h) | 3.5 | 2.4 -31% | 1.6 -54% | 4.2 20% | 1.9 -46% | |
| H.264 (h) | 11.4 |
Pros
Cons
结论--功能、特性和外观的最大化
蜻蜓G3解决了我们对蜻蜓G2最大的抱怨之一。 蜻蜓G2蜻蜓G3解决了我们对蜻蜓G2最大的不满,它使该系列摆脱了16:9的形式因素,转向3:2的长宽比。16:9对基于消费者的笔记本电脑和大多数视频播放来说效果很好,但3:2或16:10通常更适合办公用户和专业人士的目标受众。
除了视觉上的大修,网络摄像头尤其值得称赞,因为它是我们在任何笔记本电脑上看到的最好的摄像头之一。对智能手机用户来说,500万像素可能听起来微不足道,但这实际上是现在大多数其他笔记本电脑上网络摄像头分辨率的5倍(!)。如果你重视视频质量,并进行大量的视频会议,那么就不要再看蜻蜓G3了。其他亮点包括更安静的风扇,非常大的点击板,快速的固态硬盘性能,没有性能节流,以及在其尺寸级别中出色的音频质量。
蜻蜓G3看起来很棒,使用起来感觉更好。然而,由于惠普的TDP目标相对较低,CPU性能猎手可能想在其他地方寻找。
蜻蜓G3上面的大星号与它的处理器性能有关。当竞争者 戴尔Latitude 9430二合一 ,能够运行完全相同的Core i7-1265U CPU,快了50%,那么这时你就知道你没有从惠普的模型中得到12代英特尔的全部好处。风扇的噪音肯定更小,但如果这意味着需要更快的性能,我们更希望有一个选项,允许更大声的风扇。
对于明年的机型,我们很希望看到Sure View能从1000尼特面板选项中分离出来。截至目前,如果配置一个或另一个,你将不得不接受它们作为一对。此外,更高的显示刷新率选项,如华硕ZenBook系列上的那些,将改善用户体验。更坚硬的盖子和更长的36个月基本保修期将分别对提高坚固性和寿命有很大的帮助。
价格和可用性
惠普Elite Dragonfly G3还没有在亚马逊、百思买或其他主要零售店广泛销售。我们建议直接从惠普购买https://www.hp.com/us-en/shop/pdp/hp-elitebook-dragonfly-g3-notebook-pc-customizable-4j032av-mb#techSpecs以获得最多配置选项。基本配置起价为1999美元,而我们的具体配置售价略低于2700美元。
HP Elite Dragonfly G3
- 08/28/2022 v7 (old)
Allen Ngo
Price comparison

